Article

Optimization of the Wastewater Treatment Process Using Kinetic Equations for Nitrification Processes

by
Eugen Marin
and
Carmen Otilia Rusănescu
*
Department of Biotechnical Systems, Faculty of Biotechnical Systems Engineering, Polytechnic University of Bucharest, Splaiul Independentei 313, 060042 Bucharest, Romania
*
Author to whom correspondence should be addressed.
Water 2025, 17(16), 2440; https://doi.org/10.3390/w17162440
Submission received: 30 June 2025 / Revised: 10 August 2025 / Accepted: 14 August 2025 / Published: 18 August 2025
(This article belongs to the Special Issue Advanced Research on Anaerobic Wastewater Treatment)

Abstract

The primary objective of the present study is to evaluate the effect of conglomerate microorganisms on nitrification in activated sludge. The present study compares this process with activated-sludge technology to explore the variables that influence the complex biochemical processes taking place in bioreactors. The research under consideration involves monitoring the effectiveness of optimizing the wastewater treatment process using kinetic modeling for the nitrification and denitrification processes. The system is designed to simulate various operating scenarios and adjust process parameters in real time. The nitrification rate demonstrates a 99.03% performance, while the denitrification rate ranges from 19.08% to 91.01%. A substantial correlation has been demonstrated between this variable and the temperature of the treated wastewater. This provides the possibility of accurately assessing the ammonium oxidation potential. Furthermore, kinetic equations facilitate the estimation of parameters that are not typically measured, yet are essential for optimizing operational parameters (e.g., dissolved oxygen levels in the aeration tank, sludge dosage, and influent flow rate). This estimation is crucial for enhancing the effectiveness of the process and attaining the desired or anticipated outcomes. This validation underscores the efficacy of the technology, thereby establishing a foundational framework for subsequent research endeavors. These research efforts are directed towards providing decision-makers and stakeholders with actionable insights. The validation underscores the significance of optimized practices in the context of water resource protection. Moreover, it signifies a substantial advancement in the instrumentation of wastewater treatment plants.

1. Introduction

The present research endeavors to enhance the nitrification process in activated sludge comprising conglomerated microorganisms at the Alexandria Municipality wastewater treatment facility. A rigorous mathematical approach was employed to determine the nitrification efficiency of the activated-sludge system. This approach entailed the utilization of a kinetic model in conjunction with equilibrium mass balance, a methodical process that enabled the accurate calculation of relevant parameters [1,2]. The enhanced nitrification/denitrification biological treatment process for municipal wastewater is characterized by its autonomy from external infusion. It has been observed that this phenomenon is characterized by the presence of conglomerated biofilm flocs, which appear to serve the purpose of augmenting the concentration of microorganisms. This augmentation is thought to be facilitated by the introduction of an internal carbon source into the intracochlear space. The phenomenon under investigation is attributed to the lysis and hydrolysis of microbial cells within the bacterial cavity. With the support of the flocs, these microorganisms form an anaerobic environment [3,4].
Conventional activated-sludge methodologies have been predominantly employed for the treatment of urban and municipal wastewater until this point. It has become essential to optimize existing wastewater treatment plants with innovative technologies for nitrification/denitrification processes involving floc conglomerations of microorganisms in activated sludge to ensure the safety of human health and the environment. Improperly treated wastewater can cause water pollution, affecting ecosystems and resources [5,6,7]. By implementing solutions to optimize the treatment process, contamination of drinking water sources can be prevented, and water resources can be conserved [8,9]. Optimization of the wastewater treatment process also helps to reduce the negative impact on biodiversity, ensuring a healthier environment for all life forms. Thus, a sustainable approach to wastewater treatment not only protects the environment but also supports the development of a healthy ecosystem [10,11,12,13].
The developed/studied model has the capacity to serve as a substitute for knowledge of the hydraulic residence time, substrate concentration in the influent layer, thickness of the stationary liquid layer, minimum substrate concentration necessary for biofilm growth, and kinetic constants. This allows for calculation of substrate and biomass concentrations in the effluent layer [14,15,16]. Once the biomass concentration is estimated, other values such as the feed/biomass ratio and sludge mass loss can be derived. In addition, the proportion of active biofilm to total biomass can be determined, as well as the percentage of substrate used by any culture [17,18,19]. The main novelty of this research lies in the use of kinetic equations to facilitate the estimation of parameters that are not routinely measured but are essential for optimizing operational parameters (e.g., dissolved oxygen level, sludge dosage in aeration tanks, and influent flow rate). This estimation is crucial for increasing the efficiency of the nitrification/denitrification process and achieving the desired or anticipated results. The estimation of these parameters is performed in real time, based on a dynamic model that accounts for the behavior of microorganisms within conglomerated flocs. Unlike ASMs (activated-sludge models), which rely on fixed parameter sets and standardized assumptions, our model introduces an adaptive component that enables the optimization of biological processes according to operational conditions and environmental factors (e.g., temperature).
Moreover, our study highlights the specific role of conglomerated microbial flocs, which significantly contribute to the efficiency of nitrification and denitrification processes by generating an internal carbon source. This aspect is rarely addressed explicitly in traditional ASMs (activated-sludge models). The ASM1/2/3 models have provided a solid foundation for understanding biological processes in wastewater treatment plants, but they are limited by their static nature and reliance on simplifying assumptions. The model proposed in this study does not aim to replace the ASMs, but rather, to complement them with a dynamic, real-time applicable approach that integrates biological particularities observed in conglomerated microbial flocs, enables the optimization of operational parameters without direct measurements, and responds more effectively to the real variability in wastewater treatment systems.

2. Materials and Methods

2.1. Description of the Wastewater Treatment Plant Under Study and Monitored Parameters

Wastewater reaching the treatment plant through collectors is composed of both domestic wastewater and industrial water. In the case of separate sewage networks, it may also include rainwater, depending on the type of network. When there is a single system of collectors that transports all types of water generated by the population, it is called a combined sewage network [20,21,22].
Eliminating the negative effects on the environment is an important goal in wastewater treatment. One important tool for achieving this goal is wastewater analysis [23]. Wastewater treatment plants are usually located on the outskirts of populated centers. They are sets of installations whose main function is to reduce pollutants in domestic wastewater to acceptable limits for discharge into the aquatic environment [24,25]. The primary function of the municipal wastewater treatment plant is to reduce the physical, chemical, bacteriological, and biological characteristics of pollutants in wastewater, ensuring that they meet quality standards for discharge into the outfall.
The following conventional water quality parameters are analyzed and monitored in the wastewater treatment process: fecal coliform bacteria, total organic carbon (TOC), total nitrogen, chemical oxygen demand (COD), phosphorus, biochemical oxygen demand (BOD), and total dissolved solids (TDS). The degree of purification of each parameter depends on the purification technology used. Through the mechanical and biological purification stage, BOD is reduced by 90–95% and TDS by 90–95%, and fecal coliform bacteria are removed with high efficiency (92–99.9%), but removal of phosphorus is 10–20%, total nitrogen is 15–25%, and that of heavy metals is 24–82% [26,27].
Wastewater treatment processes are organized into distinct operational lines depending on the size of the pollutants to be treated. There are usually two main operational lines: the water line, which focuses on wastewater treatment, and the sludge line, which focuses on managing the solids (sludge) generated during treatment [28,29,30]. The present study was conducted on a medium-sized treatment plant that serves an area with a population of approximately 75,000 PE (person equivalent). Figure 1 is a schematic of the studied wastewater treatment plant, showing how municipal wastewater is processed, starting from the moment the raw wastewater enters the plant through the gravity collector, to the discharge point (outfall), where the treated effluent is discharged into the aquatic environment. The water treatment process consists primarily of pretreatment and secondary treatment stages, which include anoxic and aerobic phases.

2.2. Description of the Operational Flow of the Wastewater Treatment Plant Under Study

The raw wastewater is conveyed to the treatment facility via the gravity collector. This stage entails preliminary treatment, which involves the retention of floating objects and the removal of both large and small particles through screening (sieving). Additionally, this stage includes the removal of fats and oils through the fat removal system (grease separator). Following the preliminary treatment of the primary objects, the water continues in its technological progression, undergoing a secondary treatment phase that entails the extraction of residual dissolved and suspended organic matter. This takes place in the area of the aeration basins. The procedure implemented at the treatment plant under study involves activated-sludge technology and prolonged aeration [31,32,33]. At this stage, the treatment procedure in the technological flow involves combining the anoxic phase, in which the blowers are stopped so as not to supply oxygen to the system (favoring the elimination of nitrates), with an aerobic phase in which the blowers are in operation to supply the necessary oxygen to the aerobic microorganisms responsible for the decomposition of organic matter [34,35,36].
At this stage, the analyzed facility carries out biological treatments to reduce the chemical (mineral and organic) and bacteriological impurities contained in the wastewater below certain limits. This ensures that the wastewater does not harm the aquatic environment into which it is discharged nor endanger the users of the water [37,38]. It should be noted that municipal wastewater treatment processes are largely similar to those that occur during surface water self-purification, except that they are coordinated by specialized personnel, monitored by automatic systems, and carried out in modern facilities at a much higher speed. The installations/set of installations for wastewater treatment are designed to intensify and favor the processes whose main function is to reduce waste to acceptable limits, allowing discharge into a body of water (Vedea River outfall) [39,40]. During the wastewater treatment process, part of the sludge generated from the bottom of the secondary settling tanks (secondary sludge) of the wastewater treatment plant is collected through the scraper bridge mixing procedure and transmitted to be recirculated in the biological reactors and become part of the bioconcentrate (active biomass) [41,42,43]. At the same time, the excess sludge is pumped through pipes to the sludge line for treatment (dewatering procedure). To facilitate further handling and processing, the sludge is subjected to a gravity thickening process by centrifugation, in which the solids concentration is increased. After the dehydration procedure is completed, laboratory samples are taken from the sludge, which is temporarily stored in a sludge depot within the treatment plant until final transfer for various uses, such as agricultural fertilizer (only during certain periods of the year) or to the incinerator if heavy metal contents are exceeded [44,45,46].

2.3. Description of the Nitrification/Denitrification Processes of the Wastewater Treatment Plant Under Study

The main concern should be to improve the aeration processes, as these processes play a significant role in the energy consumption of these plants. By using advanced technology, such as oxygen transfer aeration systems, plants can ensure that oxygen is supplied more efficiently, which in turn will reduce the energy needs associated with the treatment processes [47,48,49].
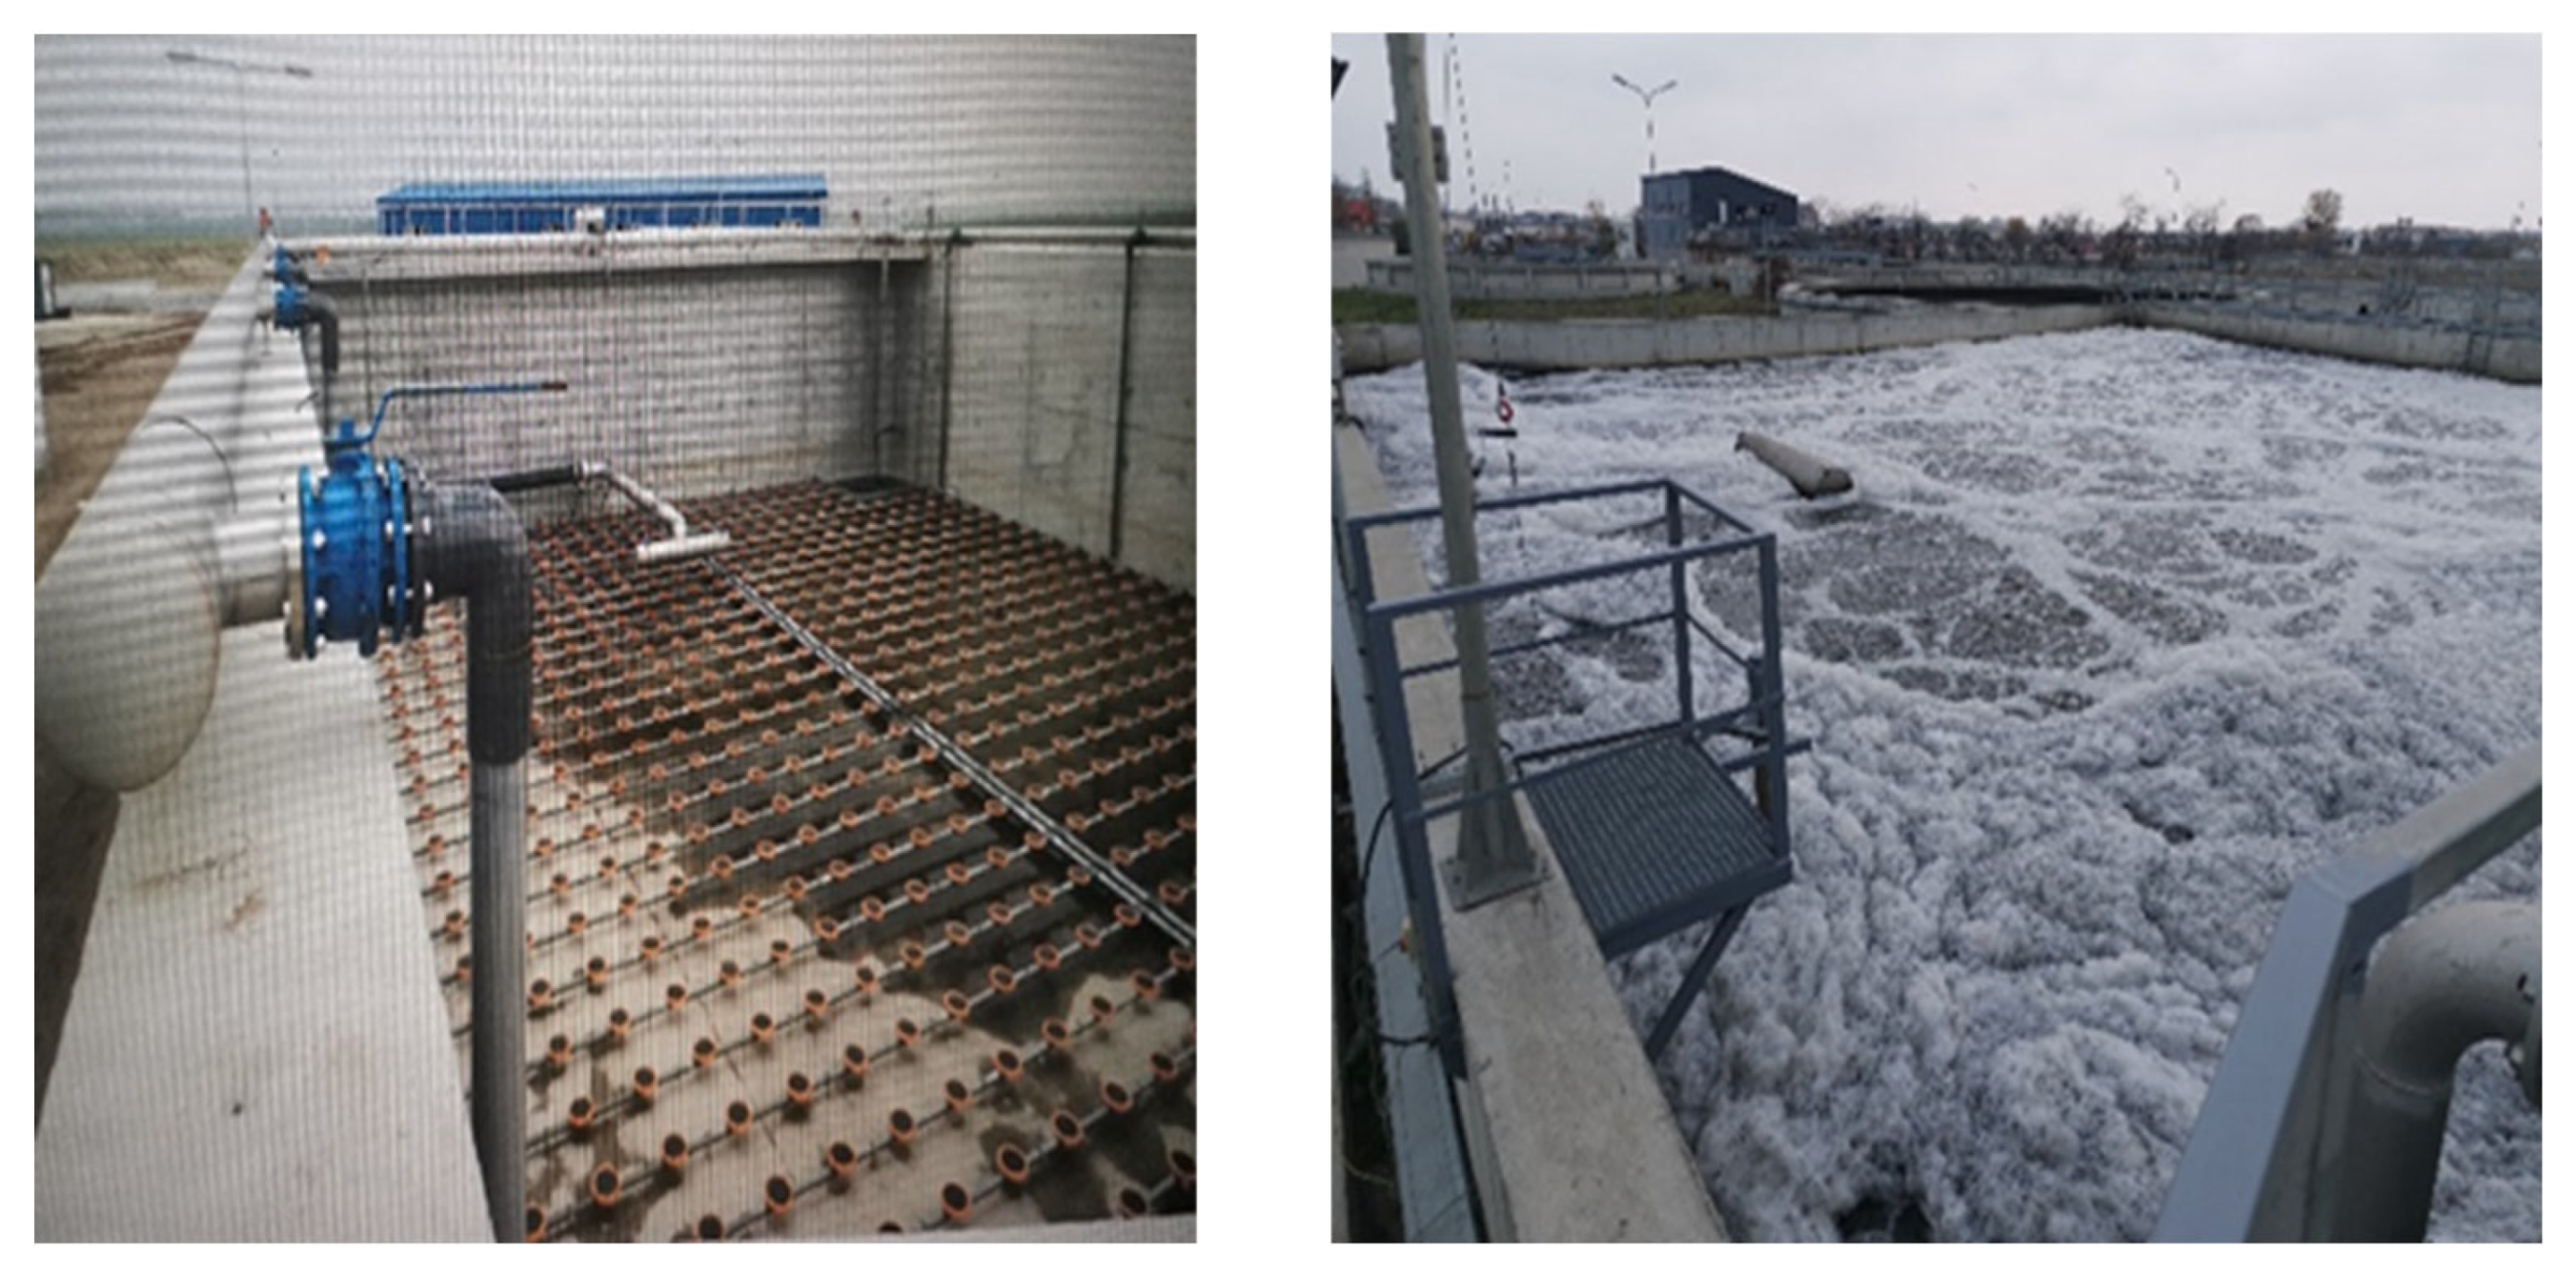
The technological process involving the biological film occurs through the intense stripping of air produced by the blower. The air is moved through a series of pipes to a static bed, which is then used as a submerged biofilter compartment in the treatment apparatus. This part is made up of well-organized polymer structures with a fairly developed surface, as shown in Figure 2.
The special shapes of the polymer help the biological film (active biomass) to form and grow, which makes it easier for the body to break down organic substances and the nitrification process. The diffusion of the substance dictates the location of the nitrate reduction process, which occurs within the internal layer in the presence of oxygen deficiency. The filter block is equipped with a discrete, intensive air aeration system. This system is employed to dislodge the developed biological film (active biomass) [50,51,52].
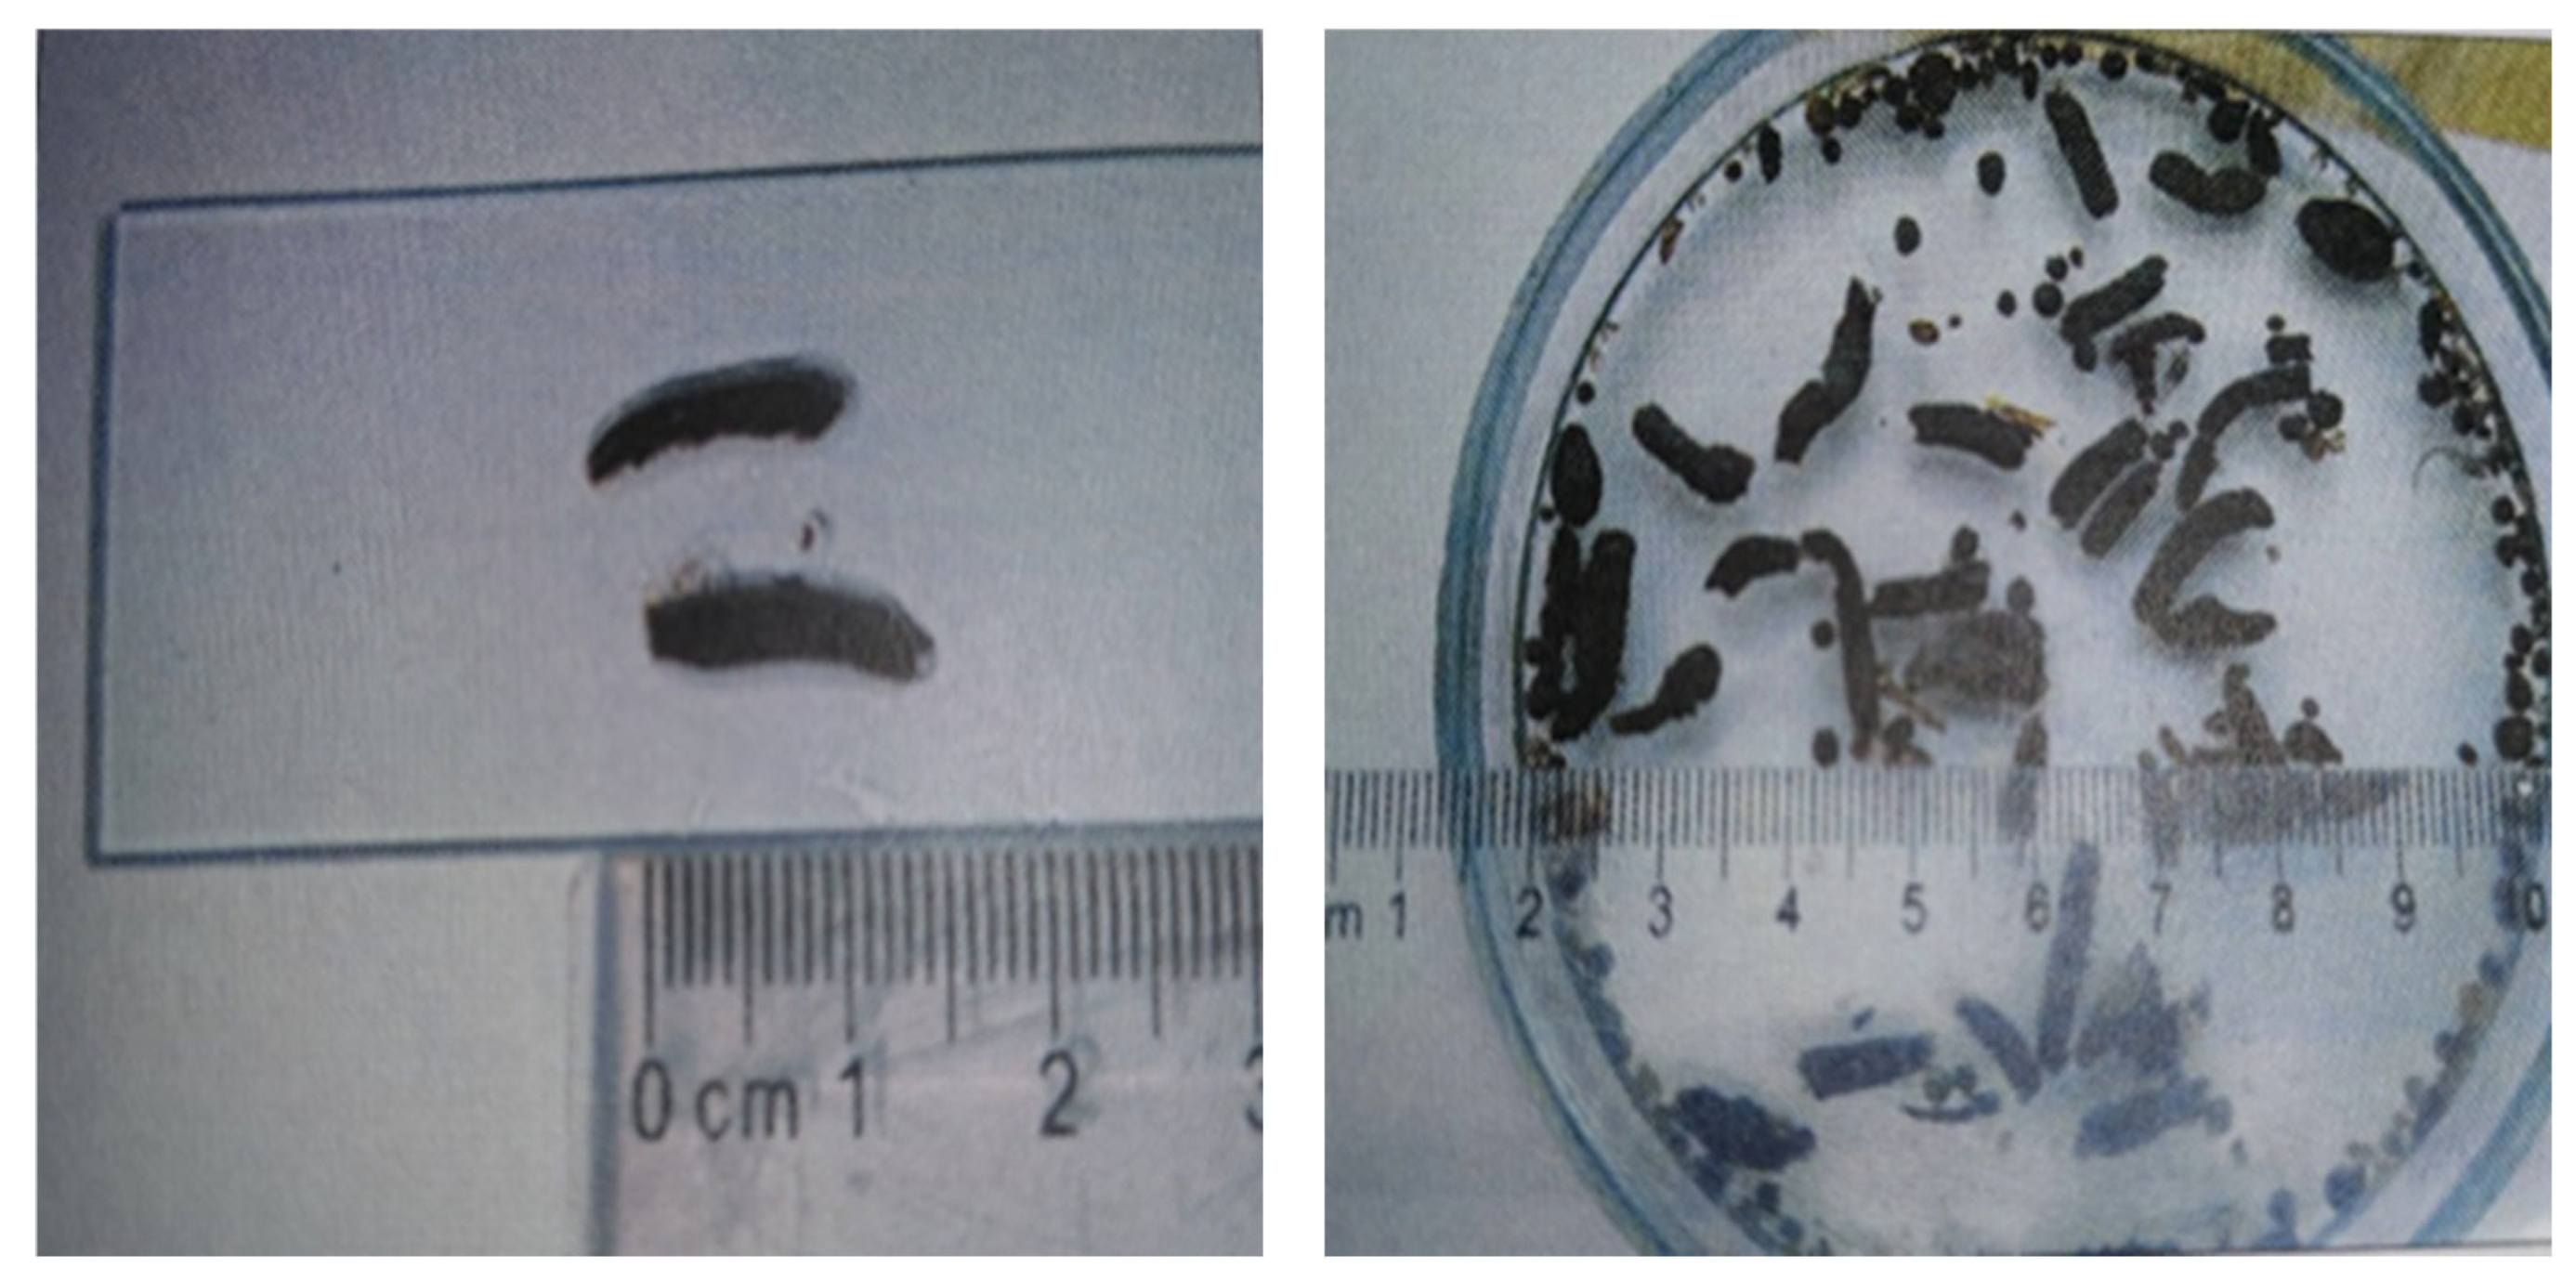
The slow, noisy movement of the water in the fine bubble area after it has been aerated causes the biological film to separate from the surface. This process leads to the formation of conglomerate flocs of microflora, as illustrated in Figure 3 [53,54].
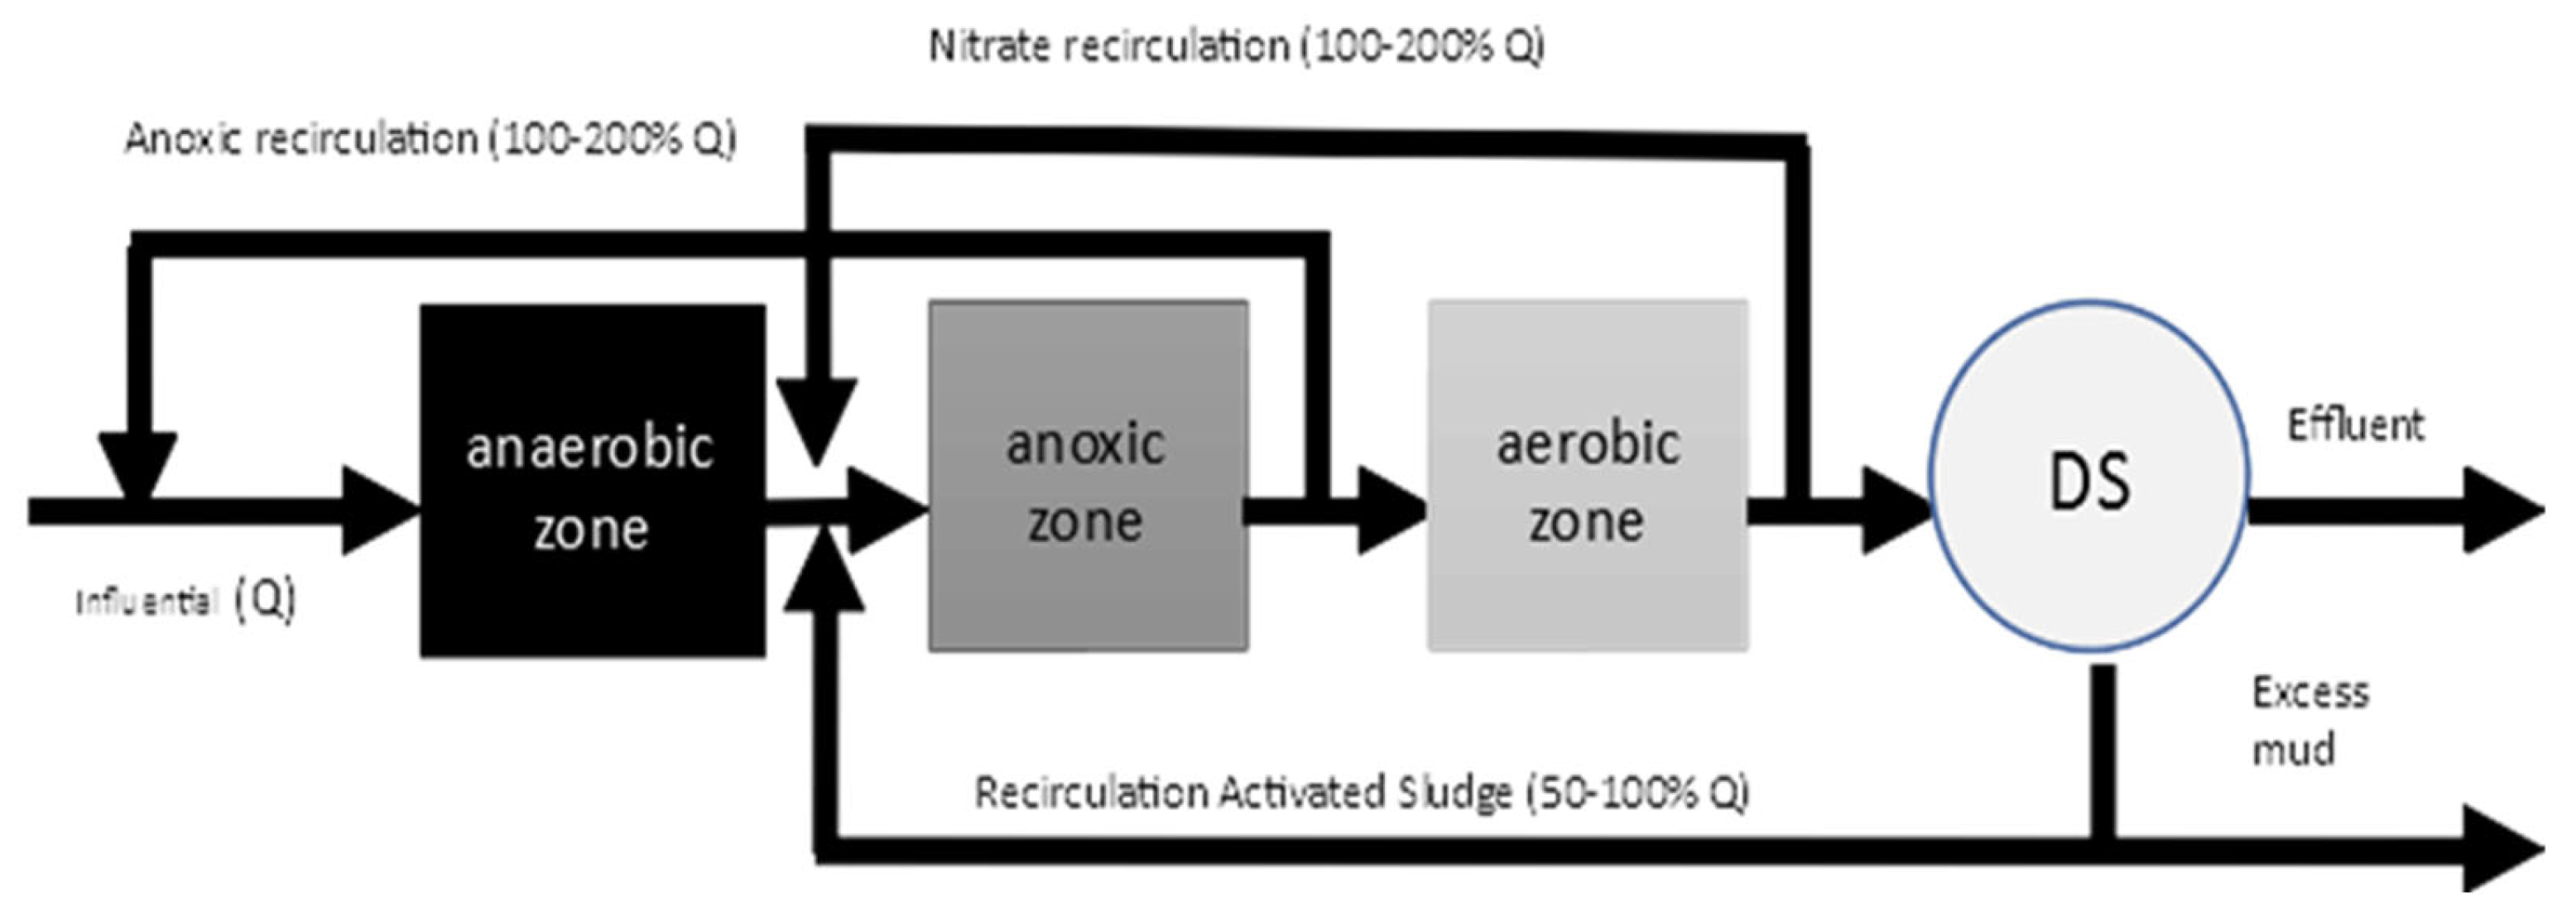
According to the technological flow presented in Figure 4, conglomerated flocs of microorganisms are recirculated upstream of the secondary decanter through recirculation pumps and are subjected to the oxidation process, thereby decreasing dependence on the purification-processing fraction [55,56,57]. The dimensions of the developed and captured flocs range from 1.9 to 15.8 mm in length and from 1.3 to 2.6 mm in diameter. The density of the conglomerates of microorganisms is up to 55 to 57 g/L. Consequently, the concentration of activated sludge in the effluent is approximately 18 to 20 times higher. This proportionally increases the potential for eliminating organic and biogenic substances from treated water [58,59,60].
The process of treating municipal wastewater with simultaneous nitrification/denitrification involves conglomerate flocs of active biomass or biological film. This new process increases the concentration of microorganisms by using an internal carbon source from the intracellular space, so external carbon does not need to be added. When intracellular microorganisms are broken down, flocs form, creating an anaerobic environment [61,62].
One significant benefit of flocs of microorganisms is their ability to form oxic, anoxic, and anaerobic zones due to their substantial size [63]. Furthermore, fermentation and cell lysis, which are examples of anaerobic processes, take place in these central zones due to the absence of oxygen and nitrates. These processes break down complex organic materials into simpler compounds. These simpler compounds can then be used by other microorganisms found in the upper layers. This makes it easier to remove organic and biogenic compounds from wastewater [64,65,66]. Using external carbon sources increases the amount of waste generated during biological treatment and decreases the purification of organic and biogenic substances [67,68].

2.4. The Effectiveness of Wastewater Treatment Process Optimization Using Kinetic Modeling

However, to ensure optimal efficiency in removing organic and biogenic compounds from wastewater, we propose a novel and pragmatic approach for wastewater treatment plant operators in the Municipality of Alexandria. This approach involves a comparative analysis utilizing kinetic modeling and equilibrium mass balance calculations for nitrification processes in traditional treatment systems employing activated-sludge technology [69,70,71]. It has been demonstrated that this method leads to substantial enhancements in the administration and optimization of treatment processes. It can accurately estimate the ammonium oxidation potential that is unique to the treatment plant [72].
In other words, the calculations allow us to estimate the treatment potential for the analyzed plant. In addition, the kinetic equation derived below (4) indicates the parameters that are usually not measured, but which should be additionally determined to adjust the operational parameters (dissolved oxygen in the aeration tank, sludge dose and influent flow rate) in order to intensify the process and achieve the desired or planned results. This equation enables the simulation of various operating scenarios and the adjustment of process parameters to optimize the efficiency of pollutant removal. Simulations facilitate the rapid testing of numerous operating scenarios, without physical interventions in the process, and are thus extremely useful for identifying optimal operating conditions, such as the ideal dissolved oxygen concentration, sludge dose or recirculation speed. Kinetic modeling allows for real-time adjustments, adapting the process to unforeseen changes in operating conditions, such as seasonal variations in the influent composition. The equation below was used to calculate the ammonium oxidation potential in the improved process at the Alexandria Municipality Wastewater Treatment Plant:
ρ N H 4 , s = 1 Y H N 4 , m a x µ N H 4,20 , maxe x 1 t 20   . S N H 4 K s , N H 4 , A 1 + S N H 4 S N O 2 K s , N 02 , A 2 + S N O 2 S O 2 K s , 02 , A 2 + S O 2 K p H K p H 1 + 10 pH , opt pHi 1 β · X B a   .
where
ρ N H 4 , s represents the oxidation potential of ammonium in the optimized technological flow;
Y H N 4 , m a x is an indicator of the rate at which biomass increases for ammonium-oxidizing bacteria;
µ N H 4 , 20 , m a x indicates the maximum specific growth rate. It has been determined that the substance in question is effective for ammonium-oxidizing bacteria;
S N H 4 shows the amount of N-NH4 in the water that has been treated at the plant;
K s , N H 4 , A 1 represents indicates the saturation constant. This constant is equivalent to the N-NH4 concentration. At this concentration, the specific velocity is reduced to half its maximum value in Aeration Tank 1;
S N O 2 indicates the level of nitrated nitrogen present within the aerated sections;
K s , NO 2 , A 2 is the saturation constant, which is the same as the NO2 concentration where the specific velocity is half of the max value in Aeration Tank 2;
S O 2 is the amount of dissolved oxygen present in the aerated sections;
K s , O 2 , A 2 represents the O2 saturation constant for autotrophic nitrifying bacteria, which is numerically equal to the value at which saturation is half the maximum value Aeration Tank 2;
K p H is the pH constant;
K p H 1 + 10 p H , o p t p H i 1 is the numerical value representing the saturation constant, which is equivalent to the concentration value + 10 p H , o p t p H i 1 ;
β represents the mortality rate of the autotrophic bacterial mass;
X B a   represents the active biomass.
We used this equation to determine the nitrification rate in suspended activated-sludge systems using the kinetic model (activated-sludge modeling) and the mass balance equation for water treatment systems with recycling:
Q i · S N H 4 , i ρ N H 4 , S · V = Q e · S N H 4 , e + Q e x · S N H 4 , e x
The following are the ammonium nitrogen (N-NH4) concentrations of the influent, effluent, and excess sludge, respectively: SNH4i, SNH4e, and SNH4ex. All three are measured in grams per cubic meter. Qi, Qe, and Qex are the influent, effluent, and excess sludge flow rates, respectively. All three are measured in cubic meters per day.
Considering that Q I · Q e , Q e x = 0   a n d   Q e x · S N H 4 , e x = 0 , the following is obtained:
Q i · S N H 4 , i ρ N H 4 , S · V = Q e · S N H 4 , e   o r   V Q i · ρ N H 4 , S = S N H 4 , i S N H 4 , e
V Q I is the “hydraulic reaction time,” which is a quantitative metric used to assess the efficiency of the aeration system S N H 4 , e .
The next equation is used to calculate how much oxygen is needed to break down ammonia in the ideal wastewater treatment process:
S N H 4 , i = V Q i · 1 Y H N 4 , max · µ N H 4 , 20 , maxe x 1 t 20 . S N H 4 , e K s , N H 4 , A + S N H 4 , e S O 2 K s , O 2 , A + S O 2 K pH K pH + 10 pH , opt pHi 1 β · X B a + S N H 4 , e
XBa, written as gCCOCr/g active biomass, is not something that wastewater treatment facilities monitor. Therefore, the equation used to estimate the ammonium oxidation potential was adapted so that operators can use it. This equation takes into account the constructed and physicochemical parameters that can be monitored during the operation of an activated-sludge treatment facility. Thus, the fraction of active biomass in activated sludge, δb = 0.65, was introduced, assuming that 0.28–0.3 represents mineral substances and 0.07–0.9 represents low-active biomass due to bacterial lysis.
The CCOCr calculation of active biomass considers the composition expressed by the formula C5H7NO2:
C 5 H 7 N O 2 + 5 O 2 + H + 5 C O 2 + 2 H 2 O + N H 4 +
From Formula (5), it follows that one mole of biomass, with a mass of 112 g, corresponds to 5 moles of oxygen, with a mass of 159 g. Thus, it is deduced that for each gram of active biomass the following are required: 159 g of CCOCr/112 g of biomass = 1.41 g CCOCr/g biomass. Therefore, 1.41 g CCOCr/g biomass · 0.65 = 0.92, which is numerically ≈ 1 g MLSS (Suspended solids with mixed liquids). This parameter, which is not monitored at treatment plants, is called Sludge Dose (expressed in gram units).

3. Results

3.1. Calculation of the Ammonium Oxidation Potential in the Optimized Technological Flow

We calculated estimated the ammonium oxidation potential in the optimized technological flow for each process and substrate using the stoichiometric coefficients and constants from Equation (4). The results are shown in Table 1 (activated-sludge modeling). The operating and operational parameters of the Alexandria City station were also used, according to Table 2.
We can see in Table 3 that the data are presented in tabular form. In order to arrive at the presented data, the stoichiometric constants and coefficients for the activated-sludge system in the nitrification process were replaced with the parameters specified in Table 1 and the operational parameters for the aforementioned station in Equation (4). The values used were Qi = 1900 m3/day, V = 1300 m3, MLSS (the concentration of suspended solids in the mixed liquor) = 1980 g/m3, and NH4+ = 1.98 g/m3.
The objective of the present study was to estimate the ammonium oxidation potential in the technologically optimized flow of the Alexandria Wastewater Treatment Plant (WWTP). The data presented in (Table 3) were employed for this estimation. According to the existing requirements, the data are calculated for an NH4+ concentration in the effluent of 1.98 mg/L.

3.2. Calculation of Simultaneous Nitrification Efficiency and Denitrification Efficiency Determined Using Kinetic Equations

These data show the maximum amount of ammonium nitrogen in wastewater that can be treated by the activated-sludge method alone. The goal of this study was to show that nitrification and denitrification can occur at the same time in wastewater in a single aerated flow, without needing to separate the oxygen-rich and oxygen-poor zones. To do this, we calculated how well each step performed at different temperatures using these formulas:
E f % N N H 4 = N N H 4 i n f N N H 4 e l f · 100 % / N N H 4 i n f
E f % N = ( N N H 4 i n f ( N N H 4 e l f + N N O 3 e l f + N N O 2 e l f ) · 100 % / N N H 4 i n f
where
N-NH4 inf is an indicator of the ammoniacal nitrogen concentration present in the influent, which is measured and represented here;
N-NH4 efl is the ammoniacal nitrogen in the effluent, which serves as a proxy for the concentration of this element in the water. The determination of this measurement is crucial for evaluating the quality of the effluent and for determining the necessary treatment processes;
N-NO3 efl is the nitrate nitrogen present in the effluent expressed as a concentration;
N-NO2 efl represents the concentration the effluent of nitrate nitrogen;
As shown in Table 4, denitrification rates range from 19.08% to 91.01%. This is closely related to the temperature of the wastewater that has been treated. Concomitantly, nitrification reaches a performance of up to 99.03%. Table 4 shows that when there are groups of microorganisms from activated sludge in the technological flow, it improves the denitrification process under constant aeration. This demonstrates that the biological film with flocs is functional.
The objective of this study was to demonstrate the nitrification efficiency of the activated-sludge system. To determine this, we used a kind of mathematics called “kinetic modeling” and kept track of the balance of matter. These calculations were based on a controlled environment with small aggregates of organisms called “glomerated microorganism flocs” in the activated sludge. The results were then compared with the efficiency of the system with only activated sludge. The comparative results of the experimental data are presented in Table 4, both for the enhanced nitrification process in the presence of conglomerate flocs and those calculated for the nitrification efficiency of the system with activated sludge only, based on the formulas below:
N N H 4 e x . = N N H 4 i n f N N H 4 e f l
N N H 4 c a l c . = N N H 4 i n f c a l c . N N H 4 e f l
N N H 4 = N N H 4   e x . N N H 4   c a l c .
where
N-NH4 inf calc. is the concentration calculated according to Formula (4) in the influent of ammonium nitrogen;
∆N-NH4 ex. shows the amount of ammonium nitrogen that was removed through the boosted nitrification process by the activity of the microorganisms in the activated sludge;
∆N-NH4 calc. is the amount of ammonium nitrogen removed by activated sludge, which represents the nitrification efficiency of the system;
∆N-NH4 indicates the quantity of ammonium nitrogen that has been extracted from the given sample or system.
This removal is achieved through the utilization of microbial flocs. The process occurs during the station’s continuous flow. As shown in Table 5, when conglomerated microorganism flocs are present in activated sludge, the nitrification process becomes more efficient. This occurs in a continuous technological flow. This is because of a special layer on the bacteria called a biological film. The nitrification process improves when there numerous microorganisms in the activated sludge, which makes the system work better. We can see this in how it performs better at higher levels of ammonia in the water compared to Sample 4*, which has less ammonia.
To understand each part of the process, we took samples from the influent, the mixed influent, and the recycled sludge from the secondary settling tank. We also took samples from downstream of each of the three aerated compartments, the biofilter unit, the secondary settling tank, and the effluent. Thus, the profile of the concentrations of all elements estimated for the entire technological flow can be constructed.
The nitrification process is manifested by the decrease in the N-NH4 concentration in all aerated compartments and the biofilter unit, indicated by the ammonium oxidation slope. The denitrification process can be seen through the downward slopes of ammonium oxidation and nitrate reduction (a decrease in N-NO3 concentration). This occurs because they use carbon, which is necessary for the denitrification process. Carbon is present in the form of CCOCr in the initial aeration tank. This process is more noticeable in compartments 2 and 3 at temperatures of 17.6 °C and 20.4 °C, respectively. This occurs because of the breakdown of microorganisms in the anaerobic interfloccular zone, which creates a substrate that is consumed by bacteria. In this case, the wastewater has a carbon source, or CCOCr, that has undergone oxidation, as shown in Figure 5.
The above results demonstrate that the nitrification and denitrification processes occur simultaneously, as shown in Figure 6, at the analyzed temperatures along the technological flow, as presented in Table 4. It is posited that this encompasses the influent, in conjunction with the activated sludge collected and reused from the secondary clarifier, each of the three biological reactors, the biofilter block, the post-aeration zone, and the effluent.

3.3. Calculation of Hydraulic Retention Time

We can use the data in tabular form to find the best scenario for the treatment process. This allows us to obtain the optimal parameters while also considering the station’s unique characteristics, like the hydraulic retention time θ = V Q i = 0.7 and the wastewater temperature of 20 °C. This information is presented in Table 6. The table based on Equation (4) can be used to adjust the operational parameters of the treatment plants within the limits of practice and optimize the treatment processes.
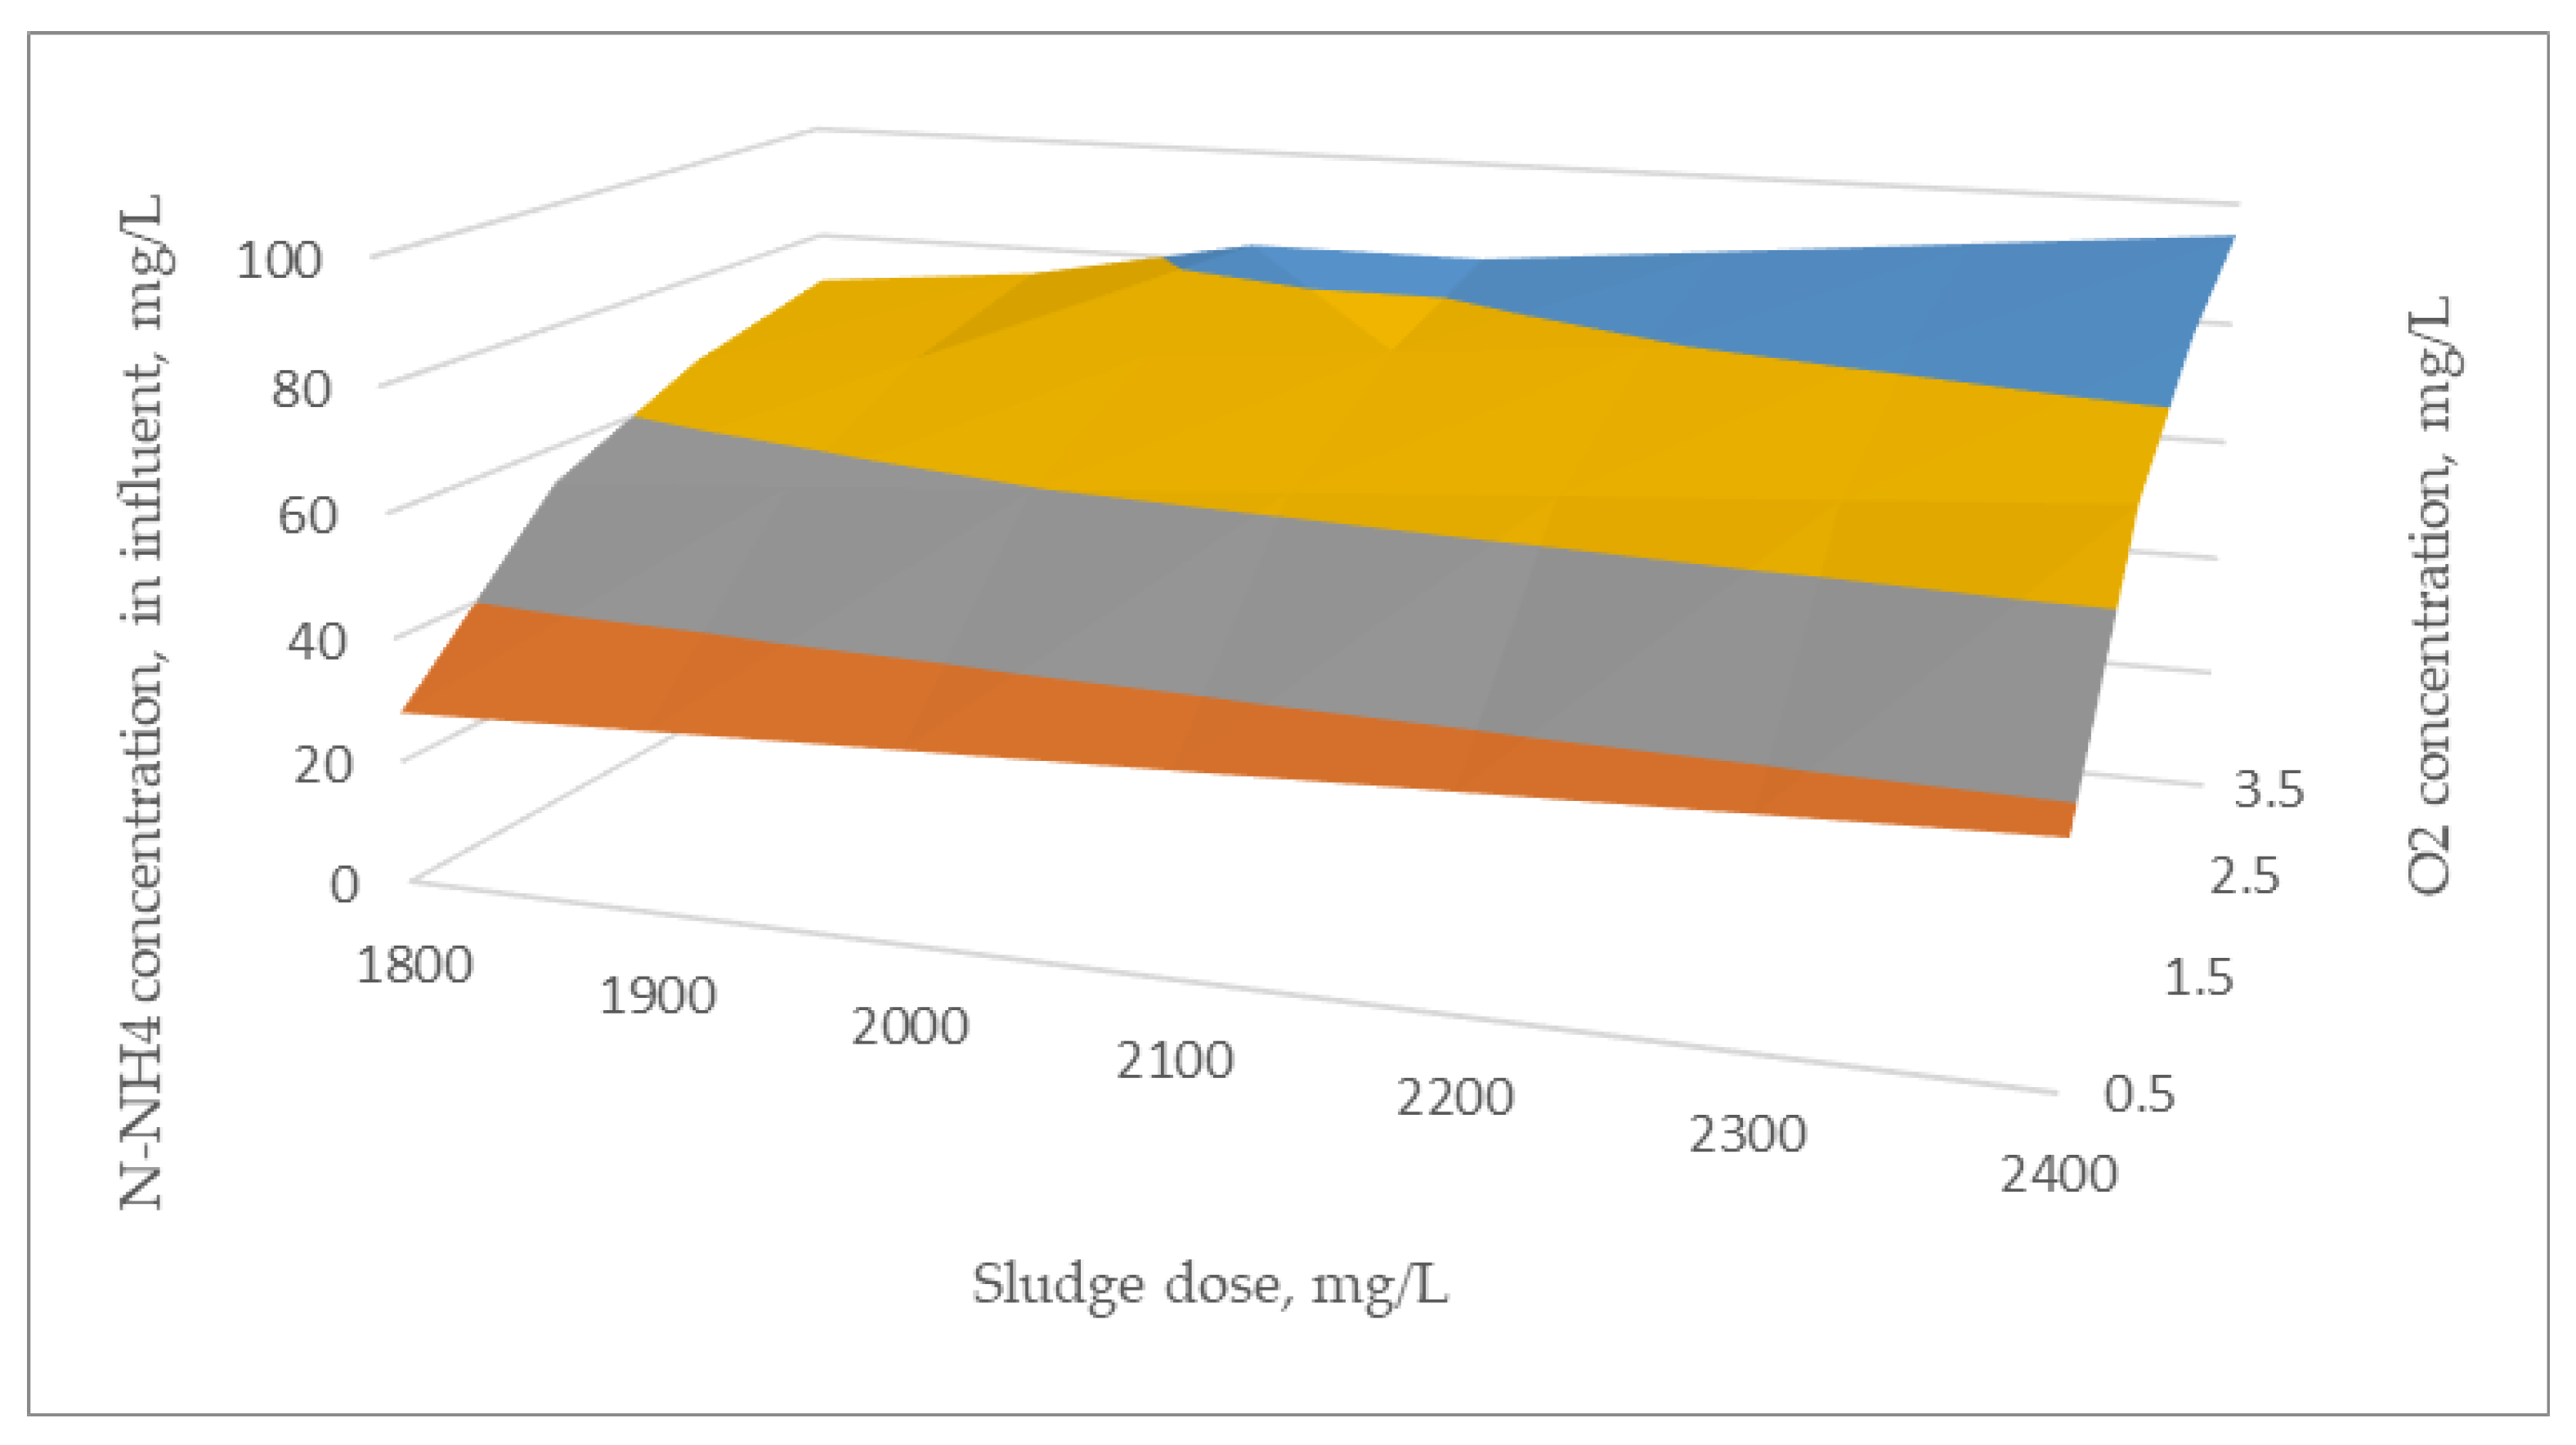
According to Equation (4), 3D diagrams (Figure 7) can be constructed for various wastewater temperatures, as well as for different hydraulic retention times. These diagrams allow the presentation of the N-NH4+ values potentially treated to regulatory levels by modifying the operational parameters in a tabular form (Table 6).
The dissolved oxygen (DO) levels in the aeration tanks ranged from 0.5 milligrams per liter (mg/L) to 3.5 mg/L. Maintaining a concentration of more than 3.5 mg/L in aeration tanks results in elevated electric energy consumption due to the operation of blowers at maximum capacity. This, in turn, necessitates the installation of additional blowers, which is not a viable operational solution. Consequently, the air flow rate and the blowers’ capacity to maintain processes in the aerated compartments are constrained during the design phase to within the limits of 2.0–2.5 mg/L. The sludge dose varies from 1800 mg/L to 2400 mg/L. A higher dose can lead to disruption of the sedimentation process in the secondary clarifiers and cause instability of the entire treatment process by uncontrolled discharge of activated sludge from the system.
The temperature of the wastewater is a variable external factor, fluctuating seasonally between 8 °C and 31 °C in the Alexandria Municipality Wastewater Treatment Plant. This temperature variation is essential in the ammonium oxidation process as it affects the sensitivity of the development of autotrophic bacteria responsible for nitrification. According to legislation and other international regulations [73], ammonium oxidation or nitrogen removal processes are regulated only for temperatures higher than 11–16 °C. In this study, the wastewater temperature varied between 12 and 31 °C, with steps of 2 °C.
The hydraulic retention time, denoted by θ = V Q , is a crucial parameter in the analysis. The quantity V, measured in cubic meters, signifies the constructed volume of the aeration basins at the designated station. Qi, expressed in cubic meters per day, denotes the effective flow rate of the influent at the station, as measured by a designated flowmeter. This parameter, which is a characteristic of the facility design, can range from 0.2–0.3 to 0.9–1.0.
The proportion of autotrophic nitrifying bacteria in a mixed activated-sludge culture is influenced by the C/N ratio, where C is biodegradable carbon and N is total nitrogen. By analyzing the physicochemical parameters of the studied treatment plant, the average C/N ratio for domestic water is found to be 4–5. As the ratio increases, the fraction of bacteria decreases, and vice versa (Table 7). The following text provides a comprehensive overview of this. A value of 0.04 was employed for the fraction of autotrophic nitrifying bacteria in the mixed culture of activated sludge, as determined by the C/N ratio of 4–5. For other C/N ratios, the fraction of autotrophic bacteria, ηa, can be determined using the data provided in Table 7.
The data in the tables correspond to a retention time of θ = V Q = 0.7 . Given that the factor θ in the equation is a linear correction factor, the data in the tables can also be used for other values of θ of the individual characteristic parameters for the station.

4. Discussion

After completing the study and evaluating such a complex system encompassing a wide range of processes, including carbon oxidation, nitrification, and denitrification, in a single stage, it is clear that a substantial investment of time and resources would be required to operate a facility (the studied treatment plant) under all possible conditions. The availability of such a model as the one presented here, which includes rate equations for the processes involved, allows operators to explore a wide range of system configurations, inputs, and operational strategies through simulation. Once parameter values have been calibrated for a given wastewater, the operator can use a model to eliminate inefficient configurations and to choose those alternative system configurations that are most likely to be economical. For a given system flow scheme, there are several options for unit sizes that will result in the desired degree of treatment.
Achieving these treatment targets will reduce water pollution and conserve biodiversity. Energy savings will be possible by optimizing treatment processes, using kinetic modeling for nitrification/denitrification processes and adjusting process parameters in real time, which will lead to significant reductions in the operational costs of treatment plants and bring notable economic benefits. For example, the energy savings achieved can be reinvested in other wastewater treatment plant development projects or in improving community infrastructure (collection networks).

5. Conclusions

In conclusion, the implementation of a wastewater treatment process that uses kinetic modeling to optimize the nitrification process in the presence of conglomerate microorganisms in activated sludge is expected to generate substantial social and economic benefits.
This approach provides the possibility of accurately assessing the ammonium oxidation potential. In addition, kinetic equations facilitate the estimation of parameters that are not usually measured but are essential for optimizing operational parameters (e.g., dissolved oxygen levels in the aeration tank, sludge dosage, and influent flow rate). The nitrification rate demonstrates a performance of 99.03%, while the denitrification rate ranges from 19.08% to 91.01%. A substantial correlation has been demonstrated between this variable and the temperature of the treated wastewater. This process will improve the quality of life and health of the population and increase the efficiency of wastewater treatment, contributing to the sustainable development of the region.
Wastewater treatment plant operators must use advanced strategies to manage nitrification processes, and one such strategy is the use of kinetic modeling equations. This method provides a valuable tool for improving the quality of treated water and for complying with legal requirements. The innovative solution developed and applied in this research improves the operation of biological wastewater treatment plants by integrating kinetic equations for nitrification processes into classic treatment systems based on activated-sludge technology. The developed technology contributes efficiently and sustainably to reducing the biogenic impact, mitigating the eutrophication of aquatic ecosystems.

Author Contributions

Conceptualization: E.M.; methodology: E.M.; investigation: E.M. and C.O.R.; resources: E.M. and C.O.R.; writing—review and editing: E.M. and C.O.R. All authors have read and agreed to the published version of the manuscript.

Funding

The APC was funded by the National University of Science and Technology Politehnica. Bucharest, Romania, within the PubArt Program.

Data Availability Statement

The original contributions presented in this study are included in the article. Further inquiries can be directed to the main author.

Conflicts of Interest

The authors declare no conflicts of interest.

References

  1. Mąkinia, J.; Zaborowska, E. Mathematical Modelling and Computer Simulation of Activated Sludge Systems; IWA Publishing: London, UK, 2020; Volume 4, pp. 19–63. [Google Scholar] [CrossRef]
  2. Hanhan, O.; Insel, G.; Yagci, N.O.; Artan, N.; Orhon, D. Mechanism and design of intermittent aeration activated sludge process for nitrogen removal. J. Environ. Sci. Health Part A Toxic/Hazard. Subst. Environ. Eng. 2010, 46, 9–16. [Google Scholar] [CrossRef]
  3. Bertanza, G. Simultaneous nitrification–denitrification process in extended aeration plants: Pilot and real scale experiences. Water Sci. Technol. 1997, 35, 53–61. [Google Scholar] [CrossRef]
  4. Batchelor, B. Kinetic analysis of alternative configurations for single–sludge nitrification/denitrification. J. Water Pollut. Control F 1982, 54, 1493–1504. [Google Scholar]
  5. Ip, S.; Bridger, J.S.Y.; Mills, N.F. Effect of alternating aerobic and anaerobic conditions on the economics of the activated sludge system. Water Sci. Technol. 1987, 19, 911–918. [Google Scholar] [CrossRef]
  6. Andersen, P.H. Sustainable Operations Management (SOM) Strategy and Management: An Introduction to Part I: New Research Perspectives. In Operations Management and Sustainability: New Research Perspectives; Palgrave Macmillan: London, UK, 2019; pp. 15–25. ISBN 978-3-319-93211-8. [Google Scholar]
  7. Sarkis, J.A. Boundaries and Flows Perspective of Green Supply Chain Management. Supply Chain Manag. Int. J. 2012, 17, 202–216. [Google Scholar] [CrossRef]
  8. Corominas, L.; Foley, J.; Guest, J.S.; Hospido, A.; Larsen, H.F.; Morera, S. Shaw A Life cycle assessment applied to wastewater treatment: State of the art. Water Res. 2013, 47, 5480–5492. [Google Scholar] [CrossRef]
  9. Stackelberg, P.E.; Furlong, E.T.; Meyer, M.T.; Zaugg, S.D.; Henderson, A.K.; Reissman, D.B. Persistence of pharmaceutical compounds and other organic wastewater contaminants in a conventional drinking-water-treatment plant. Sci. Total Environ. 2004, 329, 99–113. [Google Scholar] [CrossRef]
  10. Bumbiere, K.; Barisa, A.; Pubule, J.; Blumberga, D.; Gomez-Navarro, T. Transition to Climate Neutrality at University Campus. Case Study in Europe, Riga. Environ. Clim. Technol. 2022, 26, 941–954. [Google Scholar] [CrossRef]
  11. Cantu, J.; Beruvides, M.; Fedler, C. An Economic Framework for Adaptive Wastewater Reuse for Future Crop Production Sustainability. In Proceedings of the IIE Annual Conference, Pittsburgh, PA, USA, 20–23 May 2017; pp. 1566–1570. [Google Scholar]
  12. Panagopoulos, Y.; Karpouzos, D.; Georgiou, P.; Papamichail, D. Ecosystem Services Evaluation from Sustainable Water Management in Agriculture: An Example from An Intensely Irrigated Area in Central Greece. Environ. Sci. Proc. 2023, 25, 4. [Google Scholar]
  13. Salgot, M.; Folch, M. Wastewater treatment and water reuse. Curr. Opin. Environ. Sci. Health 2018, 2, 64–74. [Google Scholar] [CrossRef]
  14. Liu, A.; Wu, H.; Naeem, A.; Du, Q.; Ni, B.; Liu, H.; Li, Z.; Ming, L. Cellulose Nanocrystalline from Biomass Wastes: An Overview of Extraction, Functionalization and Applications in Drug Delivery. Int. J. Biol. Macromol. 2023, 241, 124557. [Google Scholar] [CrossRef] [PubMed]
  15. Sardi, C.; Skanavis, C. Training a New Generation of Environmental Stewards in Greece. In Educating the Sustainability Leaders of the Future; Leal Filho, W., Lange Salvia, A., Pallant, E., Choate, B., Pearce, K., Eds.; World Sustainability Series; Springer Nature: Cham, Switzerland, 2023; pp. 125–145. [Google Scholar]
  16. Mohammed, A.S.; Kapri, A.; Goel, R. Heavy metal pollution: Source, impact, and remedies. In Biomanagement of Metal-Contaminated Soils; Environmental Pollution; Springer: Berlin/Heidelberg, Germany, 2011; pp. 1–28. [Google Scholar]
  17. Hussain, M.M.; Wang, J.; Bibi, I.; Shahid, M.; Niazi, N.K.; Iqbal, J.; Mian, I.A.; Shaheen, S.M.; Bashir, S.; Shah, N.S. Arsenic speciation and biotransformation pathways in the aquatic ecosystem: The significance of algae. J. Hazard. Mater. 2020, 403, 124027. [Google Scholar] [CrossRef] [PubMed]
  18. Bolan, N.S. Water Encyclopedia: Domestic, Municipal, and Industrial Water Supply and Waste Disposal. J. Environ. Qual. 2008, 37, 1299. [Google Scholar] [CrossRef]
  19. Lehr, J.H.; Keeley, J.; Lehr, J. Domestic, Municipal, and Industrial Water Supply and Waste Disposal; Wiley Interscience: Hoboken, NJ, USA, 2005; pp. 623–681. [Google Scholar]
  20. Caicedo, C.; Rosenwinkel, K.-H.; Exner, M.; Verstraete, W.; Suchenwirth, R.; Hartemann, P.; Nogueira, R. Legionella occurrence in municipal and industrial wastewater treatment plants and risks of reclaimed wastewater reuse. Water Res. 2019, 149, 21–34. [Google Scholar] [CrossRef] [PubMed]
  21. Choudhary, M.; Peter, C.; Shukla, S.K.; Govender, P.P.; Joshi, G.M.; Wang, R. Environmental issues: A challenge for wastewater treatment. In Green Materials for Wastewater Treatment; Environmental Chemistry for Sustainable World; Springer: Berlin/Heidelberg, Germany, 2020; pp. 1–12. [Google Scholar]
  22. MGIMO University, Moscow, Russia; Financial University under the Government of the Russian Federation, Moscow, Russia; Platonova, I.N.; Maksakova, M.A.; MGIMO University, Moscow, Russia; Institute of Economics of the Russian Academy of Sciences, Moscow, Russia. Promoting Small and Medium-Sized Businesses in Europe for Sustainable Development in the Digitalization Era. In Proceedings of the Sustainable and Innovative Development in the Global Digital Age, Rostov-on-Don, Russia, 19–21 May 2022; Dela Press Publishing House: Laragh, Ireland, 2022; Volume 3, pp. 1–4. Available online: https://dpcsebm.delapress.com/index.php/dpcsebm/article/view/198/188 (accessed on 1 December 2024).
  23. European Union. Council Directive 91/271/EEC of 21 May 1991 Concerning Urban Waste-Water Treatment; European Union: Brussels, Belgium, 1991; Volume 135. [Google Scholar]
  24. Hong, Z.; Zhang, H.; Gong, Y.; Yu, Y. Towards a Multi-Party Interaction Framework: State-of-the-Art Review in Sustainable Operations Management. Int. J. Prod. Res. 2022, 60, 2625–2661. [Google Scholar] [CrossRef]
  25. Angelakis, A.N.; Capodaglio, A.G.; Dialynas, E.G. Wastewater Management: From Ancient Greece to Modern Times and Future. Water 2022, 15, 43. [Google Scholar] [CrossRef]
  26. Borah, P.; Kumar, M.; Devi, P. Types of inorganic pollutants: Metals/metalloids, acids, and organic forms. In Inorganic Pollutants in Water; Elsevier: Amsterdam, The Netherlands, 2020; pp. 17–31. [Google Scholar]
  27. Viktorovna, F.I.; Yurievich, N.V.; Viktorovna, P.I.; Mikhailovna, O.L. Impact of renewable energy sources consumption on economic growth in Europe and Asia-Pacific Region. Int. J. Energy Econ. Policy 2021, 11, 270–278. [Google Scholar] [CrossRef]
  28. Integrated Urban Water Management. Available online: www.gwp.org (accessed on 22 December 2024).
  29. Carey, R.O.; Migliaccio, K.W. Contribution of Wastewater Treatment Plant Effluents to Nutrient Dynamics in Aquatic Systems: A Review. Environ. Manag. 2009, 44, 205–217. [Google Scholar] [CrossRef]
  30. Muga, H.E.; Mihelcic, J.R. Sustainability of wastewater treatment technologies. J. Environ. Manag. 2008, 88, 437–447. [Google Scholar] [CrossRef]
  31. Falås, P.; Wick, A.; Castronovo, S.; Habermacher, J.; Ternes, T.; Joss, A. Tracing the limits of organic micropollutant removal in biological wastewater treatment. Water Res. 2016, 95, 240–249. [Google Scholar] [CrossRef]
  32. Younas, F.; Mustafa, A.; Farooqi, Z.U.R.; Wang, X.; Younas, S.; Mohy-Ud-Din, W.; Ashir Hameed, M.; Mohsin Abrar, M.; Maitlo, A.A.; Noreen, S.; et al. Current and Emerging Adsorbent Technologies for Wastewater Treatment: Trends, Limitations, and Environmental Implications. Water 2021, 13, 215. [Google Scholar] [CrossRef]
  33. Whitton, R.; Ometto, F.; Pidou, M.; Jarvis, P.; Villa, R.; Jefferson, B. Microalgae for municipal wastewater nutrient remediation: Mechanisms, reactors and outlook for tertiary treatment. Environ. Technol. Rev. 2015, 4, 133–148. [Google Scholar] [CrossRef]
  34. Zheng, C.; Zhao, L.; Zhou, X.; Fu, Z.; Li, A. Treatment technologies for organic wastewater. Water Treat. 2013, 11, 250–286. [Google Scholar]
  35. Marques, R. Regulation of Water and Wastewater Services. Available online: https://books.google.com/ (accessed on 1 December 2024).
  36. Ionescu, G.C.; Ionescu, I.L. Judicious operation of wastewater treatment plants. In Drinking Water Treatment Technologies, Wastewater Treatment, Sludge Management, Equipment: Conference “Technical-Scientific Performance in Water-Sewer Services”; ARA Publishing House: Bucharest, Romania, 2014; pp. 3–7. [Google Scholar]
  37. Wastewater Treatment. Available online: www.consilium.europa.eu/ro/policies/wastewater-treatment/ (accessed on 22 December 2024).
  38. Collivignarelli, M.C.; Abbà, A.; Bertanza, G. Why use a thermophilic aerobic membrane reactor for the treatment of industrial wastewater/liquid waste. Environ. Technol. 2015, 36, 2115–2124. [Google Scholar] [CrossRef]
  39. Cao, G.; Yang, G.; Sheng, M.; Wang, Y. Chemical industrial wastewater treated by combined biological and chemical oxidation process. Water Sci. Technol. 2009, 59, 1019–1024. [Google Scholar] [CrossRef]
  40. Rubalcaba, A.; Suárez-Ojeda, M.E.; Stüber, F.; Fortuny, A.; Bengoa, C.; Metcalfe, I.; Font, J.; Carrera, J.; Fabregat, A. Phenol wastewater remediation: Advanced oxidation processes coupled to a biological treatment. Water Sci. Technol. 2007, 55, 221–227. [Google Scholar] [CrossRef]
  41. Sarria, V.S.; Parra, N.; Adler, P.; Pulgarín, P.C. Recent developments in the coupling of photoassisted and aerobic biological processes for the treatment of biorecalcitrant compounds. Catal. Today 2002, 76, 301–315. [Google Scholar] [CrossRef]
  42. Scott, J.P.; Ollis, D.F. Engineering models of combined chemical and biological processes. J. Environ. Eng. 1996, 122, 1110–1114. [Google Scholar] [CrossRef]
  43. Tabrizi, G.B.; Mehrvar, M. Integration of advanced oxidation technologies and biological processes: Recent developments, trends, and advances. J. Environ. Sci. Health A Tox. Hazard Subst. Environ. Eng. 2004, 39, 3029–3081. [Google Scholar] [CrossRef] [PubMed]
  44. Scott, J.P.; Ollis, D.F. Integration of chemical and biological oxidation processes for water treatment: Review and recommendations. Environ. Prog. 1995, 14, 88–103. [Google Scholar] [CrossRef]
  45. Marin, E.; Rusănescu, C.O. Agricultural Use of Urban Sewage Sludge from the Wastewater Station in the Municipality of Alexandria in Romania. Water 2023, 15, 458. [Google Scholar] [CrossRef]
  46. Integrated Biotechnologies with Physico-Chemical Processes for Urban Wastewater Treatment and for the Treatment of Residual Sludge for Reuse. Available online: www.researchgate.net (accessed on 6 January 2025).
  47. Maass, O.; Grundmann, P. Added-value from linking the value chains of wastewater treatment, crop production and bioenergy production: A case study on reusing wastewater and sludge in crop production in Braunschweig (Germany). Resour. Conserv. Recycl. 2016, 107, 195–211. [Google Scholar] [CrossRef]
  48. Esplugas, S.; Ollis, D. Economic aspects of integrated (chemical + biological) processes for water treatment. J. Adv. Oxid. Technol. 1997, 2, 197–202. [Google Scholar] [CrossRef]
  49. Oller, I.; Malato, S.; Sanchez-Perez, J.A. Combination of advanced oxidation processes and biological treatments for wastewater decontamination: A review. Sci. Total Environ. 2011, 409, 4141–4166. [Google Scholar] [CrossRef]
  50. OECD. Revised Introduction to the OECD Guidelines for Testing of Chemicals; Section 3; OECD Publishing: Paris, France, 2006. [Google Scholar]
  51. Abedinzadeh, N.; Shariat, M.; Monavari, S.M.; Pendashteh, A. Evaluation of color and COD removal by Fenton from biologically (SBR) pre-treated pulp and paper wastewater. Process Saf. Env. Prot. 2018, 116, 82–91. [Google Scholar] [CrossRef]
  52. Biological Wastewater Treatment Stage. Available online: www.rasfoiesc.com (accessed on 6 January 2025).
  53. Adishkumar, S.; Kanmani, S. Treatment of phenolic wastewaters in single baffle reactor by solar/TiO2/H2O2 process. Desalin. Water Treat. 2010, 24, 67–73. [Google Scholar] [CrossRef]
  54. Ammonia and Ammonium. 2025. Available online: https://ro.hach.com/parameters/ammonia (accessed on 6 January 2025).
  55. Arslan-Alaton, I.; Gursoy, B.H.; Schmidt, J.E. Advanced oxidation of acid and reactive dyes: Effect of Fenton treatment on aerobic, anoxic and anaerobic processes. Dye. Pigment 2008, 78, 117–130. [Google Scholar] [CrossRef]
  56. Castillo-Suárez, L.A.; Lugo-Lugo, V.; Linares-Hernández, I.; Martínez-Miranda, V.; Esparza-Soto, M.; Mier-Quiroga, M.d.l.Á. Biodegradability index enhancement of landfill leachates using a Solar Galvanic-Fenton and Galvanic-Fenton system coupled to an anaerobic–aerobic bioreactor. Sol. Energy 2019, 188, 989–1001. [Google Scholar] [CrossRef]
  57. De Morais, J.L.; Zamora, P.P. Use of advanced oxidation processes to improve the biodegradability of mature landfill leachates. J. Hazard Mater. 2005, 123, 181–186. [Google Scholar] [CrossRef]
  58. Deng, Y.; Zhao, R. Advanced oxidation processes (AOPs) in wastewater treatment. Curr. Pollut. Rep. 2015, 1, 167–176. [Google Scholar] [CrossRef]
  59. Marin, E.; Rusănescu, C.O.; Paraschiv, G.; Ciuca, C.V. Research on wastewater treatment using activated sludge technology IN the anaerobic-anoxic-aerobic configuration. UPB Sci. Bull. Series B 2023, 85, 331–342. [Google Scholar]
  60. Gogate, P.R.; Thanekar, P.D.; Oke, A.P. Strategies to improve biological oxidation of real wastewater using cavitation based pre-treatment approaches. Ultrason. Sonochem. 2020, 64, 105016. [Google Scholar] [CrossRef] [PubMed]
  61. Grandclément, C.; Seyssiecq, I.; Piram, A.; Wong-Wah-Chung, P.; Vanot, G.; Tiliacos, N.; Roche, N.; Doumenq, P. From the conventional biological wastewater treatment to hybrid processes, the evaluation of organic micropollutant removal: A review. Water Res. 2017, 111, 297–317. [Google Scholar] [CrossRef] [PubMed]
  62. Biotechnology Compendium. Available online: https://pdfcoffee.com/compendiu-biotehnologii-pdf-free.html (accessed on 6 January 2025).
  63. Oturan, M.A.; Aaron, J.-J. Advanced oxidation processes in water/wastewater treatment: Principles and applications. A review. Crit. Rev. Environ. Sci. Technol. 2014, 44, 2577–2641. [Google Scholar] [CrossRef]
  64. Safta, V.V. Course Notes—Advanced Water and Air Depollution Procedures; Faculty of Biotechnical Systems Engineering, “Politehnică” University: Bucharest, Romania, 2020. [Google Scholar]
  65. Djafer, A.; Djafer, L.; Maimoun, B.; Iddou, A.; Mostefai, S.K.; Ayral, A. Reuse of waste activated sludge for textile dyeing wastewater treatment by biosorption: Performance optimization and comparison. Water Environ. J. 2017, 31, 105–112. [Google Scholar] [CrossRef]
  66. Henze, M.; Gujer, W.; Mino, T.; Van Loosedrecht, M. Activated Sludge Models ASM1, ASM2, ASM2d and ASM3; IWA Publishing: London, UK, 2006; ISBN 9781780402369. [Google Scholar] [CrossRef]
  67. Regional Water and Wastewater Infrastructure Development Project from Teleorman County in the Period 2014–2020. Available online: https://www.anpm.ro/documents/27905/38872680/MP+Apa+Serv.pdf (accessed on 6 January 2025).
  68. Azevedo, C.S.; Correa, C.Z.; Lopes, D.D.; Pescim, R.R.; Prates, K.V.M.C.; Barana, A.C. Aeration and non-aeration cycles (AE/NA) time: Influence in combined organic matter and nitrogen removal and features of biofilm. Environ. Tehnol. 2021, 43, 2443–2456. [Google Scholar] [CrossRef]
  69. Thalla, A.K.; Bhargava, R.; Kumar, P. Nitrification kinetics of activated sludge-biofilm system: A mathematical model. Bioresour. Technol. 2010, 101, 5822–5835. [Google Scholar] [CrossRef]
  70. Randall, C.W.; Dipankar, S. Full-scale evaluation of an integrated fixed film-media in activated sludge (IFAS) process for nitrogen removal. Water Sci. Technol. 1996, 33, 152–162. [Google Scholar] [CrossRef]
  71. Sun, Z.; Li, J.; Fan, Y.; Meng, J. A quantified nitrogen metabolic network by reaction kinetics and mathematical model in a single-stage microaerobic system treating low COD/TN wastewater. J. Water Res. 2022, 225, 119112. [Google Scholar] [CrossRef]
  72. Gernaey, K.V.; van Loosdrecht, M.C.M.; Henze, M.; Lind, M.; Jørgensen, S.B. Activated sludge wastewater treatment plant modelling and simulation. Water Res. 2004, 19, 763–783. [Google Scholar] [CrossRef]
  73. Council Directive of 21 May 1991 Concerning Urban Waste-Water Treatment. 1991. Available online: http://data.europa.eu/eli/dir/1991/271/oj (accessed on 1 December 2024).
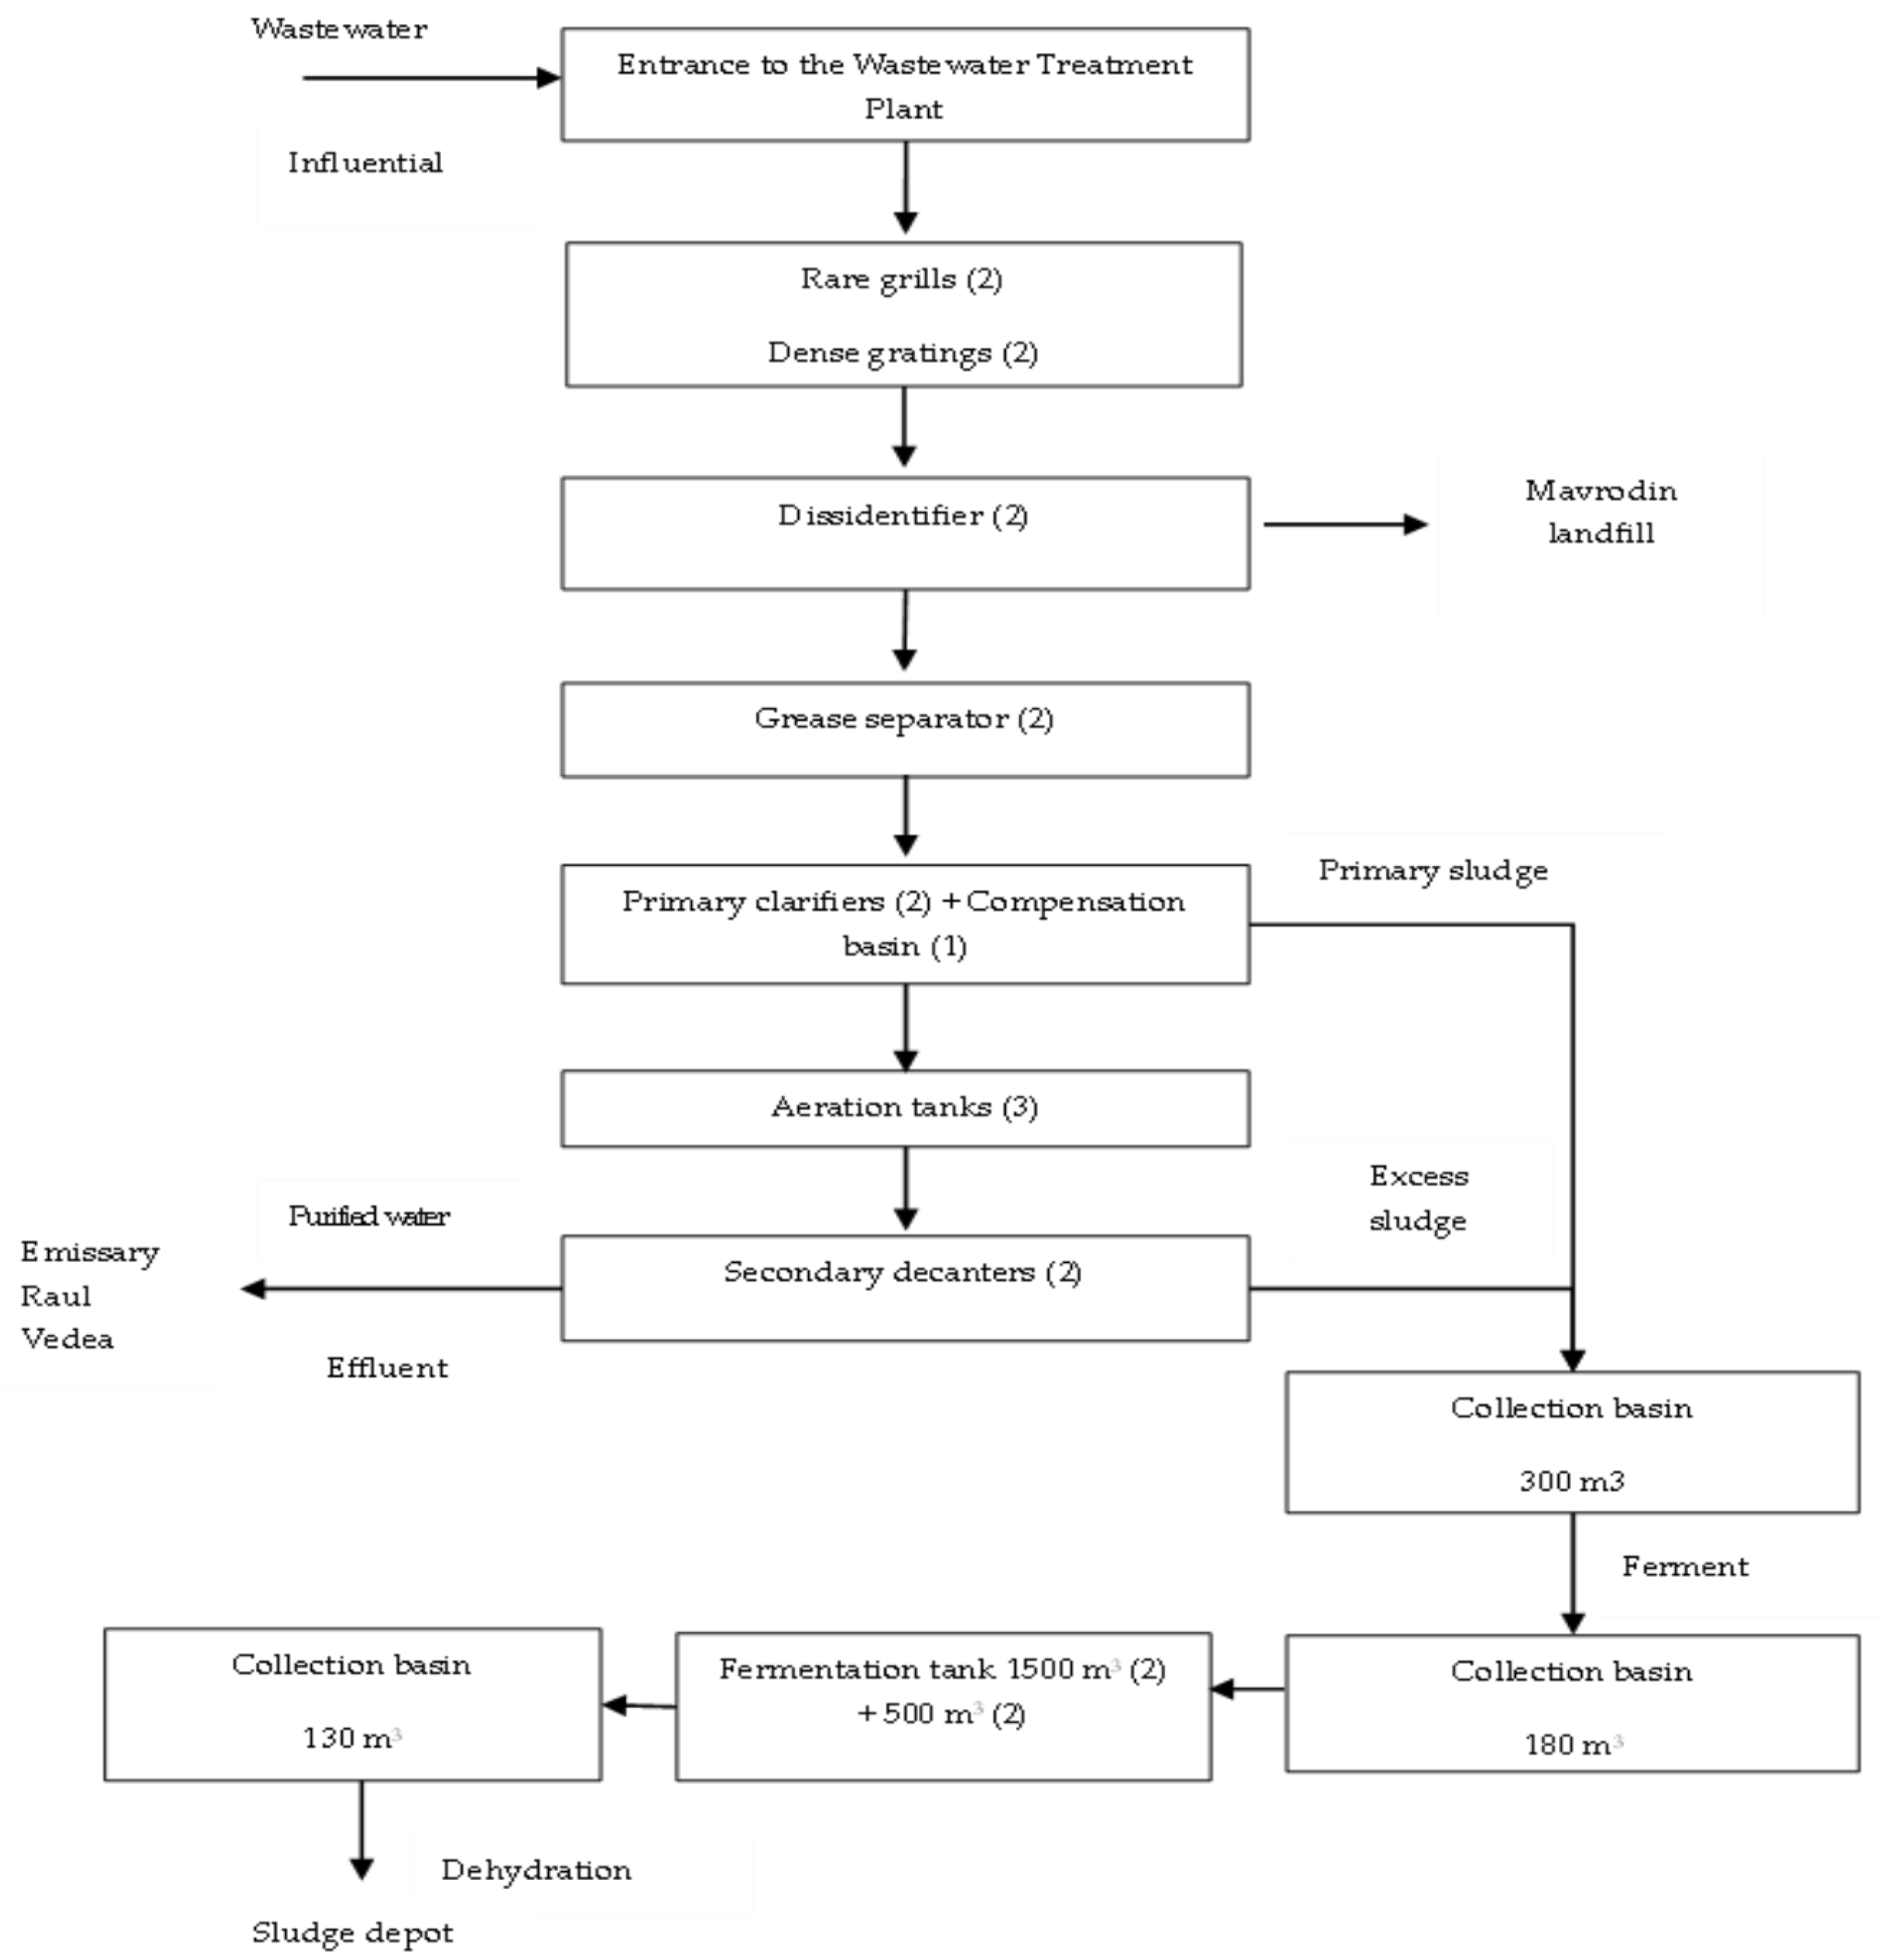
Figure 1. Scheme of the studied wastewater treatment plant, showing how municipal wastewater is processed, starting from the moment the raw wastewater enters the plant through the gravity collector, to the discharge point (outfall).
Water 17 02440 g001
Figure 2. Technological process with biological film through dynamic air stripping.
Water 17 02440 g002
Figure 3. Agglomerated flocs of microorganisms taken from the biological film treatment mechanism.
Water 17 02440 g003
Figure 4. General scheme of nitrification/denitrification processes [58].
Water 17 02440 g004
Figure 5. Three-dimensional graph showing the simultaneous nitrification/denitrification process of the plant under study.
Water 17 02440 g005
Figure 6. Combined scheme of nitrification and denitrification processes.
Water 17 02440 g006
Figure 7. Three-dimensional graph of ammonium nitrogen concentration in the wastewater treatment plant influent (N-NH4inf.) and simulation of possible operational variations to achieve regulatory levels in the effluent for ammonium ion (NH4+—2.0 mg/L), at a wastewater temperature of 23 °C and a hydraulic retention time θ = 0.7.
Water 17 02440 g007
Table 1. The stoichiometric constants and coefficients for the activated-sludge system in the nitrification process.
Stoichiometric Constants and Coefficients Are Important in Chemistry Because They Help to Determine the Amounts of Reacting Substances Needed for a Chemical Reaction to Occur.SymbolUnit of MeasurementValue
Ammonium-oxidizing bacteria clearly demonstrate a high biomass growth rate.
YNH4,maxg MLSS/gN0.24
The maximum specific growth rate of ammonium-oxidizing bacteria is a critical metric in microbiology.µNH4,20C,maxZi−10.8
The saturation constant is numerically equivalent to the N-NH4 concentration when the specific velocity is half of the maximum value, as is the case for the nitrification process.
Ks,NH4,AgN-NH4/m30.5
The O2 saturation constant for autotrophic nitrifying bacteria is numerically equal to the value at which saturation is half of the maximum value.Ks,O2,AgO2/m31.00
Constant pHKpH-200
Temperature constantχ°C−10.08
Fraction of autotrophic bacteria in the active bacterial massηa-0.05
The mass fraction of active bacteria in activated sludge is equal to the ratio VSS (volatile suspended solids)/MLSS (the concentration of suspended solids with mixed liquids).δb-0.65
Mortality rate of bacterial population that is autonomous from its foodβzi−10.05
Table 2. Technical operating/functioning parameters of the station under study.
ParameterSymbolUnit of MeasurementValue
Volume of aerated compartments
Vm31300
Influent wastewater flow rate in the treatment plantQim3/zi1900
N-NH4 concentration in wastewater treatment plant effluent
SNH4,eg/m3variable
Dissolved oxygen concentration in aerated compartmentsSO2gO2/m3variable
The pH concentration in wastewater from the treatment plant’s influent is measured.pH-variable
Activated sludge is added in suspended matter in aerated compartments.MLSSg/m31850–2150
Temperature of wastewater undergoing treatmentt°C10–26
Table 3. Adjustment of operational parameters Qi = 1900 m3/day, V = 1300 m3, MLSS (the concentration of suspended solids with mixed liquids) = 1980 g/m3, and N H 4 + = 1.98 g/m3.
DO/mg/L t, °C
1011121314151617
119.1020.6421.3222.1323.0925.2227.5329.02
226.2328.3730.6832.1934.9137.8640.0544.50
329.7931.2333.8735.7238.8242.1745.8148.74
431.9334.5437.3740.4443.7647.3650.2653.49
533.3636.0939.0543.2546.7349.49552.5756.98
DO/mg/L t, °C
1819202122232425
132.7335.6638.8341.1043.2745.9948.0353.40
249.2553.3057.8062.4667.6173.2079.2585.80
356.0160.6265.6371.0576.9283.2890.1797.64
460.0665.0270.3976.2082.5189.3396.73104.74
562.7767.9573.5679.6486.2393.365101.09109.47
Note: DO—dissolved oxygen dose.
Table 4. Calculation of simultaneous nitrification efficiency and denitrification efficiency, determined using kinetic equations.
No.Temp.CODCr InfluentCODCr
Effluent.
N-NO3
Effluent
N-NO2
Effluent
N-NH4
Influent
N-NH4
Effluent
Eff
N-NH4
Eff N
°CgO2/m3gO2/m3g/m3g/m3g/m3g/m3%%
19.01460109.0342.096.0882.0516.0580.0119.08
210.02535.07118.0236.054.0665.072.2596.0633.9
315.01522.06116.0442.050.04970.040.65999.0138.06
415.09556.0893.0112.010.19949.0522.41995.0270.02
517.03616.0299.011.6578.12103.037.9192.0482.09
617.06488.0373.0216.070.10968.980.72298.0974.01
720.08493.0796.065.3240.03865.030.43799.0391.01
820.04341.0129.056.030.10961.020.62598.0888.06
925.04622.0563.913.040.45579.080.93598.0881.05
Table 5. The efficacy of the nitrification process, as determined by its yield, within the context of continuous technological flow.
No.∆N-NH4exp., g/m3N-NH4 Influent calc. g/m3N-NH4 calc. g/m3N-NH4 g/m3
166.0159.5443.0422.98
263.4535.7933.5329.93
369.7536.4935.8333.93
4*47.1045.6743.263.85
595.4175.3067.4028.02
668.2940.8140.0928.21
764.8832.6432.332.68
860.5941.0540.4320.17
978.8770.969.879.01
Table 6. Application for selecting a suitable scenario to achieve the required results in the treatment process with individual plant characteristics such as hydraulic retention time θ = V Q i = 0.7 și and wastewater temperature 20 °C.
Parameter
OD/Dose/mg/L
Sludge Dose mg/L
1800190020002100220023002400
0.5027.8229.2830.7432.2033.6635.1236.58
1.0044.2146.5848.9451.3153.6856.0558.42
1.5054.0456.9559.8762.7865.7068.6171.53
2.0060.5963.8767.1570.4373.7176.9980.26
2.5065.2768.8172.3575.8979.4382.9786.51
3.0068.7872.5176.2579.9883.7287.4591.19
3.5071.5175.4079.2883.1787.0590.94994.83
Table 7. The present study investigates the relationship between the proportion of autotrophic nitrifying bacteria in a mixed culture of activated sludge and the C/N ratio.
C/N Ratio Autotrophic Bacteria Fraction ηa C/N Ratio Autotrophic Bacteria Fraction ηa
0.50.3550.054
10.2160.043
20.1270.037
30.08380.033
40.06490.029
Disclaimer/Publisher’s Note: The statements, opinions and data contained in all publications are solely those of the individual author(s) and contributor(s) and not of MDPI and/or the editor(s). MDPI and/or the editor(s) disclaim responsibility for any injury to people or property resulting from any ideas, methods, instructions or products referred to in the content.