Abstract
Plastic pollution in river systems is a growing concern, especially in the Mekong Delta, where complex tidal dynamics facilitate downstream transport of plastic waste into the marine environment. This study assessed the density, composition, and temporal variability of floating plastic waste in the Hau River, approximately 30 km upstream of the Tran De River estuary. Floating net traps were deployed during both ebb and flood tides to quantify plastic waste with simultaneous meteorological and hydrological monitoring. The findings highlight that key meteorological factors, such as air temperature, humidity, wind speed, and wind direction, were found to indirectly influence plastic transport by altering surface currents and promoting plastic degradation. Meanwhile, hydrological conditions, especially tidal variability, play a direct and dominant role in determining the spatial and temporal distribution of plastic waste. Plastic debris was diverse in terms of items during both tidal phases. Although the number of plastic pieces was higher at ebb tide (134.33 pieces/h), the volume and concentration of plastic were greater at flood tide (1.22 kg/h and 0.73 kg/m3) than at ebb tide (0.81 kg/h and 0.29 kg/m3). Macroplastic debris was almost dominant during both ebb tide (97.29%) and flood tide (93.96%) compared to megaplastic and mesoplastic size. These findings highlight the importance of integrating tidal and climate factors into plastic waste management and support targeted interventions to reduce plastic discharge into coastal ecosystems.
1. Introduction
The invention of the first synthetic plastic in the mid-19th century marked a pivotal moment in material science. However, it was not until the 1950s that global plastic production began to grow rapidly, driven by the unique characteristics of plastics such as durability, flexibility, low cost, and their ability to substitute traditional materials in a wide range of applications. While these properties have supported significant advancements across sectors, they have also contributed to a major environmental concern: plastics are highly resistant to physical and chemical degradation, allowing them to persist in natural environments for decades to centuries.
The environmental implications of plastic waste first gained scientific attention in the 1970s, when plastic debris was observed in aquatic environments, prompting early concerns about its potential impact on marine ecosystems. In response, various beach clean-up campaigns and citizen science initiatives were launched to combat the growing threat to marine biodiversity [1]. According to [2], in the present day, plastic pollution is recognized as a critical environmental issue worldwide. Approximately 300 million tons of plastic are produced annually, with an estimated 11 million tons leaking into lakes, rivers, and oceans.
Mitigating plastic pollution requires a detailed understanding of the sources, pathways, and dynamics of plastic waste, particularly within river systems that transport waste from land to sea [3,4]. A growing body of research has identified rivers as major conduits of plastic debris to the marine environment. The top 20 most polluting rivers—primarily located in Asia—are responsible for approximately 67% of the global plastic load entering the ocean [3]. According to [3] it is estimated that 1.15 to 2.41 million tons of plastic are discharged annually from rivers into the ocean, with over 74% of this occurring during the rainy season between May and October [3]. In Vietnam, rapid population growth, increased consumption of disposable plastics, and changing patterns of waste generation have contributed to a growing volume of plastic waste. Common items such as plastic bags, food packaging, and single-use products significantly contribute to environmental pollution. The country’s agricultural, forestry, and aquaculture sectors also generate considerable plastic waste from sources such as mulch films, greenhouse covers, fertilizer and pesticide containers, pond liners, and fishing gear. Moreover, tourism, industrial production, and scrap imports further exacerbate the problem. Vietnam’s tropical and subtropical climate accelerates the breakdown of plastic into smaller fragments and microplastics, increasing their mobility and potential for environmental dispersal. The country’s topography, which descends from northwest to southeast, along with a dense river network, facilitates the transport of plastic waste from upland areas through plains and urban centers to coastal zones [5].
Vietnamese households use an average of 1 kg of plastic bags per month, more than 80% of which are discarded after a single use. Nationally, approximately 1.8 million tons of plastic waste is generated every year, most of which is plastic bags. According to the Ministry of Natural Resources and Environment, between 0.28 and 0.73 million tons of plastic waste are discharged into the marine environment each year [6]. Field studies confirm widespread plastic contamination in river systems. For instance, a three-year investigation in the Red River basin (Northern Vietnam) documented more than 15,000 kg of floating debris, of which plastic waste accounted for 51.4% [7]. The pollution originates from diverse sources including upstream municipalities, direct discharges, aquaculture activities, and unregulated river transport [8].
Similarly, in the Vu Gia–Thu Bon River system (Central Vietnam), daily plastic waste generation is estimated at 281 tons, with 36.5 tons remaining uncollected. Assuming that 10–25% of this uncollected waste enters water bodies, between 3.7 and 9.1 tons of plastic may leak into rivers each day. The steep terrain and rapid river flows in the region enhance the downstream transport of plastic to the ocean [9]. Urban water systems also act as plastic pathways; for example, research in Ho Chi Minh City’s canals found that plastic waste comprises 11–26% of total debris, with some sinking to the canal bed and others drifting to the sea [10]. In the Saigon–Dong Nai River system, floating plastic waste increases from upstream to downstream, consisting largely of plastic bottles, bags, and foam containers [11].
The Mekong River ranks among the top ten rivers contributing plastic waste to the ocean, with approximately 3.33 tons/year attributed to its Vietnamese section [12]. Another study reported that Phnom Penh alone discharges an estimated 74,095 tons of plastic waste into the Mekong during the rainy season [13]. Recognizing these threats, Vietnam has enacted several legal instruments to prevent plastic pollution from entering the marine environment. Nevertheless, with over 3260 km of coastline and numerous river systems, plastic waste management remains a daunting challenge. Many coastal provinces have incorporated plastic pollution control into their socio-economic development plans [14].
Among these systems, the Mekong River Basin—home to over 70 million people in its lower reaches—plays a critical ecological and economic role [15]. Yet, it is also one of the most significant contributors to global marine plastic pollution, with the ten largest rivers accounting for 95% of plastic inputs to the oceans [12]. Within this context, the Hau River—a major distributary of the Mekong—is increasingly impacted by agricultural expansion, aquaculture, industrialization, and climate-related stressors, such as sea level rise and saltwater intrusion [16,17]. The Mekong Delta generates more than 3 million tons of solid waste annually, with 90% remaining untreated. Of this, approximately 2.3 million tons derive from households and 1.4 million tons from industrial sources, much of which is discharged into the riverine system [18].
Given these circumstances, this study aimed to assess the density and composition of floating plastic waste in the Hau River, with particular attention to tidal and water volume fluctuations that could potentially transport plastics to the sea via the Tran De estuary (Soc Trang province). The objectives included analyzing the effects of both (i) meteorological factors; (ii) the hydrological factors; and (iii) assessing temporal changes in plastic waste characteristics to provide evidence-based recommendations for sustainable plastic waste management in Vietnam’s river systems.
2. Materials and Methods
The primary objective of this study is to investigate plastic waste accumulated in the underwater environment on the Hau River, the section passing through Soc Trang province before flowing into the sea. The research methodology encompasses the following: (i) assessment measurements quantifying riverine transport of plastic debris; (ii) discussion of several typical plastic polymer types and items found in river systems; and the origin and fate of riverine plastic debris. The research was conducted on the Hau River (9°45′25″ N 106°03′40″ E), about 30 km upstream of Tran De estuary, in one of the two main branches of the Mekong River (Figure 1).
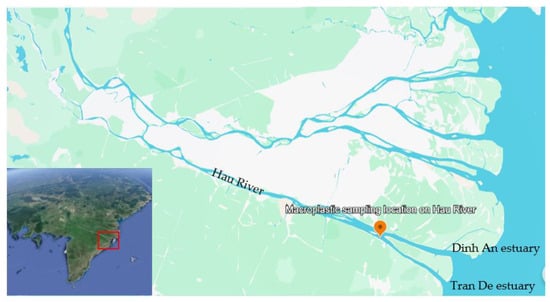
Figure 1.
Sample locations.
2.1. Study Areas
2.1.1. Characteristics of Hau River
When the Mekong River flows downstream from Phnom Penh (Cambodia) into Vietnam, it is divided into two main branches, the Mekong River (Tien River) and the Bassac River (Hau River), from which it divides into many small branches that flow into the East Sea [19]. The Tien River plays an important role immediately after its distributary from the Mekong mainstream at Phnom Penh by conveying a larger amount of water than the Hau River (86% compared to 14%). After the Tien River diverts some of its water into the Hau River via Vam Nao canal, the two rivers maintain a water balance (49% and 51%, respectively. Tien River has successive major distributaries namely Co Chien River, Ham Luong River, Ba Lai River, Cua Dai River, and Cua Tieu River [20]. In contrast, Hau River only divides into 2 before flowing into the sea of about 30 km through Dinh An and Tran De estuaries (these 2 estuaries are located at both ends of Cu Lao Dung district, Soc Trang province) [20]. Hau River, about 200 km long, flows almost parallel to Tien River through the provinces of An Giang, Can Tho, Hau Giang, Vinh Long, Tra Vinh, and Soc Trang [18] and has a width of approximately 60–300 m, widening bit by bit as it flows to the sea. The Hau River has an average depth of 10–20 m, while the maximum is over 40 m. However, sedimentation has caused a decrease depth as the river nears the sea [17].
2.1.2. Hau River Hydrological Regime
Due to the main impact of climatic factors, the annual hydrological regime of the Mekong River is divided into two distinct seasons. The flood season is from June to December with the flow accounting for 90% of the total annual flow and the dry season is from January to May. March and April are the two months with the shallowest flow [19]. The Mekong River system in general and the Hau River in particular are influenced by two different tidal regimes. The East Coast region from Can Gio to Ca Mau cape is influenced by the tides in the eastern sea area of the East Sea; the Western coastal area from Ca Mau cape to Ha Tien is influenced by the tides of the western sea. Coastal tides are influenced by the semi-diurnal tidal regime of the East Sea. Within a 24 h period, there are typically two tidal cycles, each consisting of a flood tide (the water level rises) and an ebb tide (the water level falls). In each tidal cycle, there are two tidal peaks: one high tide peak (the water reaches its highest level), and one low tide peak (the water reaches its lowest level). Flood tide lasts about 6 h and ebb tide lasts about 6.45 to 7 h. The difference between the top and bottom of the tide, on flood tide days, can be from 2.5 to 3.5 m. The difference between the top and bottom of the tide on ebb tide days is usually less than 1 m. The daily amplitude during flood tide is usually 1.5 to 2 times larger than during ebb tide. The tidal amplitude gradually decreases towards Ca Mau cape (1–2 m). During the dry season, the flow in the upper Mekong is small, and the flow regime of the Tien and Hau rivers is completely controlled by the tidal regime in the East Sea [21]. Hau River has a flow in the Northwest–Southeast direction with a relatively large flow velocity from 1 to 2.98 m/s [22]. The average flow velocity in the dry season is from 0.08 to 0.31 m/s, and in the flood season, it is from 0.33 to 1.24 m/s. In curved, narrow river sections, the flow is influenced by channel curvature, which generates centrifugal forces that cause pressure gradients across the channel. These gradients induce secondary (spiral) flows, with surface water moving toward the outer bank and bottom water toward the inner bank. As a result, the dynamic flow axis—representing the zone of maximum velocity—tends to shift toward the outer bank, often toward the right bank, depending on the curve’s orientation) [23].
2.2. Sample Collection
2.2.1. Sample Collection Time
The sample collection time was determined based on hourly water level data from Dai Ngai hydrological stations (9°44′4″ N, 106°4′27″ E) and Tran De hydrological stations (9°30′1″ N, 106°12′5″ E), provided by the Institute of Coastal and Offshore Engineering for the period from 22 April to 28 April [24]. The sampling date was chosen as 29 April 2024 to place nets to collect macroplastic samples on Hau River. From the data, it is shown that in one day (24 h), there were 2 flood tides and 2 ebb tides; the next day, the time of flood and ebb tide was 1 h late. Sampling time is such that there are instances of flood tide and ebb tide in a day. Ebb tide refers to the direction of water flowing from the river (from macroplastic sampling location on Hau River) to the sea via Tran De estuary, while flood tide refers to the direction of water flowing in the opposite direction (Figure 1).
Data from two hydrological stations show that on 29 April 2024, there were two flood tides (from 5:00 to 8:00 and 13:00 to 17:00) and two ebb tides (from 8:00 to 13:00 and 17:00 to 21:00) (Figure 2a). Macroplastic sampling during the ebb tide was conducted from 08:00 to 12:00, with nets deployed at three time points in the river (L1, L2, and L3). Each net was retrieved once per hour to collect plastic samples, and each sorting session took approximately 30 min (Figure 2b). Similarly, macroplastic sampling during flood tide was conducted from 13:00 to 17:00, also with nets deployed at three time points in the river (H1, H2, and H3). Each net was retrieved once per hour to collect plastic samples, and each sorting session also took approximately 30 min (Figure 2b). All plastic samples collected hourly during ebb and flood tides were stored separately in large sealed plastic bags with clear labels and transported to the laboratory for subsequent analysis.
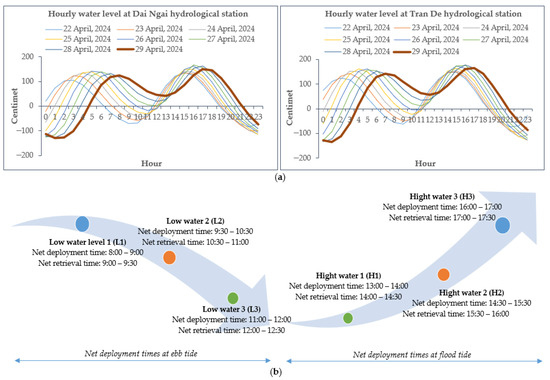
Figure 2.
(a) Hourly water level at Dai Ngai hydrological station and Tran De hydrological station [24] and (b) time to place the net and time to pull the net.
2.2.2. Sample Collection Net
According to UNEP (2020), three different methods for monitoring macroplastics on the surface of water or in the water column have been developed in recent years [25]. The sampling method was developed by [26], the tracking method was implemented by [27], and the visual observation method was conducted by [28]. Among them, the sampling method by nets is a simple and intuitive monitoring strategy. Riverine litter is often collected and analyzed in the field or in the laboratory. This method targets either floating plastics at the water surface or plastics suspended within the upper 1.5 m of the water column in order to identify composition, polymer type, item type, size, and mass distribution; alternatively, sampling is carried out to determine the plastic concentration at given points in space and time [25]. Sampling using nets deployed directly from riverbanks was introduced in 2011 by [29]. However, this method allows sampling of only a limited portion of the river cross-section, as the horizontal distribution of plastic transport can vary considerably [26].
The deployment location for monitoring plastic transport from a river into an ocean should be as close to the river mouth as possible. However, estuaries are subject to complex flow dynamics as they are influenced by both tides and freshwater discharge. Flow velocity and direction may change on hourly timescales, which in turn influences plastic transport and export into the ocean [25]. Through field surveys at the sampling location (from Figure 1), the flow tends to transport plastic close to the riverbank (Figure 3a). Within 60 m around the sampling location (Figure 3b), the vegetation cover (from riverbank to river) was about 10 m (Figure 3c). Therefore, the net is placed about 12 m from the riverbank, ensuring both the depth of the net and the collection of plastic.
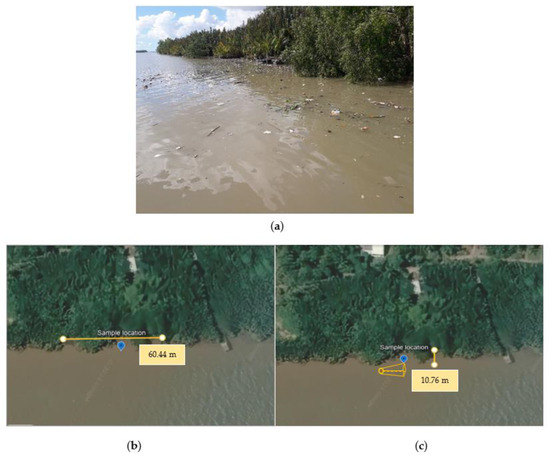
Figure 3.
(a) Plastic waste on Hau River; (b) length and (c) width of vegetation at the sampling location. Figures (b,c) reprinted with permission from Google Earth Pro. © 2024 Google, Image © Maxar Technologies. Source: Google Earth Pro, accessed on 15 June 2024.
Macroplastic samples are collected using a net with dimensions (width × depth) of 3 × 3 m (Figure 4a,b). Although the net depth required to collect floating and suspended plastic debris is 1.5 m above the water column (from the water surface to the river bottom), the distribution of plastic in the water column is related to buoyancy, shape, extent decomposition of plastic, river morphological characteristics, and hydrological regime; there is a current lack of research on the vertical distribution of plastic waste in the water column [25]. In addition, the density of plastics varies widely depending on polymer type, ranging from lower than water, such as LDPE (0.89–0.93 g/cm3), HDPE (0.94–0.99 g/cm3), and PP (0.87–0.92 g/cm3), to higher than water, such as PET (1.39–1.41 g/cm3), PVC (1.40–1.42 g/cm3) and PS (1.04–1.08 g/cm3) [30,31]. Furthermore, the Hau River has an average depth of 10–20 m, while the maximum is over 40 m [17]. Therefore, the depth of the net in this study was increased to 3 m compared to 1.5 m in the study of [25]. The recommended mesh size is 2.5 cm because monitoring floating plastic waste typically targets objects larger than 2.5 cm. Using mesh sizes that are too small can create a water curve in front of the net mouth; therefore, litter may drift out of the net, thereby making the sample less representative [32]. Since plastic debris in the lower water layers can account for a significant portion of the total transported plastic [25], a mesh size of 10 × 10 mm was used in this study (Figure 4b,c).
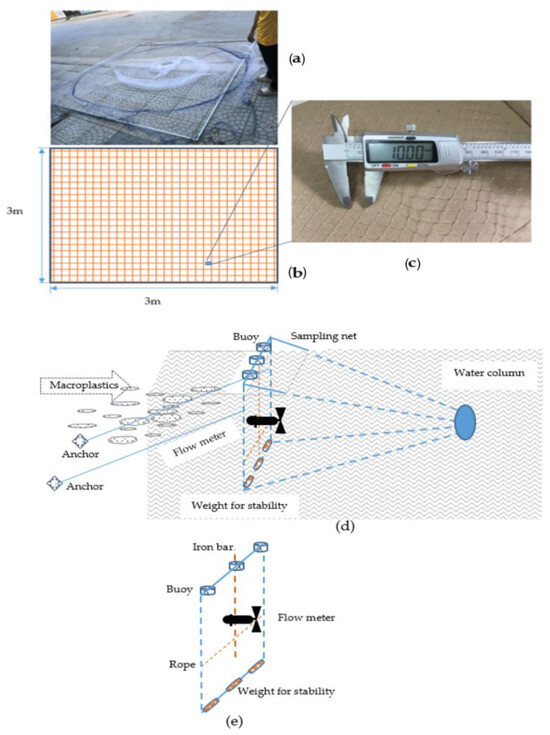
Figure 4.
Sampling plastic waste on Hau River: (a) sample collection net, (b) sample collection grid size, (c) mesh size, (d) putting nets in the river, and (e) attaching the flowmeter.
The net is placed in the river, with weight for stability (heavy iron objects) hanging below so that the net sinks to the river bottom, and above there is a float, so that the top edge of the net is about 20 cm above the open surface of the river. The two sides of the net are tied to two ropes attached to anchors to keep the net straight along the water flow (Figure 4d). After the net is placed stably in the river, the mechanical flowmeter with low-speed impeller rotates counterclockwise [33] (General Oceanics, Inc., Miami, FL, USA, 2030R6). The rotor diameter is 16.5 cm, the housing is filled with tap water, and the initial count is recorded. Next, the flowmeter is fixed to the iron bar, the upper end of the iron bar is tied to the upper horizontal bar of the net, and the lower end of the iron bar touches the rope so that the flowmeter is always vertical and the head is always facing the water flow (Figure 4e). The time for placing and pulling the net is as shown in Figure 2b. After 1 h of placing the net, the flowmeter is pulled up first and the final count is recorded. Next, the net is pulled up and plastic items are picked out from the waste mixture (mainly leaves and twigs) as shown in Figure 5.
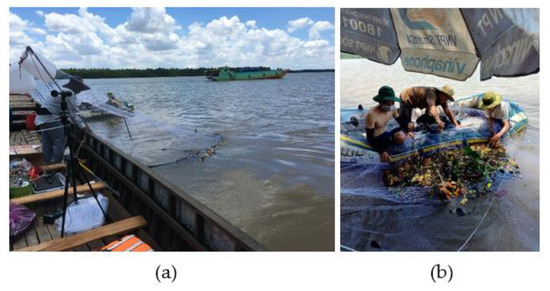
Figure 5.
(a) Pulling up the net and (b) plastic classification.
2.3. Data Collection
During the time of placing the net, data such as air temperature measured with a handheld electronic meter (Laserliner, model 082.030A, Umarex GmbH & Co. KG, Arnsberg, Germany; accuracy ± 2 °C), air humidity measured with a hygrometer (DUROtherm Holding GmbH, Haiterbach, Germany; accuracy ± 2%), and wind direction and intensity measured with a handheld anemometer (Sato, model 7730-00, Sato Keiryoki Mfg. Co., Ltd., Tokyo, Japan; accuracy ± 1 m/s at <10 m/s and ±10% accuracy at >10 m/s) were collected. In addition, river waves were also recorded using a Levelogger (Solinst, model 3001, Solinst Canada Ltd., Georgetown, Ontario, Canada; accuracy ± 0.05%) which was interfaced to the computer using Levelogger software version 4.6. The measured value can be recorded every 10 s; large data memory allows recording and storing 150,000 data points.
2.4. Calculate the Collected Data
2.4.1. Calculation of the Flow Volume Through the Devices
The volume of water is calculated as follows:
with the rotor constant of the low-speed rotor (R6) being 57.56 [33]
2.4.2. Concentration, Size Categories, and Chemical Composition of Macroplastic
First, plastic waste is classified according to plastic items, then dried at 85 °C (Memmert, model UN110, Memmert GmbH + Co. KG, Schwabach, Germany; accuracy ± 0.5 °C) until constant weight, then counted. Then, the total number of pieces of each type is taken and the mass is weighed (OHAUS, model PA2102, OHAUS Corporation, Parsippany, NJ, USA; accuracy ± 0.01 g). The size of the pieces is measured, and the plastic is classified according to UNEP guidelines (2018) [34].
Plastic concentration Cp (g/m3) can be calculated according to Formula (4):
where Mp (g): collected plastic mass;
V (m3): sampled water volume.
The sizes of the collected plastic samples were compared according to the UNEP guidance document (2020) [25] as shown Table 1.

Table 1.
Classify the size of plastic debris.
3. Results
In addition to the physical properties of plastics and the hydrological regime, the transport of floating plastics in rivers is also indirectly influenced by many other environmental factors, such as humidity and air temperature [35,36], as well as directly affected by wind speed and direction [37,38] and river waves [39,40]. Furthermore, the presence of carriers such as water hyacinth, tree branches, and organic waste can facilitate the movement of plastics along river systems [41].
3.1. Meteorological Factors
3.1.1. Air Humidity and Air Temperature
From Figure 6, on 29 April 2024, the average air humidity ranged from 61 ± 2% to 75.33 ± 5%. Meanwhile, the average air temperature ranged from 34.2 ± 0.4 °C to 38.4 ± 0.35 °C. The plastic sampling is located on the Hau River in Long Phu district, bordering Cu Lao Dung and Tran De district, both in Soc Trang province. According to [42], the air humidity during the week (from 22 April 2024 to 29 April 2024) of the three districts of Long Phu, Cu Lao Dung, and Tran De ranged from 48 to 84% and the air temperature ranged from 26 to 38 °C.
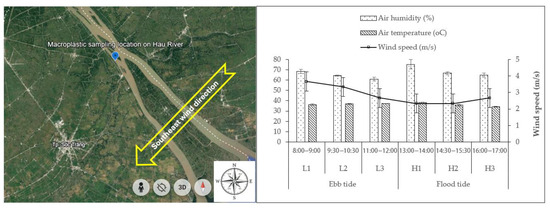
Figure 6.
Weather conditions during plastic sampling on Hau River (29 April 2024).
Although air humidity does not directly affect plastic transport, it can affect the oxidation and degradation of plastic materials, especially when combined with high temperatures. In tropical areas such as the Mekong Delta, prolonged high humidity causes plastic surfaces to retain moisture for longer, thereby promoting biofouling on the plastic surface. Differences in biofilm composition (at least when colonization by macro-organisms occurs) between coastal and estuarine stations may alter biofouling, resulting in varying sinking behaviors of large plastic objects [35]. Temperature does not directly affect the flow but indirectly affects the level of degradation and brittleness of plastic, thereby affecting its transportability. At high temperatures, plastics tend to be more brittle and break down into smaller pieces (microplastics), increasing their ability to float and spread in water currents [36]. In addition, high temperatures also promote the photolysis of plastic when exposed to sunlight, creating small plastic pieces that are easily washed away by currents.
3.1.2. Wind Direction and Wind Speed
The wind direction at the plastic sampling area downstream of the Hau River on 29 April 2024, was recorded in the main direction of Southeast (SE), with an average speed of about 2.8 m/s; however, depending on different times of the day, there are different wind speeds (Figure 6). Wind speed was measured at a time corresponding to ebb tide: at the first sampling time (L1, from 8:00–9:00), the average wind speed reached 3.67 ± 0.58 m/s; at the second sampling time (L2, from 9:30–10:30) the average wind speed reached 3.33 ± 0.58 m/s; and at the third sampling time (L3, from 11:00–12:00), the average wind speed reached 2.67 ± 0.58 m/s. Meanwhile, during flood tide, at the first sampling time (H1, from 13:00–14:00), the average wind speed reached 2.33 ± 0.58 m/s; at the second sampling time (H2, from 14:30–15:30), the average wind speed reached 2.67 ± 0.58 m/s; and at the third sampling time (H3, from 16:00–17:00), the average wind speed reached 2.67 ± 0.58 m/s. The southeast wind direction during this period is consistent with the characteristics of the transition season between the dry and rainy seasons in the Mekong Delta region. According to data from the Soc Trang regional meteorological station system from 22 April 2024 to 29 April 2024, the downstream area of the Hau River—including coastal areas such as Long Phu, Cu Lao Dung and Tran De—recorded the southeast wind direction with wind speeds of 3–4 m/s [42]. The southeast wind direction causes floating debris from the eastern bank of the Hau River to drift to the western bank and pollutants from canals to flow into the Hau River, especially in riverside areas with concentrated populations or aquaculture activities. Wind direction and wind speed are among the most important factors affecting the transport of plastic waste on rivers and estuaries. Wind can enhance surface currents, thereby pulling floating plastic to move faster in the direction of the wind [37]. In addition, wind changes the direction of plastic distribution, especially in wide river stretches or areas where river branches intersect, where wind can cause plastic debris to accumulate on one side of the bank or be pushed away from the mainstream. When wind speed increases (>5 m/s), light plastic debris such as packaging and foam are easily swept off the water surface and dispersed in the direction of the wind [38].
Overall, meteorological factors, particularly air temperature, humidity, wind direction, and wind speed, play a significant yet indirect role in influencing plastic transport dynamics in riverine environments. In the Hau River downstream area, high air temperatures (up to 38.4 ± 0.35 °C) and sustained humidity (up to 75.33 ± 4.62%) promote plastic degradation through photolysis and microbial colonization, potentially altering the buoyancy and mobility of plastic debris. Wind direction (predominantly southeast) and moderate wind speeds (2.67–3.67 m/s) were observed to align with regional meteorological trends and significantly influence surface current patterns, redistributing floating plastics across riverbanks and facilitating their entry from tributaries into the main channel. These findings underscore the role of local climatic conditions in modifying the physical behavior and dispersal pathways of plastic waste in tropical river systems.
3.2. Hydrological Characteristics
3.2.1. Waves on the Hau River
Hydrodynamic conditions in rivers and estuaries, including variations in flow velocity, turbulence, tidal influence, wind, and river morphology, play an important role in controlling the dynamics of surface currents and influencing the transport and retention of plastic debris. Estuaries can act as hotspots for plastic retention, where increased freshwater flow can double the probability of floating debris reaching the lower estuary and enhance lateral circulation toward the shore, leading to high stranding rates comparable to low-flow conditions [39]. Several field studies have also noted that waves generated by boat operations can significantly increase the dispersion of plastics in rivers, especially in urban rivers with high traffic density [40]. These impacts not only change the distribution of plastics but also make it difficult to collect and control floating plastic pollution in rivers.
Hydrodynamic observations in the Hau River at ebb tide for three morning intervals, namely L1 (08:00–09:00), L2 (09:30–10:30), and L3 (11:00–12:00), on 29 April 2024, revealed clear temporal variations in water level and surface wave characteristics associated with the ebb tide (Figure 7a). At L1 (08:00–09:00), the water level declined from approximately 167 cm to 130 cm. Wave amplitudes during this period ranged from 3 to 7 cm, with the most common amplitude observed around 5 cm. Wave periods (i.e., the time between two successive crests) varied from 2 to 4 s. During L2 (09:30–10:30), the water level continued to decrease from 120 cm to below 80 cm. Wave amplitudes slightly diminished, mostly falling within the range of 2–5 cm, while the wave period remained stable between 2 and 4 s. Compared to L1, wave activity appeared more uniform, reflecting a gradual stabilization of flow conditions as the tide progressed. At L3 (11:00–12:00), the water level approached its lowest point, reaching approximately 75 cm. Surface waves remained present, but with smaller amplitudes (2–4 cm) and shorter wave periods (2–3 s).
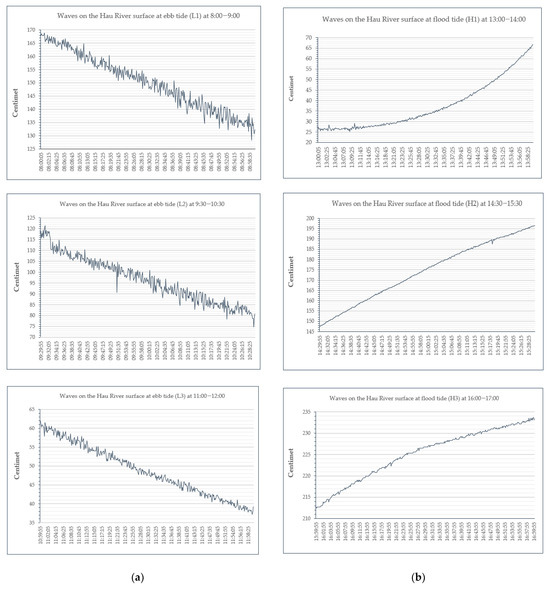
Figure 7.
Waves on the Hau River according to the time of plastic sampling: (a) ebb tide (L1: 8:00–9:00, L2: 9:30–10:30, L3: 11:00–12:00); (b) flood tide (H1: 13:00–14:00, H2: 14:30–15:30, H3: 16:00–17:00) on 29 April 2024.
Monitoring during flood tide on 29 April 2024 revealed a progressive increase in water level across three consecutive afternoon intervals—H1 (13:00–14:00), H2 (14:30–15:30), and H3 (16:00–17:00)—demonstrating the clear periodicity and intensity of tidal forcing in the Hau River system (Figure 7b). While the water level rose steadily throughout the high tide phase, surface wave characteristics evolved distinctly, reflecting the dynamic interactions between tidal currents, local disturbances, and flow stabilization over time. At H1 (13:00–14:00), the water level increased rapidly from approximately 25 cm to 70 cm. Despite the relatively low wave amplitudes (1–3 cm), surface waves were continuously observed with short wave periods (estimated at 2–3 s). During H2 (14:30–15:30), the water level continued to rise from approximately 145 cm to nearly 200 cm. Wave amplitude during this interval declined markedly, generally remaining below 2 cm, with minimal variation. The wave period persisted in the 2–3 s range. At H3 (16:00–17:00), the water level peaked from approximately 210 cm to a maximum of 235 cm, marking the final stage of the flood tide. The increase during this period was gradual and smooth, indicating that the river system had absorbed the full tidal volume. Wave amplitudes were minimal, only about 1–2 cm, and no clear oscillations were discernible in the hydrographic record. While the wave period remained consistent at 2–3 s, the associated wave energy was extremely low, resulting in an exceptionally stable water surface.
Observations of waves in tidal river systems, which can be influenced by both natural forces and local activities, such as boat movements, suggest that understanding such wave behavior is important for assessing the transport, dispersion, and ultimate fate of floating or suspended pollutants—particularly plastics—in estuarine environments. During periods of lower hydrodynamic energy, such as late ebb tide, plastics may be more likely to settle or become trapped in sediments, vegetation, or man-made barriers. When tidal flow becomes dominant and stabilizes, surface wave activity is increasingly suppressed. These findings reflect the inverse relationship between tidal elevation and wave amplitude, a behavior consistent with reduced local turbulence and enhanced hydrological stability during peak tidal conditions.
Overall, temporal analysis of surface wave behavior under tidal influence provides essential insight into the dynamic conditions that govern pollutant mobility in tidal rivers. It highlights the importance of integrating wave characteristics into environmental monitoring programs aimed at predicting the environmental behavior and ecological risks of plastics.
3.2.2. Water Velocity
The results of water velocity measurements at three ebb tides (L1, L2 and L3) and three flood tides (H1, H2 and H3) show significant variations in flow dynamics under the influence of tides. During the ebb tide, the water velocity ranges from 0.47 m/s (L2), 0.52 (L1), to 1.34 m/s (L3), with the maximum value occurring at the end of the low phase. This reflects the increase in hydraulic gradient due to the maximum water level difference between the river and the sea, which enhances the outflow to the sea. In contrast, the water velocity during the high phase tends to decrease over time, from 1 m/s (H1) to 0.82 m/s (H2) and 0.23 m/s (H3), indicating a decrease in flow kinetic energy when the river reaches its peak tide. Comparing the two tidal phases, the ebb tide phase exhibits a wider velocity fluctuation amplitude and a larger peak value than the flood tide phase, indicating the asymmetrical characteristics of the tidal cycle in the survey area. Specifically, the maximum flow velocity in the ebb tide phase (L3) is higher than that at the beginning of the flood tide phase (H1), while the minimum flow velocity appears at the peak tide (H3), reflecting the quasistatic state of the river surface when the water level reaches its maximum. These characteristics are consistent with the studies of [21] on the influence of channel morphology and irregular semi-diurnal tidal regime on flow dynamics in the lower Mekong River.
The results from Table 2 show that Pearson correlation analysis revealed a strong relationship between hydrological conditions and the distribution of plastic waste in surface water. Notably, water velocity showed a strong negative correlation with plastic fragment density (pieces/m3, r = −0.886) and volumetric plastic item count (items/m3, r = −0.943). This result suggests that as the flow increases, plastic waste tends to be diluted or washed away from the survey site, thereby reducing the density of litter recorded at the site. This observation is consistent with previous studies on the role of flow dynamics in the transport and distribution of microplastics in river and coastal environments ([41,43]).
Table 2.
Analysis of the correlation between meteorological and hydrological factors on plastic transport on Hau River.
In addition, water velocity also had a strong negative correlation with the amount and mass of debris per unit time (items/h: r = −0.771; g/h: r = −0.771), suggesting that fast-flowing water not only affects sedimentation but also the ability to collect debris at the monitoring sites. This is reinforced by the negative relationship between wave height and water velocity (r = −1.000), suggesting that rapidly changing hydrodynamic conditions may alter the structure of the flow, thereby affecting the sedimentation and dispersion mechanisms of plastic debris [3]. In addition, wind speed had a relatively positive correlation with plastic fragment density (r = 0.530) and number of plastic items per volume (r = 0.441), suggesting that wind may play a role in transporting light objects such as plastic bags and Styrofoam boxes from shore into the water. This phenomenon has been noted in studies of the origin of plastic waste from the mainland into the hydrological system, especially in urban riverine areas [44,45].
At elevated temperatures, plastics can become brittle and fragment into smaller pieces, leading to changes in the size distribution of plastic debris in water [46]. While temperature is recognized as a key factor influencing plastic degradation over longer timescales, the negative correlation observed during our short-term measurement campaign indicates that other environmental variables—such as hydrodynamic conditions, UV exposure, or biological activity—may have exerted a more immediate influence on fragmentation. Further investigation is necessary to better understand the role of ambient temperature in plastic fragmentation under dynamic field conditions.
Overall, these results confirm that hydrological and meteorological factors play a significant role in the spatial–temporal distribution of plastic waste in urban surface water environments. Understanding this relationship is an important basis for developing more effective plastic waste collection and control strategies according to seasonality and environmental conditions.
3.3. Characteristics of Floating Plastic Waste
3.3.1. Abundance of Plastic Items
Abundance of Plastic Items at Ebb Tide
Plastic waste collected from the Hau River during three ebb tide sampling periods showed significant diversity in types, functions, and origins, highlighting the complex nature of plastic pollution in the river’s aquatic environment before being discharged into the sea via the Tran De estuary (Table 3). The diversity raises the concern that the progressive fragmentation of macroplastic items is likely to increase the number of particles available for ingestion to a wider range of organisms, known to cause physical and chemical harm to aquatic ecosystems through ingestion, entanglement, and toxic leaching [47,48], and consistent with prevailing global plastic pollution trends [49].
Table 3.
Plastic and non-plastic items are grouped by common type at ebb tide.
Plastic waste is commonly found in aquatic environments, reflecting human consumption behavior with poor management causing them to leak into the environment. During all low tide sampling periods (L1, L2 and L3), a wide range of plastic debris was observed, ranging from common disposable consumer products to specialized industrial and household items. A total of ten functional groups were identified from the dataset (Table 3) with the most prominent items by frequency included Plastic Bag (T Shirt), Plastic Bag (Without Handle), Food Bags, Package Straps (Plastic Bags & Wrappers group) and Plastic Shoes (Plastic Toys & Other Items group), all of which were present at least in 2 or 3 sampling periods, constituting the most frequent category, consistent with their widespread use in consumer goods and low recovery rates in waste management systems [44]. The presence of Styrofoam Boxes, Food Containers (Styrofoam) and Styrofoam Fruit Nets highlights the role of expanded polystyrene—a material that is inherently non-biodegradable and fragmentable—in urban waste streams [46]. Meanwhile, the presence of medical-related plastics such as Plastic Transfer Droppers, Asthma Inhalers and Plastic Tubing (Rectal Pumps) highlights the entry of specialized plastic waste into the environment, raising concerns about their persistence and potential for toxicity to ecosystems.
The diversity and function of the debris recorded is characteristic of modern consumer lifestyles and reflects the complex mix of household, industrial and medical waste entering the aquatic environment without intervention at source.
Abundance of Plastic Items at Flood Tide
Similar to the ebb tide, the diversity of plastic waste collected during the three sampling periods during the flood tide was also highly diverse in types, reflecting the complex and persistent nature of plastic pollution in the aquatic environment, influenced by anthropogenic discharges and mismanagement. The upstream transport of plastics during the flood tide represents the redistribution of pollutants throughout the river system.
Table 4 illustrates the accumulation trend in both plastic and non-plastic materials, spanning a wide array of consumer, industrial, and sanitary applications. Among the ten functional groups, the most frequently recurring items—found in all three sampling periods—were Plastic bags (without handle), Food bags, and Package straps (Group 1: Plastic Bags and Wrappers); Plastic lids and Plastic cups (Group 3: Plastic Lids and Caps); Food containers (foam) (Group 4: Foamed Plastic); and Spoons (Group 5: Plastic Tableware). Their consistent presence underscores their widespread use and persistence in the environment.
Table 4.
Plastic and non-plastic items are grouped by common type at flood tide.
Flood tide conditions were associated with a broader diversity of item types, particularly lightweight and buoyant plastics such as bags, wrappers, and foamed materials (e.g., fruit foam nets, Styrofoam fragments). These polymers are more easily transported by tidal inflows and tend to accumulate in aquatic systems, consistent with prior studies [45,50] that highlight preferential mobilization of low-density plastics during rising tides. Additionally, such soft plastics are among the most prevalent environmental pollutants due to their light weight, ease of dispersal, and limited recyclability [34,46]. Their physical fragility also makes them prone to fragmentation into mesoplastics and microplastics under mechanical stress and UV exposure [46].
Notably, hygiene and personal care items—including diapers, disposable gloves, and resistance bands—were also recorded, pointing to emerging concerns related to post-consumer plastic waste from healthcare and fitness sectors. These items, often composed of laminated or flexible multilayer polymers, are challenging to recycle and prone to mismanagement [50,51].
This item-level diversity highlights the pervasive and multi-sectoral origins of plastic pollution in riverine environments. The co-occurrence of food-related, sanitary, industrial, and medical plastic waste emphasizes the urgent need for integrated source identification, enhanced waste management infrastructure, and upstream interventions to prevent plastic leakage into aquatic ecosystems.
3.3.2. Number of Pieces of Plastic
Density of Plastic Pieces According to Each Tidal Time
The survey results showed significant differences in plastic fragment density between sampling times, clearly reflecting the uneven distribution of plastic fragments in the surface water environment. The distribution of plastic fragments in aquatic environments is not only influenced by anthropogenic sources, but also significantly modulated by natural hydrodynamic factors, most notably, the tidal cycle (Table 5).
Table 5.
Number of plastic pieces according to each tidal time.
In terms of quantity over time (pieces/h), the ebb tide time, L2 recorded the highest value with 340 pieces/h, while the time L1 had a value of 49 pieces/h and L3 had the lowest value of 14 pieces/h. The highest flood tide times were at H1 (71 pieces/h), followed by H3 with 59 pieces/h, and the lowest was H2 with 48 pieces/h. The average number of plastic fragments at ebb tide reached 134 pieces/h, nearly twice as high as at flood tide (59 pieces/h).
In terms of the number of pieces by volume, a similar trend as the number of pieces by hour was also recorded. Specifically, at ebb tide, L2 reached the highest density with 134 pieces/m3, while at L1 it reached 17 pieces/m3 and at L3 it was the lowest with only 2 pieces/m3. The density at flood tide ranged from 11 pieces/m3 (H2) to 48 pieces/m3 (H3), which may reflect temporary accumulation of plastic debris due to localized retention or urban runoff coinciding with tidal inflow. Although the current dataset is limited to a single-day measurement, similar phenomenon has been reported in urban estuaries, where backflow and stagnation zones can act as transient sinks for buoyant debris [52]. Further investigation is needed to confirm whether such patterns persist over longer timeframes.
At ebb tide, the average density of plastic pieces per unit volume of water was two times higher than the average density of plastic pieces at flood tide (average 51 pieces/m3 at ebb tide compared to 24 pieces/m3 at flood tide). These results align with findings from [53] who observed that plastic flux in tidal rivers peaks during ebb tide due to downstream transport of debris that accumulates during flood phases. Tidal modulation also affects sampling resolution and representativeness. According to [52], sampling during rising tides may lead to underestimations of debris load due to vertical mixing and dispersion, whereas ebb-phase sampling captures peak surface or near-surface concentrations. This underscores the need for tidally synchronized monitoring protocols, particularly in estuarine and deltaic systems where tidal amplitude and current velocity strongly dictate debris distribution patterns [54,55].
These differences are important in the context of research aimed at assessing the level of plastic pollution and the potential environmental risks caused by plastics. The difference between the two tidal periods (ebb and flood) shows that the level of plastic debris pollution at the ebb tide points tends to be higher, which may be related to direct discharge sources, human activities or surface runoff during the rainy season, or nearby discharge sources from upstream areas being carried downstream by the current. In addition, the waves on the river at ebb tide are higher than those at flood tide, and the southeast wind direction also pushes plastic debris drifting from the east bank or the middle of the river to the west bank (the riverbank has a net to collect plastic waste). In addition, the wind speed and water velocity at ebb tide are higher than those at flood tide, which are also factors that contribute to the faster drift of plastic debris at ebb tide than at flood tide. Another equally important reason is that the vegetation on both sides of the Hau River is where plastic fragments accumulate when the water is high, they are pushed to the shore by river waves and wind and get stuck in the vegetation (mainly nipa palms and other plants). When the tide goes down, the water level gradually drops from the shore towards the river, they are pulled out of the stuck place and float along the water in large patches or cling to other floating vegetation (water hyacinth, tree branches, or other organic matter) until they are broken into smaller clumps by other factors. These results contribute to providing an initial database for assessing the environmental risks caused by plastics in the study area.
Number of Plastic Items at Ebb Tide
The results collected at ebb tide indicated an uneven contribution of plastic fragments across different item groups (Figure 8). For example, the group of items with the fewest fragments (1–3 pieces each) included 41 items but contributed 13.9% of the total number of plastic fragments. The intermediate group of ten items (4–8 pieces each) contributed 14.39% of the fragments. In contrast, a small group of only six items (18–135 pieces each) accounted for 71.71% of all plastic fragments (equivalent to 289 pieces). These findings suggests that a limited number of plastic items, likely composed of fragile materials such as cling film, thin packaging, or foam, tend to fragment more extensively under environmental stressors like UV exposure, water turbulence, or mechanical impact [46,56]. In this study, an “item” refers to a single plastic object collected, while “pieces” denote the number of visible fragments associated with each item.
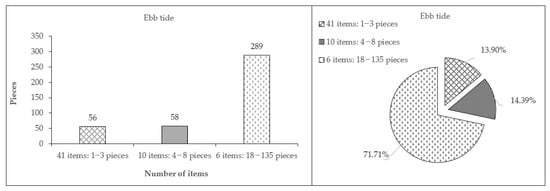
Figure 8.
The plastic items and the ratio of fragments at ebb tide.
In addition, the negative relationship between the number of items and the proportion of plastic fragments suggests that the number of items is not an accurate indicator of the risk of microplastic contamination, but rather the potential for fragmentation and fragment generation of each specific item should be considered. This is consistent with the findings of [45], who found that some items predominate in terms of fragment number despite being uncommon in terms of presence.
Taken together, this graph highlights the important role of physical properties and material structure in determining the potential for plastic fragment generation in the environment. Therefore, plastic waste management strategies should prioritize controlling degradable items, rather than focusing solely on the initial quantity present.
The distribution of plastic fragments under ebb tide conditions revealed notable differences among item types (Figure 9). Ten plastic item types contained between four and fragments each, including foam nets for fruit packaging (4 pieces), plastic lighters (5), other miscellaneous plastics (5), plastic shoes (5), rubber bands (5), shockproof packaging (6), package straps (6), plastic bags (T-shirt type) (6), broken plastic bucket lids (8), and plastic toys (8). In contrast, six item types exhibited markedly higher fragmentation levels, ranging from 18 to 135 pieces: spoons (18), plastic lids (22), plastic bags without handles (27), Styrofoam containers (33), food bags (54), and foam food containers (135). These items typically possess a large surface area, porous structure, and high susceptibility to disintegration into numerous small fragments, particularly when exposed to sunlight and mechanical agitation from water flow [54]. Furthermore, nylon bags and thin plastic films, such as food packaging are well-documented as major sources of plastic debris in both freshwater and marine ecosystems [45]. The substantially greater fragment counts in this latter group underscore their high prevalence in the aquatic environment and indicate that they are not only common litter items but also prone to extensive degradation into smaller particles.
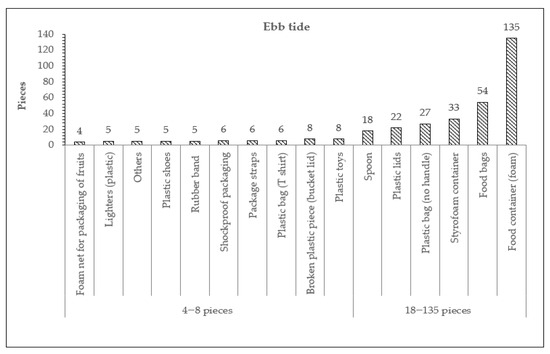
Figure 9.
The plastic items and the number of pieces at ebb tide.
Meanwhile, within the 1–3 pieces category, a total of 41 plastic-related item types were recorded, comprising 29 item types with only one piece, 9 item types with 2 pieces, and 3 item types with 2 pieces. These items included consumer products, such as baby bottle hood, ballpoint pens, cups, dishwashing sponge, and disposable razors, as well as medical or pharmaceutical waste like asthma inhaler tube, nasal inhaler tube, medicine bottle (glass), serum bottle, vaccine vial (glass), and permanent marker pen. Other single-piece items comprised glass bottles, leather handbags, LED headlight head-mounted flashlight, metal lids, plastic bottles (veterinary physiological), pesticide bottles (plastic), and various household plastics, including a plastic pen, plastic mug with handle, and plastic rice paddle. This prevalence of single-piece plastic waste reflects both the diversity of sources and the potential for sporadic or point-source littering [44]. There are nine items that were recorded with two plastic fragments, suggesting a higher likelihood of mechanical breakdown or repeated introduction into the environment. These included antiseptic bottles, face cream boxes, liquid lipstick bottles, pill blisters (capsules), plastic bottle handles, plastic cups, plastic plant pots, plastic transfer pipette droppers, and plastic tubes (rectal pump solution). These items tend to be personal care, medical, or single-use packaging, which are known to fragment under environmental stressors such as UV exposure and abrasion [46]. Additionally, there are three items with three fragments including plastic bowls, plastic super glue bottles, and zip bags. These items likely experience high environmental exposure and physical stress due to their thin-walled structure, widespread usage, and prolonged retention in surface waters or intertidal zones.
Number of Plastic Items at Flood Tide
The analysis of plastic debris collected during flood tide revealed notable differences in fragmentation levels among item types (Figure 10). Specifically, although the group comprising 30 plastic items each contributing only 1–3 pieces accounted for the largest item count, and it contributed merely 19.10% of the total pieces (n = 34). In contrast, a much smaller group of only 5 items, each item producing 12–25 pieces, accounted for 53.37% of the total pieces (n = 95). An intermediate group of 9 items producing 4–9 pieces each contributed 27.53% (n = 49). These findings suggest that the significant amount of plastic debris in the aquatic environment increases the overall plastic burden in the environment.
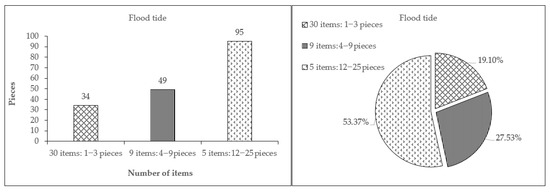
Figure 10.
The plastic items and the ratio of pieces at flood tide.
Plastic debris collected during flood tides showed that certain item types contributed disproportionately to the total number of plastic pieces (Figure 11). Among items generating 12–25 pieces, food containers (foam) and plastic bags without handles had the highest pieces counts, with 25 and 24 pieces, respectively. This was followed by food bags (20 pieces), plastic lids (14 pieces), and plastic cups (12 pieces). In contrast, items in the 4–9 pieces category, such as rubber bands, Styrofoam containers, and plastic shoes, contributed only 4–6 pieces each. This distribution indicates that lightweight, brittle, and expandable polymer products (e.g., foam) exhibited greater fragmentation than denser or more elastic materials. Previous studies have reported that Styrofoam food containers and thin plastic bags are particularly susceptible to fragmentation under physical stress and UV exposure, with low-density polyethylene (LDPE) and polystyrene foam showing enhanced breakdown rates in the marine environment [36,46].
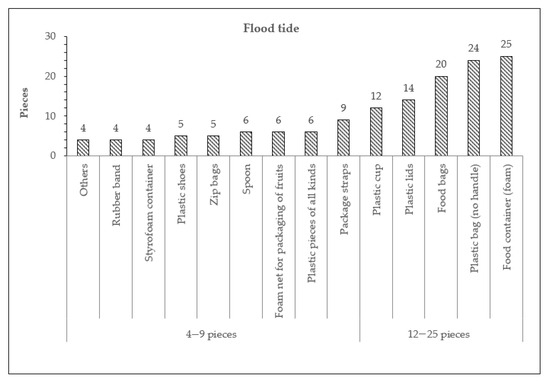
Figure 11.
The plastic items and the number of pieces at flood tide.
Meanwhile, within the 1–3 pieces category, a total of 30 plastic-related item types were recorded, comprising 27 item types with only one piece, 2 item types with two pieces, and only 1 item type with three pieces was found during the survey. These included a diverse range of products, such as disposable plastic gloves (for food handling), aluminum foil, plastic bottles and plates, straws, lighters, dishwashing sponges, ribbons, combs, toothbrushes, and other household or packaging items. The prevalence of these single-piece items suggests limited mechanical or environmental degradation. In contrast, only two items—diapers and glass bottles—were found with two pieces each, and notably, only one item type, the plastic bag (T-shirt type), was found with three pieces. These observations highlight the need for targeted mitigation strategies focusing on items that fragment more readily, as these pose a higher ecological risk due to their small size and greater abundance.
3.3.3. Mass of Plastics
Plastic Mass Density at Each Tidal Time
The collected data showed a clear difference in the mass of plastic debris (in kg/h) between the two instances of ebb tide (L1, L2, L3) and flood tide (H1, H2, H3) as shown in Table 6. Specifically, at the average ebb tide, the mass of plastic debris was 0.81 kg/h, while at flood tide it was 1.22 kg/h. Thus, the mass of plastic debris floating in the water at flood tide was about 50% higher than at ebb tide. The total mass of plastic debris recorded in three measurements at ebb tide was 2.43 kg, lower than the total mass of 3.65 kg recorded at flood tide. This difference may be attributed to the fact that flood tides can transport large debris from sources along canals, rivers, or residential areas into the survey area. Although the number of plastic pieces was lower at flood tide than at ebb tide, their total mass was nearly twice as high, leading to a higher mass density during flood tide.
Table 6.
Mass of plastic pieces according to each tidal time.
The analysis results showed a significant difference in the mass of plastic per unit volume of water (kg/m3) between ebb tide (L1, L2, L3) and flood tide (H1, H2, H3). On average, the concentration at ebb tide was 0.29 kg/m3, whereas at flood tide it was more than twice as high, reaching 0.73 kg/m3. At ebb tide, values ranged from 0.04 to 0.78 kg/m3, with the highest at L2. At flood tide, the maximum concentration reached 1.92 kg/m3 (H3), indicating significant plastic accumulation at this stage. The average hourly plastic debris mass during flood tide (1.22 kg/h) was also higher than that during ebb tide (0.81 kg/h). The difference in mass density between tides is mainly due to the greater total mass of plastics collected during flood tide, despite the number of pieces being lower compared to ebb tide. This suggests that flood tide may carry larger or heavier debris into the survey area, increasing the mass density. While tidal movements and wind may influence debris transport, our results indicate that the mass difference is the dominant factor affecting density variations between tides.
Mass Distribution of Plastic Debris at Ebb Tide
The mass distribution of plastic items collected during ebb tide reveals a marked dominance of low-mass items, with significant implications for transport dynamics and source attribution (Figure 12). Objects weighing less than 5 g constituted most of the debris types, including small flexible items such as rubber bands, pill blisters, syringes, and plastic bottle caps. These items, due to their low mass and typically buoyant nature, are more susceptible to wind and surface current transport, allowing for wide dispersal across aquatic environments [45,50]. The high frequency of such items is often linked to urban runoff, poor waste management, and littering near waterways [57].
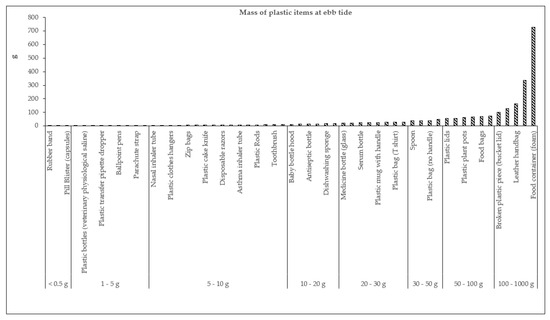
Figure 12.
The mass distribution of plastic items collected during ebb tide.
Items in the 5–30 g range, such as zip bags, disposable razors, plastic forks, and plastic bottles with handles, were also well-represented. These objects are heavier and more rigid than those in the lowest mass category, suggesting shorter transport distances and a tendency to accumulate near the source or obstruction points. These items often originate from household and food-related activities, reflecting local consumption patterns and inadequate waste segregation.
Notably, items weighing more than 50 g, including pesticide bottles, leather shoes, LED headlights, and foam food containers, were less abundant but contributed disproportionately to the total plastic mass. These heavier items are less mobile under tidal influence and tend to become trapped in vegetation, sediment, or artificial barriers [53]. Their presence indicates direct dumping or loss during transportation and poses increased challenges for manual retrieval and clean-up efforts.
Mass Distribution of Plastic Debris at Flood Tide
The mass composition of plastic debris collected during flood tide reveals a predominance of low-mass items, with a substantial contribution from a smaller number of high-mass objects (Figure 13). Items weighing less than 5 g—such as rubber bands, straws, gloves, and small plastic wrappers—were most frequently encountered. These are lightweight, buoyant, and easily transported by tidal currents, consistent with findings from [45], which emphasize the dispersal efficiency of small plastics in fluvial and tidal systems. The persistence of these items at flood tide suggests both widespread inputs and high mobility within the aquatic environment.
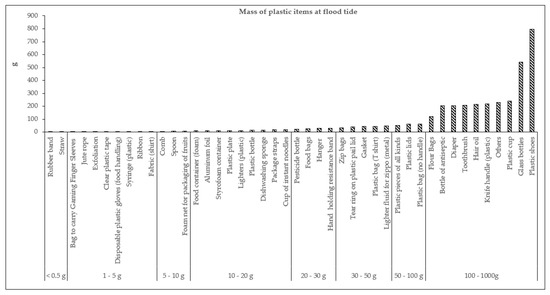
Figure 13.
The mass distribution of plastic items collected during flood tide.
Plastics in the 5–30 g range, including plastic bottles, instant noodle cups, spoons, and foam containers, were also prevalent. These objects tend to reflect local consumption and improper disposal in nearby communities. Their intermediate buoyancy allows them to float or partially submerge, increasing their likelihood of tidal retention or beaching, as noted by [57]. These items indicate frequent and repeated tidal exchange, especially in urban-impacted shorelines.
A notable fraction of debris fell into the 50–100 g and 100–1000 g categories, such as diapers, large bottle caps, knife handles, glass bottles, and plastic shoes. These heavy items, while less numerous, accounted for a disproportionately large share of total mass. Their accumulation at flood tide suggests limited transport mobility and deposition through localized littering or high-discharge events [28].
Compared to ebb tide, the presence of bulkier plastic objects during flood tide could be attributed to tidal inflow delivering debris from river mouths or estuarine zones, followed by deposition during ebb. Additionally, heavier plastics have a higher probability of being trapped in vegetation, floating booms, or embankment structures [53]. Their presence implies the need for specialized recovery strategies due to difficulty in manual retrieval.
Overall, the varied mass of plastic debris requires multiscale monitoring and removal strategies. For example, lightweight floating plastics may be intercepted using surface booms or floating traps, whereas heavier objects require shoreline surveillance and manual removal [28]. Light items require surface skimming systems or floating barriers, while heavier items may be addressed through localized surveillance, community clean-ups, or physical removal after storm or tidal events. Understanding mass-specific behavior is essential for predicting transport, identifying hotspots, and designing effective interception technologies [58].
3.3.4. Plastic Size Distribution
The classification of plastic debris into meso (5–25 mm), macro (25–1000 mm), and mega (>1000 mm) size categories at different tidal stages reveals key insights into plastic pollution dynamics in the aquatic system (Figure 14).
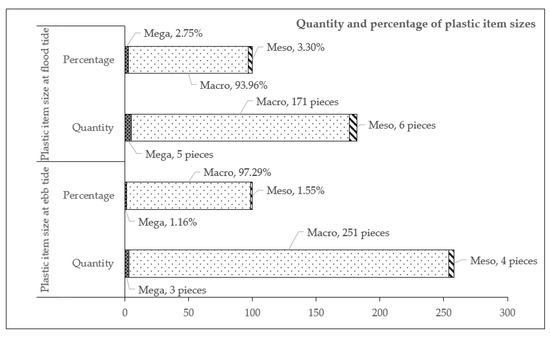
Figure 14.
Classification of plastic size at high and low tide.
The size distribution of plastic debris observed during flood and ebb tides revealed a clear dominance of macroplastics in both tidal conditions, albeit with slight variation in proportional representation. At ebb tide, macroplastic items accounted for 97.29% of total debris, while mesoplastics and megaplastics comprised only 1.55% and 1.16%, respectively. In contrast, flood tide conditions showed a marginally reduced macroplastic proportion (93.96%), with mesoplastics increasing to 3.30% and megaplastics to 2.75%. This shift suggests that tidal inflow may enhance the transport and deposition of smaller plastic fragments, particularly mesoplastics, which are more mobile and subject to hydrodynamic forces [45,50]. The slightly higher presence of megaplastics at flood tide may also reflect episodic deposition events driven by upstream sources or illegal dumping.
In terms of absolute quantity, ebb tide yielded a total of 258 plastic items, dominated by 251 macroplastic pieces, alongside 4 mesoplastics and 3 megaplastics. Meanwhile, flood tide resulted in a slightly lower total count of 182 items, with 171 macroplastics, 6 mesoplastics, and 5 megaplastics. Although the counts of mesoplastic and megaplastic items were very low, their slightly higher occurrence at flood tide may indicate a more varied size composition during this period. This pattern could be related to tidal transport or re-suspension processes, but further sampling would be needed to confirm such effects [28]. The consistently higher count of macroplastic items across both tides underscores the role of improperly managed waste and urban discharges as dominant sources of plastic pollution in the study area [57].
The overwhelming dominance of macroplastics (>90%) at both tides highlights their significance in aquatic litter studies and the need for focused removal and policy interventions. Given that macroplastics can fragment into mesoplastic and microplastics, their early interception is vital to prevent downstream ecological consequences, including ingestion by wildlife and sediment contamination [58]. Furthermore, the data suggests that tide influence not just quantity, but the diversity of plastic sizes, with flood tide being a more critical period for detecting mesoplastics. Monitoring strategies should therefore be designed to capture tidal variability in debris flux, using stratified sampling across tidal cycles to obtain representative data on plastic size distribution.
Overall, macroplastic debris represents the predominant size class in both tidal phases, reflecting both the persistence and common use of larger plastic items in urban environments. The detection of mesoplastics and megaplastics, particularly at flood tide, was a descriptive observation that may reflect increased variability in plastic transport and deposition during tidal inflow; however, this inference should be treated cautiously due to the small number of items recorded. These findings are in line with studies emphasizing the mobility of mesoplastics and the episodic nature of megaplastic deposition in riverine and estuarine systems [58]. A comprehensive monitoring strategy should therefore account for all size fractions, with particular attention to macroplastic dominance and the dynamic behavior of smaller and larger debris under varying hydrological conditions.
4. Conclusions
This study provides a comprehensive assessment of the density, composition, and transport dynamics of floating plastic waste in the Hau River, with a focus on the influence of tidal fluctuations, hydrometeorological conditions, and plastic characteristics. The findings highlight that meteorological factors—particularly wind direction, air temperature, and humidity—exert indirect but significant control over plastic mobility through their effects on surface currents and degradation processes. Concurrently, hydrological fluctuations, especially tidal phases and water volume changes, directly govern the spatial and temporal distribution of plastic debris. Plastic waste composition was dominated by macroplastics, with notable contributions from mesoplastics and episodic appearances of megaplastics, particularly during flood tide. The study underscores the importance of item properties—such as buoyancy, density, and degradation potential—in influencing transport, fragmentation, and deposition. Variations in mass and size distributions further emphasize the need for multitiered interception and monitoring approaches, tailored to target both light and heavy plastic fractions under dynamic flow conditions. Overall, the results reinforce the need for integrated, evidence-based management strategies that consider seasonal, meteorological, and hydrological variability to enhance the efficiency of plastic waste interception and reduce the risk of downstream transport to coastal and marine ecosystems. These insights are critical for informing sustainable riverine plastic pollution mitigation frameworks in Vietnam and similar tropical river systems.
Author Contributions
Conceptualization: N.T.T., H.V.T.M., K.L., P.V.T. and P.K.; Methodology: N.T.T., H.V.T.M., K.L. and N.V.C.N.; Formal Analysis: N.T.T., K.L. and N.V.C.N.; Sample collection and analysis: N.T.T., P.V.T., T.V.T., D.V.D., and V.T.T.; Resources: N.T.T., K.L., N.V.C.N. and V.T.T.; Writing—original draft preparation: N.T.T., H.V.T.M., K.L. and P.K.; Writing—review and editing: N.V.C.N., P.V.T., T.V.T., D.V.D. and P.K. All authors have read and agreed to the published version of the manuscript.
Funding
This research received no external funding.
Data Availability Statement
The data presented in this study are available from the corresponding author upon reasonable request.
Conflicts of Interest
The authors declare no conflicts of interest.
References
- OECD. Global Plastics Outlook: Economic Drivers, Environmental Impacts and Policy Options; OECD Publishing: Paris, France, 2022; Available online: https://espas.secure.europarl.europa.eu/orbis/system/files/generated/document/en/plastic.pdf (accessed on 6 May 2024).
- UNDP. Environment Week 2023: Joining Forces to Beat Plastic Pollution. 2023. Available online: https://www.undp.org/suriname/press-releases/environment-week-2023-joining-forces-beat-plastic-pollution (accessed on 6 May 2024).
- Lebreton, L.C.M.; Van der Zwet, J.; Damsteeg, J.W.; Slat, B.; Andrady, A.; Reisser, J. River plastic emissions to the world’s oceans. Nat. Commun. 2017, 8, 15611. [Google Scholar] [CrossRef]
- Van Calcar, C.J.; van Emmerik, T.H.M. Abundance of plastic debris across European and Asian rivers. Environ. Res. Lett. 2019, 14, 124051. [Google Scholar] [CrossRef]
- WWF-Vietnam. Report on Plastic Waste Generation in 2022; Thanh Nien Publishing House: Hanoi, Vietnam, 2023; Available online: https://wwfasia.awsassets.panda.org/downloads/wwf_a4_bao-cao-chat-thai-nhua-final--a--ne-n.pdf (accessed on 6 May 2024). (In Vietnamese)
- Anh, N. Every Year Vietnam Releases 1.8 Million Tons of Plastic Waste into the Environment. 2024. Available online: https://vneconomy.vn/moi-nam-viet-nam-thai-ra-moi-truong-1-8-trieu-tan-rac-thai-nhua.htm (accessed on 6 May 2024). (In Vietnamese).
- MCD. Reducing Plastic Waste Pollution on the Red River—Results and Lessons Learned from Nam Dinh. 2023. Available online: https://mcdvietnam.org/giam-thieu-o-nhiem-rac-thai-nhua-tren-song-hong-nhung-ket-qua-va-bai-hoc-kinh-nghiem-tu-nam-dinh (accessed on 6 May 2024). (In Vietnamese).
- Department of Natural Resources and Environment of Nam Dinh Province. Project Summary Conference: “Reducing Plastic Waste Pollution on the Red River”. 2023. Available online: https://sotnmt.namdinh.gov.vn/vi-vn/tin-tuc/moi-truong-52/hoi-nghi-tong-ket-du-an-giam-thieu-o-nhiem-rac-thai-nhua-tren-song-hong (accessed on 6 May 2024). (In Vietnamese)
- Ministry of Natural Resources and Environment. Pressure of Plastic Waste in the Downstream of Vu Gia–Thu Bon River. 2019. Available online: https://baotainguyenmoitruong.vn/ap-luc-rac-thai-nhua-o-ha-luu-song-vu-gia-thu-bon-96374.html (accessed on 6 May 2024). (In Vietnamese).
- Chung, K.L.T.; Strady, E. Life Cycle of Floating Debris in the Canals of Ho Chi Minh City. 2016. Available online: https://horizon.documentation.ird.fr/exl-doc/pleins_textes/divers17-07/010070479.pdf (accessed on 6 May 2024).
- Thanh, P.D.; Hoang, B.T.; Dat, N.T.; Duy, N.H.; Son, T.B. Characteristics of Plastic Waste Floating on the Saigon River and Nha Be River. 2021. Available online: https://tapchimoitruong.vn/nghien-cuu-23/dac-diem-rac-nhua-noi-tren-song-sai-gon-va-song-nha-be-25536 (accessed on 6 May 2024). (In Vietnamese).
- Schmidt, C.; Krauth, T.; Wagner, S. Export of plastic debris by rivers into the sea. Environ. Sci. Technol. 2017, 51, 12246–12253. [Google Scholar] [CrossRef]
- Haberstroh, C.J.; Arias, M.E.; Yin, Z.; Sok, T.; Wang, M.C. Plastic transport in a complex confluence of the Mekong River in Cambodia. Environ. Res. Lett. 2021, 16, 095009. [Google Scholar] [CrossRef]
- IUCN. Program to Monitor and Evaluate Plastic Waste on Vietnam’s Coast—Report 2020. 2021. Available online: https://www.iucn.org/sites/default/files/content/documents/2021/beach_debris_mornitoring_2020_report_vietnamese_-_1_july_2021.pdf (accessed on 6 May 2024). (In Vietnamese).
- Mekong River Commission. State of the Basin Report 2018; Mekong River Commission: Vientiane, Laos, 2019; Available online: https://www.mrcmekong.org/wp-content/uploads/2024/08/State-of-the-Basin-Report-2018-1.pdf (accessed on 6 May 2024)ISSN 1728-3248.
- Quyen, N.T.K.; Berg, H.; Gallardo, W.; Da, C.T. Stakeholders’ perceptions of ecosystem services and Pangasius catfish farming development along the Hau River in the Mekong Delta, Vietnam. Ecosyst. Serv. 2017, 25, 2–14. [Google Scholar] [CrossRef]
- Tuan, L.A.; Hoang, T.T.; Vo, V.N. Water Resource Variation in the Hau River Mouth. J. Fish. Sci. Tech. Spec. Issues 2015, 2015, 50–56. [Google Scholar]
- An, L. Concerns About Environmental Pollution of the Hau River—Lesson 1: The Role of the Hau River. 2017. Available online: https://thuonghieucongluan.com.vn/noi-lo-o-nhiem-moi-truong-song-hau-bai-1-vai-tro-cua-song-hau-a39559.html (accessed on 6 May 2024). (In Vietnamese).
- Viet Nam National Mekong Committee. Mekong River Basin in Vietnam. 2021. Available online: https://vnmc.gov.vn/?p=719 (accessed on 6 May 2024). (In Vietnamese)
- Viet Nam National Mekong Committee. Mekong River Basin. 2021. Available online: https://vnmc.gov.vn/?page_id=1878 (accessed on 6 May 2024). (In Vietnamese)
- Tien, N.N.; Thanh, N.T.; Dang, V.H. Hydrodynamic and environmental characteristics during dry season in the Hau River mouth area. Viet. J. Mar. Sci. Tech. 2015, 15, 235–241. [Google Scholar] [CrossRef]
- Department of Natural Resources and Environment of An Giang Province. Distribution of Water Resources. 2023. Available online: https://sotainguyenmt.angiang.gov.vn/TongQuan_TNN1.aspx (accessed on 6 May 2024). (In Vietnamese)
- Dien, T.L.T. Research Forecasting the Stabilization of the Hau River Flowing Through An Giang Province and Proposing Appropriate Shore Protection Solutions. Ph.D. Thesis, Ho Chi Minh City University of Technology, Ho Chi Minh City, Vietnam, 2021. (In Vietnamese). [Google Scholar]
- Institute of Coastal and Offshore Engineering. Tide Table Forecast for 2024; Institute of Coastal and Offshore Engineering: Ho Chi Minh City, Vietnam, 2024. (In Vietnamese) [Google Scholar]
- UNEP. Monitoring Plastics in Rivers and Lakes: Guidelines for the Harmonization of Methodologies; United Nations Environment Programme: Nairobi, Kenya, 2020; Available online: https://wedocs.unep.org/xmlui/bitstream/handle/20.500.11822/35834/MPRLS.pdf (accessed on 6 May 2024)ISBN 978-92-807-3819-3.
- van Emmerik, T.; Kieu-Le, T.-C.; Loozen, M.; van Oeveren, K.; Strady, E.; Bui, X.-T.; Egger, M.; Gasperi, J.; Lebreton, L.; Nguyen, P.-D.; et al. A methodology to characterize riverine macroplastic emission into the ocean. Front. Mar. Sci. 2018, 5, 372. [Google Scholar] [CrossRef]
- Tramoy, R.; Gasperi, J.; Colasse, L.; Silvestre, M.; Dubois, P.; Noûs, C.; Tassin, B. Transfer dynamics of macroplastics in estuaries—New insights from the Seine estuary: Part 2. Short-term dynamics based on GPS-trackers. Mar. Pollut. Bull. 2020, 160, 111566. [Google Scholar] [CrossRef]
- González-Fernández, D.; Hanke, G. Toward a harmonized approach for monitoring of riverine floating macro litter inputs to the marine environment. Front. Mar. Sci. 2017, 4, 86. [Google Scholar] [CrossRef]
- Moore, C.J.; Lattin, G.L.; Zellers, A.F. Quantity and type of plastic debris flowing from two urban rivers to coastal waters and beaches of Southern California. J. Integr. Coast. Zone Manag. 2011, 11, 65–73. [Google Scholar] [CrossRef]
- SpecialChem. Density of Plastics: Technical Properties. 2024. Available online: https://omnexus.specialchem.com/polymer-property/density (accessed on 6 May 2024).
- Grigorescu, R.M.; Grigore, M.E.; Iancu, L.; Ghioca, P.; Ion, R.M. Waste electrical and electronic equipment: A review on the identification methods for polymeric materials. Recycling 2019, 4, 32. [Google Scholar] [CrossRef]
- UNEP. Agenda Item 4: Development of Guidelines for Monitoring Riverine Inputs of Marine Litter; United Nations Environment Programme: Nairobi, Kenya, 2022; Available online: https://wedocs.unep.org/bitstream/handle/20.500.11822/40264/22wg534_04_eng.pdf?sequence=1&isAllowed=y (accessed on 6 May 2024).
- General Oceanics, Inc. 2030 and 2031 Series Mechanical and Electronic Digital Flowmeter Operators Manual. 2018. Available online: https://www.generaloceanics.com/media/hexaattachment/products/attachments/2030_MANUAL.pdf (accessed on 6 May 2024).
- UNEP. Single-Use Plastics: A Roadmap for Sustainability; United Nations Environment Programme: Nairobi, Kenya, 2018; Available online: https://mpma.org.my/v4/wp-content/uploads/2020/12/7.-singleUsePlastic_sustainability.pdf (accessed on 6 May 2024)ISBN 978-92-807-3705-9.
- Kaiser, D.; Kowalski, N.; Waniek, J.J. Effects of Biofouling on the Sinking Behavior of Microplastics. Environ. Res. Lett. 2017, 12, 124003. [Google Scholar] [CrossRef]
- Gewert, B.; Plassmann, M.M.; MacLeod, M. Pathways for degradation of plastic polymers floating in the marine environment. Environ. Sci.: Processes Impacts 2015, 17, 1513–1521. [Google Scholar] [CrossRef]
- Lebreton, L.C.-M.; Greer, S.D.; Borrero, J.C. Numerical modelling of floating debris in the world’s oceans. Mar. Pollut. Bull. 2012, 64, 653–661. [Google Scholar] [CrossRef] [PubMed]
- Reisser, J.; Slat, B.; Noble, K.; du Plessis, K.; Epp, M.; Proietti, M.; de Sonneville, J.; Becker, T.; Pattiaratchi, C. The vertical distribution of buoyant plastics at sea: An observational study in the North Atlantic Gyre. Biogeosciences 2015, 12, 1249–1256. [Google Scholar] [CrossRef]
- Chen, Z.; Li, G.; Bowen, M.; Coco, G. Retention of Buoyant Plastic in a Well-Mixed Estuary Due to Tides, River Discharge and Winds. Mar. Pollut. Bull. 2023, 194, 115395. [Google Scholar] [CrossRef] [PubMed]
- Horton, A.A.; Walton, A.; Spurgeon, D.J.; Lahive, E.; Svendsen, C. Microplastics in freshwater and terrestrial environments: Evaluating the current understanding to identify the knowledge gaps and future research priorities. Sci. Total Environ. 2017, 586, 127–141. [Google Scholar] [CrossRef]
- Schreyers, L.J.; van Emmerik, T.H.; Bui, T.K.L.; Biermann, L.; Uijlenhoet, R.; Nguyen, H.Q.; Wallerstein, N.; van der Ploeg, M. Water hyacinths retain river plastics. Environ. Pollut. 2024, 356, 124118. [Google Scholar] [CrossRef]
- Dinh, T.; Soc Trang weather forecast. SocTrang Online. 2024. Available online: https://baosoctrang.org.vn/thoi-tiet/202404/du-bao-thoi-tiet-soc-trang-ngay-294-57e4a35/ (accessed on 6 May 2024). (In Vietnamese).
- Windsor, F.M.; Tilley, R.M.; Tyler, C.R.; Ormerod, S.J. Microplastic ingestion by riverine macroinvertebrates. Sci. Total Environ. 2019, 646, 68–74. [Google Scholar] [CrossRef]
- Jambeck, J.R.; Geyer, R.; Wilcox, C.; Siegler, T.R.; Perryman, M.; Andrady, A.; Law, K.L. Plastic waste inputs from land into the ocean. Science 2015, 347, 768–771. [Google Scholar] [CrossRef]
- van Emmerik, T.; Schwarz, A. Plastic debris in rivers. Wiley Interdiscip. Rev. Water 2019, 7, e1398. [Google Scholar] [CrossRef]
- Andrady, A.L. Microplastics in the marine environment. Mar. Pollut. Bull. 2011, 62, 1596–1605. [Google Scholar] [CrossRef]
- Rochman, C.M.; Hoh, E.; Kurobe, T.; Teh, S.J. Ingested plastic transfers hazardous chemicals to fish and induces hepatic stress. Sci. Rep. 2013, 3, 3263. [Google Scholar] [CrossRef]
- Wright, S.L.; Thompson, R.C.; Galloway, T.S. The physical impacts of microplastics on marine organisms: A review. Environ. Pollut. 2013, 178, 483–492. [Google Scholar] [CrossRef] [PubMed]
- UNEP. From Pollution to Solution: A Global Assessment of Marine Litter and Plastic Pollution; United Nations Environment Programme: Nairobi, Kenya, 2021. [Google Scholar]
- Rech, S.; Macaya-Caquilpán, V.; Pantoja, J.F.; Rivadeneira, M.M.; Jorquera, M.A.; Thiel, M. Rivers as a source of marine litter—A study from the SE Pacific. Mar. Pollut. Bull. 2014, 82, 66–75. [Google Scholar] [CrossRef]
- Hopewell, J.; Dvorak, R.; Kosior, E. Plastics recycling: Challenges and opportunities. Philos. Trans. R. Soc., B 2009, 364, 2115–2126. [Google Scholar] [CrossRef]
- Browne, M.A.; Crump, P.; Niven, S.J.; Teuten, E.; Tonkin, A.; Galloway, T.; Thompson, R. Accumulation of microplastic on shorelines worldwide: Sources and sinks. Environ. Sci. Technol. 2011, 45, 9175–9179. [Google Scholar] [CrossRef] [PubMed]
- Schreyers, L.J.; van Emmerik, T.H.; Bui, T.K.L.; van Thi, K.L.; Vermeulen, B.; Nguyen, H.Q.; Wallerstein, N.; Uijlenhoet, R.; van der Ploeg, M. River plastic transport affected by tidal dynamics. Hydrol. Earth Syst. Sci. 2024, 28, 589–610. [Google Scholar] [CrossRef]
- GESAMP. Sources, Fate and Effects of Microplastics in the Marine Environment: A Global Assessment; Rep. Stud. GESAMP No., 90, Kershaw, P.J., Eds.; IMO/FAO/UNESCO-IOC/UNIDO/WMO/IAEA/UN/UNEP/UNDP Joint Group of Experts on the Scientific Aspects of Marine Environmental Protection: London, UK, 2015; 96p, Available online: http://www.gesamp.org/publications/reports-and-studies-no-90 (accessed on 6 May 2024).
- Li, J.; Liu, H.; Chen, J.P. Microplastics in freshwater systems: A review on occurrence, environmental effects, and methods for microplastics detection. Water Res. 2018, 137, 362–374. [Google Scholar] [CrossRef] [PubMed]
- Corcoran, P.L.; Biesinger, M.C.; Grifi, M. Plastics and beaches: A degrading relationship. Mar. Pollut. Bull. 2009, 58, 80–84. [Google Scholar] [CrossRef] [PubMed]
- Blettler, M.C.; Ulla, M.A.; Rabuffetti, A.P.; Garello, N. Plastic pollution in freshwater ecosystems: Macro-, meso-, and microplastic debris in a floodplain lake. Environ. Monit. Assess. 2017, 189, 581. [Google Scholar] [CrossRef] [PubMed]
- Koelmans, A.A.; Kooi, M.; Law, K.L.; van Sebille, E. All is not lost: Deriving a top-down mass budget of plastic at sea. Environ. Res. Lett. 2017, 12, 114028. [Google Scholar] [CrossRef]
Disclaimer/Publisher’s Note: The statements, opinions and data contained in all publications are solely those of the individual author(s) and contributor(s) and not of MDPI and/or the editor(s). MDPI and/or the editor(s) disclaim responsibility for any injury to people or property resulting from any ideas, methods, instructions or products referred to in the content. |
© 2025 by the authors. Licensee MDPI, Basel, Switzerland. This article is an open access article distributed under the terms and conditions of the Creative Commons Attribution (CC BY) license (https://creativecommons.org/licenses/by/4.0/).