Article

Estimation of Hydraulic Conductivity from Well Logs for the Parameterization of Heterogeneous Multilayer Aquifer Systems

by
Boris Lora-Ariza
*,
Luis Silva Vargas
and
Leonardo David Donado
HYDS-Hydrodynamics of the Natural Media Research Group, Universidad Nacional de Colombia, Sede Bogotá 111321, Colombia
*
Author to whom correspondence should be addressed.
Water 2025, 17(16), 2439; https://doi.org/10.3390/w17162439
Submission received: 20 July 2025 / Revised: 10 August 2025 / Accepted: 15 August 2025 / Published: 18 August 2025
(This article belongs to the Special Issue Application of Geophysical Methods for Hydrogeology—Second Edition)

Abstract

This study presents a methodology for estimating hydraulic conductivity (K) from well geophysical logs, with the aim of improving the parameterization of hydrogeological models in data-scarce regions. The lack of data poses a challenge for aquifer characterization, especially in contexts requiring integrated groundwater management. In such contexts, indirect methods can support estimation of key hydraulic parameters. The proposed methodology was applied to wells which penetrate Neogene–Quaternary hydrogeological units of the sedimentary aquifer system in the Middle Magdalena Valley, Colombia. Effective porosity was estimated from sonic and gamma ray logs, while temperature profiles were derived from the regional geothermal gradient and calibrated with field measurements. Hydraulic conductivity was estimated using an approach based on the Csókás method and validated through comparison with 131 pumping tests and alignment with the parameterization of a previously calibrated regional groundwater flow model. Pumping tests yielded geometric mean K values of 1.56 m/day in floodplain deposits (QFal), 1.36 m/day in U4, and 0.96 m/day in U3. K values from well logs ranged from 1.65 to 2.95 m/day, within the same order of magnitude. These findings support the proposed methodology as a viable alternative for the parameterization of numerical hydrogeological models in data-scarce environments.

1. Introduction

In many tropical developing countries, including Colombia, surface water has traditionally been prioritized over groundwater to meet water demand [1,2]. However, shifts in settlement dynamics, contamination of surface water sources, and climate variability have increasingly contributed to greater reliance on groundwater resources in recent decades [3]. This trend highlights the need to better understand aquifer system heterogeneity in order to support sustainable management, particularly in regions where a systematic approach to groundwater monitoring has not yet been implemented [4].
Integrated groundwater management is a structured process aimed at promoting coordination between groundwater management and related resources, including surface water, with the objective of achieving a balance among economic, social, and environmental goals [5]. However, its implementation faces significant challenges, among which are lack of long-term monitoring of natural systems, limited understanding of aquifer systems, and the fact that no environmental system, including aquifers, can be perfectly characterized [5,6,7,8]. This limitation arises primarily from the need to infer many fundamental characteristics such as hydraulic parameters, which introduces uncertainty into their estimation [5,9].
To date, research has focused on heterogeneous multilayer aquifers, that is, aquifers composed of discrete permeable layers separated by less permeable units [10,11], typically found in sedimentary strata of alluvial origin [12,13] and particularly distributed in areas near rivers [14].
Mailva (2016) defines hydrogeological characterization as the process of evaluating the hydraulic properties, geological structure, and hydrochemistry of an aquifer system [15]. In this context, hydrogeological modeling is a fundamental tool that enables the integration and analysis of this information [10,16,17].
The accuracy and reliability of hydrogeological models largely depends on reducing uncertainty in the estimation of input parameters, particularly hydraulic parameters [18,19,20]. Therefore, this study aims to obtain information that may be used for the parameterization of these models.
Parameterization of groundwater models typically involves assigning hydraulic parameters, along with transport parameters when applicable, to model cells or specific zones in space and time [21,22]. Determining the optimal level of parameterization is one of the greatest challenges in groundwater modeling, as over-parameterization increases computational time and can also lead to numerical instability, non-uniqueness in the solution, and predictive errors in the resulting model [23,24,25,26]. Conversely, insufficient refinement may fail to capture heterogeneities within the model, thereby increasing uncertainty in the characterization of the medium and reducing its predictive capability [27,28]. However, this study does not aim to determine the optimal degree of parameterization; rather, our goal is to estimate hydraulic conductivity values that may contribute to improving parameterization and reducing uncertainty.
In the parameterization process, the accurate assignment of hydraulic conductivity values or ranges to predefined zones with similar hydrogeological characteristics requires obtaining the maximum possible amount of hydraulic information possible. However, it is important to note that hydraulic conductivity values vary depending on both the scale of analysis and the method used for their estimation [15,29,30,31].
A broad array of methods, both direct and indirect, has been developed for the determination of hydraulic parameters, including hydraulic conductivity. In the laboratory, for example, techniques include permeability analysis of cuttings and core samples as well as sand grain size analysis [32,33,34]. In addition, numerous in situ tests are well documented and widely used in practice, including traditional hydraulic tests such as constant head tests, packer tests, single well tests, slug tests, recovery tests, and hydraulic tomography [35,36,37,38,39]. Furthermore, indirect approaches have been developed based on empirical equations [40,41,42,43], artificial neural networks [44,45,46], inverse numerical modeling [47,48], and well geophysical techniques [49,50,51], although the latter are currently less commonly used in groundwater studies.
However, most of these methods yield hydraulic conductivity estimates at local, well, or even finer scales, whereas hydrogeological modeling for integrated water management is typically performed at larger spatial scales, such as regional or basin-wide levels [5]. Therefore, when parameterizing the model, it is essential to consider that hydraulic conductivity values are scale-dependent and tend to increase as the scale of analysis becomes larger [29,31].
The use of well geophysical logs for hydraulic conductivity estimation emerges as a viable alternative to enhance the hydraulic information used in parameterization, with a particular focus on its application in data-scarce regions. The methodology developed in this study is based on sonic, gamma ray, and resistivity logs, complemented by empirical equations for the indirect estimation of hydraulic conductivity. Additionally, it incorporates the estimation of temperature logs based on the geothermal gradient of the study area.
Nevertheless, despite the growing interest in integrating geophysical tools into hydrogeological characterization, there remains a notable scarcity of studies focused on estimating hydraulic conductivity from well geophysical logs that are validated in the same study through both pumping test interpretation and calibrated numerical groundwater modeling. In this context, the present study aims to contribute to closing this gap by developing and applying a methodology that integrates geophysical logs with empirical data and numerical simulations in a highly heterogeneous and multilayered alluvial aquifer system.
The proposed methodology was validated by comparing estimated hydraulic conductivity values with results from 131 pumping tests conducted in the Middle Magdalena Valley (MMV), and was further corroborated by using the calibrated values in a regional-scale numerical groundwater flow model developed for the MMV under a data scarcity scenario.
To implement the proposed methodology, the alluvial aquifer system of the Middle Magdalena Valley (VMM) was selected as the case study, since it presents suitable conditions for its development and application. The VMM is a predominantly rural region that faces multiple challenges in water management, including inadequate sanitation infrastructure, limited access to surface water during the dry season, and significant land use changes [3]. These transformations have altered the landscape, evolving from rice monoculture to the large-scale expansion of African Oil Palm plantations [3].
Moreover, the effective management of groundwater is significantly constrained by the absence of adequate monitoring systems, particularly due to the lack of multi-purpose observation networks that enable consistent and systematic data collection at regional scales [52,53,54]. It is also hindered by the scarcity of hydraulic data, particularly information related to key hydraulic parameters, which are frequently obtained through pumping tests [5]. Therefore, this study proposes and validates a methodology for estimating hydraulic conductivity from borehole geophysical logs. Its implementation aims to strengthen the parameterization of hydrogeological models to support integrated groundwater management in regions with limited hydrogeological information, particularly in heterogeneous and complex media.
The results obtained in this study validate the proposed methodology, highlighting its potential as a practical alternative to improve the parameterization of hydrogeological models under data-scarce conditions. Its application in the alluvial aquifer system of the Middle Magdalena Valley illustrates the potential of using geophysical well logs to estimate key hydraulic parameters and support the parameterization of regional-scale groundwater models in regions with limited hydrogeological information.

2. Materials and Methods

2.1. Study Area

2.1.1. Location

The study area is geographically situated between latitudes 8°30′00″ and 6°54′00″ N and longitudes 73°21′00″ and 74°06′00″ W, encompassing portions of five Departments, which are the National Administrative Divisions in Colombia (Figure 1A). Covering approximately 8515.6 km2, the region lies within the plain zone at the Piedmont of the Central and Eastern Andean Ranges, in the northern part of the Middle Magdalena Valley (MMV). The MMV is characterized by predominantly flat terrain, with elevation around 50 m above sea level (masl) and minor hills rising up to 288 masl (Figure 1B), resulting in an average annual temperature of approximately 27 °C. The local economy is supported by a variety of activities, including mining, agriculture, domestic and industrial services, livestock farming, aquaculture, construction, and oil and gas upstream [3,55].

2.1.2. Geological Setting

The Middle Magdalena Valley Basin (MMV) has undergone various tectonic phases throughout its geological evolution [56]. Initially, during the uplift of the Central Cordillera, it was configured as an intra-arc basin, later evolving into a fore-arc basin following the completion of that uplift. Finally, with the rise of the Eastern Cordillera, the basin is now classified as an intermontane basin [57,58]. The basement of the basin consists of metamorphic rocks associated with the Central Cordillera, over which Mesozoic and Cenozoic strata have been discontinuously deposited [59].
The sedimentary units in the MMV are dominated by clastic sediments of alluvial origin, which include sedimentary rocks with varying degrees of consolidation. Coarse-grained materials such as sands and gravels are predominant, and are interbedded with fine-grained materials such as clays and silts, which are typical characteristics of sedimentary depositional environments [60,61].

2.1.3. Hydrogeological Context

The Neogene–Quaternary deposits (Figure 1C) constitute the hydrogeological units with the greatest potential for groundwater exploitation in the study area [62]. In the southern portion of the area, the Real Group, a Neogene formation with a stratigraphic thickness ranging from 450 to 3500 m, crops out. This group is subdivided into four hydrogeological units (U1 to U4). Unit U4, the most recent and shallowest, generally exhibits the highest hydraulic conductivity, whereas Units U1 and U2, which are the oldest, tend to show the lowest values [3,63]. In contrast, the central and northern sectors of the study area are characterized by Quaternary deposits that unconformably overlie the Real Group. These deposits are distributed across various landforms, including alluvial fans, terraces, and alluvial deposits, shaped by the influence of the Magdalena, Lebrija, and Sogamoso rivers, as well as swampy areas with fluvio-lacustrine deposits and floodplains [3,62,64].
Groundwater flows within the Neogene–Quaternary deposits are primarily controlled by topography, with the predominant flow direction running from south to north. Additionally, secondary east-–west flow components are driven by recharge processes in the Eastern Range, and discharge into the Magdalena River and adjacent lagoon complexes [64,65,66].

2.2. Methodology and Data Acquisition

This chapter presents the methodology proposed for estimating hydraulic conductivity based on the analysis of geophysical borehole logs (Figure 2), specifically sonic transit time, gamma ray, and resistivity logs.
The procedure begins with the identification of the available geophysical logs. Total porosity is then estimated from the sonic log using the Wyllie time-average equation ([67]). The gamma ray index is also calculated. These two parameters are subsequently used to estimate the effective porosity, which is a key input for the hydraulic conductivity estimation process. It is important to note that the effective porosity depends on both the total porosity and clay volume. In this study, the clay volume was assumed to be equivalent to the gamma ray index, which corresponds to a linear assumption, as proposed in [68]. Nonetheless, this index can also be estimated through nonlinear methods.
In addition to the effective porosity, estimation of hydraulic conductivity using the proposed methodology requires temperature data. Because temperature logs are not commonly included in standard geophysical surveys, and considering that this study was conducted in a data-scarce context, temperature was estimated using the geothermal gradient of the study area. Based on these inputs, hydraulic conductivity was calculated for each analyzed well and subsequently validated by comparing the results with data from pumping tests using a statistical characterization of the hydrogeological units intersected by the wells. Additionally, the results were corroborated against hydraulic conductivity values calibrated through the implementation of a regional-scale groundwater flow model.

2.2.1. Porosity Estimation

Porosity was estimated using the Wyllie time-average equation [67], a widely accepted method for consolidated sandstones [69], which is commonly expressed as Equation (1):
ϕ s = Δ t Δ t ma Δ t f Δ t ma
where ϕ s (%) is the calculated porosity, Δ t ( μ s/ft) is the sonic transit time, Δ t ma ( μ s/ft) represents the sonic transit time of the matrix, and Δ t f ( μ s/ft) is the sonic transit time of the fluid. In this study, we assumed a Δ t ma of 55.5 ( μ s/ft), typical of sandstones, and a Δ t f of 189 ( μ s/ft), characteristic of fresh mud, as suggested by [69].

2.2.2. Gamma Ray Index Calculation

The gamma ray index, which is used to estimate clay content in hydrogeological formations, was calculated based on a linear correlation with gamma ray logs in each well [70,71,72], as shown in Equation (2):
i GR = GR GR min GR max GR min
where I GR represents the gamma ray index, GR denotes the measured gamma ray value at each point, GR min is the minimum gamma ray value recorded in the log, and GR max is the maximum recorded value.

2.2.3. Clay Volume Estimation

The clay volume ( V Sh ) can be estimated using different empirical approaches based on the gamma ray index ( I GR ). A common initial assumption is to consider V Sh equal to I GR , which corresponds to a linear estimation method [68]. However, several nonlinear methods have also been proposed in the literature, including those developed by Steiber, Clavier, and Larionov [73,74]. In this study, clay volume was estimated using the linear approach, assuming V Sh = I GR , as this provides a simplified and practical solution in data-scarce contexts.

2.2.4. Effective Porosity Estimation

Based on the initial porosity calculation and the estimation of clay volume, effective porosity was quantified by applying the clay volume correction for effective porosity following the methodology described by Twfiq et al. (2021) [75], as provided by Equation (3):
ϕ eff = ϕ s · ( 1 V Sh )
where ϕ eff (%) is the effective porosity and V Sh represents the clay volume. For its calculation from gamma ray well logs, the first step involves estimating the gamma ray index.

2.2.5. Temperature

The deterministic methodology proposed by Csókas (1995) for calculating hydraulic conductivity from well logs requires temperature data, which are not always available. To address this limitation, this study applies an indirect approach based on the geothermal gradient of the aquifer. This gradient was previously estimated for the Middle Magdalena Valley through the analysis of 2329 temperature logs, yielding an average value of 22.2 °C/km with R 2 = 0.886 [76]. Accordingly, groundwater temperature as a function of depth is expressed by the linear Equation (4):
z = 50.274 T + 1455.9
where T is the estimated groundwater temperature in degrees Celsius (°C) and z is the depth in meters. Using this equation, temperature can be estimated at different depths.
Our methodology for correcting the estimated temperatures involved initially calculating the average temperature ( T ¯ ) across the interval defined by the available geo-electrical logs, denoted as [ z 1 , z 2 ] . In this context, z 1 represents the shallowest depth at which well log data are available, while z 2 corresponds to the deepest recorded depth for each well. As such, this interval covers the complete section of the well for which geophysical data were recorded. This average temperature was computed as shown in Equation (5):
T ¯ = 1 z 1 z 2 z 1 z 2 z 1455.9 50.274 d z .
For simplicity, the calculation of T ¯ can be approximated in discrete form using the depth values available from the well logs, where the temperature at each depth is estimated from the geothermal gradient equation and all values are subsequently averaged.
In some cases, discrete water temperature measurements ( T m ) were obtained by pumping the well for several minutes until the readings stabilized. This stabilized value was assumed to represent the average water temperature within the saturated interval [ z 1 , z 2 ] , under the premise that prolonged pumping ensures that the measurement reflects aquifer water and not stagnant water in the well. When such measurements were available, the estimated temperature from the geothermal gradient was refined by applying a constant correction, as provided by Equation (6):
Δ T = T m T ¯ .
The corrected temperature was then calculated according to Equation (7):
T c = z + 1455.9 50.274 + Δ T .
Afterwards, the corrected temperature ( T c ) was used for hydraulic conductivity estimation. It should be noted that when direct temperature logs are available for a well, the use of a regional geothermal gradient becomes unnecessary. In such cases, the measured temperature profile should be preferred, as it provides a more accurate representation of in situ thermal conditions and avoids the uncertainty associated with indirect estimations from regional gradients.

2.2.6. Hydraulic Conductivity Estimation

Hydraulic conductivity was estimated using the deterministic procedure proposed by Csókas (1995), which relies solely on well log data [77], as shown in Equation (8):
K = C k · ϕ eff 3 ( 1 ϕ eff ) 4 · log R 0 R w 2 R 0 R w · ϕ eff 1.2
where C k = 855.7 C t C d 2 is a proportionality constant in which R 0 denotes the resistivity of the rock matrix, calculated from the resistivity log, and R w represents the resistivity of the pore water; in addition, C d is a site-specific constant, set in this study to C d = 5.22 × 10 4 . The term C t is provided by C t = 1 + 3.37 × 10 2 T + 2.21 × 10 4 T 2 , with T (°C) as the temperature [78].

2.2.7. Pumping Tests

Hydraulic test interpretation is the primary field method for determining the hydraulic properties of the subsurface [35]. In this study, 131 pumping tests were compiled and reinterpreted. Utilizing the geological understanding of the study area, a statistical characterization of the hydrogeological units was conducted based on estimated hydraulic conductivity values. Based on this analysis, the methodology implemented to estimate hydraulic conductivity values from well logs was validated by comparing the results obtained with the characterization performed using conventional hydraulic tests.
The interpretation process involved three fundamental steps: (1) data preprocessing, (2) selection of an appropriate interpretation model, and (3) estimation of hydraulic parameters by fitting test data to the theoretical curves of current models [79]. During data preprocessing, outliers were removed from the drawdown-versus-pumping time curve. To reduce noise in the data, a digital Butterworth filter was applied using Hytool Version 2.0.5 [80,81]. In this study, outliers were attributed to human error during drawdown measurements, inaccuracies in data digitization, and fluctuations in pumping rates caused by temporary variations in the power supply during the test.
It is worth noting that the study area is predominantly rural, meaning that most of the hydraulic tests were conducted using fuel-powered electric generators to operate the pumps. These generators are susceptible to voltage fluctuations [82], which can frequently affect the stability of the flow rate during tests.
The interpretation of the pumping test results followed the methodology proposed by Renard [79], which assesses aquifer response to pumping-induced disturbances. This procedure involves simultaneously plotting drawdown and its derivative as a function of time on logarithmic and semi-logarithmic scales. These plots are then compared to a set of typical diagnostic plots described in [79], allowing for selection of the most suitable interpretation method for the observed aquifer behavior.
Finally, the hydraulic parameters were estimated using AQTESOLV software, version 4.5 Pro [83].

2.2.8. Regional-Scale Groundwater Flow Model

Numerical models of groundwater flow are widely applied as essential tools for gaining insight into the overall behavior of aquifer systems [84]. The fundamental components that must be considered during the construction of any groundwater flow model have been synthesized into five key elements, based on the approaches proposed by Marsily et al. (1998) [85] and Anderson and Woessner (2015) [22]. These components are: (1) defining the purpose of the modeling effort; (2) developing a conceptual model of the hydrogeological system; (3) selecting an appropriate modeling code; (4) building the numerical model, including its parameterization based on pumping tests and other aquifer characterization data sources; and (5) calibrating the model.
  • Modeling Objectives
    To validate the methodology proposed in this study, a regional-scale groundwater flow model was developed for the study area. The primary objective of the model is to evaluate the estimated hydraulic conductivity values by calibrating them through inverse modeling. The calibration targets consist of observed hydraulic heads at multiple groundwater monitoring points across the region, including wells, piezometers, and hand-dug wells.
  • Conceptual Model
    The conceptual model is defined as a graphical and qualitative representation of the aquifer system based on hypotheses regarding its hydrodynamic behavior. It describes the main characteristics of the hydrogeological system, such as boundary conditions, hydrogeological units, and other relevant features [22,86].
    The proposed conceptual model (Figure 3) represents the regional aquifer system of the MMV, exclusively considering the Neogene–Quaternary deposits of the sedimentary system. Accordingly, the hydrogeological basement is assumed to be composed of the Colorado Formation, which underlies the Real Group.
    Based on piezometric data collected from 434 water points, a main regional groundwater flow direction with a south-to-north flow direction was identified, discharging into swampy bodies located in the northern part of the study area. Additionally, intermediate flow paths were observed in an east–west direction, originating from the alluvial fans of Aguachica and discharging into the Magdalena River.
    Annual average precipitation ranges from 3700 mm/year in the south to 1000 mm/year in the north [62]. For this reason, recharge was considered as a spatially distributed input, accounting for both the precipitation variability and land use/land cover conditions described by Lora et al. (2024) [3]. Recharge constituted one of the parameters calibrated during the numerical modeling process.
  • Numerical Modeling Code
    FEFLOW version 8.1 was used as the modeling code for the implementation of the numerical model. This software applies the finite element method and is designed for simulating flow and transport processes in porous and fractured media [87,88]. It supports both manual and automatic calibration through integration with FEPEST, the FEFLOW-integrated module for PEST [89,90]. This helps to facilitates the adjustment of model parameters, particularly hydraulic conductivity, making it appropriate for the modeling objectives.
  • Numerical Model
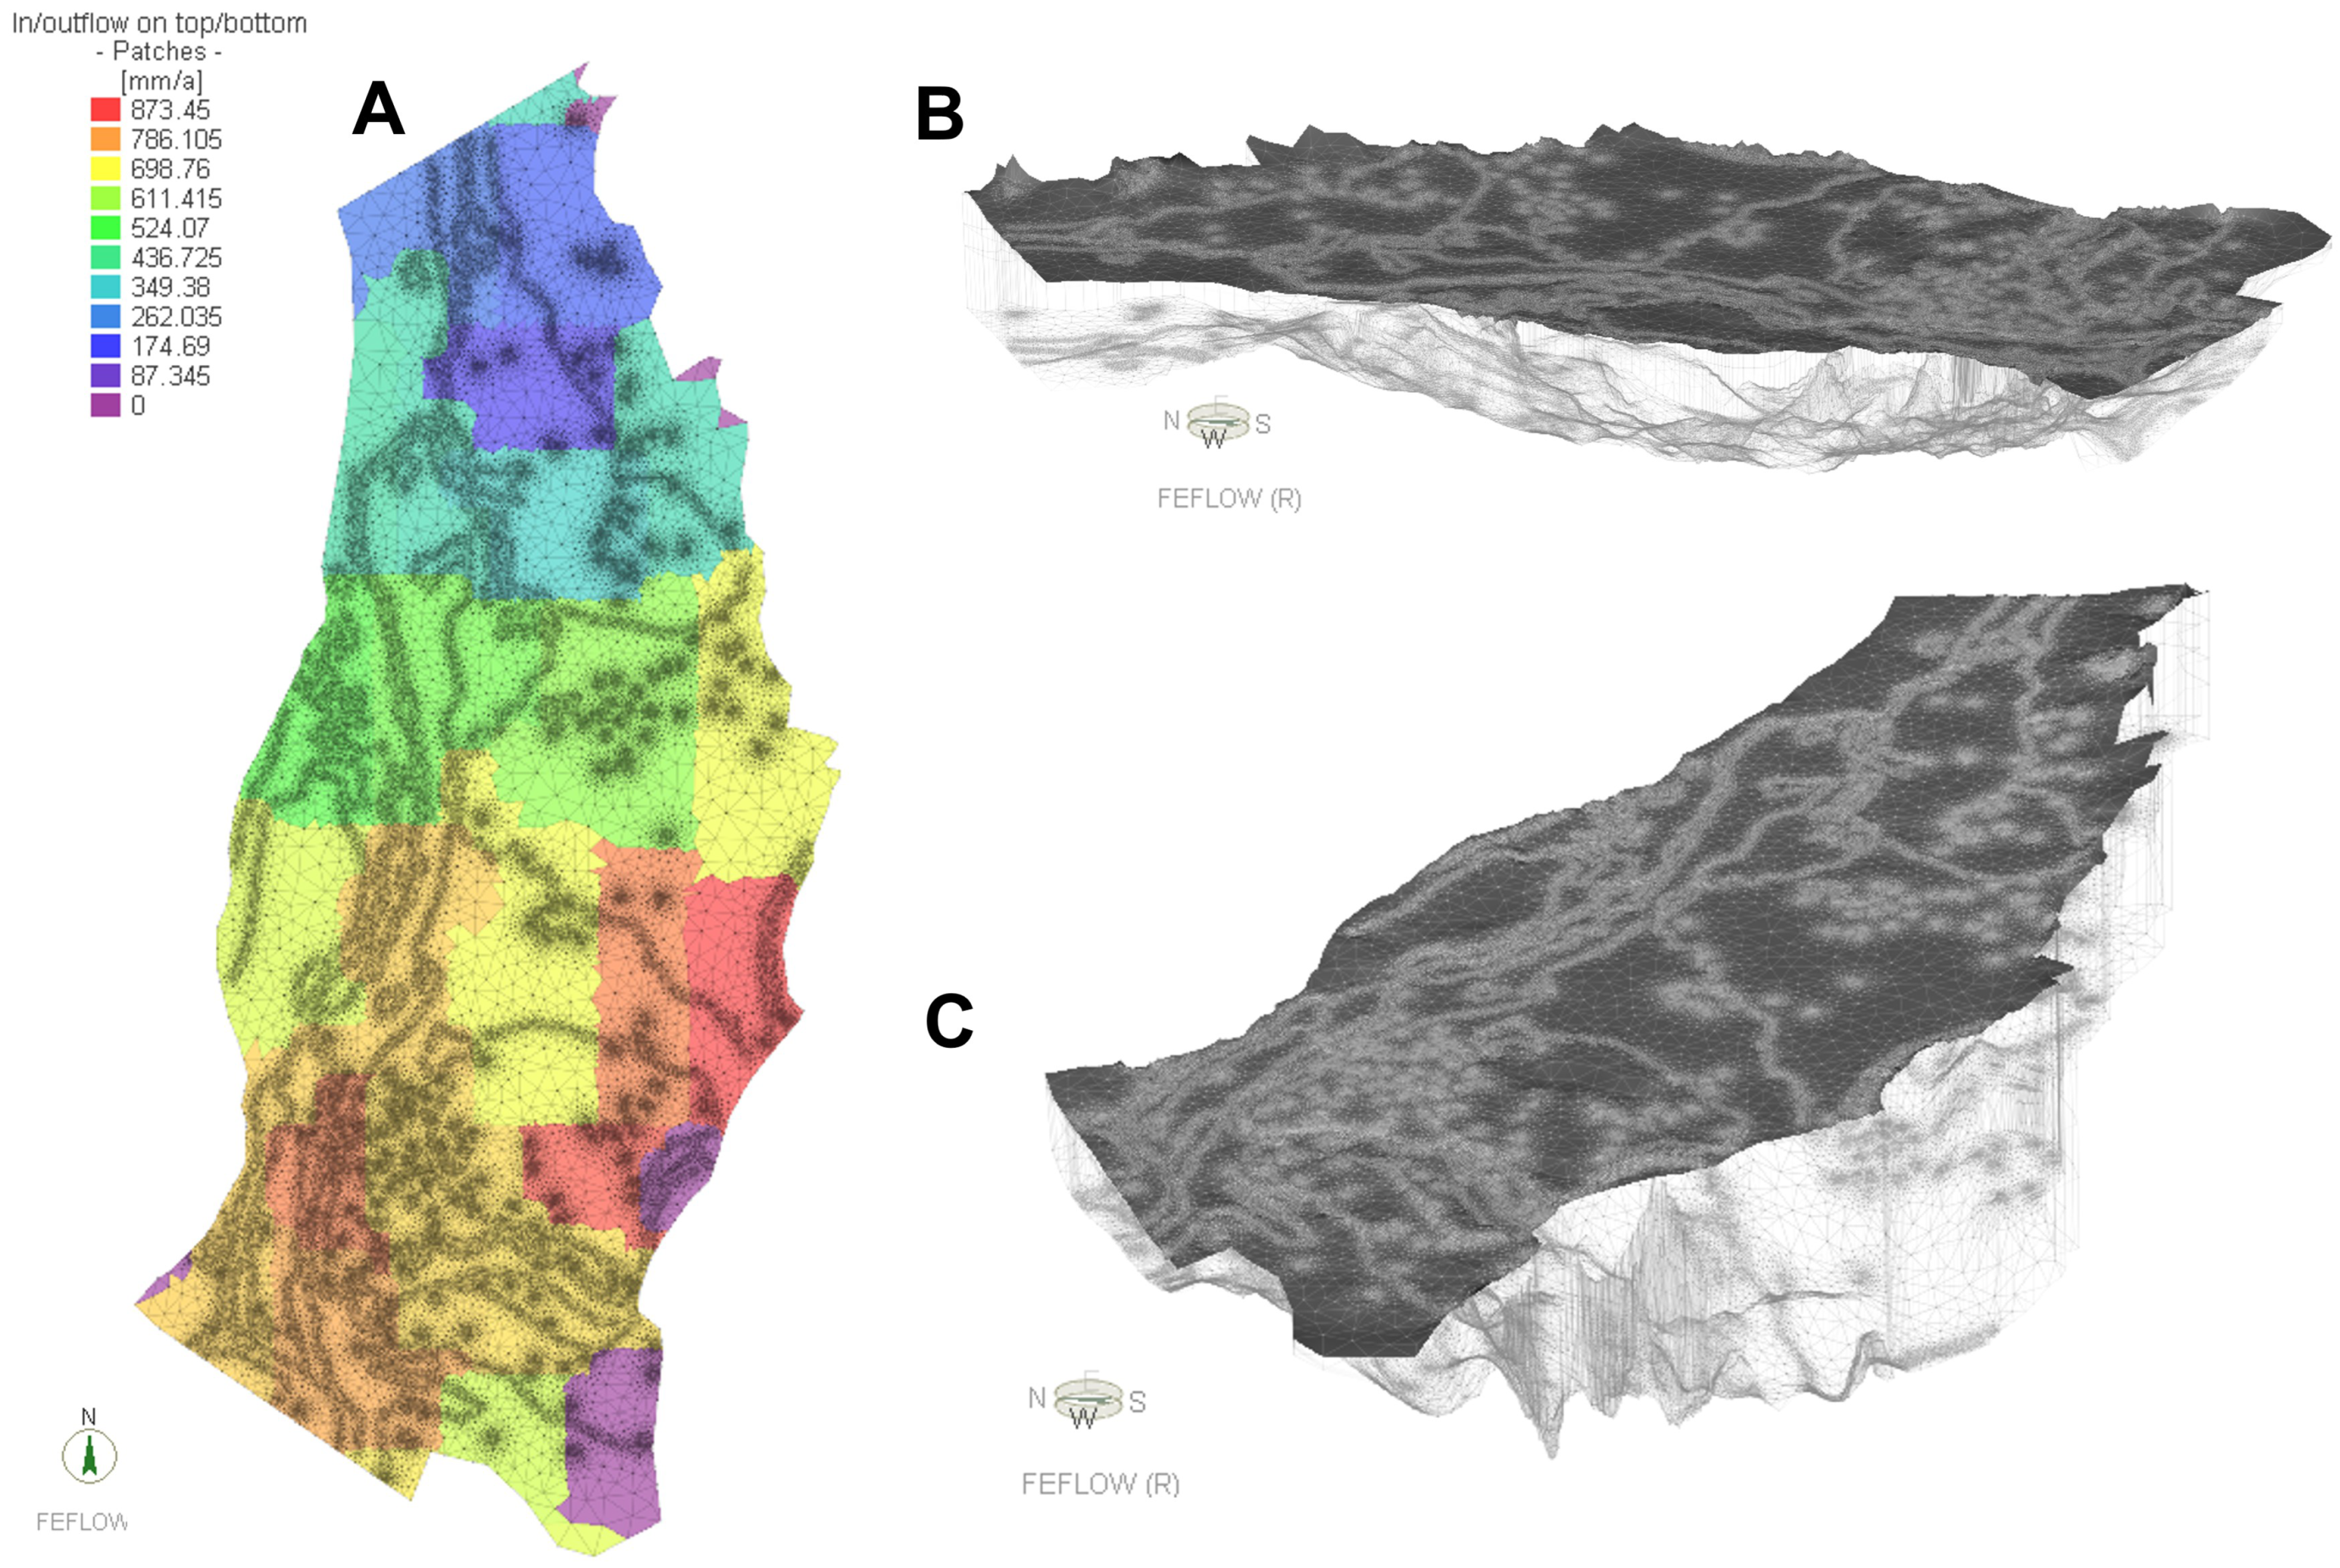
    Implementation of the numerical model was based on the structural components defined in the conceptual model. Initially, a two-dimensional unstructured mesh composed of 124,397 triangular elements and 62,431 nodes was created (Figure 4A). This mesh was refined in areas with higher data density. From this 2D mesh, a three-dimensional mesh was generated to represent the Neogene–Quaternary hydrogeological units, including the four units of the Real Group and the Quaternary deposits. The upper boundary of the 3D mesh corresponded to the topographic surface, derived from the Shuttle Radar Topography Mission (SRTM) Digital Elevation Model (DEM) provided by NASA and specifically reprocessed for the study area. The lower boundary was defined based on the base of the Real Group. The resulting 3D mesh consisted of 621,985 elements and 374,586 nodes (Figure 4B,C).
    As described in the conceptual model, the precipitation regime and land use/land cover patterns vary significantly between the southern and northern parts of the study area. To estimate the effective recharge, a hydrological model based on Hydrological Response Units (HRUs) was applied [64]. Recharge rates were determined through an inverse calibration process, resulting in values ranging from 12% to 33% of the annual average precipitation, depending on the HRU. Higher annual recharge values were observed in the southern sector, in line with the spatial distribution of precipitation (Figure 4A).
    The boundary conditions of the numerical model were established according to the conceptual understanding of the regional hydrogeological system. A Neumann-type condition was applied at the southern boundary to represent regional inflow into the aquifer. On the eastern boundary, a prescribed flow condition was assigned in the northern sector, associated with the Aguachica alluvial fans, while a no-flow condition was set in the southern sector due to the presence of Cretaceous outcrops from the Eastern Cordillera that dip eastward (away from the study area), and as such do not contribute flow to the model domain. Similarly, the western boundary was defined as no-flow in the northern sector due to the presence of low-permeability Cretaceous units such as the La Luna Formation, while a prescribed flow condition was assigned to the southern sector. At the northern boundary, a Dirichlet-type condition was implemented using piezometric levels derived from the available water table data.
    According to secondary data provided by the Regional Environmental Authorities (CARs) responsible for granting water abstraction licenses in Colombia, 3962 groundwater points were identified within the model domain; however, only 12.95% of these (513 points) had records of permitted discharge rates, defined as the maximum authorized extraction. These discharge values were incorporated into the model as outflows (BC Type IV—Single Well), totaling 83,911.8 m3/day.
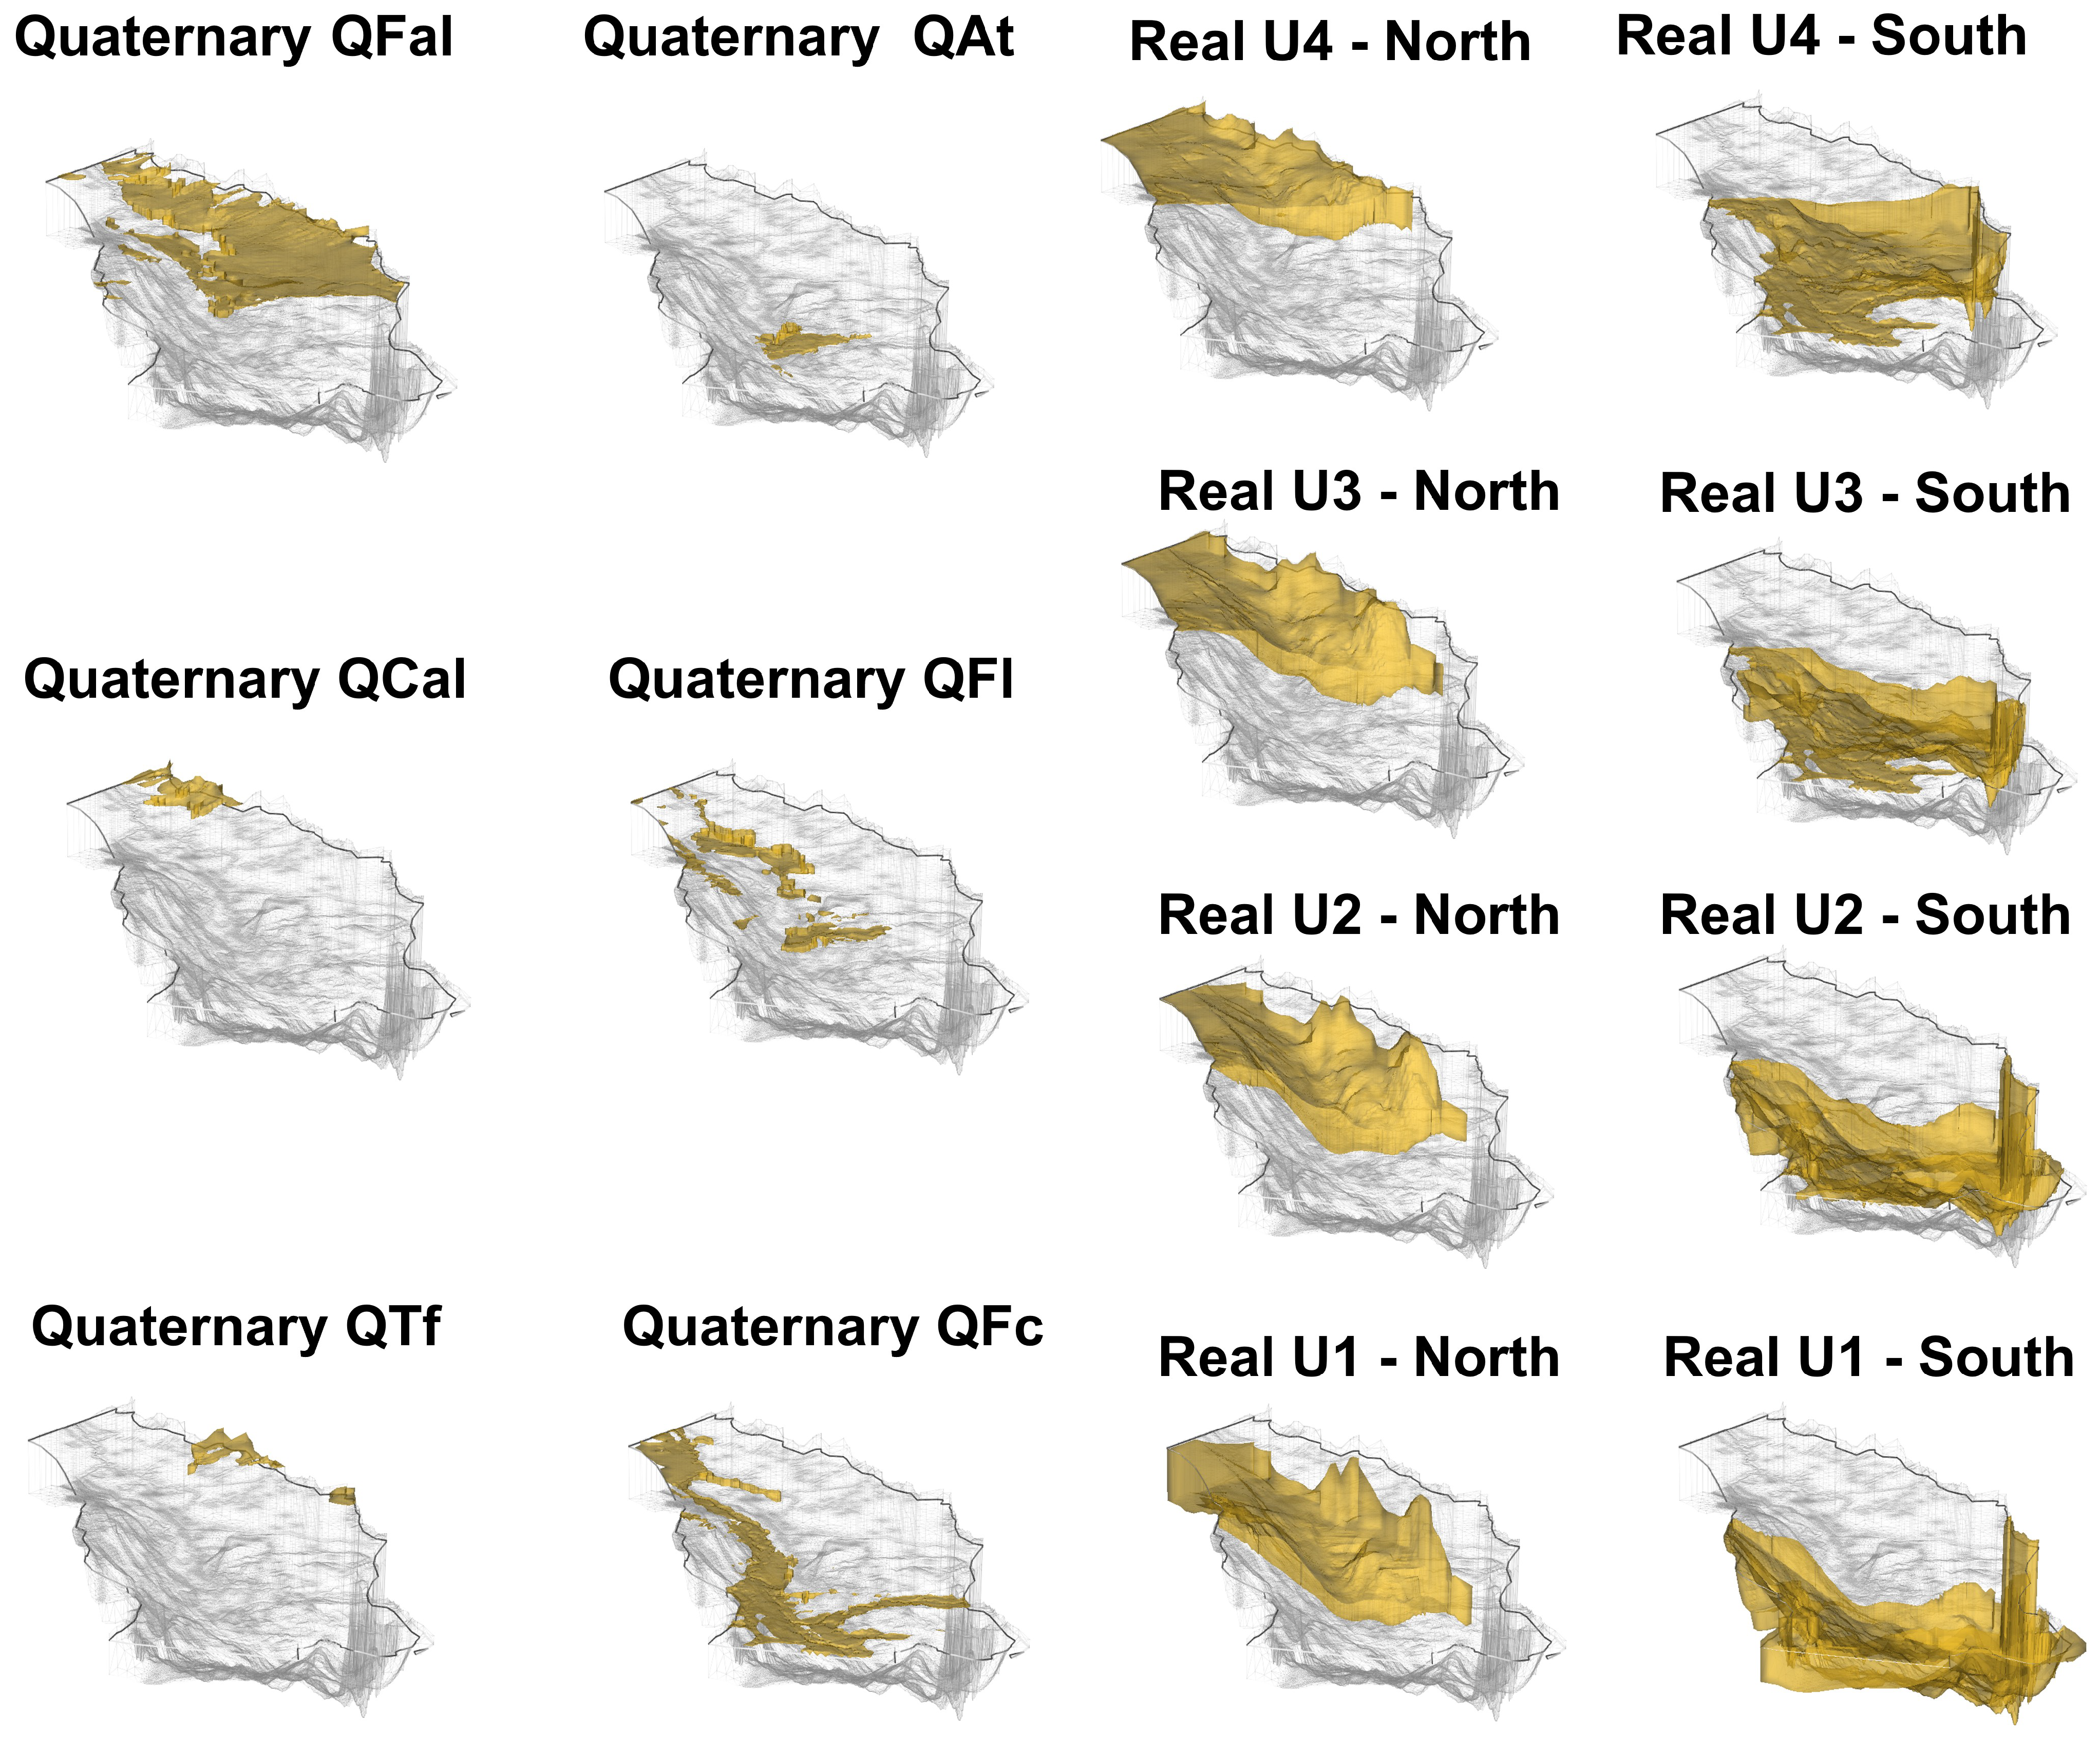
    The model was constructed using five layers. The top layer represents the Quaternary deposits, while the four underlying layers correspond to the sub-units of the Real Group. The model was then parameterized on the basis of this structure. The uppermost layer was subdivided into different Quaternary geomorphological units, each considered a zone of uniform hydraulic conductivity (Figure 5). Similarly, each sub-unit of the Real Group was divided into northern and southern sectors to account for the marked differences in granulometric composition across the study area, where sandy materials predominate in the north and clayey materials in the south [64,91].
  • Model Calibration
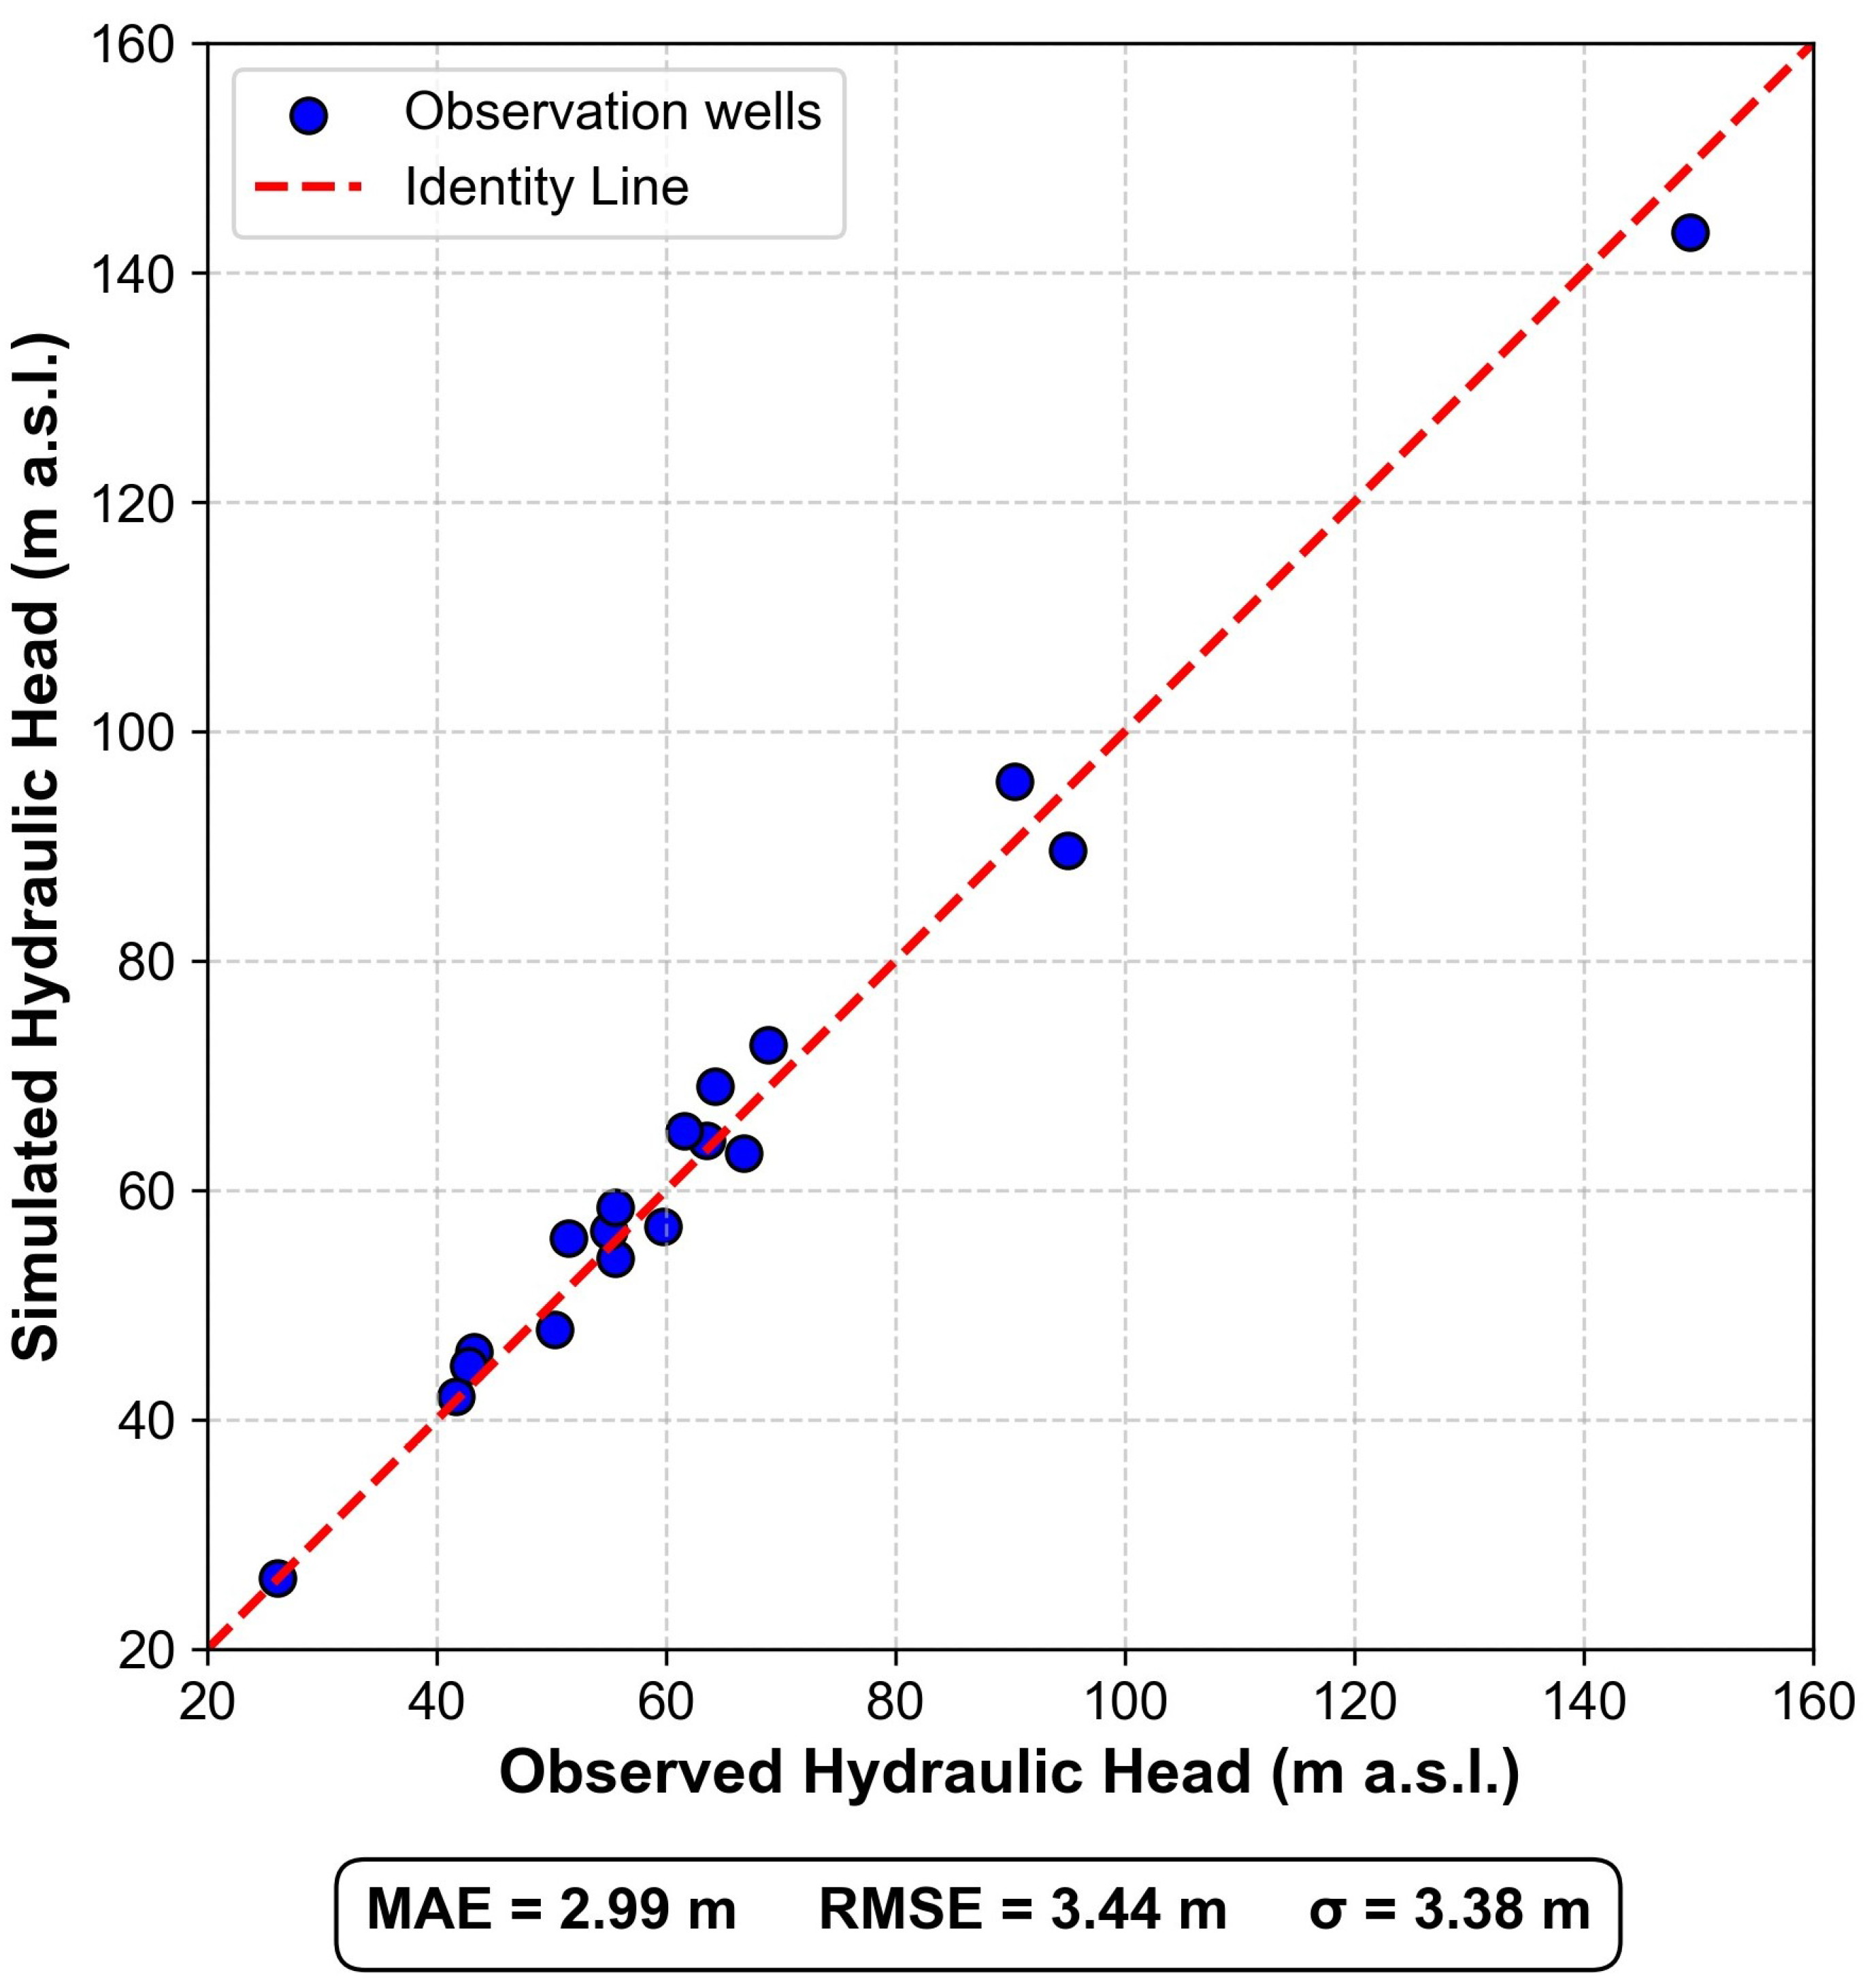
    Calibration of the model was carried out using an iterative trial-and-error approach, supported by results from previous modeling conducted in the study area [64]. Calibration yielded an RMSE of 3.44 m and an MAE of 2.99 m, indicating good agreement between simulated and observed piezometric levels (Figure 6). This level of accuracy is considered acceptable when taking into account the various sources of uncertainty involved, such as the precision of the digital elevation model (DEM), the zonation used for parameterization, and the simplifications made in the hydrogeological conceptualization.
    The water balance of the model showed a total imbalance of 1.04 × 10 8 L / s , which is considered numerically negligible. This result confirms adequate conservation of water mass in the system and consistent implementation of the boundary conditions, recharge, and discharge terms according to the conceptual model. Regarding the flow distribution, the main inflow corresponds to infiltration recharge, with a total rate of 53.33 m3/s, while the most significant outflow takes place through the northern boundary, with 52.61 m3/s.
    Given that the main objective of this simulation was to estimate hydraulic conductivity values for comparison with the proposed methodology, the calibrated values of K are presented in the results section (Section 3).

3. Results

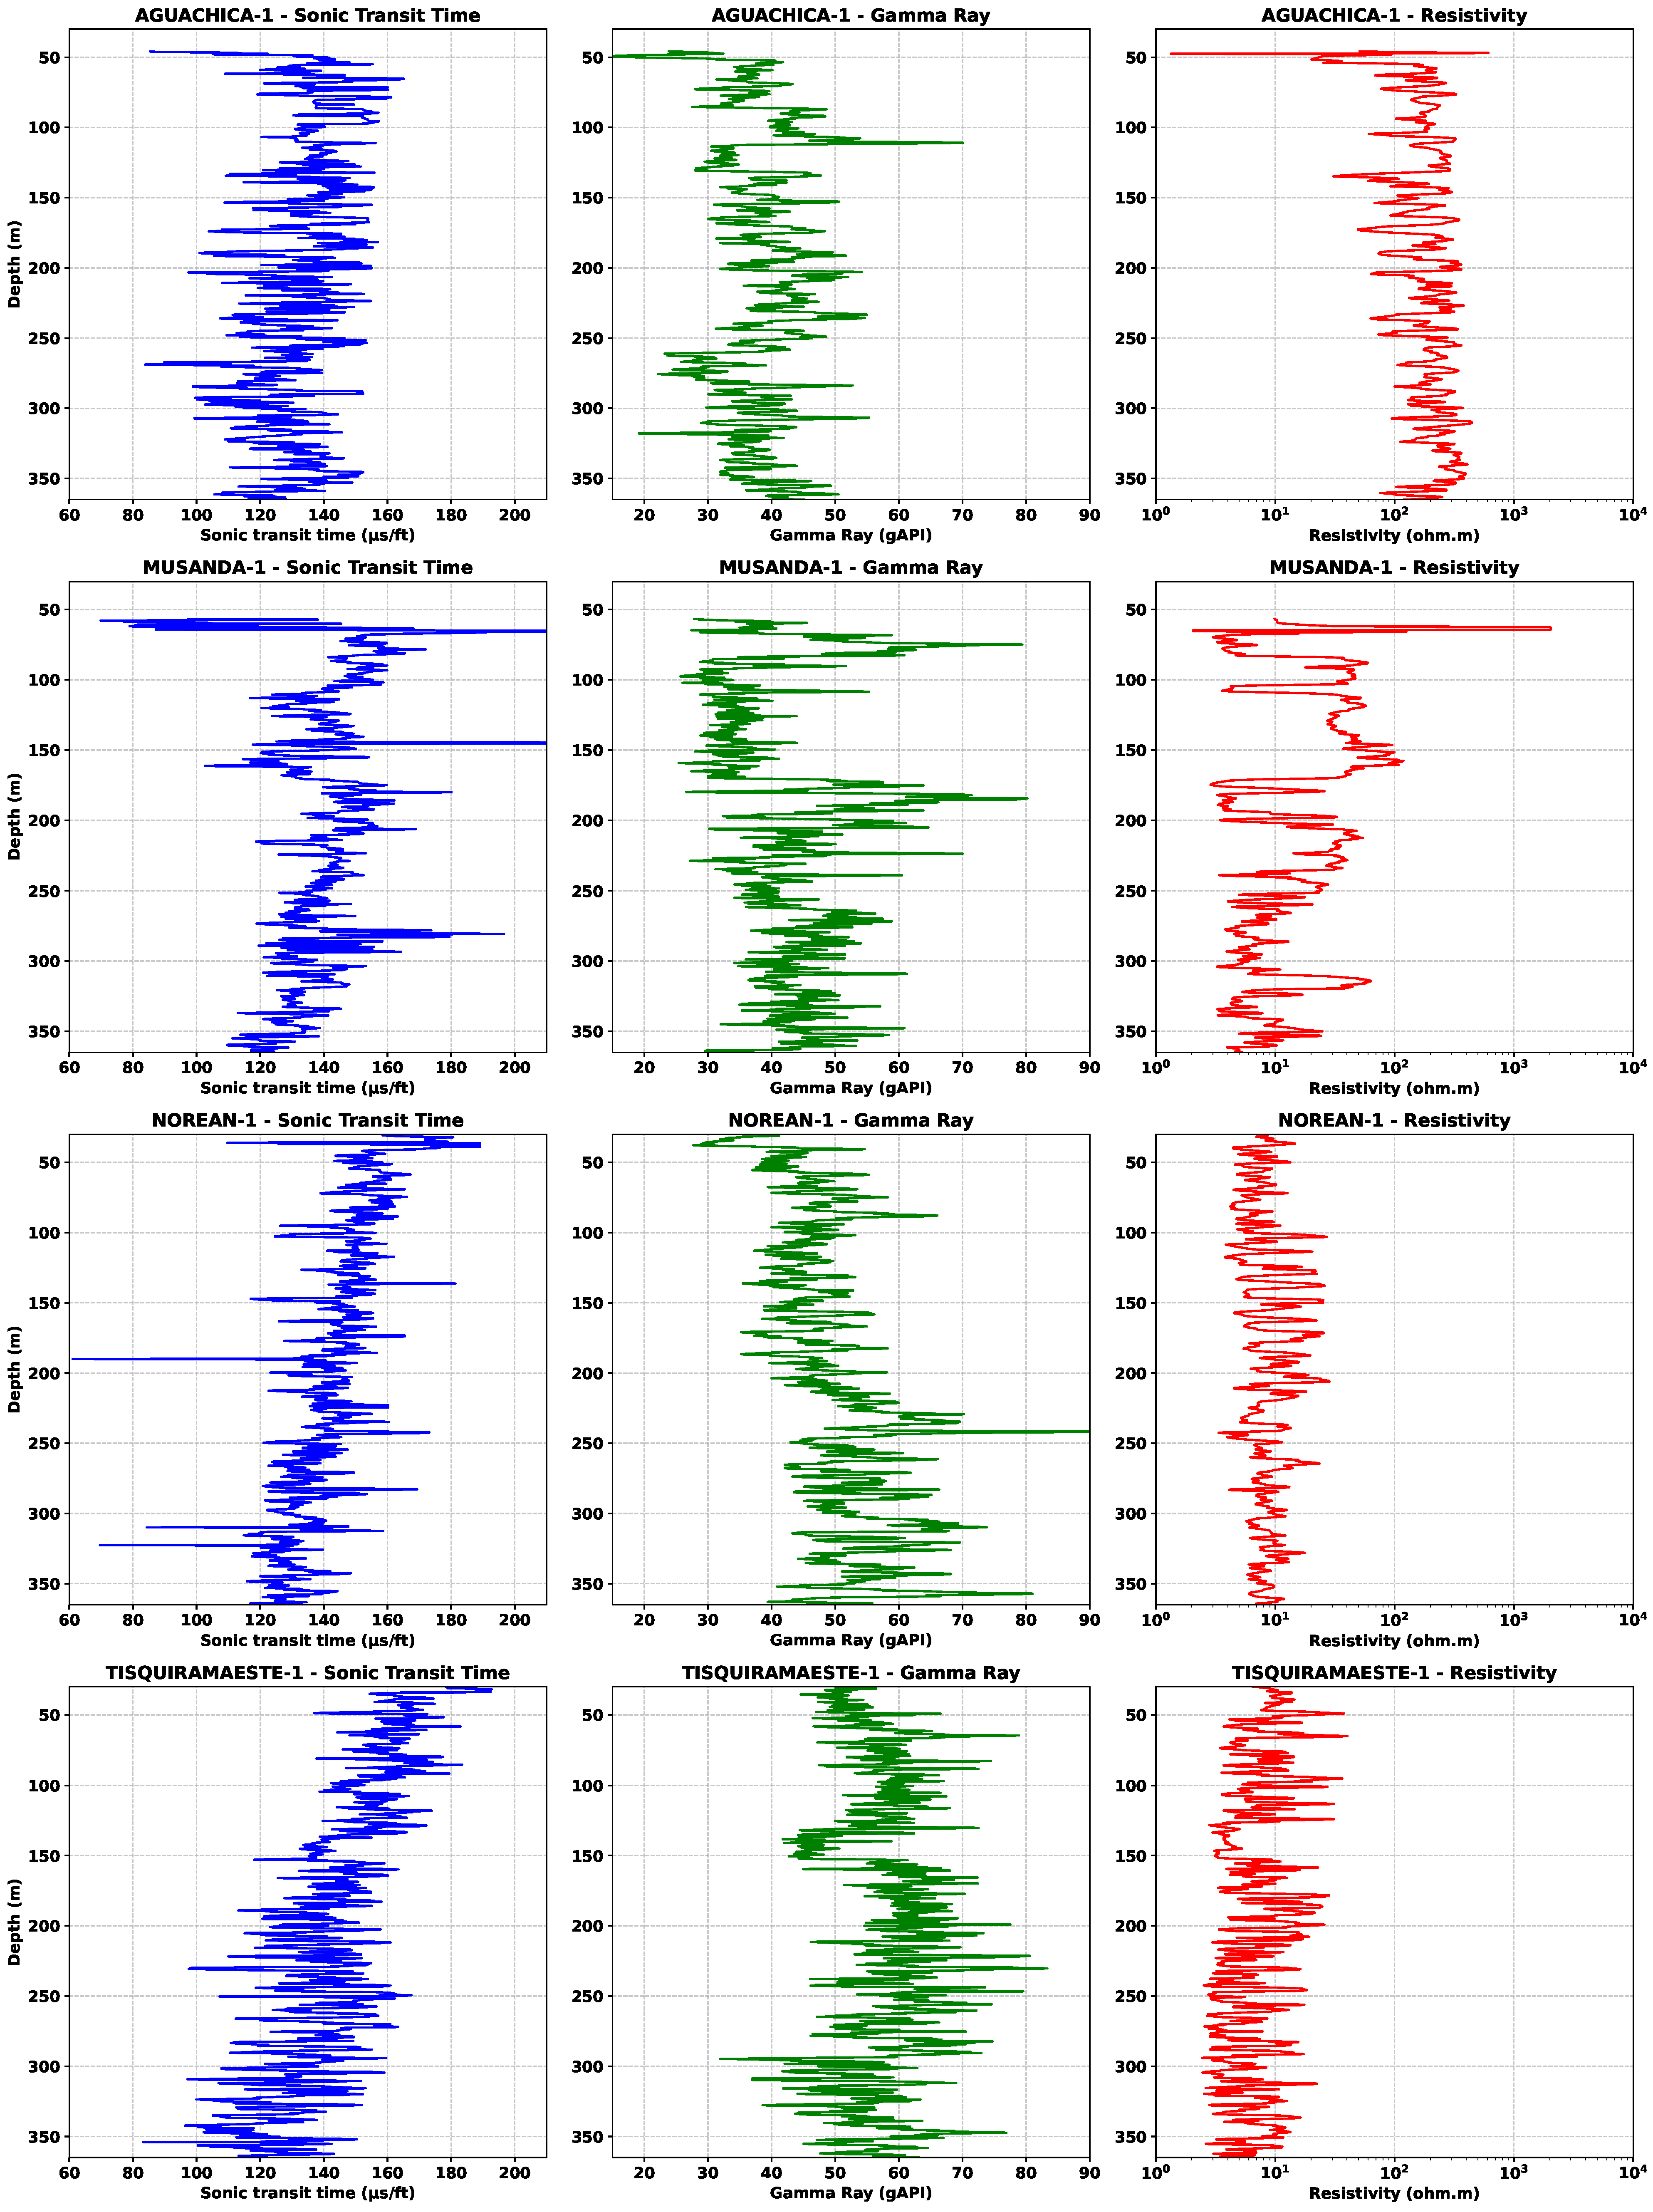
Hydraulic conductivity estimation was performed by applying the proposed methodology utilizing geophysical well logs (Figure 7) acquired from four wells in the MMV basin: Aguachica-1, Musanda-1, Norean-1, and Tisquirama Este-1 (Figure 1). The selection of these wells was based on a pre-existing 3D geological–geophysical model of the region, which enabled the identification of their intersection with both Quaternary deposits and Neogene formations. Specifically, these wells penetrate Quaternary deposits as well as the two upper units (U4 and U3) of the Real Group.
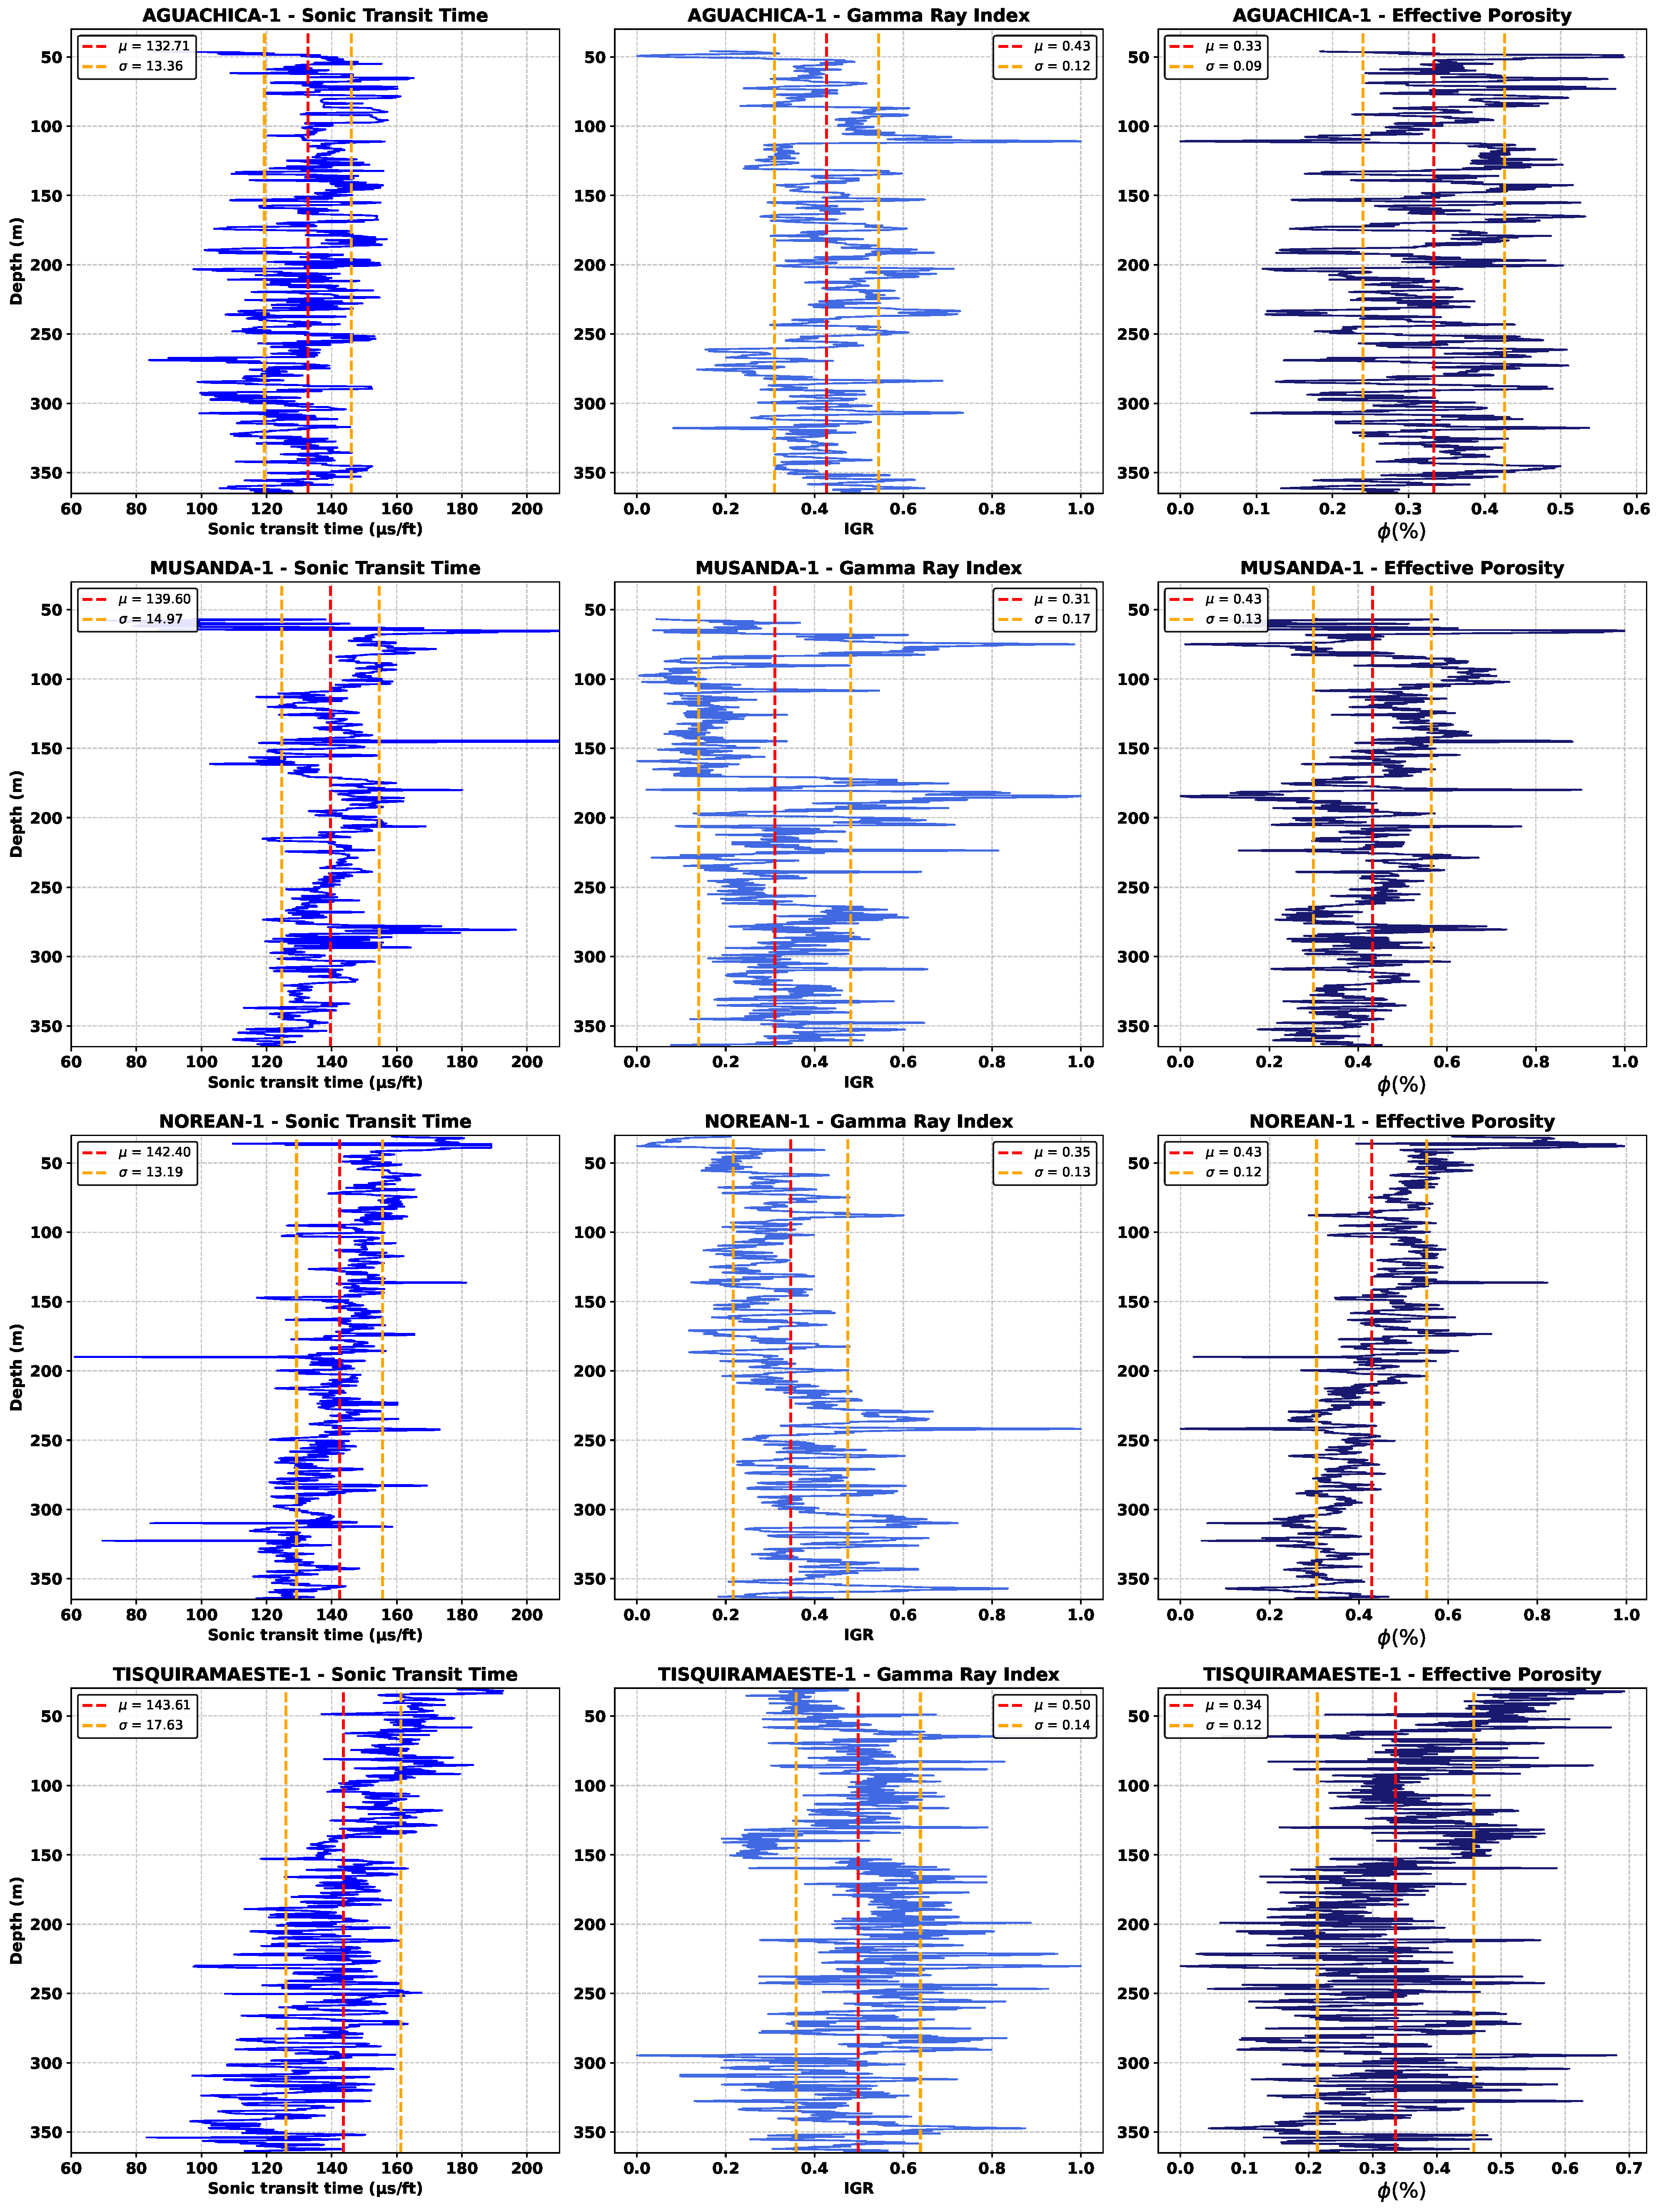
Effective porosity in each well was determined in two stages. First, porosity was estimated by applying the Wyllie time-average equation to the sonic logs. Simultaneously, clay content was inferred from the gamma ray index, assuming a linear relationship between both parameters.
The estimated mean effective porosity values for the Aguachica-1 and Tisquirama Este-1 wells were 33% and 34%, respectively, which correlate with their higher gamma ray indices (0.43 and 0.50), indicating higher clay content and a consequent reduction in pore connectivity and system permeability. In contrast, the Muzanda-1 and Norean-1 wells exhibited higher average effective porosity values of 43%, associated with lower gamma ray indices (0.31 and 0.35). This suggests a lower clay influence and improved pore connectivity, leading to increasing hydraulic conductivity. These results underscore the inverse relationship between clay content and effective porosity available for fluid flow (Figure 8).
Hydraulic conductivity estimations based on the equation proposed by Csókás in [77] require temperature data, among other parameters [51]. However, in Colombia, temperature logs are not commonly acquired during geophysical well logging. Consequently, none of the wells analyzed in this study had recorded temperature profiles. To mitigate this constraint, temperature values were estimated using the characteristic geothermal gradient of the Middle Magdalena Valley, which was adjusted based on discrete temperature measurements previously recorded at each well. Thus, the temperature at each analyzed well was estimated using the equation T c = z + 1455.9 50.274 + Δ T , where Δ T corresponds to correction factors of −4.29 °C for Aguachica-1, −4.96 °C for Muzanda-1, −4.44 °C for Norean-1, and −3.66 °C for Tisquirama Este-1.
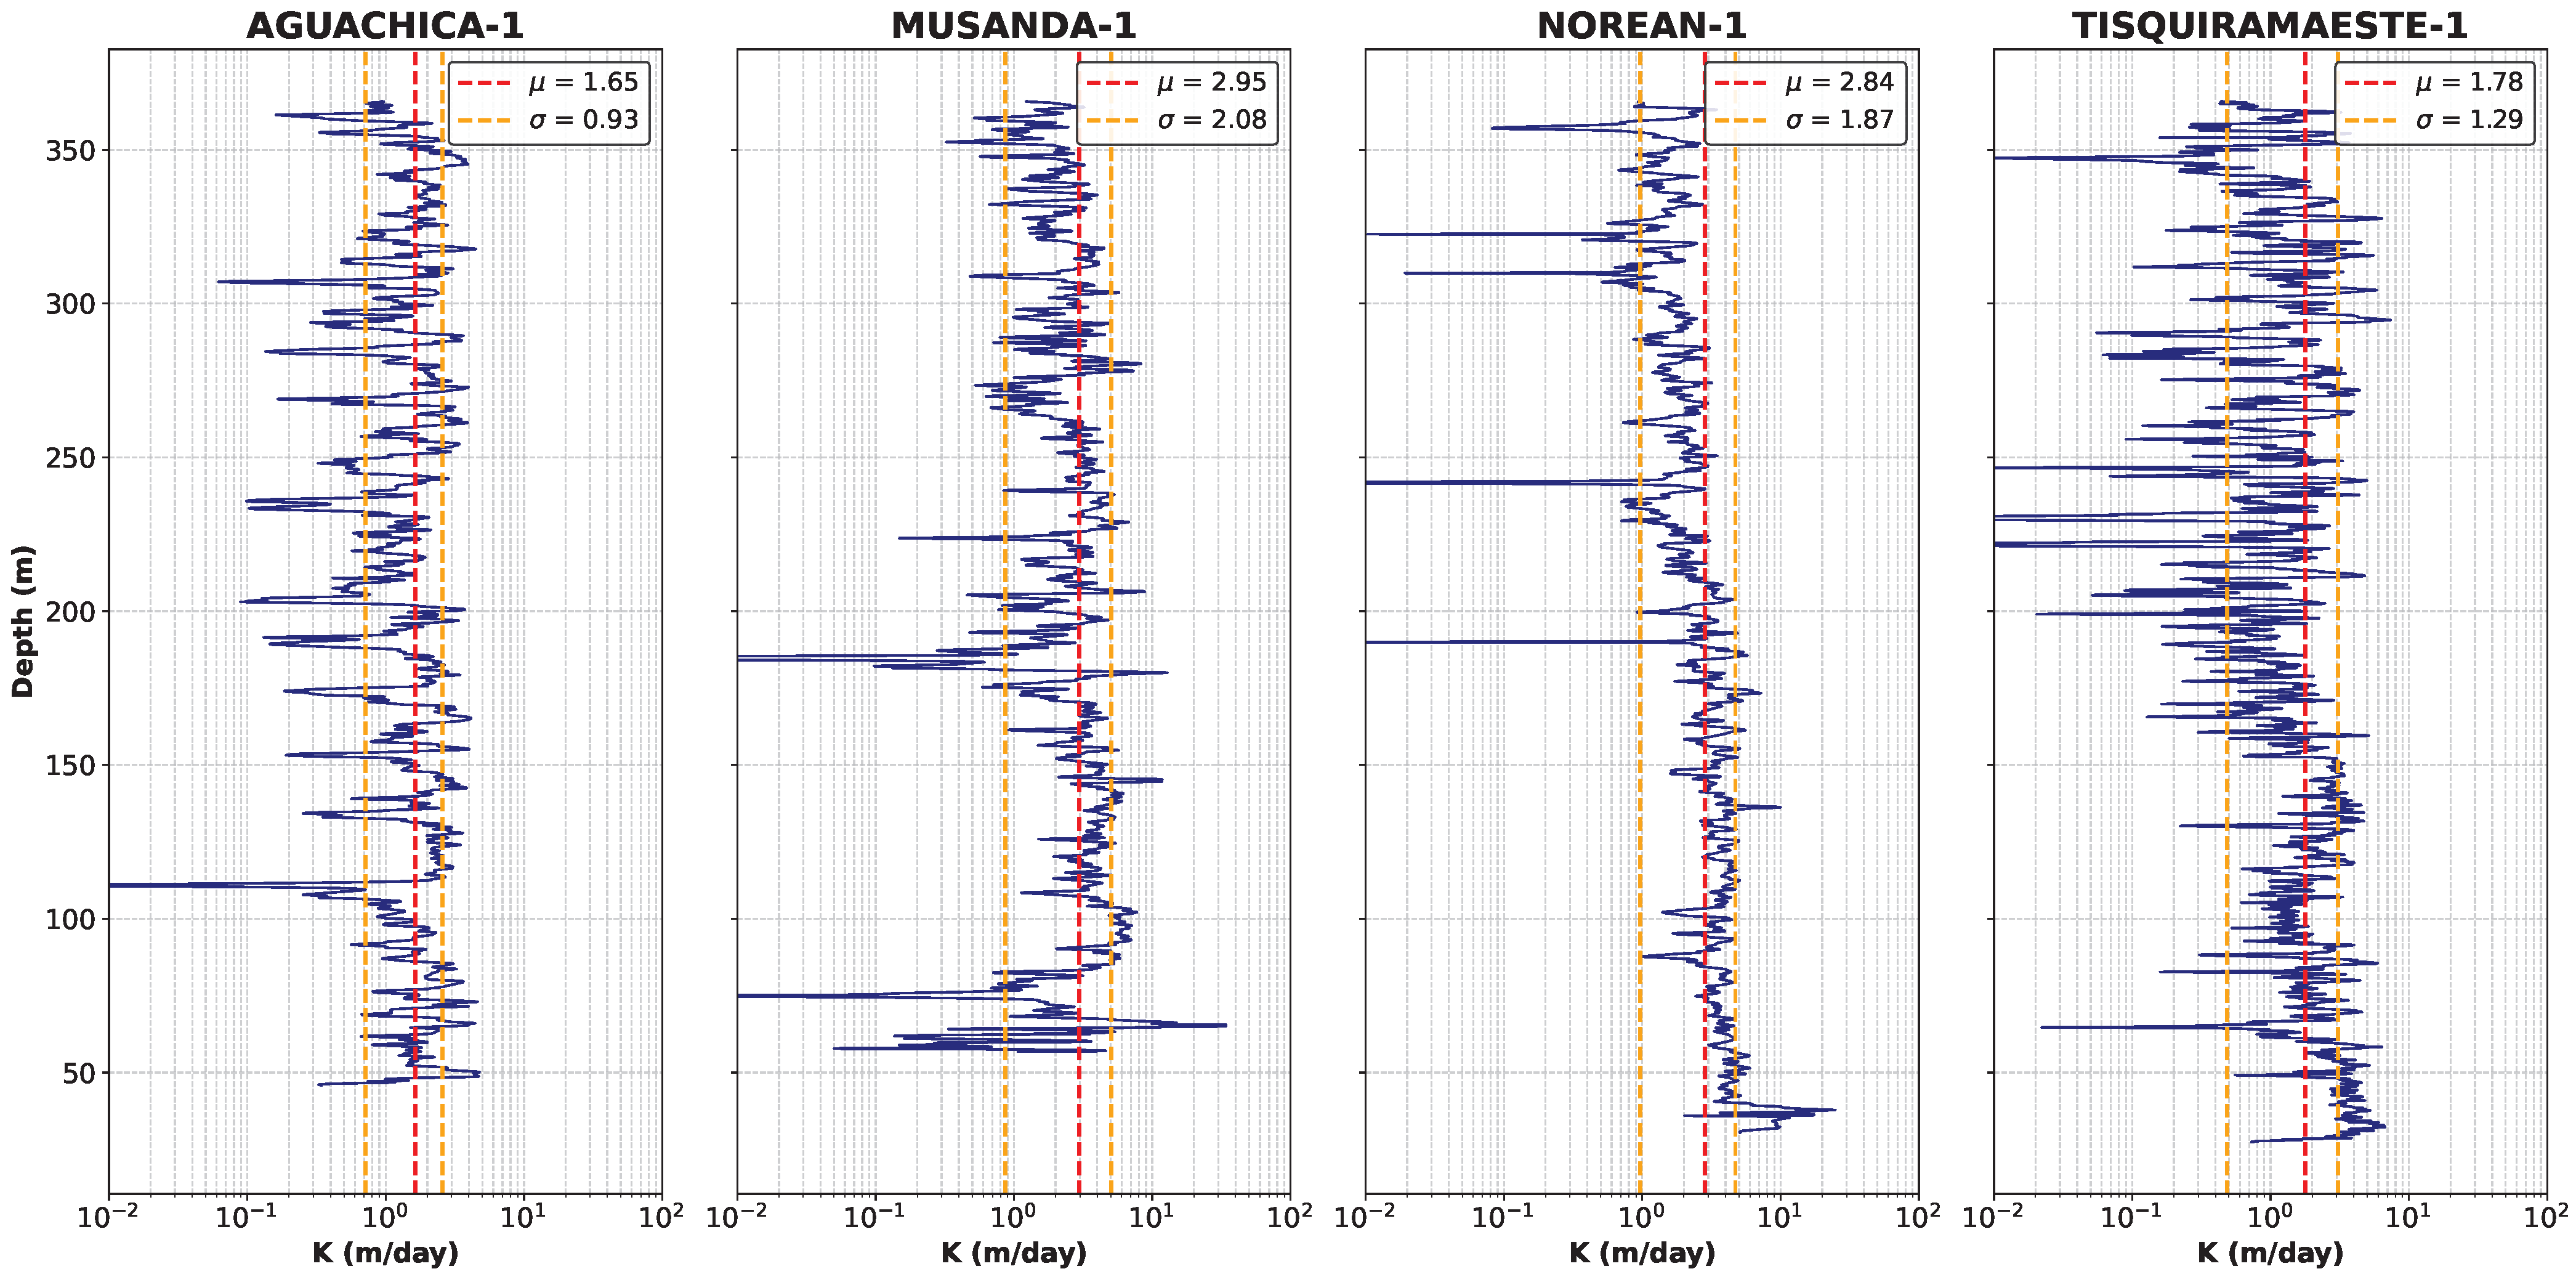
The estimated temperature values were used to calculate the coefficient C t , which is required for the estimation of hydraulic conductivity based on the equation proposed by Csókás [77]. Using these values, hydraulic conductivity profiles were generated for each well (Figure 9). However, the primary objective of this study is not merely the estimation of conductivity profiles, but evaluation of whether the effective hydraulic conductivity values obtained along each well can be utilized for the parameterization of numerical hydrogeological models in contexts with limited hydraulic data. To this end, the mean effective hydraulic conductivity was determined for each well: 1.65 m/day in Aguachica-1, 2.95 m/day in Musanda-1, 2.84 m/day in Norean-1, and 1.78 m/day in Tisquirama Este-1, with standard deviations of 0.93 m/day, 2.08 m/day, 1.87 m/day, and 1.29 m/day, respectively.
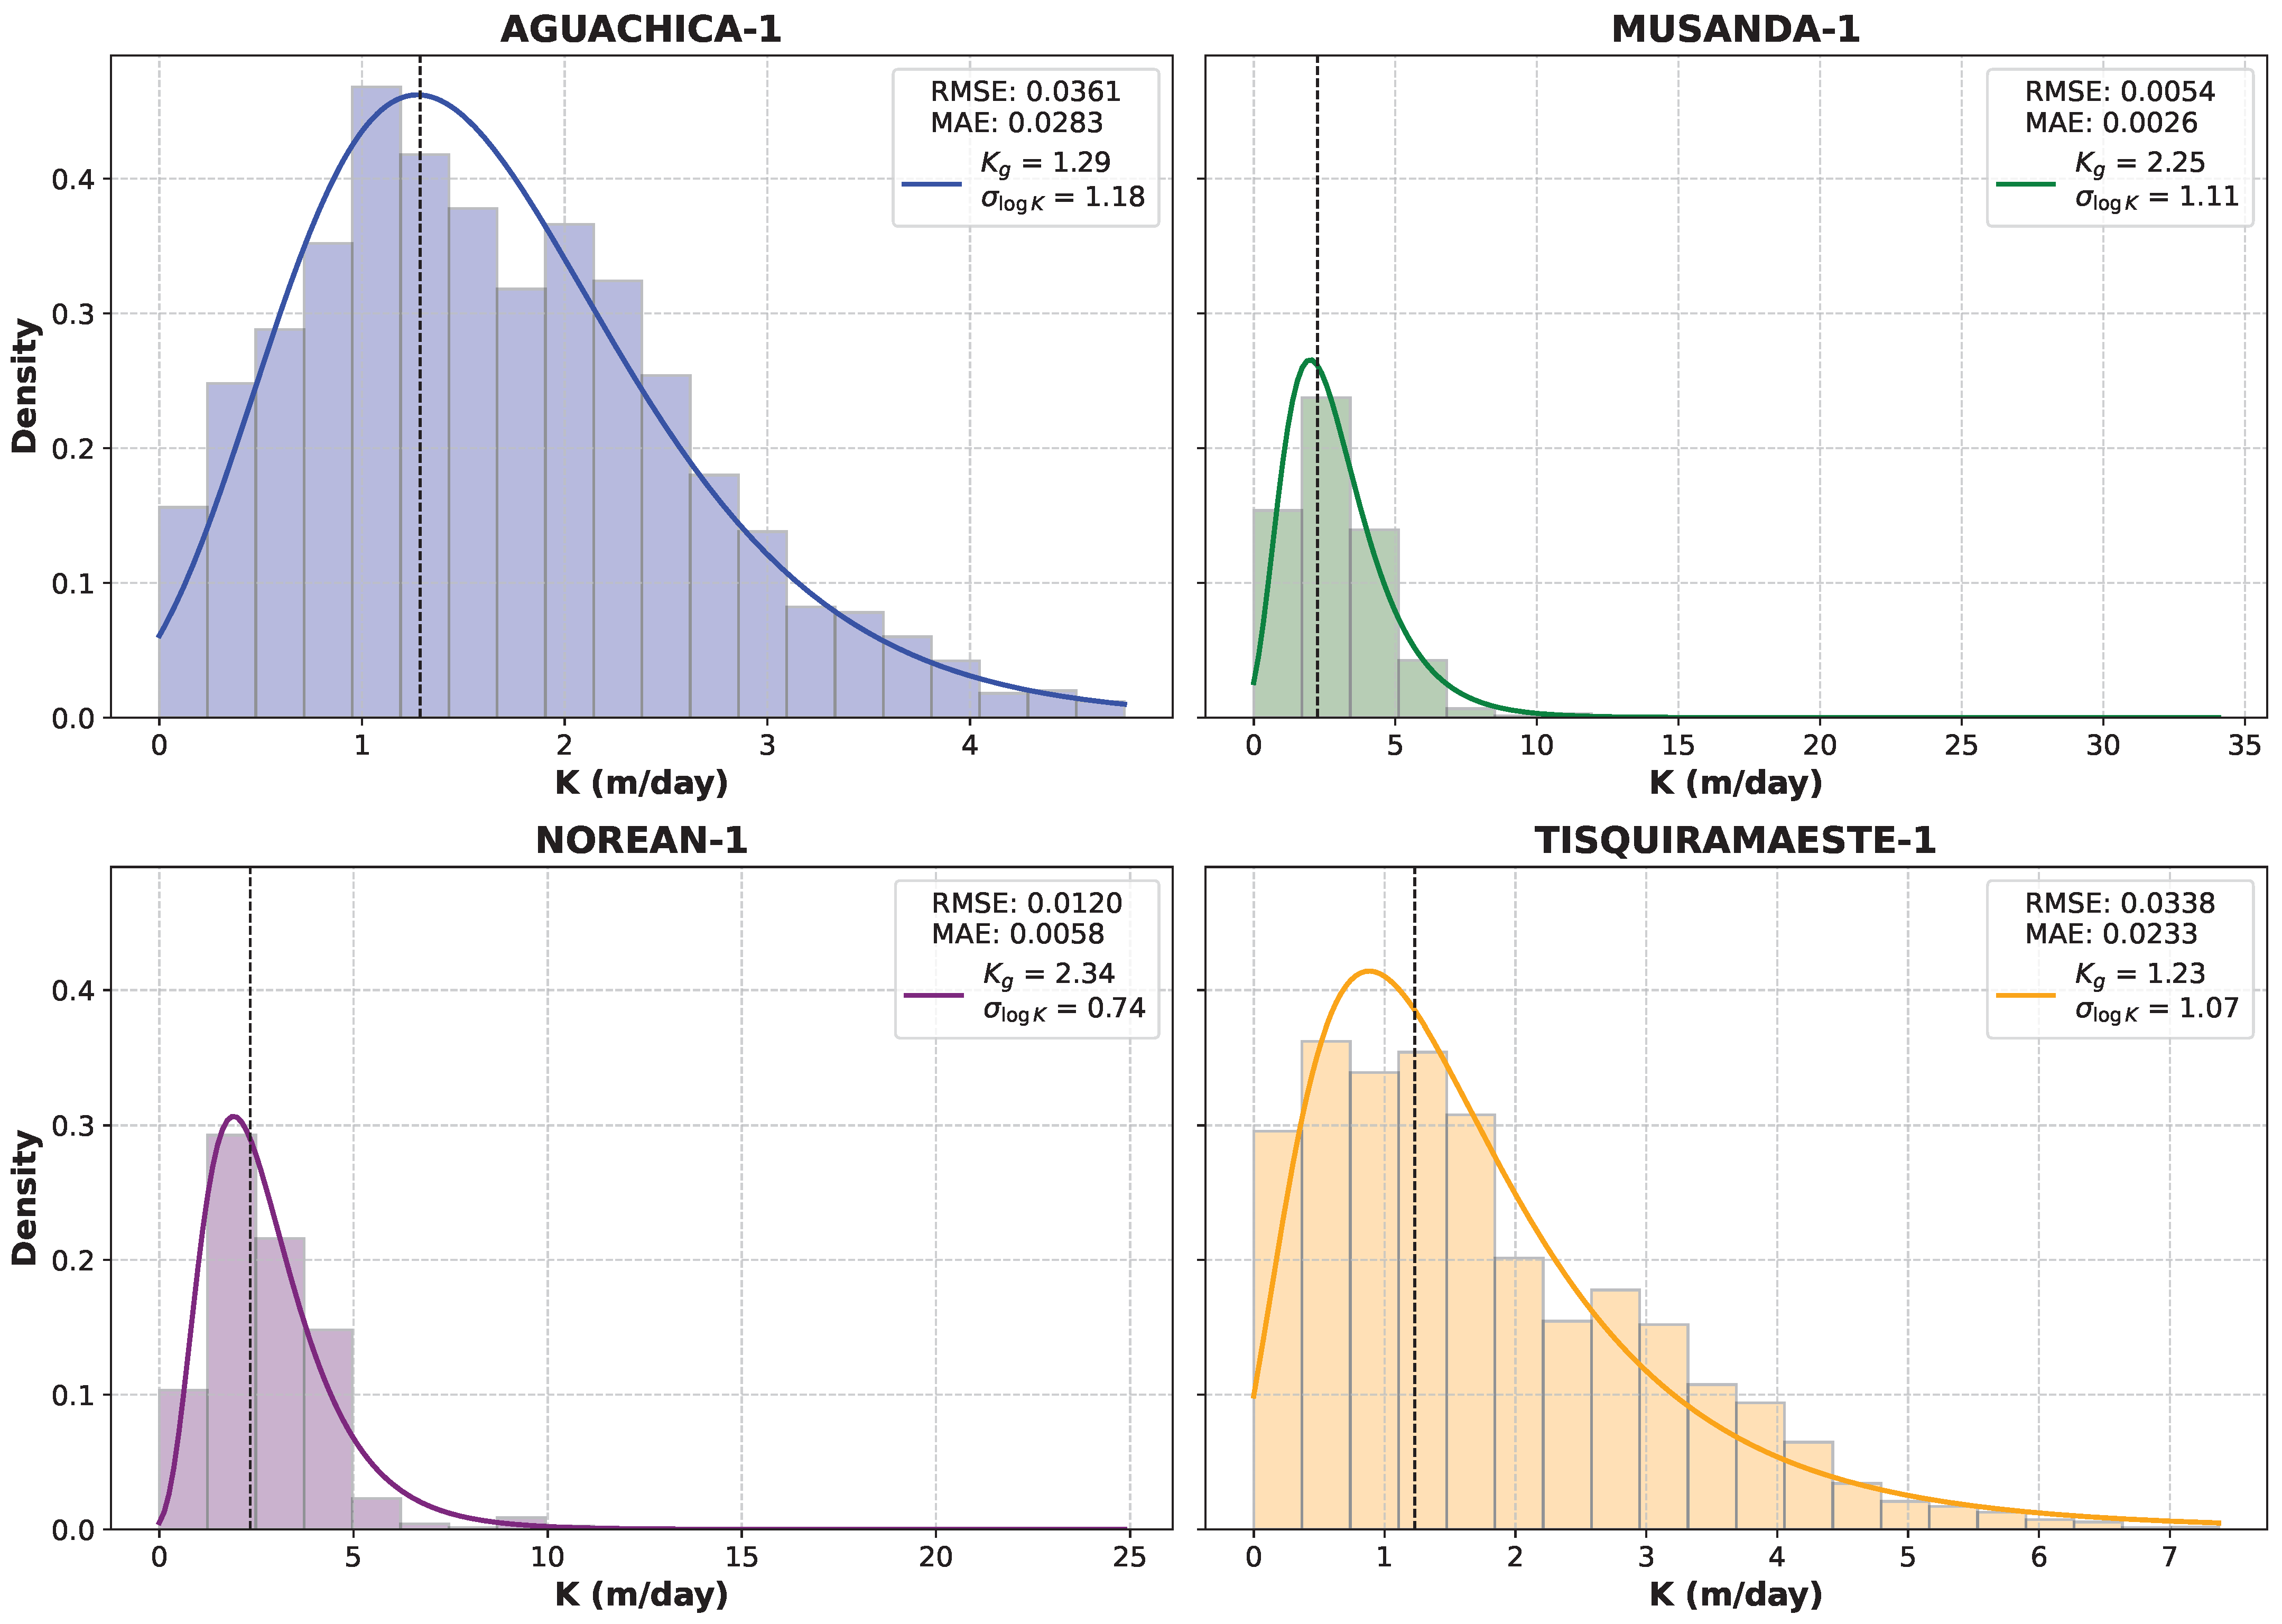
In addition, we assessed the probability distribution function providing the best fit to the estimated hydraulic conductivity data for each analyzed well. The results indicated that the log-normal distribution provides the best fit in all cases (Figure 10). In this distribution, the probability density function is expressed according to Equation (9):
f ( K ) = 1 K σ log K 2 π exp ln K μ log K 2 2 σ log K 2
where K is the hydraulic conductivity (m/day), μ log K is the mean of the natural logarithm of K, and σ log K is the standard deviation of the natural logarithm of K.
In this type of distribution, the logarithm of hydraulic conductivity follows a normal distribution; therefore, the geometric mean ( K g ) was adopted as a representative measure of central tendency.
Furthermore, the standard deviation of the natural logarithm of hydraulic conductivity ( σ log K ) was used to quantify the degree of dispersion of the values estimated using the proposed methodology in each well. In general, the variability of the data does not exceed two orders of magnitude.
To evaluate the suitability of using the estimated hydraulic conductivity values in the parameterization of regional-scale numerical hydrogeological models, the effective hydraulic conductivity ( K eff ) was calculated for each well (Table 1). This parameter is defined as the value of hydraulic conductivity that, if applied to a homogeneous medium under the same boundary conditions, yields the same average flow rate as that obtained in the actual heterogeneous medium [92]. Accordingly, a comparison was carried out between the calculated K eff values and those obtained from pumping tests conducted in the study area.
A total of 131 pumping tests were analyzed. Of these, 65 were conducted in wells located in Quaternary outcrops of Floodplain deposits. Additionally, 51 pumping tests were performed in wells that intersect the U4 unit of the Real Group, while 12 were conducted in wells that extend into the U3 unit. These hydrogeological units are the same as those intersected by the wells with geophysical logs, from which hydraulic conductivity was estimated using the methodology proposed in this study.
The selection of the pumping tests analyzed was based on the compilation of secondary information available for the study area. Environmental licensing records associated with permits for groundwater extraction were reviewed, and the raw data from each pumping test (time versus drawdown) were digitized for each concessioned well. This information allowed for reinterpretation of the tests and estimation of the corresponding hydraulic parameters in each case.
The wells included in the analysis exhibit depths ranging from less than 5 m to over 700 m. The average depth is approximately 57.9 m, while the median depth is 35 m. It is worth noting that 15.3% of the wells are shallower than 10 m, whereas only 10.7% exceed 100 m in depth. This indicates that deep wells intended for groundwater extraction are relatively uncommon in the study area.
In general, wells with depths of less than 100 m, particularly those located in rural areas of the Middle Magdalena Valley (VMM), tend to be constructed using PVC casing and include slotted intervals covering approximately 30% of their total length to ensure structural stability. A relevant aspect identified during the compilation of the pumping test dataset relates to common construction practices in rural Colombia, where slotting is typically carried out in the lower section of the well as a measure to reduce the risk of surface contamination of anthropogenic origin. However, this procedure is typically carried out empirically, without the support of geophysical studies to determine the optimal depths for slotting the PVC casing, which serves as a rudimentary well screen in rural areas.
Based on the interpretation of the 131 pumping tests (Table 2), the geometric mean hydraulic conductivity of the Floodplain deposits (QFal) in the Middle Magdalena Valley was 1.56 m/day, with a maximum value of 154.92 m/day and a standard deviation of 21.63 m/day. For the U4 unit of the Real Group, the geometric mean was 1.36 m/day with a standard deviation of 30.00 m/day, while the U3 unit showed a geometric mean of 0.96 m/day and a standard deviation of 3.38 m/day.
The transmissivity (T) and hydraulic conductivity (K) values derived from these tests display substantial variability across the hydrogeological units, reflecting differences in both hydraulic behavior and internal heterogeneity (Figure 11). On average, the Real Group units display higher geometric mean transmissivity values than the Quaternary deposits, suggesting a greater potential for groundwater flow within these units.
The U4 unit stands out with the highest maximum transmissivity (2627.10 m2/day) and the greatest standard deviation (571.13 m2/day), highlighting its strong spatial variability. Similarly, the U3 unit shows relatively high transmissivity values, though with lower dispersion. In contrast, the U2 and U1 units present lower geometric means for both transmissivity (8.36 and 24.18 m2/day) and hydraulic conductivity (0.21 and 1.00 m/day), along with lower standard deviations. These values suggest more homogeneous hydraulic behavior within these units.
Regarding the Quaternary deposits, the highest transmissivity values were found in the Channel Fluvial (QFc) and Floodplain (QFal) units, with geometric mean transmissivity values of 70.06 and 42.00 m2/day and corresponding hydraulic conductivities of 1.65 and 1.56 m/day, respectively. On the other hand, units such as the Alluvial Fans (QCal) and Alluvial Terraces (QAt) exhibit lower geometric mean transmissivity values of 5.67 and 4.45 m2/day and hydraulic conductivities of 0.22 and 0.07 m/day, respectively, indicating less permeable conditions. Although variability is present in the Quaternary domain, the overall statistical dispersion is generally lower than that observed in the Real Group units, particularly for transmissivity, suggesting a more consistent distribution of hydraulic properties.
A comparison between hydraulic conductivity values obtained from pumping tests and those estimated from geophysical well logs indicates that both are of the same order of magnitude. Specifically, the wells where the proposed methodology was applied intersect the Quaternary QFal geoform and the U4 and U3 units of the Real Group. In these units, the geometric mean hydraulic conductivities derived from pumping tests were 1.56 m/day (QFal), 1.36 m/day (U4), and 0.96 m/day (U3). From well log analysis, the estimated geometric means ( K g ) ranged from 1.23 to 2.34 m/day, while the corresponding effective hydraulic conductivities ( K eff ) ranged from 1.00 to 1.12 m/day (Figure 12).
Additionally, the regional groundwater flow model implemented in steady state confirmed the hydrodynamic behavior described in the conceptual model, which includes a regional south-to-north flow controlled by the topographic gradient as well as intermediate flows in an east–west direction.
Recharge was identified as the main input to the system, with higher estimated rates in the southern sector of the study area. This pattern is attributed to the precipitation regime, with mean annual values up to four times higher in the south compared to the north. Although both sectors share a geology dominated by Neogene–Quaternary deposits, differences in land cover also influence the recharge dynamics, as forested and agricultural areas prevail in the south, while grasslands used for extensive cattle grazing are more common in the north, reducing the infiltration capacity of the soil [3]. The main discharge zone of the system was located at the northern boundary, in accordance with the regional topographic gradient.
When comparing the numerical modeling results with the pumping test data, the estimated values show consistency for each analyzed hydrogeological unit. In the Quaternary geoforms, the QFal unit had a calibrated value of 1.5 m/day, similar to the value estimated by the proposed methodology (1.56 m/day). For QCal, the calibrated value was 1.0 m/day, within the range obtained from pumping tests (0.02 to 1.81 m/day), with a geometric mean of 0.22 m/day. In the QTf unit, the model yielded a value of 1.0 m/day while pumping tests reported a geometric mean of 0.53 m/day, with a range of 0.08 to 8.65 m/day. For QAt, the calibrated value was 0.4 m/day, within the range estimated from tests (maximum of 0.99 m/day), although the geometric mean was lower (0.07 m/day). In the QFl unit, the calibrated value was 0.8 m/day, close to the test-based estimate (0.56 m/day), and in QFc, a value of 1.6 m/day was obtained, compared to a geometric mean of 1.65 m/day. Within the Real Group, the units considered in this study are U4 and U3, corresponding to the formations intersected by the evaluated wells. The U4 unit showed calibrated values ranging from 0.1 to 1.3 m/day, close to the geometric mean of 1.36 m/day derived from pumping tests. For the U3 unit, calibrated values ranged from 0.7 to 0.9 m/day, falling within the range reported by field tests (0.05 to 9.67 m/day).
Because the objective of the modeling was to validate the methodology proposed in this study, a comparison was made between the estimated hydraulic conductivity values with those obtained from the inverse calibration of the regional groundwater flow model. Table 3 displays the calibrated values for key units. For the QFal unit, a calibrated value of 1.50 m/day was obtained, closely aligning with the estimate from the proposed methodology (1.56 m/day). For unit U4 of the Real Group, the calibrated range was 0.1–1.3 m/day, while the methodological estimate was slightly higher at 1.36 m/day, yet within the same order of magnitude. Similarly, for unit U3, the calibrated values ranged between 0.7 and 0.9 m/day, which are slightly below the methodological estimate (0.96 m/day) but still show overall consistency.
These results support the applicability of the proposed methodology as a viable alternative for the estimation of hydraulic parameters in regional-scale hydrogeological models, particularly in areas with limited availability of pumping test data.

4. Conclusions

In this study, a methodology was developed and implemented to estimate hydraulic conductivity from well logs in regions with scarce hydrogeological data. The results indicate that this approach is a viable tool for the parameterization of numerical hydrogeological models.
Due to the lack of temperature profiles, regional geothermal gradients calibrated with discrete data were used. Likewise, pore water resistivity was indirectly estimated from porosity–resistivity relationships, while porosity values relied on constant sonic transit times for the matrix and fluid. These assumptions introduce uncertainty, particularly in heterogeneous media such as the Neogene–Quaternary deposits of the Middle Magdalena Valley (MMV), where variations in salinity, lithology, and compaction are expected. Additionally, gamma ray responses may overestimate clay content in feldspathic sands, suggesting the need for complementary mineralogical analyses where available.
Despite these limitations, the methodology was validated through comparison with 131 pumping tests conducted in hydrogeological units intersected by the analyzed wells. The estimated hydraulic conductivity values were within the same order of magnitude as those obtained from field tests. Furthermore, the methodology was applied in the calibration of a steady-state groundwater flow model, achieving acceptable statistical performance. These results confirm the potential of the proposed method as a practical tool for estimating hydraulic conductivity in regional studies with limited data.
Nevertheless, the estimated effective hydraulic conductivity values should be considered a complementary tool rather than a standalone method. For improved reliability, we recommend integrating this approach with other sources of information such as pumping and slug tests, laboratory analyses, empirical methods, or hydrogeological modeling at multiple scales. Where possible, inclusion of temperature and resistivity profiles as well as core data is encouraged in order to refine estimations and reduce uncertainty.
In conclusion, the proposed methodology provides a complementary tool for characterizing hydraulic properties and enhancing model parameterization in poorly-instrumented regions.

Author Contributions

All authors contributed to the conceptualization of the study. B.L.-A. collected and analyzed the data and drafted the original manuscript. L.S.V. and B.L.-A. developed the conceptual and numerical models. L.D.D. and B.L.-A. reviewed and edited the manuscript. All authors have read and agreed to the published version of the manuscript.

Funding

This research was conducted as part of the MEGIA Research Project, Contingent Recovery Contract FP44842-157-2018, funded by Minciencias and the National Hydrocarbons Agency.

Data Availability Statement

The original data presented in this study are openly available at https://drive.google.com/drive/folders/1iPgX0Nwfl_5IivFXlmRwZ9MoefnqsC3r?usp=sharing (accessed on 9 August 2025).

Acknowledgments

The researchers thank the members of the HYDS—Hydrodynamics of the Natural Media Research Group, especially Mónica Vaca, Juan Pescador, Eduardo Castro, and Adriana Piña, for their contributions to the collection of primary and secondary data and for their support in developing the conceptual understanding of the hydrogeological system in the study area, which provided the foundation for this research. The authors also acknowledge DHI WASY for providing a student license for FEFLOW v.8.1, which supported the development of the numerical model.

Conflicts of Interest

This manuscript is an original work that has not been published previously and is not under review elsewhere. All authors have reviewed and approved the final version for submission to Water. The authors declare no conflicts of interest.

References

  1. Mekonnen, M.M.; Pahlow, M.; Aldaya, M.M.; Zarate, E.; Hoekstra, A.Y. Sustainability, efficiency and equitability of water consumption and pollution in Latin America and the Caribbean. Sustainability 2015, 7, 2086–2112. [Google Scholar] [CrossRef]
  2. Aranguren-Díaz, Y.; Galán-Freyle, N.J.; Guerra, A.; Manares-Romero, A.; Pacheco-Londoño, L.C.; Romero-Coronado, A.; Vidal-Figueroa, N.; Machado-Sierra, E. Aquifers and groundwater: Challenges and opportunities in water resource management in Colombia. Water 2024, 16, 685. [Google Scholar] [CrossRef]
  3. Lora-Ariza, B.; Piña, A.; Donado, L.D. Assessment of groundwater quality for human consumption and its health risks in the Middle Magdalena Valley, Colombia. Sci. Rep. 2024, 14, 11346. [Google Scholar] [CrossRef]
  4. Carrard, N.; Foster, T.; Willetts, J. Groundwater as a source of drinking water in southeast Asia and the Pacific: A multi-country review of current reliance and resource concerns. Water 2019, 11, 1605. [Google Scholar] [CrossRef]
  5. Jakeman, A.J.; Barreteau, O.; Hunt, R.J.; Rinaudo, J.-D.; Ross, A.; Arshad, M.; Hamilton, S. Integrated groundwater management: An overview of concepts and challenges. In Integrated Groundwater Management: Concepts, Approaches and Challenges; Springer: Cham, Switzerland, 2016; pp. 3–20. [Google Scholar]
  6. Gaye, C.B.; Tindimugaya, C. Challenges and opportunities for sustainable groundwater management in Africa. Hydrogeol. J. 2019, 27, 1099–1110. [Google Scholar] [CrossRef]
  7. Qureshi, A.S. Challenges and opportunities of groundwater management in Pakistan. In Groundwater of South Asia; Springer: Cham, Switzerland, 2018; pp. 735–757. [Google Scholar]
  8. Ahamad, F.; Tyagi, S.K.; Singh, M.; Sharma, A.K. Groundwater in arid and semi-arid regions of India: A review on the quality, management and challenges. In Groundwater in Arid and Semi-Arid Areas: Monitoring, Assessment, Modelling, and Management; Springer: Cham, Switzerland, 2023; pp. 11–52. [Google Scholar]
  9. Bashandy, A.M.; Bekhit, H.M.; Radwan, H.G. Uncertainty assessment of aquifer hydraulic parameters from pumping test data. Appl. Water Sci. 2024, 14, 84. [Google Scholar] [CrossRef]
  10. Singh, A. Groundwater resources management through the applications of simulation modeling: A review. Sci. Total Environ. 2014, 499, 414–423. [Google Scholar] [CrossRef] [PubMed]
  11. West, L.J.; Odling, N.E. Characterization of a multilayer aquifer using open well dilution tests. Groundwater 2007, 45, 74–84. [Google Scholar] [CrossRef]
  12. Van der Gun, J. Large Aquifer Systems Around the World; The Groundwater Project: Guelph, ON, Canada, 2022. [Google Scholar]
  13. Shepley, M.G. Vertical hydraulic conductivity and layered heterogeneity: From measurements to models. Hydrogeol. J. 2024, 32, 1017–1042. [Google Scholar] [CrossRef]
  14. Kim, J.-W.; Choi, H.; Lee, J.-Y. Characterization of hydrogeologic properties for a multi-layered alluvial aquifer using hydraulic and tracer tests and electrical resistivity survey. Environ. Geol. 2005, 48, 991–1001. [Google Scholar] [CrossRef]
  15. Maliva, R.G. Aquifer Characterization Techniques; Springer International Publishing: Fort Myers, FL, USA, 2016; Volume 4, pp. 1–632. [Google Scholar]
  16. Senthilkumar, M.; Gnanasundar, D. Aquifer characterization and hydrogeological modeling for devising groundwater management strategies for the Chennai aquifer system, southern India. Environ. Earth Sci. 2022, 81, 187. [Google Scholar] [CrossRef]
  17. Zhou, Y.; Li, W. A review of regional groundwater flow modeling. Geosci. Front. 2011, 2, 205–214. [Google Scholar] [CrossRef]
  18. Hill, M.C.; Tiedeman, C.R. Effective Groundwater Model Calibration: With Analysis of Data, Sensitivities, Predictions, and Uncertainty; John Wiley & Sons: Hoboken, NJ, USA, 2007. [Google Scholar]
  19. Guillaume, J.H.A.; Hunt, R.J.; Comunian, A.; Blakers, R.S.; Fu, B. Methods for exploring uncertainty in groundwater management predictions. In Integrated Groundwater Management: Concepts, Approaches and Challenges; Springer: Cham, Switzerland, 2016; pp. 711–737. [Google Scholar]
  20. Refsgaard, J.C.; van der Sluijs, J.P.; Højberg, A.L.; Vanrolleghem, P.A. Uncertainty in the environmental modelling process—A framework and guidance. Environ. Model. Softw. 2007, 22, 1543–1556. [Google Scholar] [CrossRef]
  21. Cui, T.; Sreekanth, J.; Pickett, T.; Rassam, D.; Gilfedder, M.; Barrett, D. Impact of model parameterization on predictive uncertainty of regional groundwater models in the context of environmental impact assessment. Environ. Impact Assess. Rev. 2021, 90, 106620. [Google Scholar] [CrossRef]
  22. Anderson, M.P.; Woessner, W.W.; Hunt, R.J. Applied Groundwater Modeling: Simulation of Flow and Advective Transport; Academic Press: Cambridge, MA, USA, 2015. [Google Scholar]
  23. Doherty, J. Calibration and Uncertainty Analysis for Complex Environmental Models; Watermark Numerical Computing: Brisbane, Australia, 2015. [Google Scholar]
  24. Kourakos, G.; Mantoglou, A. Inverse groundwater modeling with emphasis on model parameterization. Water Resour. Res. 2012, 48, W05544. [Google Scholar] [CrossRef]
  25. Moore, C.; Doherty, J. The cost of uniqueness in groundwater model calibration. Adv. Water Resour. 2006, 29, 605–623. [Google Scholar] [CrossRef]
  26. Doherty, J.E.; Hunt, R.J. Approaches to Highly Parameterized Inversion—A Guide to Using PEST for Groundwater-Model Calibration; US Geological Survey: Reston, VA, USA, 2010. [Google Scholar]
  27. Watson, T.A.; Doherty, J.E.; Christensen, S. Parameter and predictive outcomes of model simplification. Water Resour. Res. 2013, 49, 3952–3977. [Google Scholar] [CrossRef]
  28. Hunt, R.J.; Doherty, J.; Tonkin, M.J. Are models too simple? Arguments for increased parameterization. Groundwater 2007, 45, 254–262. [Google Scholar] [CrossRef]
  29. Piña, A.; Donado, L.D.; Blessent, D. Analysis of the scale-dependence of the hydraulic conductivity in complex fractured media. J. Hydrol. 2019, 569, 556–572. [Google Scholar] [CrossRef]
  30. Neuman, S.P. Universal scaling of hydraulic conductivities and dispersivities in geologic media. Water Resour. Res. 1990, 26, 1749–1758. [Google Scholar] [CrossRef]
  31. Tartakovsky, A.M.; Panzeri, M.; Tartakovsky, G.D.; Guadagnini, A. Uncertainty quantification in scale-dependent models of flow in porous media. Water Resour. Res. 2017, 53, 9392–9401. [Google Scholar] [CrossRef]
  32. Kulander, B.R.; Dean, S.L.; Ward, B.J. Fractured Core Analysis: Interpretation, Logging, and Use of Natural and Induced Fractures in Core; American Association of Petroleum Geologists: Tulsa, OK, USA, 1990. [Google Scholar]
  33. Ngo, V.T.; Lu, V.D.; Nguyen, M.H.; Hoang, T.M.; Nguyen, H.M.; Le, V.M. A comparison of permeability prediction methods using core analysis data. In Proceedings of the SPE Reservoir Characterisation and Simulation Conference and Exhibition, Abu Dhabi, United Arab Emirates, 14–16 September 2015. [Google Scholar]
  34. Zhang, F.; Zhang, Q.; Zhang, Z.; Rui, Z.; Liu, Y.; Zhang, W.; Zheng, X.; Torabi, F.; Afanasyev, A. A New Experimental Core Analysis Method for Formation Permeability Measurement Under Two-Phase Condition. In Proceedings of the Offshore Technology Conference, Houston, TX, USA, 1–4 May 2023. [Google Scholar]
  35. Renard, P. The future of hydraulic tests. Hydrogeol. J. 2005, 13, 259–262. [Google Scholar] [CrossRef]
  36. Dashti, Z.; Nakhaei, M.; Vadiati, M.; Karami, G.H.; Kisi, O. A literature review on pumping test analysis (2000–2022). Environ. Sci. Pollut. Res. 2023, 30, 9184–9206. [Google Scholar] [CrossRef]
  37. Mace, R.E. Estimation of hydraulic conductivity in large-diameter, hand-dug wells using slug-test methods. J. Hydrol. 1999, 219, 34–45. [Google Scholar] [CrossRef]
  38. Yeh, T.-C.J.; Liu, S. Hydraulic tomography: Development of a new aquifer test method. Water Resour. Res. 2000, 36, 2095–2105. [Google Scholar] [CrossRef]
  39. Chen, C.-S.; Sie, Y.-C.; Lin, Y.-T. A review of the multilevel slug test for characterizing aquifer heterogeneity. Terr. Atmos. Ocean Sci. 2012, 23, 123–132. [Google Scholar] [CrossRef]
  40. Wendt, W.A.; Sakurai, S.T.; Nelson, P.H. Permeability prediction from well logs using multiple regression. In Reservoir Characterization; Elsevier: Amsterdam, The Netherlands, 1986; pp. 181–221. [Google Scholar]
  41. Glover, P.W.; Zadjali, I.I.; Frew, K.A. Permeability prediction from MICP and NMR data using an electrokinetic approach. Geophysics 2006, 71, F49–F60. [Google Scholar] [CrossRef]
  42. Kasenow, M. Determination of Hydraulic Conductivity from Grain Size Analysis; Water Resources Publication: Highlands Ranch, CO, USA, 2002. [Google Scholar]
  43. Li, P.-N.; Xu, Y.-S.; Wang, X.-W. Estimation of hydraulic conductivity by the modified Kozeny—Carman equation considering the derivation principle of the original equation. J. Hydrol. 2023, 621, 129658. [Google Scholar] [CrossRef]
  44. Abdel Azim, R.; Aljehani, A. Neural network model for permeability prediction from reservoir well logs. Processes 2022, 10, 2587. [Google Scholar] [CrossRef]
  45. Helle, H.B.; Bhatt, A.; Ursin, B. Porosity and permeability prediction from wireline logs using artificial neural networks: A North Sea case study. Geophys. Prospect. 2001, 49, 431–444. [Google Scholar] [CrossRef]
  46. Trejo-Alonso, J.; Fuentes, C.; Chávez, C.; Quevedo, A.; Gutierrez-Lopez, A.; González-Correa, B. Saturated hydraulic conductivity estimation using artificial neural networks. Water 2021, 13, 705. [Google Scholar] [CrossRef]
  47. Carrera, J.; Alcolea, A.; Medina, A.; Hidalgo, J.; Slooten, L.J. Inverse problem in hydrogeology. Hydrogeol. J. 2005, 13, 206–222. [Google Scholar] [CrossRef]
  48. Tsai, F.T.-C.; Li, X. Inverse groundwater modeling for hydraulic conductivity estimation using Bayesian model averaging and variance window. Water Resour. Res. 2008, 44, W09403. [Google Scholar] [CrossRef]
  49. Perdomo, S.; Ainchil, J.E.; Kruse, E. Hydraulic parameters estimation from well logging resistivity and geoelectrical measurements. J. Appl. Geophys. 2014, 105, 50–58. [Google Scholar] [CrossRef]
  50. Khalil, M.A.; Santos, F.A.M. Hydraulic conductivity estimation from resistivity logs: A case study in Nubian sandstone aquifer. Arab. J. Geosci. 2013, 6, 205–212. [Google Scholar] [CrossRef]
  51. Szabó, N.P. Hydraulic conductivity explored by factor analysis of borehole geophysical data. Hydrogeol. J. 2015, 23, 869. [Google Scholar] [CrossRef]
  52. Ministerio de Ambiente y Desarrollo Sostenible; Instituto de Hidrología, Meteorología y Estudios Ambientales (IDEAM); Universidad Nacional de Colombia (UNAL); Instituto de Investigaciones Marinas y Costeras (INVEMAR). Programa Nacional de Monitoreo del Recurso Hídrico; Minambiente: Bogotá, Colombia, 2024; ISBN 978-628-7598-24-9. Available online: https://www.minambiente.gov.co/ (accessed on 10 July 2025).
  53. Little, K.E.; Hayashi, M.; Liang, S. Community-based groundwater monitoring network using a citizen-science approach. Groundwater 2016, 54, 317–324. [Google Scholar] [CrossRef]
  54. Condon, L.E.; Kollet, S.; Bierkens, M.F.P.; Fogg, G.E.; Maxwell, R.M.; Hill, M.C.; Hendricks Fransen, H.-J.; Verhoef, A.; Van Loon, A.F.; Sulis, M.; et al. Global groundwater modeling and monitoring: Opportunities and challenges. Water Resour. Res. 2021, 57, e2020WR029500. [Google Scholar] [CrossRef]
  55. Agencia Nacional de Hidrocarburos (ANH). Cuenca Valle Medio del Magdalena: Integración Geológica de la Digitalización y Análisis de Núcleos; Agencia Nacional de Hidrocarburos: Bogotá, Colombia, 2012. [Google Scholar]
  56. Nie, J.; Horton, B.K.; Mora, A.; Saylor, J.E.; Housh, T.B.; Rubiano, J.; Naranjo, J. Tracking exhumation of Andean ranges bounding the Middle Magdalena Valley basin, Colombia. Geology 2010, 38, 451–454. [Google Scholar] [CrossRef]
  57. Lozano, E.; Zamora, N. Anexo n Compilación de la Cuenca del Valle Medio del Magdalena. Available online: http://recordcenter.sgc.gov.co (accessed on 13 July 2025).
  58. Sarmiento-Rojas, L.F.; Van Wess, J.D.; Cloetingh, S. Mesozoic transtensional basin history of the Eastern Cordillera, Colombian Andes: Inferences from tectonic models. J. S. Am. Earth Sci. 2006, 21, 383–411. [Google Scholar] [CrossRef]
  59. Diaz Hoyos, S. Análisis Electrofacial y Petrofísico de los Pozos Cagüi-1 y Guane-1 y sus Implicaciones Identificando Sweet Spots en el Valle Medio del Magdalena. Master’s Thesis, Universidad EAFIT, Medellín, Colombia, 2022. [Google Scholar]
  60. Arenas Bautista, M.C. Integration of Hydrological and Economical Aspects for Water Management in Tropical Regions. Case Study: Middle Magdalena Valley, Colombia. Ph.D. Thesis, Universidad Nacional de Colombia, Bogotá, Colombia, 2019. [Google Scholar]
  61. Gómez, E.; Jordan, T.E.; Allmendinger, R.W.; Hegarty, K.; Kelley, S. Syntectonic Cenozoic sedimentation in the northern middle Magdalena Valley Basin of Colombia and implications for exhumation of the Northern Andes. Geol. Soc. Am. Bull. 2005, 117, 547–569. [Google Scholar] [CrossRef]
  62. Piña, A.; Donado, L.D.; Silva, L.; Pescador, J. Seasonal and deep groundwater-surface water interactions in the tropical Middle Magdalena River basin of Colombia. Hydrol. Process. 2022, 36, e14764. [Google Scholar] [CrossRef]
  63. Sarmiento, G.; Puentes, J.; Sierra, C. Evolución geológica y estratigrafía del Sector Norte del Valle Medio del Magdalena. Geol. Norandina 2015, 12, 51–82. [Google Scholar]
  64. Universidad Nacional de Colombia. Modelo Hidrodinámico Multiescala; Producto No. 7, Contrato RC No. FP44842-157-2018. Proyecto MEGIA; Universidad Nacional de Colombia: Bogotá, Colombia, 2024. [Google Scholar]
  65. Lora, B.; Silva, L.; Castro, E.; Donado, L. Characterization of spatial heterogeneity in sedimentary aquifer systems at regional scale by using hydrogeological modeling: A case study of the Middle Magdalena Valley basin-Colombia. In Proceedings of the EGU General Assembly Conference Abstracts, Vienna, Austria, 23–27 May 2022. EGU22-10680. [Google Scholar]
  66. Malagón, J.P.; Piña, A.; Argüello, S.; Donado, L.D. Análisis hidrogeoquímico-multivariado del agua subterránea del sistema acuífero del Valle Medio del Magdalena, Colombia: Estudio a escala regional. Bol. Soc. Geol. Mex. 2021, 73, 3. [Google Scholar] [CrossRef]
  67. Wyllie, M.R.J.; Gregory, A.R.; Gardner, L.W. Elastic wave velocities in heterogeneous and porous media. Geophysics 1956, 21, 41–70. [Google Scholar] [CrossRef]
  68. Szabó, N.P. Shale volume estimation based on the factor analysis of well-logging data. Acta Geophys. 2011, 59, 935–953. [Google Scholar] [CrossRef]
  69. Kamel, M.H.; Mabrouk, W.M.; Bayoumi, A.I. Porosity estimation using a combination of Wyllie–Clemenceau equations in clean sand formation from acoustic logs. J. Pet. Sci. Eng. 2002, 33, 241–251. [Google Scholar] [CrossRef]
  70. Poupon, A.; Gaymard, R. The evaluation of clay content from logs. In Proceedings of the SPWLA Annual Logging Symposium, Los Angeles, CA, USA, 3–6 May 1970. [Google Scholar]
  71. George, J.; Oloruntobi, O.; Butt, S. Development of a Probabilistic Correlation between the Gamma Ray Index and Shale Volume Factor to Improve Resource Estimation for the Niger Delta Basin, Nigeria. MIST Int. J. Sci. Technol. 2024, 12, 11–28. [Google Scholar] [CrossRef]
  72. Díaz-Curiel, J.; Miguel, M.J.; Biosca, B.; Arévalo-Lomas, L. Gamma ray log to estimate clay content in the layers of water boreholes. J. Appl. Geophys. 2021, 195, 104481. [Google Scholar] [CrossRef]
  73. Asquith, G.B.; Krygowski, D.; Gibson, C.R. Basic Well Log Analysis; American Association of Petroleum Geologists: Tulsa, OK, USA, 2004; Volume 16. [Google Scholar]
  74. Kennedy, D. Gamma Ray Index-Shale Volume Transforms. In Proceedings of the SPWLA Annual Logging Symposium, Virtual, 17–20 May 2021. [Google Scholar]
  75. Twfiq, M.Z.; Zarif, F.M.; Massoud, A.; Al-Temamy, A.M. Determination the petrophysical and natural radioactivity properties of Nubian sandstone aquifer at the area of northwest El Ain Village, Sharq El-Oweinat Area, Southwestern Desert, Egypt. Asian J. Environ. Ecol. 2021, 15, 37–55. [Google Scholar] [CrossRef]
  76. Alfaro, C.; Alvarado, I.; Quintero, W.; Vargas, C.; Briceño, L.A. Mapa Preliminar de Gradientes Geotérmicos de Colombia; Instituto Colombiano de Geología y Minería (INGEOMINAS), Ministerio de Minas y Energía de Colombia: Bogotá, Colombia, 2009.
  77. Csókás, J. Determination of yield and water quality of aquifers based on geophysical well logs. Magy. Geofiz. 1995, 35, 176–203. [Google Scholar]
  78. Szabó, N.P.; Kormos, K.; Dobróka, M. Evaluation of hydraulic conductivity in shallow groundwater formations: A comparative study of the Csókás’ and Kozeny–Carman model. Acta Geod. Geoph. 2015, 50, 461–477. [Google Scholar] [CrossRef]
  79. Renard, P.; Glenz, D.; Mejias, M. Understanding diagnostic plots for well-test interpretation. Hydrogeol. J. 2009, 17, 589–600. [Google Scholar] [CrossRef]
  80. Erer, K.S. Adaptive usage of the Butterworth digital filter. J. Biomech. 2007, 40, 2934–2943. [Google Scholar] [CrossRef]
  81. Renard, P. Hytool: An open source matlab toolbox for the interpretation of hydraulic tests using analytical solutions. J. Open Source Softw. 2017, 2, 441. [Google Scholar] [CrossRef]
  82. Mobarra, M.; Rezkallah, M.; Ilinca, A. Variable speed diesel generators: Performance and characteristic comparison. Energies 2022, 15, 592. [Google Scholar] [CrossRef]
  83. Duffield, G.M. AQTESOLV for Windows Version 4.5 User’s Guide; HydroSOLVE: Reston, VA, USA, 2007. [Google Scholar]
  84. Yao, Y.; Zheng, C.; Tian, Y.; Liu, J.; Zheng, Y. Numerical modeling of regional groundwater flow in the Heihe River Basin, China: Advances and new insights. Sci. China Earth Sci. 2015, 58, 3–15. [Google Scholar] [CrossRef]
  85. De Marsily, G.; Delay, F.; Teles, V.; Schafmeister, M.T. Some current methods to represent the heterogeneity of natural media in hydrogeology. Hydrogeol. J. 1998, 6, 115–130. [Google Scholar] [CrossRef]
  86. Enemark, T.; Peeters, L.J.M.; Mallants, D.; Batelaan, O. Hydrogeological conceptual model building and testing: A review. J. Hydrol. 2019, 569, 310–329. [Google Scholar] [CrossRef]
  87. Karmakar, S.; Tatomir, A.; Oehlmann, S.; Giese, M.; Sauter, M. Numerical benchmark studies on flow and solute transport in geological reservoirs. Water 2022, 14, 1310. [Google Scholar] [CrossRef]
  88. Diersch, H.-J.G. FEFLOW: Finite Element Modeling of Flow, Mass and Heat Transport in Porous and Fractured Media; Springer Science & Business Media: Berlin/Heidelberg, Germany, 2013. [Google Scholar]
  89. Doherty, J.E.; Hunt, R.J.; Tonkin, M.J. Approaches to Highly Parameterized Inversion: A Guide to Using PEST for Model-Parameter and Predictive-Uncertainty Analysis; U.S. Department of the Interior, U.S. Geological Survey: Reston, VA, USA, 2011; Volume 2010.
  90. Gatto, B.; Furlanetto, D.; Camporese, M.; Trentin, T.; Salandin, P. Quantifying groundwater recharge in the Venetian high plain between the Brenta and Piave Rivers through integrated surface–subsurface hydrological modeling. J. Hydrol. Reg. Stud. 2023, 50, 101550. [Google Scholar] [CrossRef]
  91. Vargas Quintero, J.A. Modelamiento de la Estructura Resistiva del Valle Medio del Magdalena a Partir de la Interpretación de Estudios Magnetotelúricos; Universidad Nacional de Colombia: Bogotá, Colombia, 2021; Available online: https://repositorio.unal.edu.co/items/8154d03b-3d41-4982-b4e1-22707e5e225b (accessed on 12 June 2025).
  92. Rubin, Y. Applied Stochastic Hydrogeology; Oxford University Press: Oxford, UK, 2003. [Google Scholar]
Figure 1. Study area illustrating (A) the general location and administrative departments along with (B) elevation in meters above mean sea level, municipalities, and major surface water bodies. This figure highlights the spatial position of the Middle Magdalena Valley (MMV), with an emphasis on its topography. The HydroSHEDS DEM (World Wildlife Fund, 2006–2013), derived from NASA’s Shuttle Radar Topography Mission (SRTM) at 92 m spatial resolution, was utilized for this analysis. The figures were generated using ArcGIS Pro software, Version 3.1. In (C), a geological map displaying outcropping of Neogene–Quaternary units in the northern Middle Magdalena Valley, the locations of wells with geophysical logs, and those where pumping tests were conducted. The figures were generated using QGIS software, Version 3.36.2.
Water 17 02439 g001
Figure 2. Proposed methodology for estimating hydraulic conductivity from borehole geophysical logs.
Water 17 02439 g002
Figure 3. Conceptual model of the regional groundwater flow system in the Middle Magdalena Valley (MMV). Boundary conditions are represented and illustrated with field photographs taken by the author. The main groundwater flow direction is indicated by light blue arrows. The figure was generated using FEFLOW v.8.1 (Update 3), 64-bit version (May 2024).
Water 17 02439 g003
Figure 4. Mesh configuration of the numerical model and spatial distribution of recharge. In (A), the two-dimensional mesh of the model domain is displayed, with patch colors representing groundwater recharge (mm/year) applied at the upper boundary; (B,C) illustrate the corresponding three-dimensional mesh, showing the vertical discretization of the Neogene–Quaternary aquifer system. All figures were generated using FEFLOW version 8.1.
Water 17 02439 g004
Figure 5. Hydraulic conductivity zonation used for parameterization of the numerical model. Figure created using FEFLOW version 8.1.
Water 17 02439 g005
Figure 6. Calibration plot for the regional-scale groundwater flow model. The figure was generated using Python (Jupyter Notebook v7.0.8, Anaconda distribution) based on the steady-state simulation outputs exported from FEFLOW v8.1.
Water 17 02439 g006
Figure 7. Well log profiles of sonic transit time, gamma ray index, and resistivity for the Aguachica-1, Musanda-1, Norean-1, and Tisquirama Este-1 wells. The logs display depth variations of each parameter, which were used to estimate effective porosity and hydraulic conductivity.
Water 17 02439 g007
Figure 8. Depth profile of sonic transit time, gamma ray index, and effective porosity for the Aguachica-1, Musanda-1, Norean-1, and Tisquirama Este-1 wells. The mean μ and standard deviation σ are reported for each parameter.
Water 17 02439 g008
Figure 9. Hydraulic conductivity (K) as a function of depth for the Aguachica-1, Musanda-1, Norean-1, and Tisquirama Este-1 wells. Each profile represents the vertical distribution of K, with the mean μ and standard deviation σ indicated for each well.
Water 17 02439 g009
Figure 10. Probability density functions of hydraulic conductivity (K) for the Aguachica-1, Musanda-1, Norean-1, and Tisquirama Este-1 wells. The figure presents the normal distribution fitted to each dataset, displaying the mean ( μ ) and standard deviation ( σ ), along with the root mean square error (RMSE) and mean absolute error (MAE) as indicators of goodness of fit.
Water 17 02439 g010
Figure 11. Boxplot of hydraulic conductivity (K) for the analyzed hydrogeological units. The data are presented on a logarithmic scale to illustrate the variability in K values across Quaternary deposits (QAt, QCal, QFal, QFc, QFl, QTf) and Real Group units (U4, U3, U2, U1).
Water 17 02439 g011
Figure 12. Comparison of the mean hydraulic conductivity values estimated for each analyzed well and the statistical distribution of hydraulic conductivity obtained from pumping tests in the studied hydrogeological units.
Water 17 02439 g012
Table 1. Summary of estimated statistical parameters derived from log analysis for each analyzed well. The table reports the geometric mean ( K g ), the standard deviation of the log-transformed values ( σ log K ), and the estimated effective hydraulic conductivity ( K eff ).
Well K g [m/day] σ log K K eff [m/day]
AGUACHICA-11.291.181.12
MUSANDA-12.251.111.06
NOREAN-12.340.741.00
TISQUIRAMA ESTE-11.231.071.06
Table 2. Statistical summary of transmissivity (T) and hydraulic conductivity (K) for the hydrogeological units of the Middle Magdalena Valley. The table presents the geometric mean ( T g ), maximum, minimum, and standard deviation for each unit.
Hydrogeological UnitsHydraulic Transmissivity (m2/Day)Hydraulic Conductivity (m/Day)
Mean ( T g ) Max Min Std Dev. Mean ( K g ) Max Min Std Dev.
QTf16.6386.511.8933.010.538.650.083.72
QFl15.85261.900.08116.960.564.450.011.80
QFc70.061104.402.45289.561.6523.500.055.91
QFal42.002627.100.65409.061.56154.920.0221.63
QCal5.6724.060.977.690.221.810.020.55
QAt4.4578.580.3044.220.070.990.000.54
Quaternary total32.542627.100.08347.491.09154.920.0017.29
Real U487.172627.100.65571.131.36154.920.0230.00
Real U369.881104.402.81335.930.969.670.053.38
Real U28.3625.931.4312.310.212.590.051.46
Real U124.18190.001.7460.401.0012.930.014.37
Real total55.252627.100.65447.611.06154.920.0121.65
Table 3. Hydraulic conductivity values estimated through the steady-state calibration of the regional groundwater model for each hydrogeological unit.
Hydrogeological Unit K x (m/day) K y (m/day) K z (m/day)
QFal1.51.50.15
QCal1.01.00.10
QTf1.01.00.10
QAt0.40.40.04
QFl0.80.80.08
QFc1.61.60.16
Real U4 North0.10.10.01
Real U3 North0.70.70.07
Real U2 North0.20.20.02
Real U1 North0.050.050.005
Real U4 South1.31.30.13
Real U3 South0.90.90.09
Real U2 South0.30.30.03
Real U1 South0.10.10.01
Disclaimer/Publisher’s Note: The statements, opinions and data contained in all publications are solely those of the individual author(s) and contributor(s) and not of MDPI and/or the editor(s). MDPI and/or the editor(s) disclaim responsibility for any injury to people or property resulting from any ideas, methods, instructions or products referred to in the content.