1. Introduction
Geothermal energy comes from the exothermic heat of magma and the decay of radioactive elements within the Earth, and geothermal water, geothermal fields, and volcanic eruptions are the three main ways in which geothermal energy transfers energy to the Earth’s surface [
1]. Geothermal resources include geothermal energy, geothermal fluids, and the useful components of the Earth’s interior that can be economically utilized by humans [
2,
3,
4]. Geothermal energy has unique advantages, such as low cost, sustainable utilization, and environmental friendliness, and is an efficient and clean renewable energy source [
5,
6]. There are various types of geothermal resources. This article takes hot water-type geo-thermal resources as the main body for research. This resource is carried by liquid water and is mainly distributed in the shallow layer of the Earth’s crust. Its manifestations include hot springs and underground hot water with a temperature exceeding 25 °C that overflows the surface or is artificially excavated and extracted. Based on temperature differences, hot-water geothermal resources can be classified into three categories: high-temperature type (>150 °C), medium-temperature type (90–150 °C), and low-temperature type (≥25 °C and <90 °C). For a long time, many scholars have studied the genesis mechanism of geothermal water by means of hydrogeochemical characterization and isotopic characterization of surface water and groundwater. In the field of geothermal water research, the analytical methods of hydrogeochemistry and isotopic characteristics play an extremely crucial role. They can explain the chemical composition, circulation path, migration, and evolution process of geothermal water, as well as indicate the geological environment where geothermal water is located, and thereby derive a genesis model for geothermal water. The emergence of the Piper three-line graph provides a crucial reference basis for exploring the hydrogeochemical characteristics of geothermal water. By analyzing the content ratios of the main chemical components of geothermal water, different types of water chemistry can be identified. During the underground circulation of geothermal water, water–rock interactions occur with the surrounding rocks, causing the chemical components within the rocks to dissolve into the geothermal water. Based on the ion ratio of geothermal water and the local rock types, the sources of different water chemical types can be further analyzed. In addition, factors such as temperature, pressure and pH value simultaneously act on the evolution process of geothermal water. Isotopes in geothermal water, such as hydrogen isotopes and oxygen isotopes, are often used to trace the sources of geothermal water replenishment. Carbon isotopes, on the other hand, are applied in the age determination of geothermal water. By integrating hydrogeochemical analysis, isotopes, and the geo-logical conditions of the study area, the formation mechanism of geothermal water is inferred.
Hydrogeochemical ion ratios serve as effective tracers for elucidating water–rock interactions and characterizing cation exchange processes in aquatic systems [
7]. By analyzing geothermal geological features such as heat source conditions, heat-controlling tectonics, heat storage conditions, and cover conditions in the area, the geothermal genesis model can be summarized [
8]. The analysis by Peiffer et al. [
9] reveals that geothermal water collected from different regions varies in water chemical types. The comprehensive application of hydrogeochemistry and stable isotopes provides new insights into thermal anomalies within rift valley systems. Deuterium-oxygen isotope tracing is a key tool for analyzing water transport pathways along the “atmosphere–vegetation–soil–groundwater” continuum through its unique fractionation effect. The deuterium-oxygen isotope tracer technique, characterized by the δD-δ
18O (‰) double isotope fingerprint, shows unique advantages in the analysis of hydrodynamic connections, material transport paths, and hydrological process time scales [
10]. Craig [
11], considering meteorological conditions, selected over 400 natural water samples from around the world and conducted research on the contents of δD and δ
18O in them, ultimately deriving the Craig equation. He et al. [
12] collected 37 geothermal water samples from hot springs in the active tectonic area of the Sanjiang Tethys orogenic belt. Through the analysis of stable isotopes (δD and δ
18O), they believed that the source of geothermal water replenishment in this area was atmospheric precipitation. Sun et al. [
13] used isotopes such as
14C to explore the genesis of geothermal fluids in the intracontinental orogenic belt at the edge of the North China Fault Depression Basin. Zhu et al. [
14], based on hydrogeochemistry, conducted research on the recharge, circulation, and genesis of geothermal water in the Yinchuan Basin, which is of great significance for the sustainable development and utilization of geothermal resources. The water–rock interaction refers to the hydrogeochemical reaction caused by the difference in chemical composition between geothermal water and the surrounding rock [
15]. This interaction not only promotes the evolution process of the surface and near-surface environment, but also has an effect on the evolution of geothermal water and the stability of the stratum structure [
16]. Multi-mineral equilibrium analysis, an effective approach for assessing chemical equilibrium states between geothermal fluids and reservoir minerals [
17], can be employed to estimate thermal reservoir temperatures based on cation equilibrium and dissolved SiO
2 geothermometry [
18]. In 1976, Muffler classified geothermal water systems into two types based on geological conditions and heat transfer methods: convective and conductive [
19]. This classification method is still widely recognized today.
The middle reaches of the Wenhe River are situated in the Luzhong mountainous region of Shandong Province, an area notable for its abundant geothermal resources. The studied geothermal resources demonstrate multiple favorable attributes, including widespread reservoir distribution, diverse reservoir lithologies, moderate burial depths, abundant thermal fluid reserves, and significant development potential. These systems are predominantly characterized by low-to-medium-temperature regimes (25–150 °C), offering optimal conditions for sustainable exploitation [
20,
21]. Systematic exploration and evaluation initiatives launched in 1959 have, through decades of research, yielded a comprehensive understanding of key aspects, including: reservoir development characteristics in the Ludong Mountainous Hills, Lujong Mountainous Hills, and Lubei Plain regions; hydrogeochemical evolution of geothermal fluids; isotopic signatures; thermal field distribution patterns; and genetic mechanisms of the geothermal systems [
22,
23]. In recent years, the hydrogeological survey and special water resources development project have completed the drilling and evaluation of geothermal fields in the Luzhong mountainous area [
24,
25].
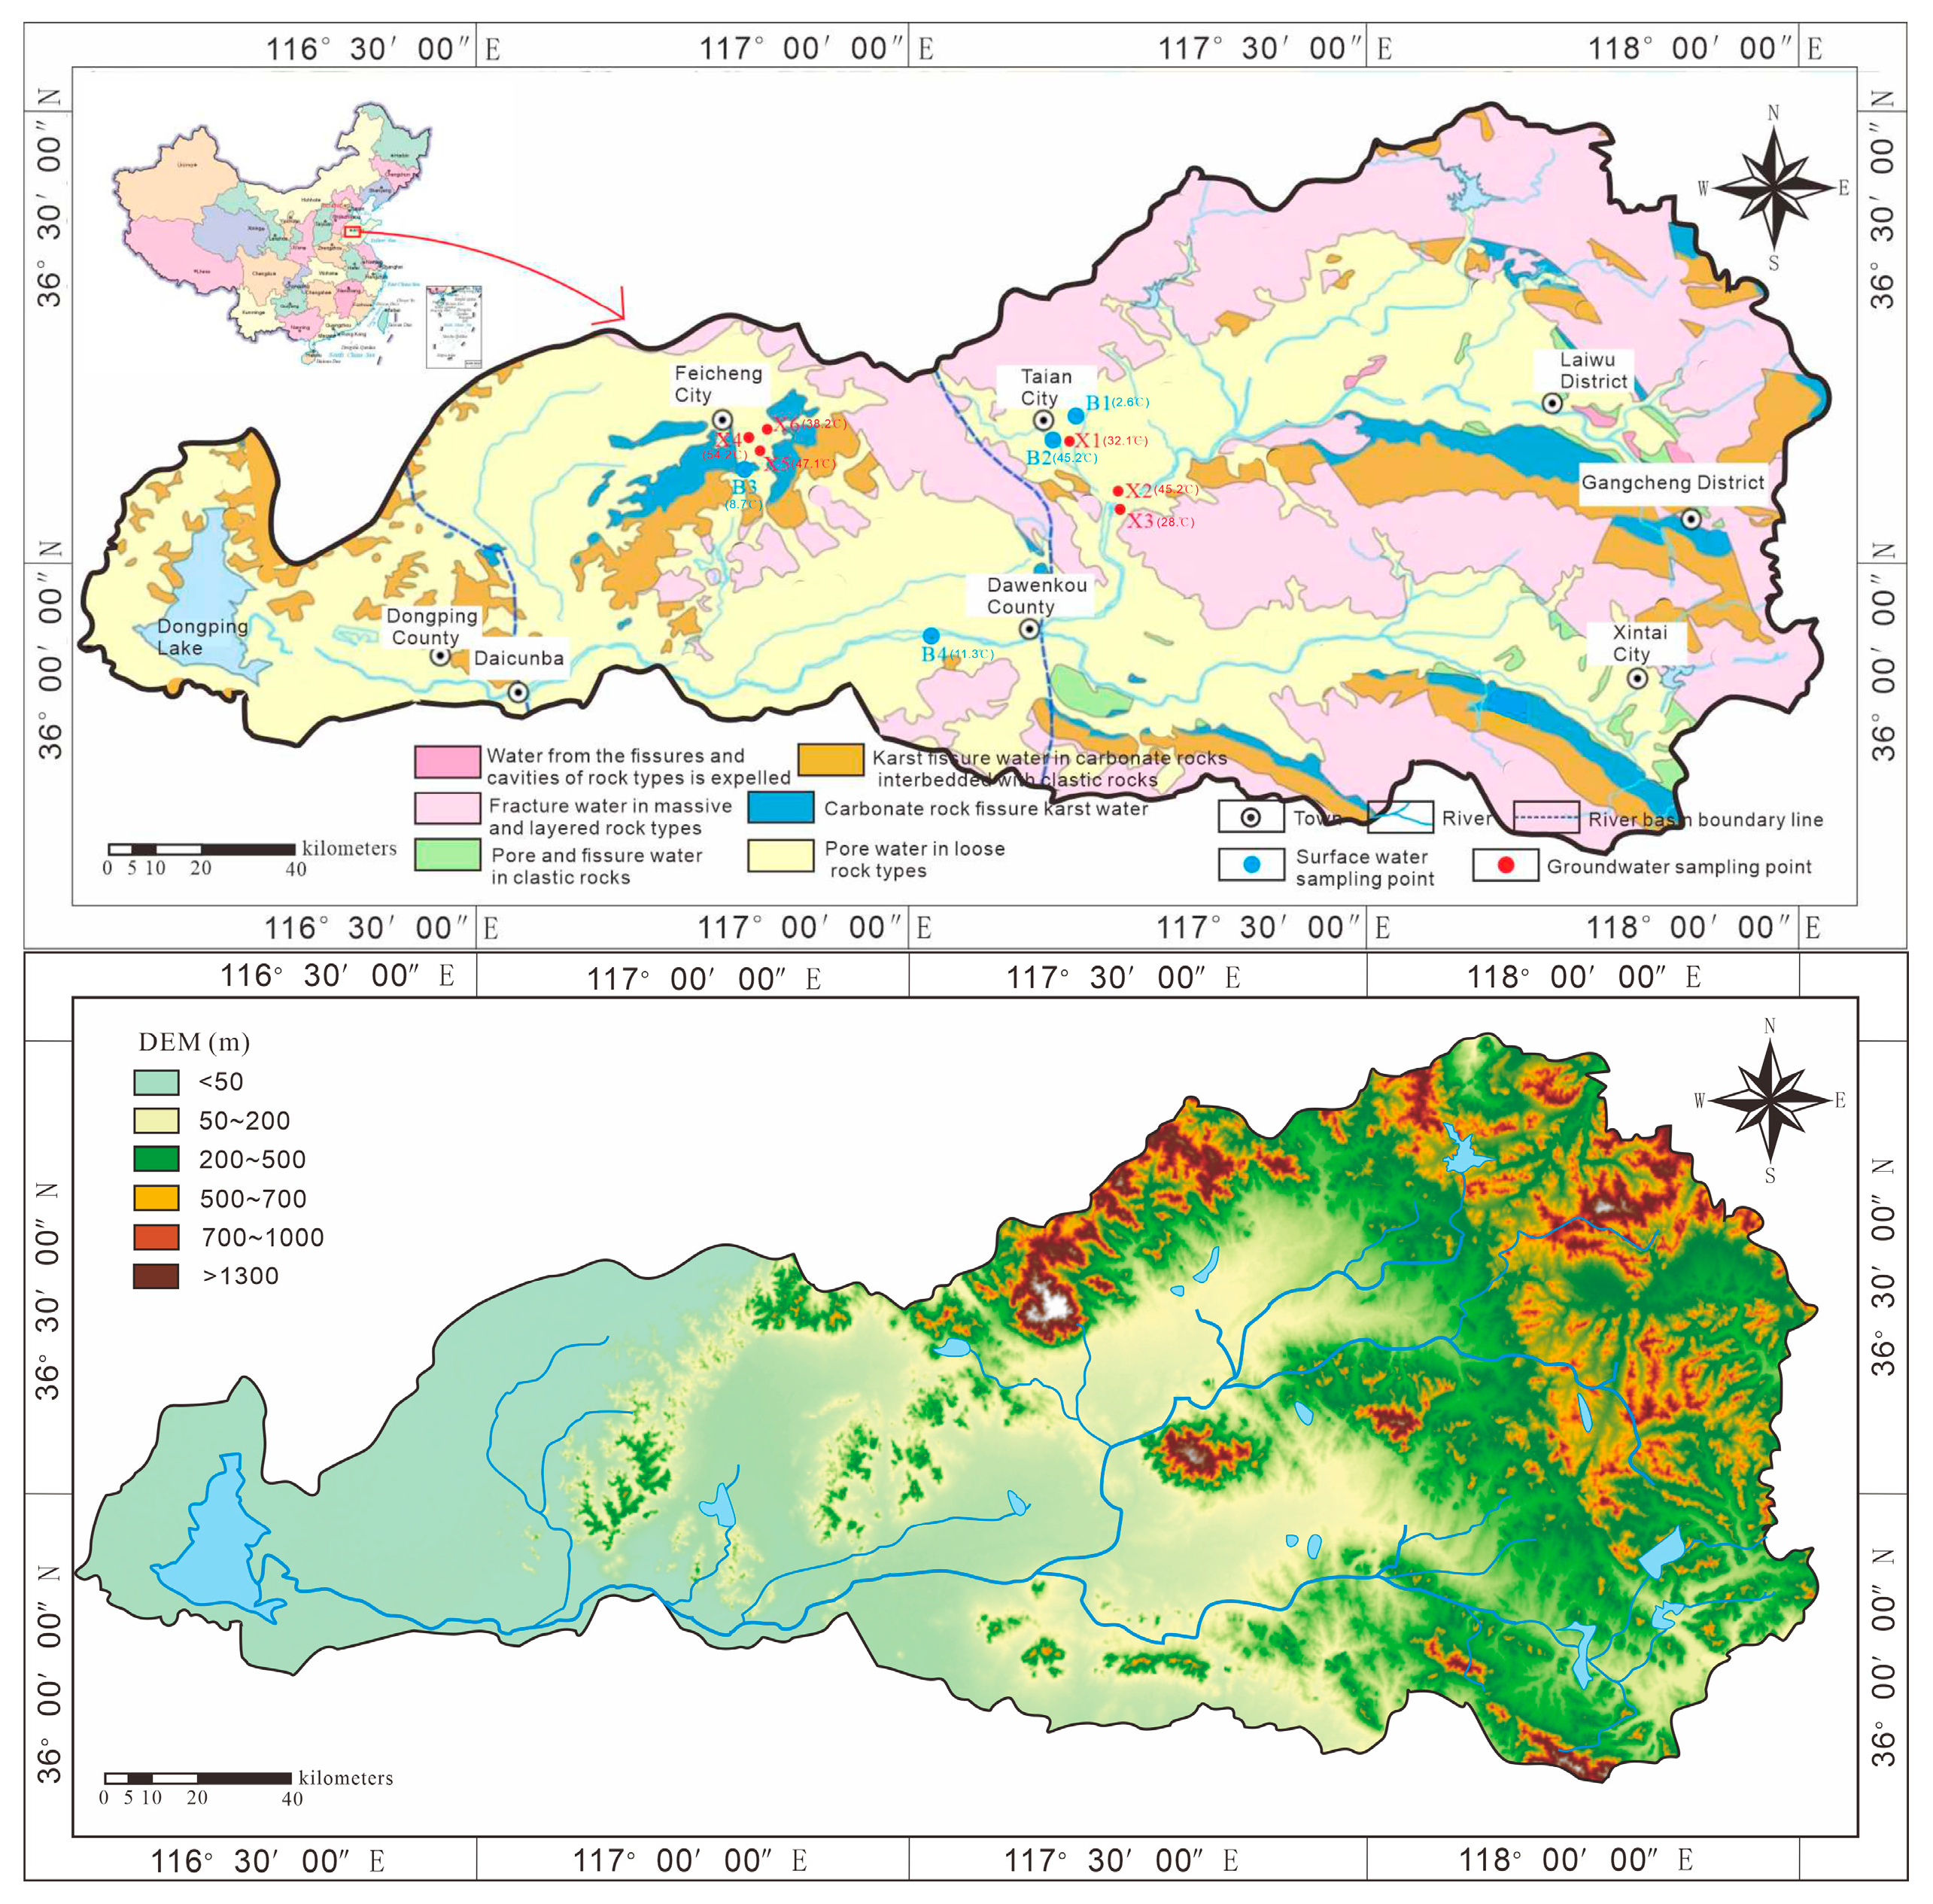
The study area encompasses hot spring sampling sites located along the middle reaches of the Wen River, specifically situated west of Daidaoan Hot Spring Road in Taian City, north of Qiaogou Village in Culai Town, and within Anjiazhuang Town, Feicheng City. Due to influencing factors including surface river water mixing and variable mining durations, the in situ geothermal water temperatures exhibit considerable variation, ranging from 28 °C to 54.2 °C, while closed-system measurements indicate potential reservoir temperatures reaching 80 °C. The geothermal water occurrence area lies at the junction of the Feicheng fracture basin, Dawenkou basin, and Tailai basin, with elevations ranging from 100 to 300 m. To the north is the Taishan bulge, with an elevation exceeding 1532 m; to the east is the Feedback Mountain bulge; and to the southwest is the Talesanbushan bulge. The geothermal water outcrops are distributed in the fracture zones of the Feicheng Fracture, Wenkou Fracture, and Taian–Dawangzhuang Fracture, showing obvious control by these fractures. The distribution area is small, the geothermal gradient in the overlying strata is high, and the thermal reservoir is shallow with belt-like characteristics. This study systematically investigates the geological structure and hydrogeological conditions of the study area. Through comprehensive analysis of hydrogeochemical and isotopic characteristics of geothermal fluids, we quantitatively determine the recharge elevation, thermal reservoir temperature, and origins of both water and heat sources. Furthermore, we elucidate the genetic mechanisms governing the geothermal system. The findings provide crucial hydrogeological insights to support sustainable development and utilization of local geothermal resources.
3. Results and Discussion
In this study, a total of ten groups of samples were collected. Specifically, two groups of samples, consisting of geothermal water and the surrounding river water, were obtained from Daidaoan in Mount Taishan, labeled as B1 and X1. In Qiaogou, Culai Town, three groups of samples were collected, which included geothermal water and the surrounding river water, and they were designated as B2, X2, and X3. Additionally, five groups of samples were gathered from Anjiazhuang in Feicheng. These samples also comprised geothermal water and the surrounding river water, and were marked as B3, X4, X5, X6, and B4.
3.1. Supply Sources
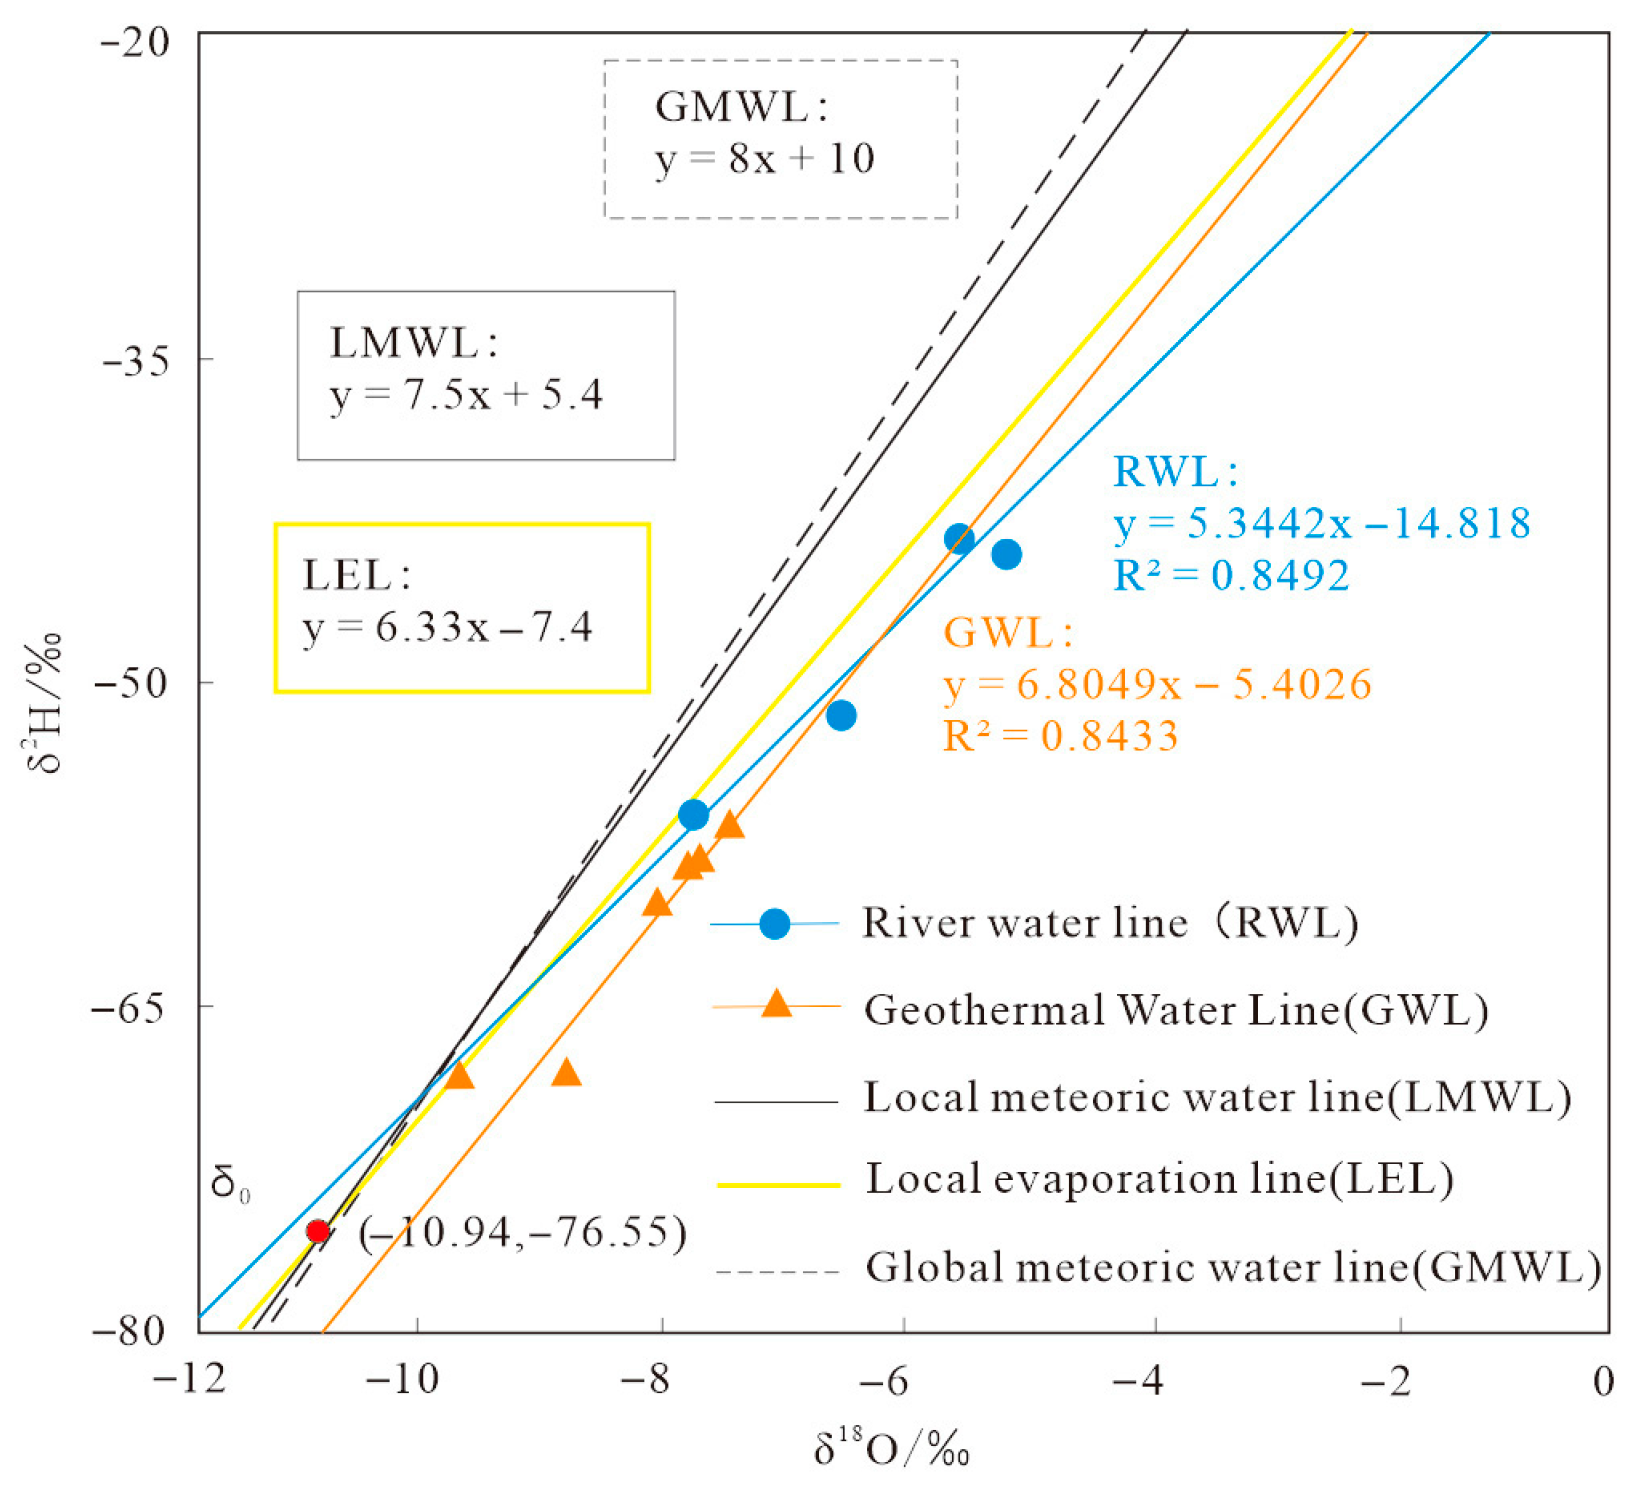
This study is based on a dataset of deuterium and oxygen isotopes in geothermal water and surrounding river water and constructs an isotope water line system in geothermal areas to reveal the evaporation and fractionation mechanisms and recharge characteristics of different water bodies (
Figure 2). By comparing the global atmospheric precipitation line (GMWL) with local water cycle parameters, the controlling role of hydrological processes on isotopic composition is elucidated.
The global atmospheric waterline (GMWL) formula is:
The river water line (RWL) formula is:
The slope and intercept are 5.3442 and −14.818, respectively, R2 = 0.85.
The slope of the surface water δD-δ
18O relationship line is 5.3442, which is lower than the slope of GMWL by 8. This deviation is consistent with the Craig Gordon evaporation model prediction: during non-equilibrium evaporation in open water bodies, the enrichment rate of δ
18O is faster than that of δD, resulting in a decrease in slope. The local atmospheric waterline (LMWL) formula for the watershed is:
Compared with GMWL, the slope decreased by 6.25%, reflecting the secondary evaporation effect of precipitation in the monsoon region, where precipitation mixed with dry air during the falling process. The intercept decreased by 46%, indicating continental climate characteristics, and the water vapor source path was transformed through inland recirculation. The local evaporation line (LEL) formula is:
The slope is 6.33, which is 15.6% lower than that of LMWL, revealing the evaporation evolution law of the water body in the study area.
The formula for the groundwater line (GWL) is:
The slope and intercept are 6.80 and −5.40, respectively, R2 = 0.84.
The groundwater system exhibits unique isotopic characteristics: the mean “d-excess” is 4.53‰, significantly lower than the local atmospheric precipitation background value of 9.76‰, but higher than the surface water system by 0.78‰. This difference reveals that there is a dual mechanism for groundwater recharge, with rapid infiltration through preferential flow in fractured media and slow leakage through evaporation losses in the unsaturated zone.
The values of δD (‰) and δ
18O (‰) have a certain relationship with elevation. As altitude increases, the isotopes in water decrease. It is manifested that, for every 100 m increase in altitude, δD (‰) decreases by 1.3‰ and δ
18O (‰) decreases by 0.3‰ [
26]. The replenishment elevation was calculated by using the relationship between the δD (‰) of the atmospheric precipitation line in China and the elevation [
27] (Formulas (7) and (8)). The formula is as follows:
In the formula, H represents the replenishment elevation. The mean values of Formulas (7) to (8) indicate that the replenishment elevation is approximately 2865.76 to 4126.69 m.
3.2. Hydrogeochemical Characteristics
3.2.1. Main Characteristics of Changes in Anions and Cations
By studying the milligram equivalent of the main components in the research area, a Schoeller logarithmic plot (
Figure 3) was plotted, indicating that, except for Ca
2+, Mg
2+, and HCO
3−, the content of other elements showed a similar trend to TDS, suggesting that they may have undergone similar water–rock interactions or have similar sources. Ca
2+, Mg
2+, and HCO
3 showed a similar trend, and there may have been carbonate decomposition.
Due to the good solubility and migration ability of Na
+, both geothermal water and river water in the study area had Na
+ as the dominant cation (
Figure 4), ranging from 42.37 to 279.40 mg/L. Next was Ca
2+, ranging from 8.17 to 40.81 mg/L. There are a large number of carbonate rocks in the research area, and it is speculated that Ca
2+ comes from the dissolution of carbonate rocks.
Figure 4 demonstrates a consistent spatial trend in cation concentrations across the three studied geothermal areas (Daidaoan, Qiaogou, and Anjiazhuang), indicating similar hydrogeochemical processes governing water–rock interactions in these systems. The significant difference in the percentage of milliequivalents of anions indicates the existence of different hydrochemical types in different water samples. HCO
3− ranges from 93.06 to 334.39 mg/L, SO
42− ranges from 28.92 to 1391.93 mg/L, and Cl
− ranges from 7.72 to 382.41 mg/L. Among them, B1, X1, B2, and X6 have HCO
3− as the main anion; X2, X3, X4, and X5 have SO
42− as the dominant anion; and B3 and B4 are mainly composed of Cl
−.
3.2.2. Types of Water Chemistry
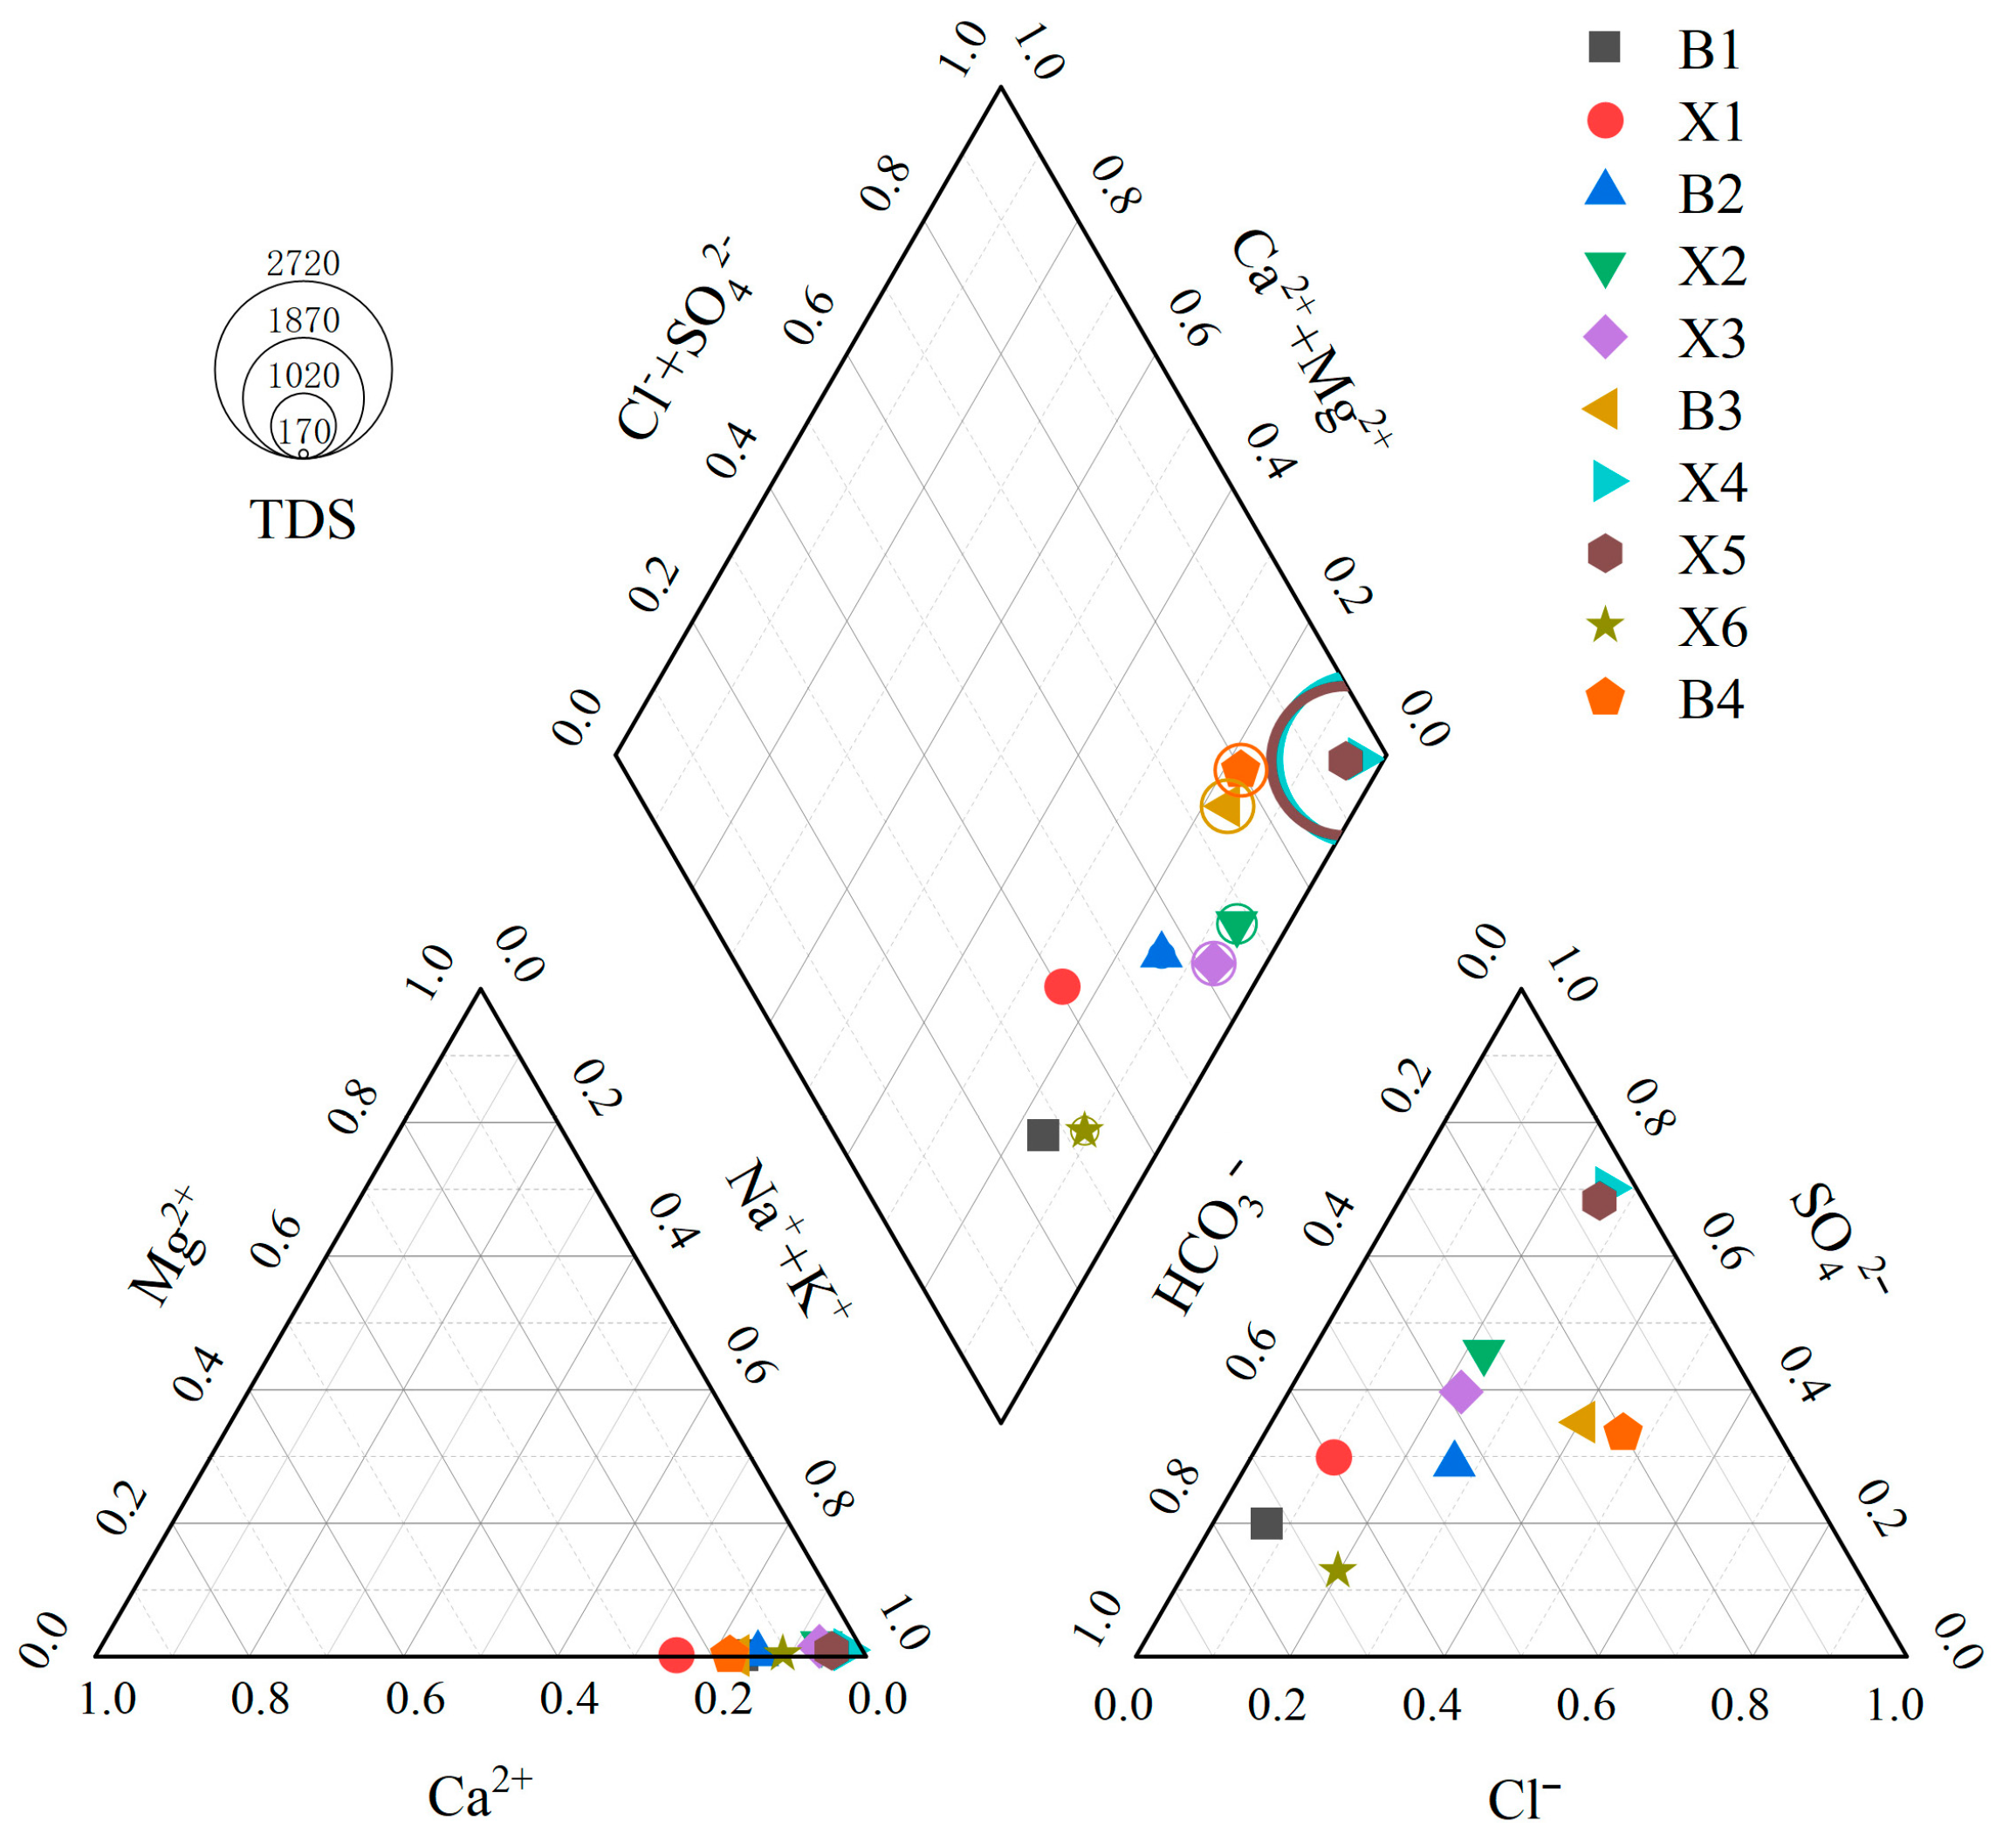
The Piper trilinear diagram combined with the Shukalev classification was used to determine the hydrochemical type and then analyze the evolution law of groundwater chemical composition. B1 and X6 are of HCO
3-Na-type; X1 is of HCO
3·SO
4 Na-type; B2 is HCO
3·SO
4·Cl-Na; X2 and X3 are SO
4·HCO
3-Na-type; B3 and B4 are Cl·SO
4-Na-type; and X4 and X5 are SO
4·Cl-Na-type (
Figure 5). It can be seen that, although there are differences in the hydrochemical types of surface water and groundwater in the same geothermal area, the overall difference is not significant, indicating that it is influenced by water–rock interactions and cation exchange.
3.3. Hydrogeochemical Ion Tracing
The chemical composition of geothermal fluids exhibits significant variation across different geological environments, with distinct ionic signatures providing critical insights into their origin and formation processes. Specific ionic ratios (e.g., Na+/Cl−, Ca2+/Mg2+) serve as reliable indicators of water–rock interaction intensity, whereas elevated concentrations of characteristic ions (such as Cl− and SO42−) may reflect seawater mixing influences. High-salinity geothermal waters typically form in confined aquifer systems with limited recharge, whereas low-salinity fluids often derive from open circulation systems with active meteoric water participation. Through comprehensive hydrochemical analysis of these ionic characteristics, researchers can effectively determine the genetic classification and evolutionary pathways of geothermal water systems.
Cl
− has relatively stable chemical properties, and its content is not prone to significant fluctuations. However, the stability of Na
+ is low, and water–rock interactions, cation exchange, and other factors have a significant impact on Na
+ content. Therefore, the enrichment of rock salt in geothermal water is characterized by the ratio of γ(Na
+)/γ(Cl
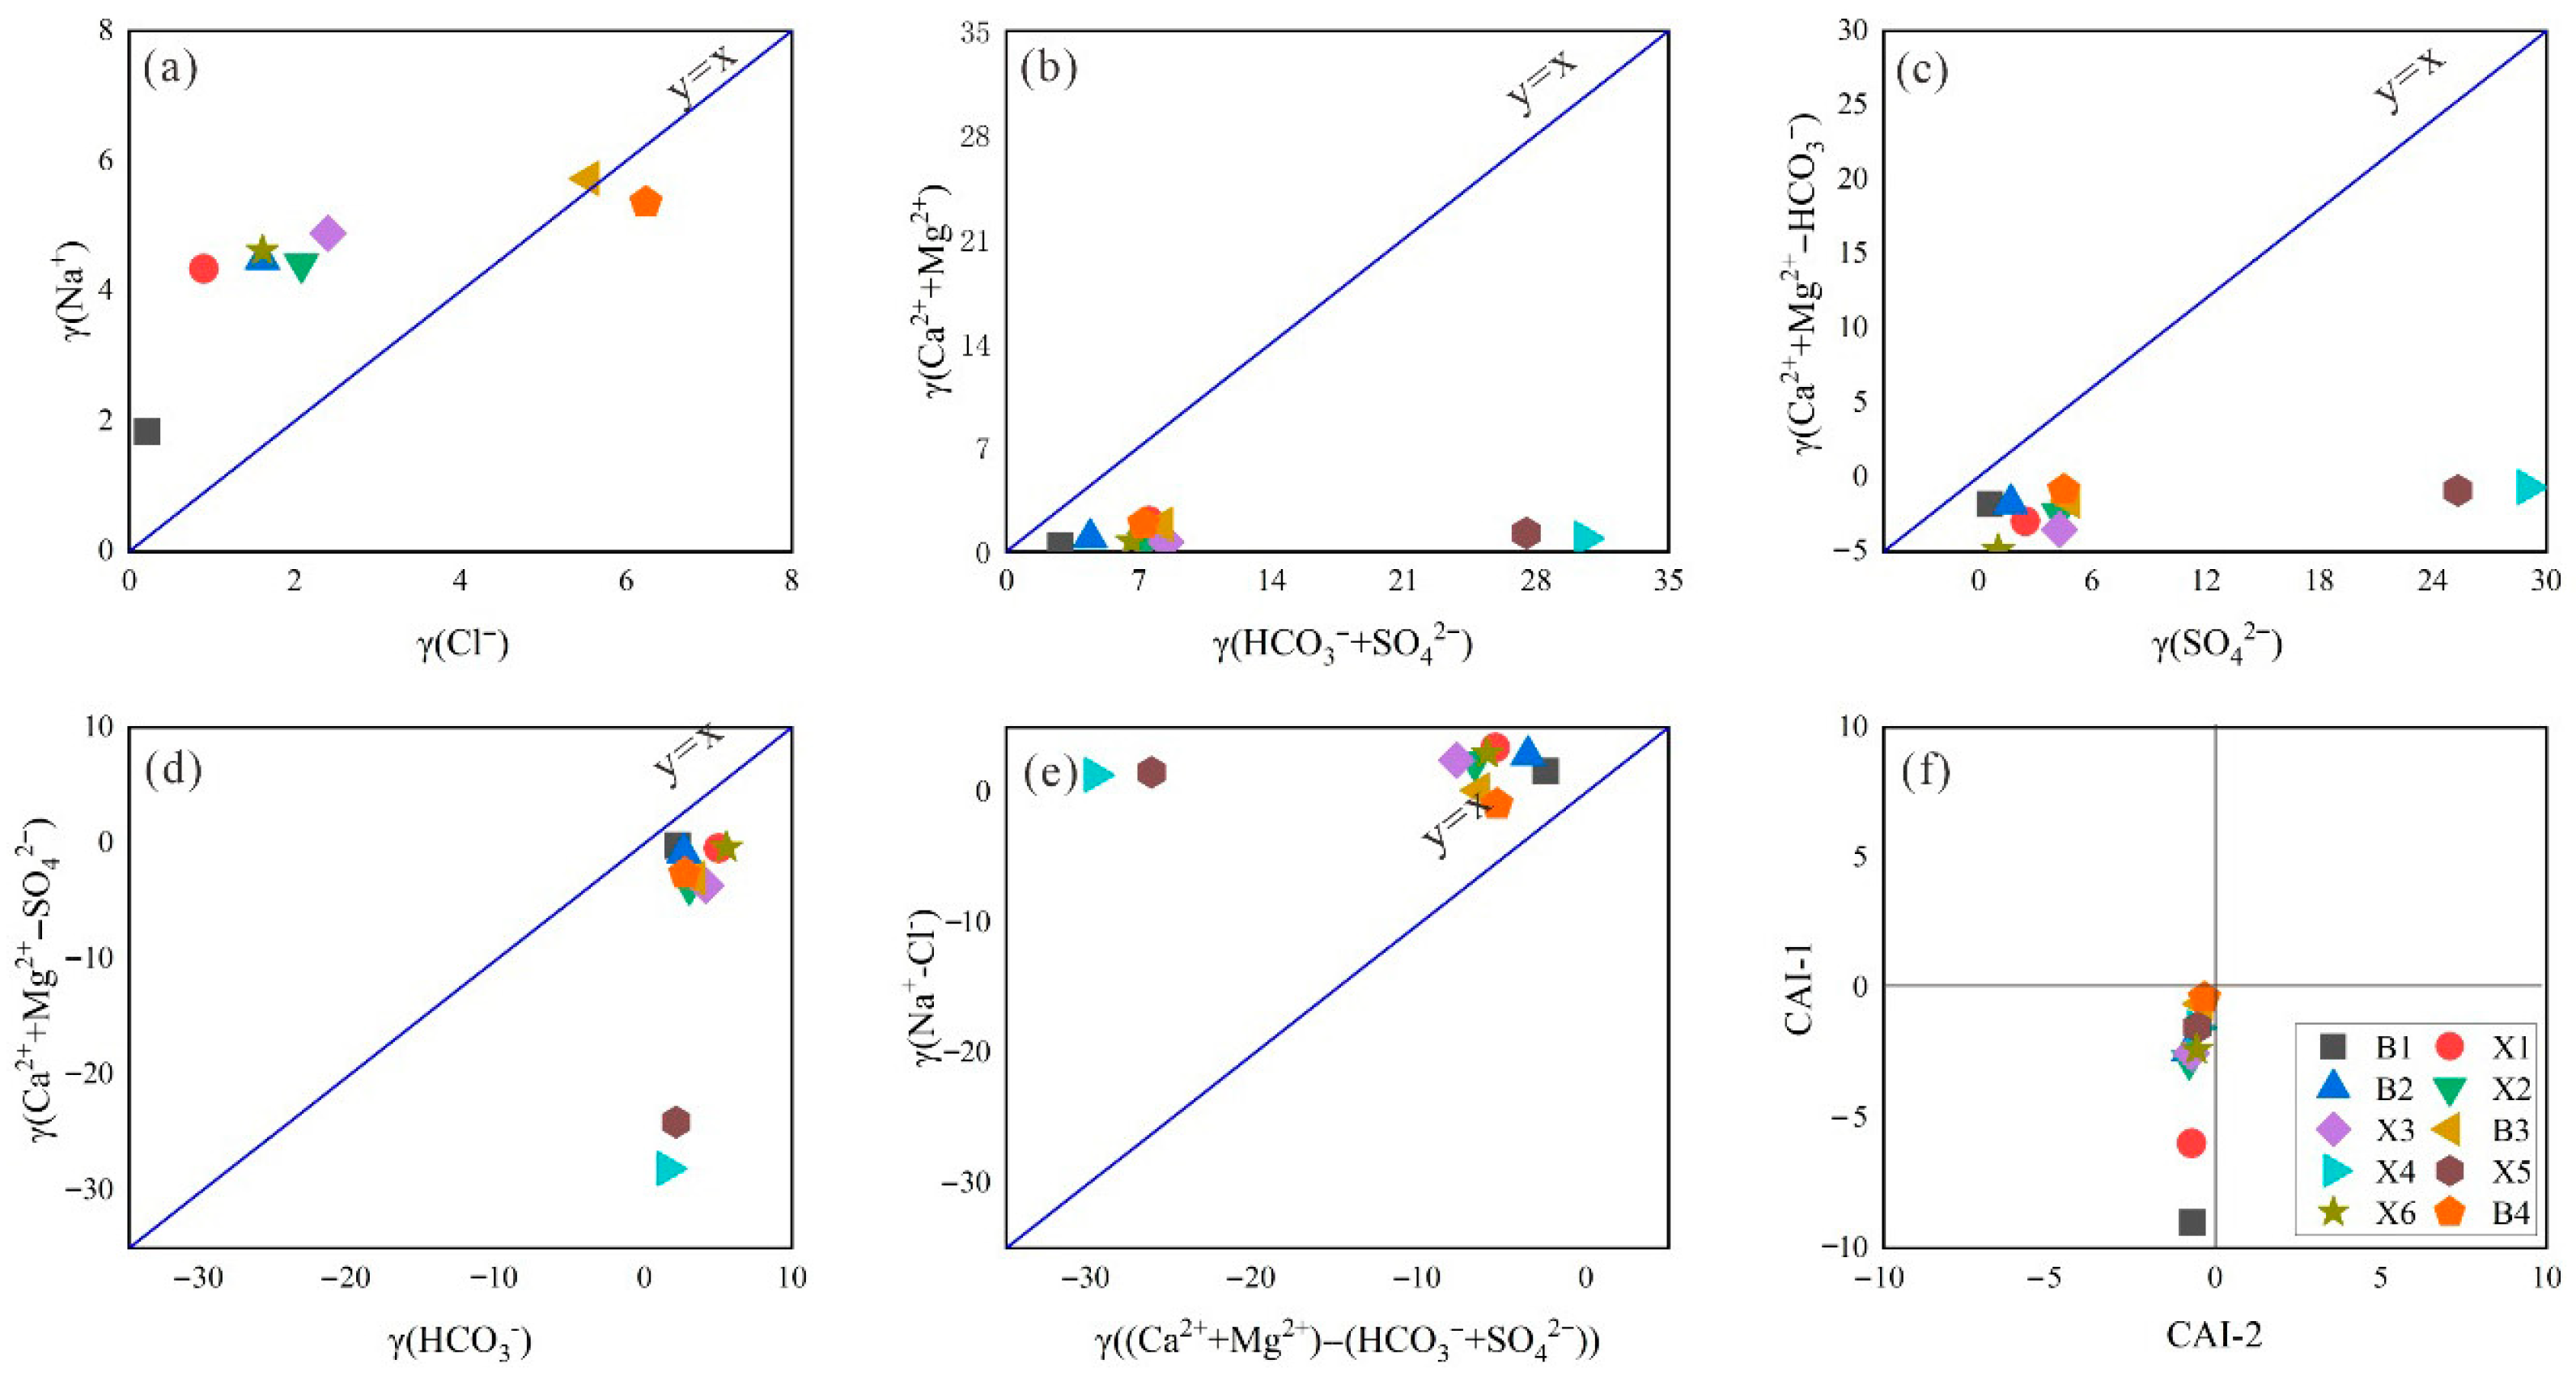
−). As can be seen from
Figure 6a, only B3 and B4 are located near y = x and may be affected by the dissolution of rock salt. However, as the study area is a karst stratum, it is considered that there is a positive cation exchange effect, which increases the Na
+ content and dissolves more Cl
− to balance it. To determine the main sources of Ca
2+ and Mg
2+, the ratios of γ(Ca
2+), γ(Mg
2+), γ(HCO
3−), and γ(SO
42−) were analyzed. Both (Ca
2++Mg
2+)/γ(HCO
3−+SO
42−) are less than 1, indicating the possibility of cation exchange (
Figure 6b). Due to the presence of gypsum plants at sampling sites X4 and X5, the content of SO
42− may be relatively high (
Figure 6b), while the remaining water samples are affected by the dissolution of carbonate rocks (
Figure 6c).
Cation exchange, also known as cation exchange adsorption, is a common phenomenon in geothermal water circulation. Minerals typically carry a negative charge and can adsorb cations from surrounding solutions. When local hot water flows through rock minerals, cations in geothermal water undergo cation exchange with cations on mineral surfaces, resulting in changes to the chemical composition of the geothermal water.
Figure 6e indicates that, except for X4 and X5, the other water samples may have cation exchange interactions. The Chlor Alkali Index (CAI) is used to characterize the direction of cation exchange. When both CAI-1 (Formula (9)) and CAI-2 (Formula (10)) are greater than 0, it indicates reverse cation exchange, and both CAI-1 and CAI-2 are less than 0. As can be seen from
Figure 6f, all water samples have undergone forward ion exchange.
In the formula, CAI-1 and CAI-2 represent the chloralkali index; each ion is an equivalent value for detecting ion content, meq/L.
3.4. The Genesis Mechanism of Geothermal Water Groups
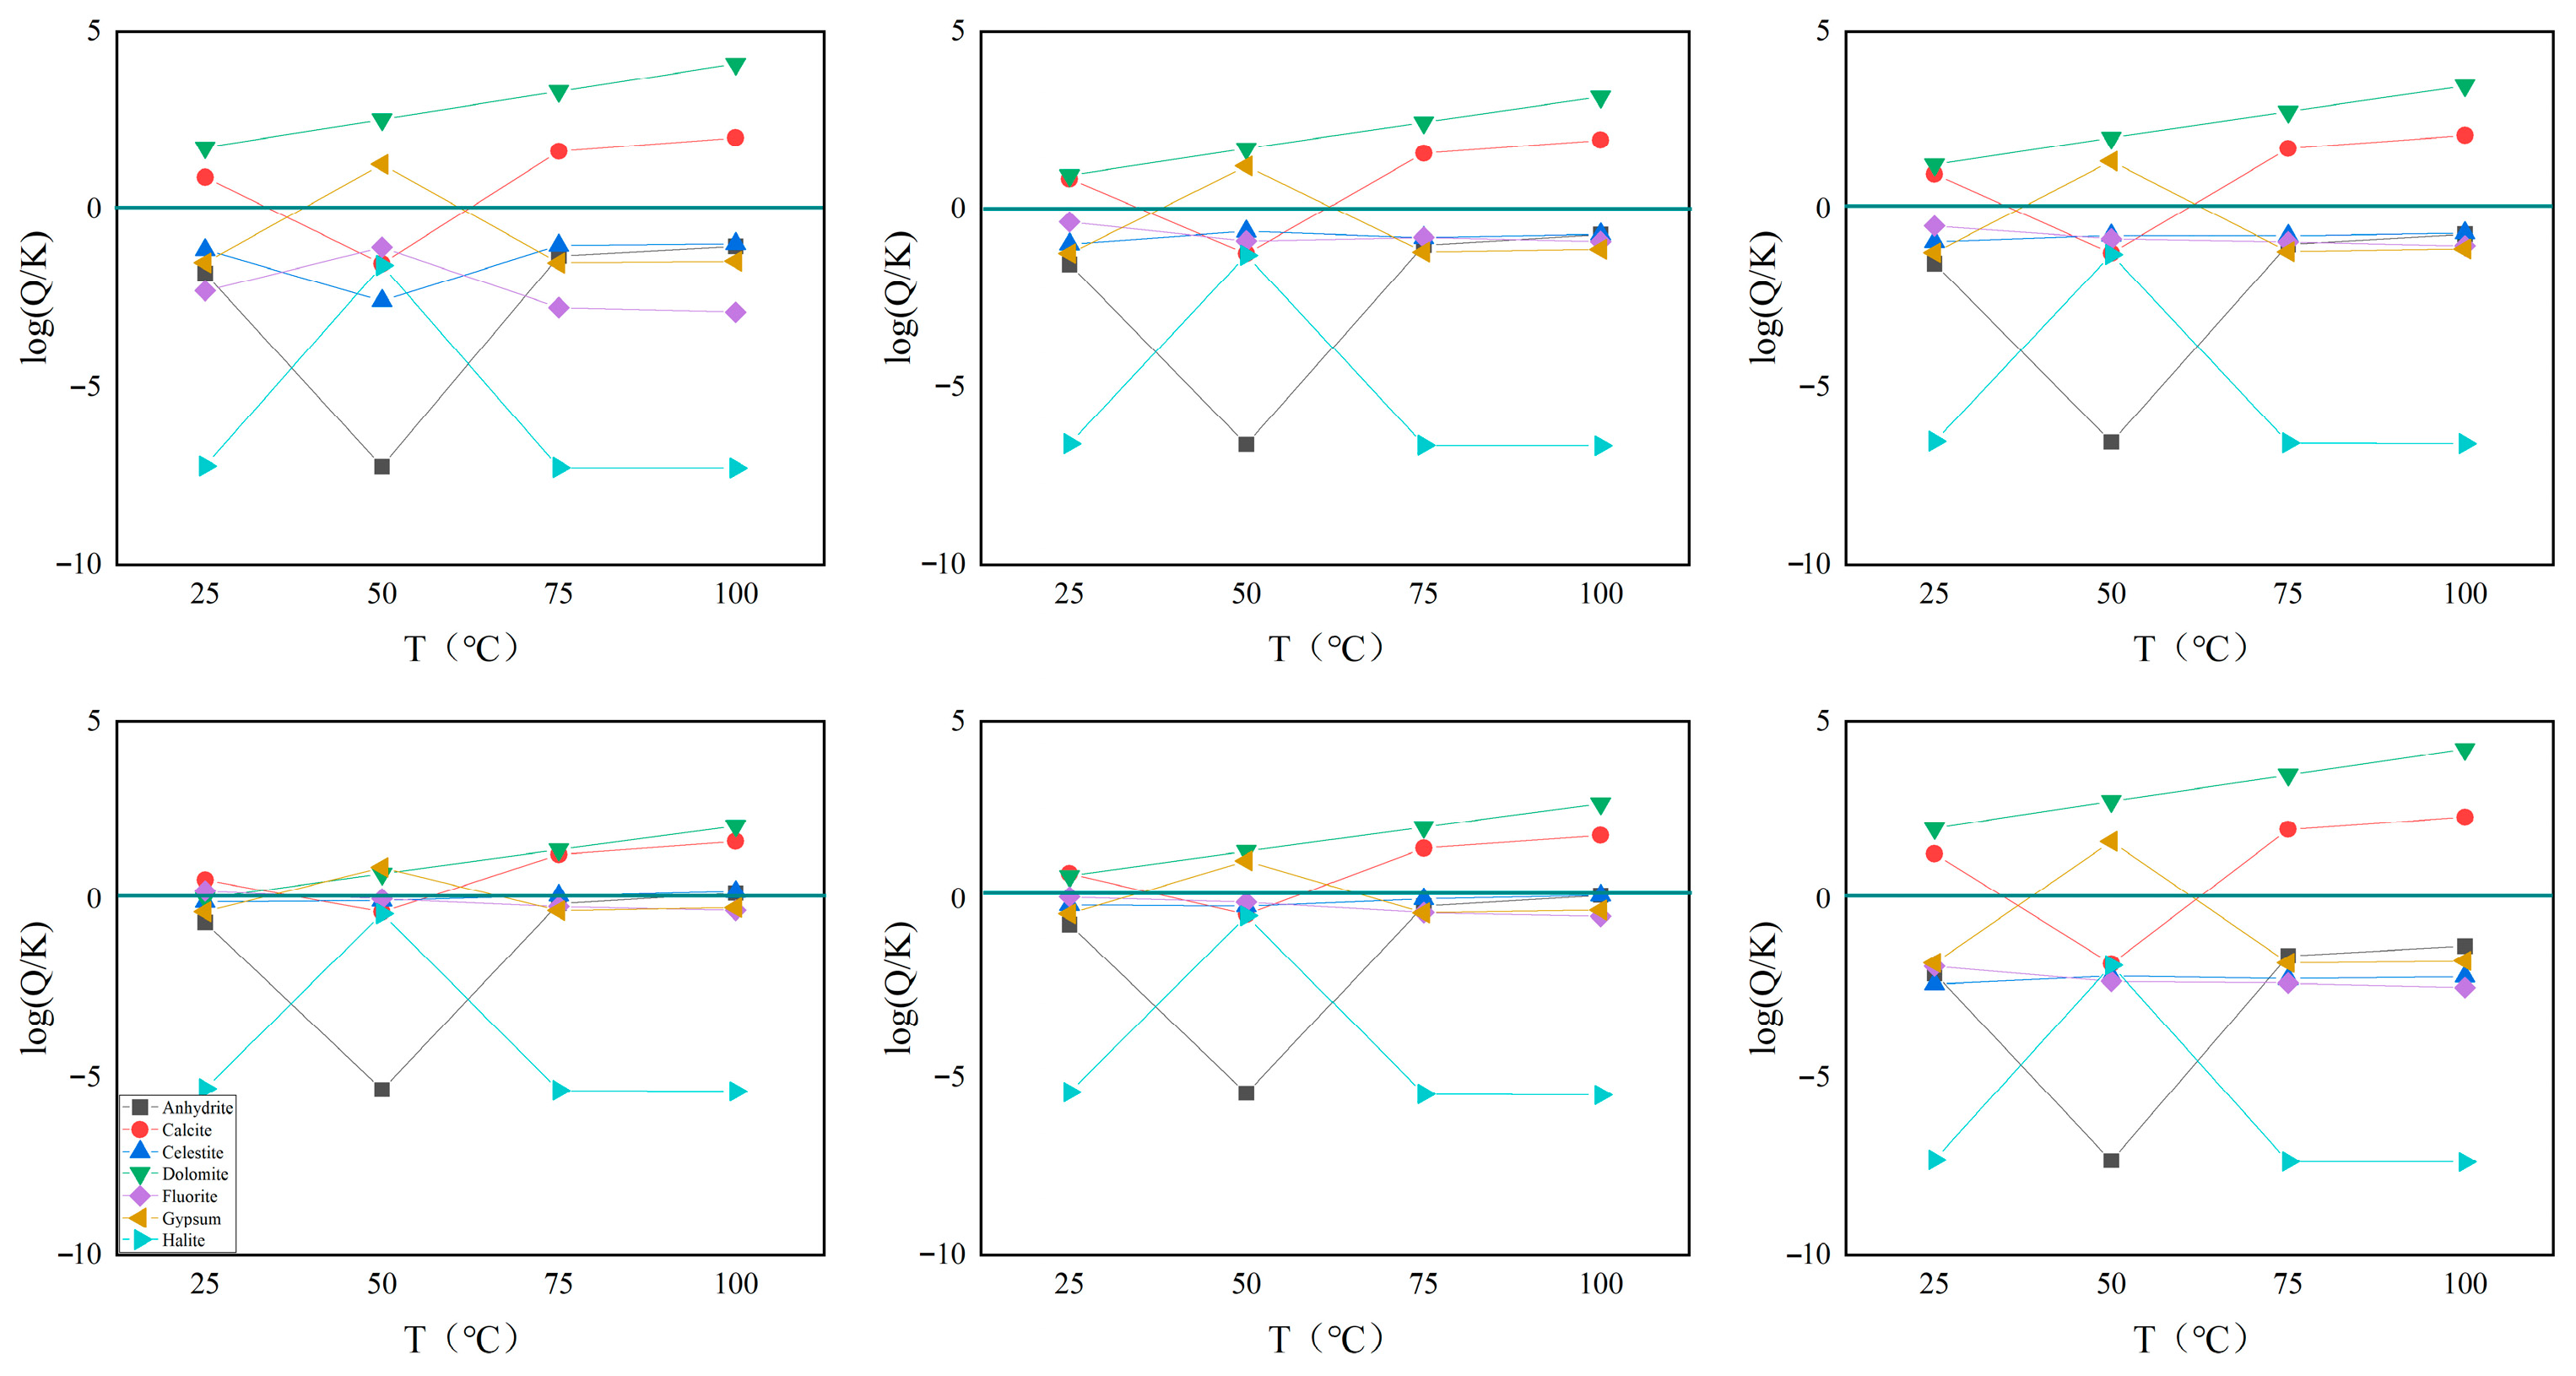
The saturation index of the main rock minerals indicates that carbonate rocks are basically supersaturated. It can be determined that the geothermal water in the study area is mainly affected by the dissolution of carbonate rock salts, reflecting the characteristic that the geothermal water in the study area is karst water (
Figure 7).
3.4.1. Thermal Storage Temperature
There is a functional relationship between the content of dissolved substances in geothermal fluids and the temperature of the heat storage. Therefore, it is required that the content variation of the selected geothermal temperature scale should be dominated only by the single factor of temperature and have sufficient abundance. At the thermal reservoir temperature, it undergoes sufficient reaction with the surrounding rocks to achieve water–rock equilibrium. During the fluid migration process, it hardly reacts with other compounds, and there is no mixing phenomenon, or the mixing result can be calculated [
28,
29].
- (1)
Na-K Temperature scale [
30,
31]
- (2)
K-Mg Temperature scale [
32]
- (3)
Na-K-Ca Temperature scale [
33]
In the formula,
Tg is the calculated temperature of the heat storage; Na, K, Ca, and Mg are the elemental contents, mg/L; and
β is the coefficient. When T > 100 °C,
β = 1/3; when T < 100 °C,
β = 4/3.
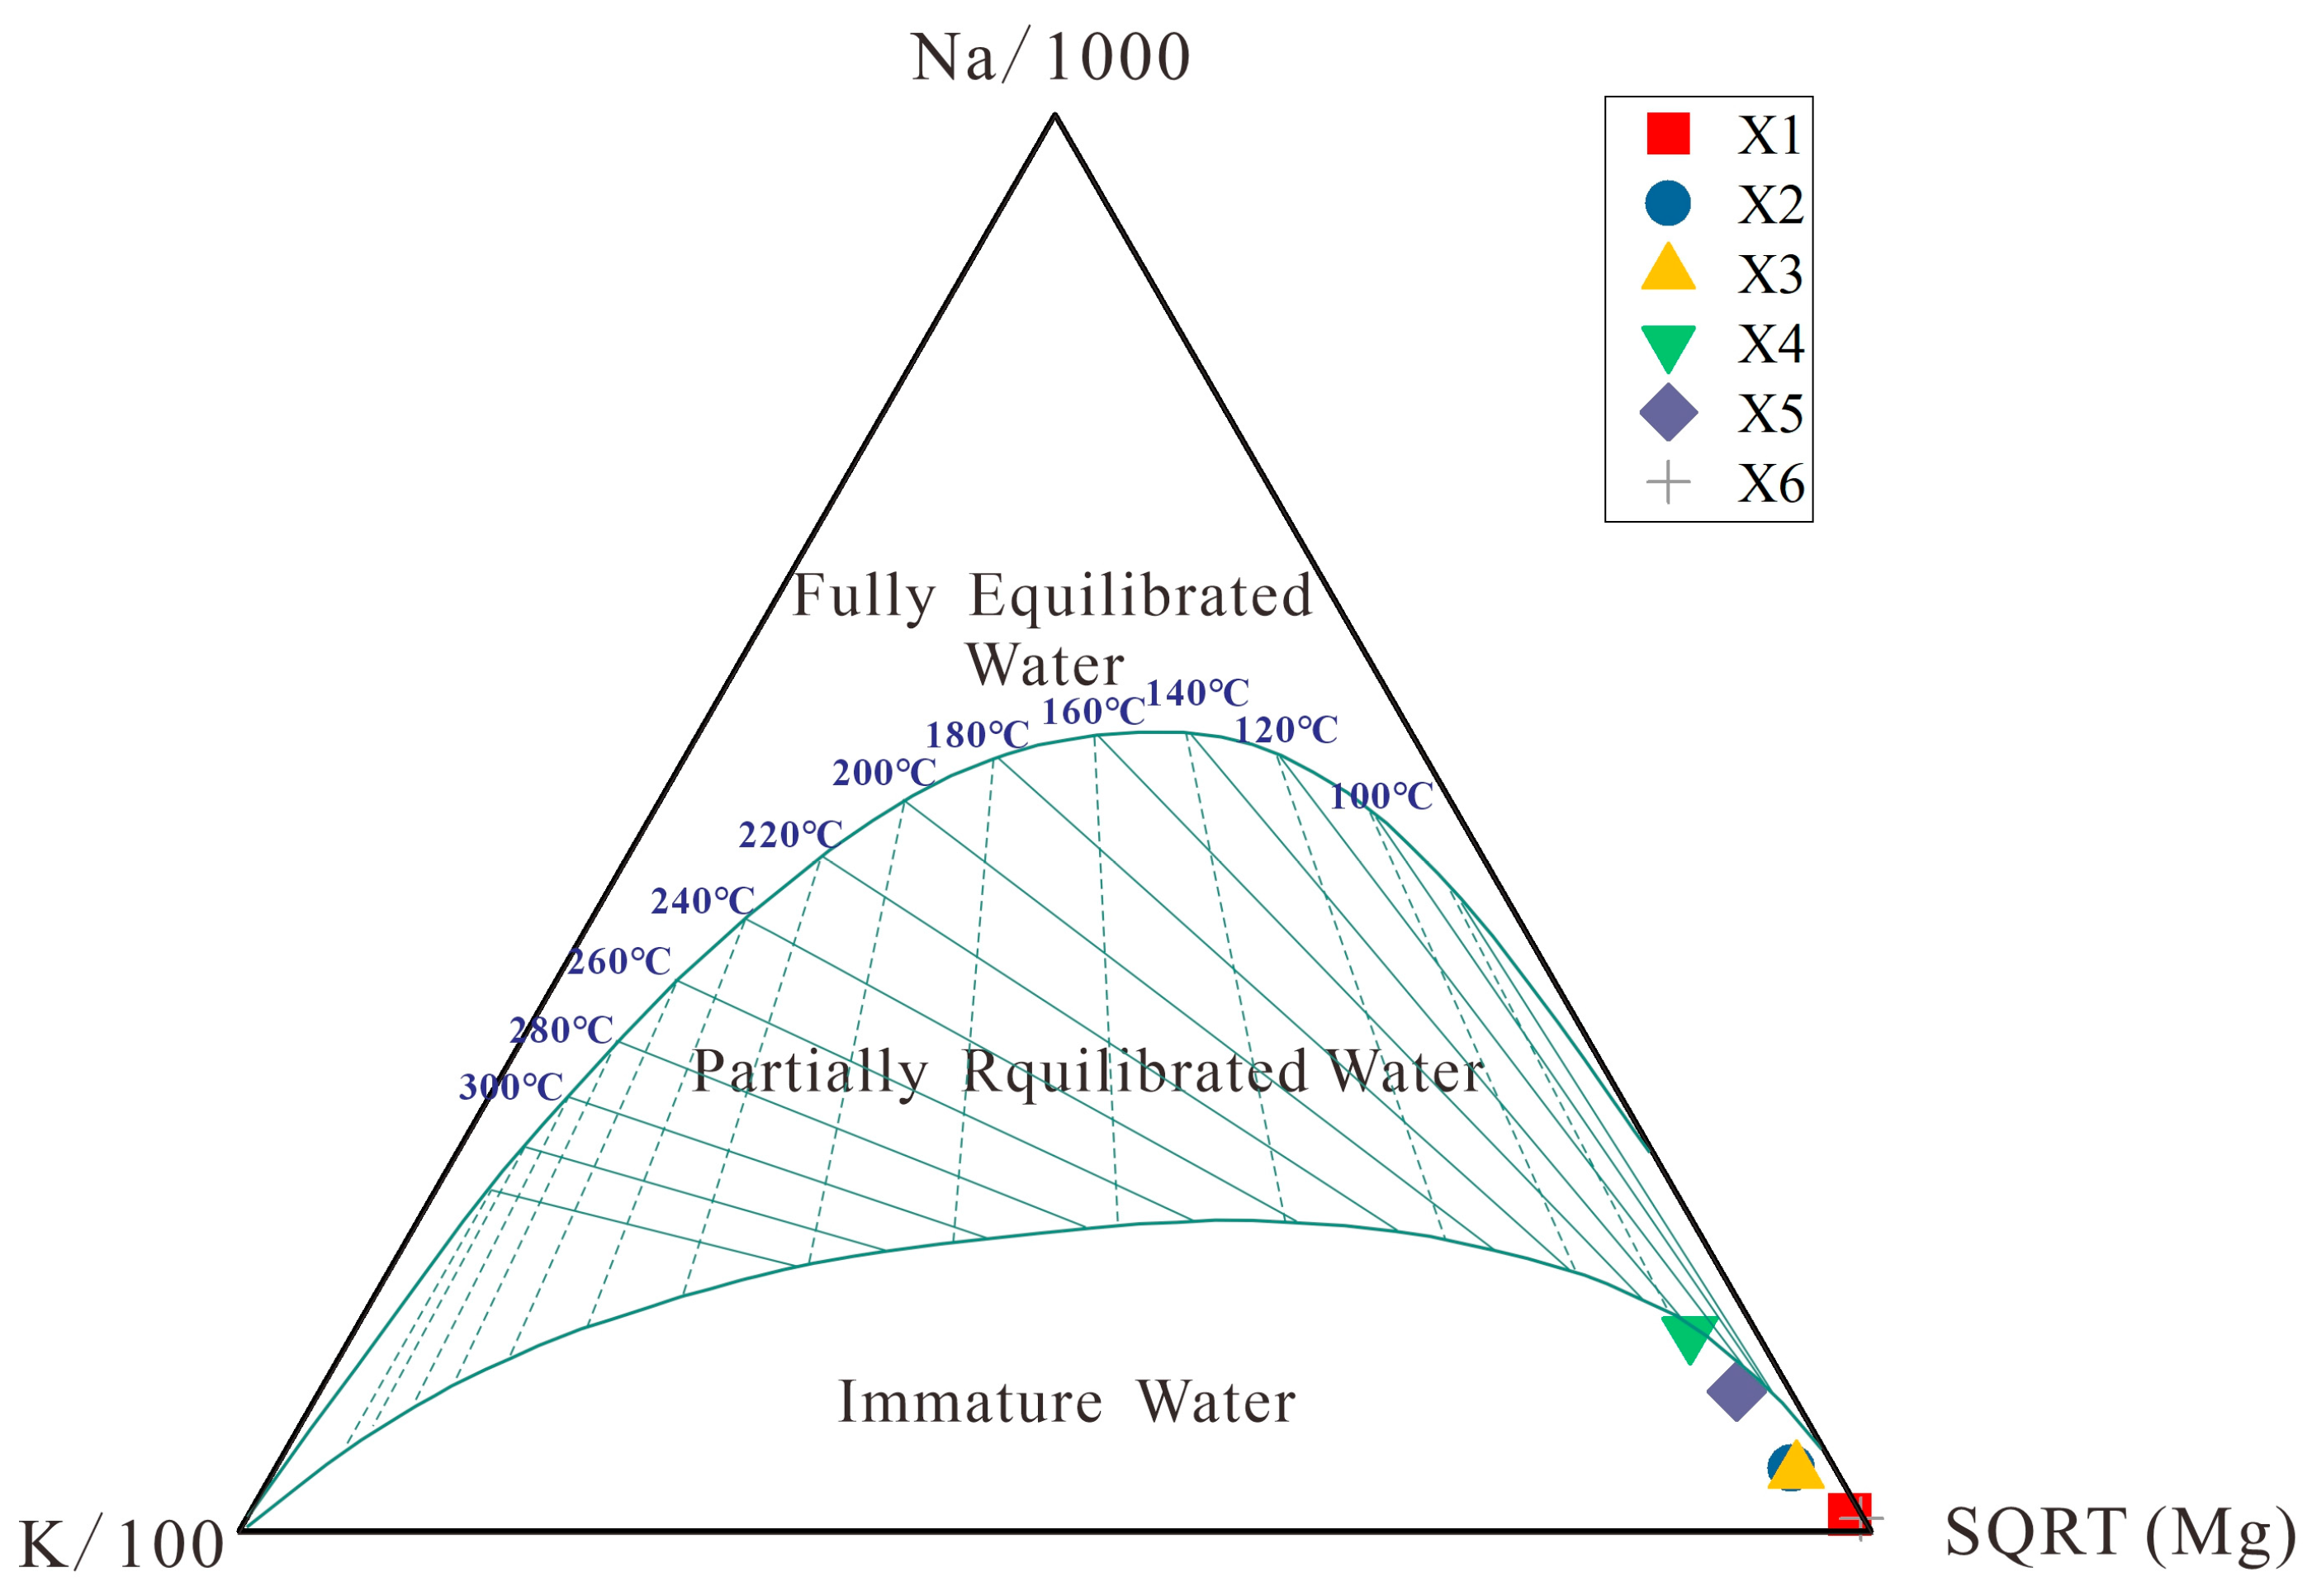
The Na-K-Mg triangular equilibrium diagram is an important method for judging the cation equilibrium state in geothermal water. Giggenbach (1988) classified the water–rock equilibrium state of geothermal water into fully balanced water, partially balanced water, and immature water [
33]. The cationic temperature scale method can be used when geothermal water is in a completely balanced or partially balanced state, but it is not applicable if the geothermal water is in an immature water state.
Figure 8 indicates that the geothermal water groups in the middle reaches of the Wen River are all immature water. Therefore, it is not accurate to estimate the heat storage temperature using the cation temperature scale method in this study area (
Table 3).
The SiO2 geothermal temperature scale is derived from the thermal reservoir temperature estimation model established by the dissolution–precipitation equilibrium of silicon-containing minerals in the water–rock system. The SiO2 mineral has stable chemical properties and is widely present in strata. The SiO2 dissolved in water is not prone to chemical reactions. Its solubility increases with the rise in temperature, and the mineral precipitates very slowly when the temperature drops. When estimating the temperature of immature hydrothermal reservoirs, the SiO2 geothermal temperature scale is more accurate than the cationic geothermal temperature scale. The common methods are as follows.
- (1)
Quartz temperature scale (no steam loss) [
31,
34]
- (2)
α-Quartz stone temperature scale [
31,
34]
- (3)
Chalcedony temperature scale [
31,
34]
In the formula, Tg is the heat storage temperature, in °C; SiO2 refers to the SiO2 content, in mg/L.
Formulas (14) to (16) calculate that the maximum temperature of the thermal reservoir is X4 and the minimum is X1. Since the temperature calculated from the α-quartzite and chalcedony scales is lower than the measured temperature on site, they are discarded, and the quartz scale is used to calculate the heat storage temperature. The calculation of the quartz temperature scale (without steam loss) shows that the highest temperature of X4 is 101.5 °C, and the lowest temperature of X1 is 53.5 °C (
Table 4).
3.4.2. The Situation of Cold Water Mixing in
The silicon–enthalpy equation method is an idealized approach that does not take into account the energy loss caused by heat exchange between geothermal water and the surrounding rock when it rises. The mixing ratio was obtained by means of the relationship between the SiO
2 content and enthalpy [
35]. To estimate the mixing ratio of cold water and geothermal water in the eastern Shandong area, the silicon–enthalpy equation method was used for calculation (Formulas (17) and (18)).
In the formula, S
c represents the enthalpy value of near-surface cold water, ×4.1868 J/g, taken as 15 °C [
29]; S
h is the initial enthalpy of deep geothermal water (
Table 5), ×4.1868 J/g; and S
s is the enthalpy value of hot spring geothermal water (using the heat reservoir temperature calculated in the previous text), ×4.1868 J/g; a is the proportion of cold water mixed in based on the enthalpy value. SiO
2c represents the SiO
2 content in surface cold water, mg/L, with 18 mg/L taken [
29]; SiO
2h represents the SiO
2 content in deep geothermal water (
Table 5), mg/L; and SiO
2s represents the content of SiO
2 in hot spring geothermal water, in mg/L. b is the proportion of cold water mixed in based on the content of SiO
2.
Based on the SiO
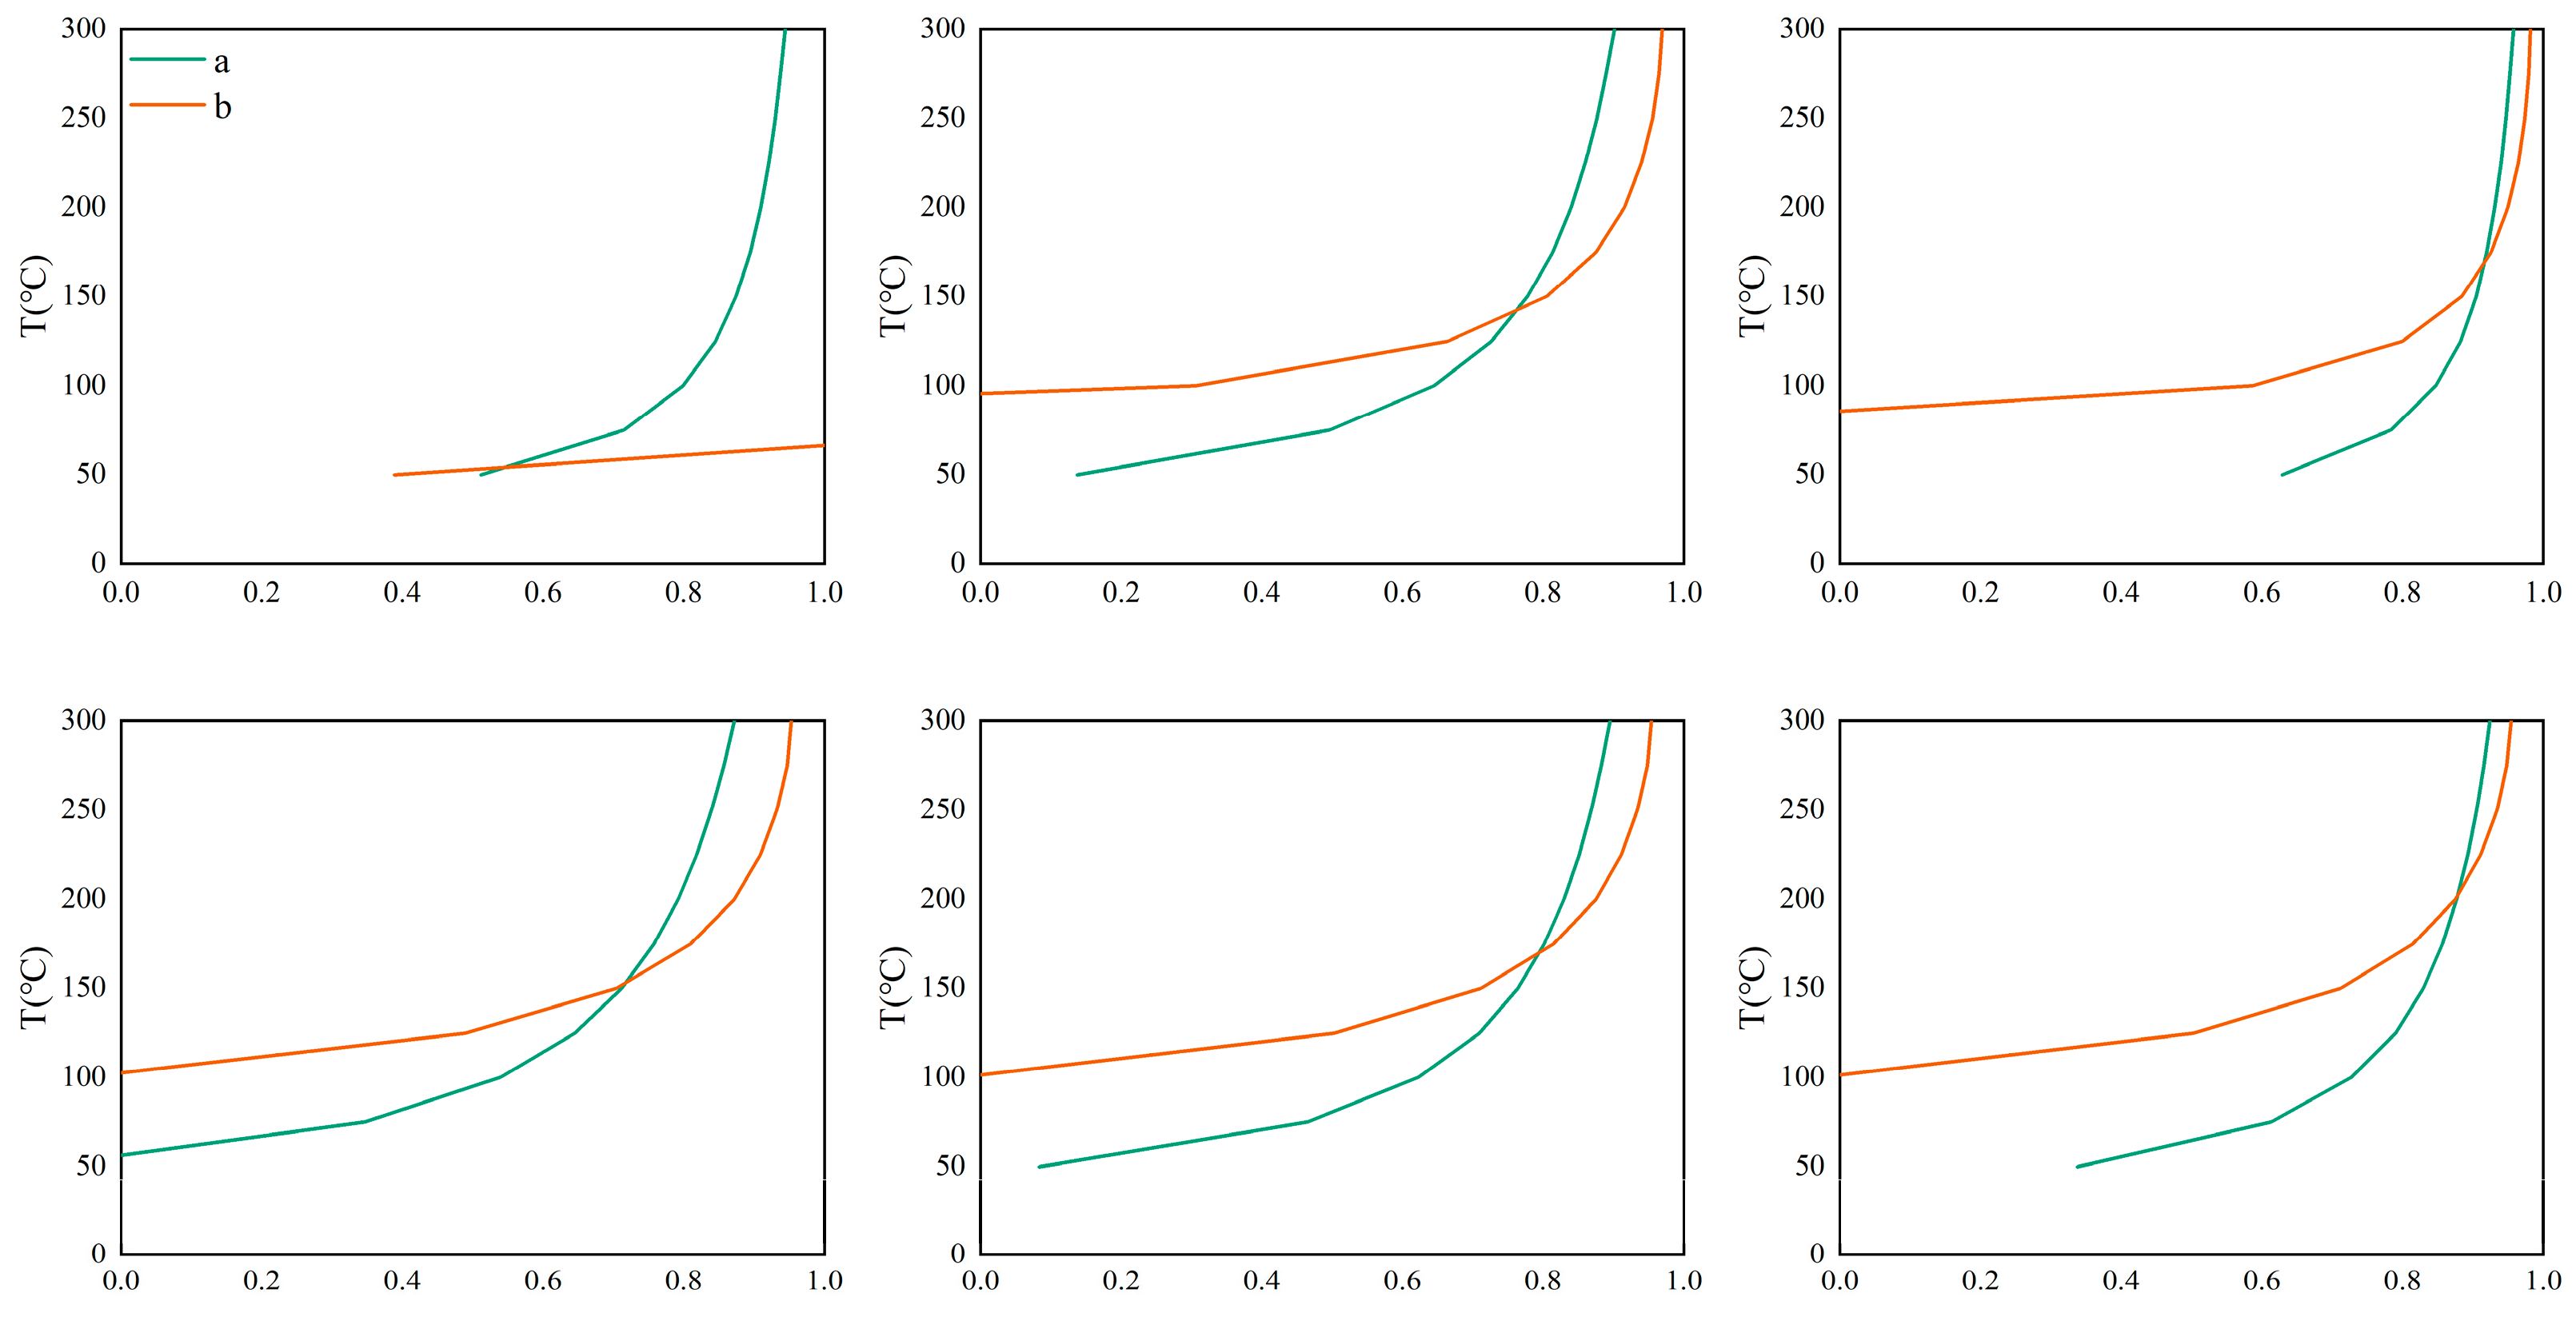
2 content, enthalpy value, and temperature, the cold water mixing ratio curves of a and b were plotted. The vertical coordinate of the intersection point of a and b represents the cold water mixing ratio, and the vertical coordinate represents the initial temperature of the deep geothermal water (
Figure 9). The silicon–enthalpy equation method indicates that the proportion of cold water mixed with geothermal water in the Dawen River Basin is over 50% (
Figure 9). The proportion of shallow cold water mixed in is relatively large, and attention should be paid to its rational development and utilization.
3.4.3. The Geothermal Area of Daidao Nunnery on Tai Mount
The Taishan Daidao’an geothermal field (1.5 km
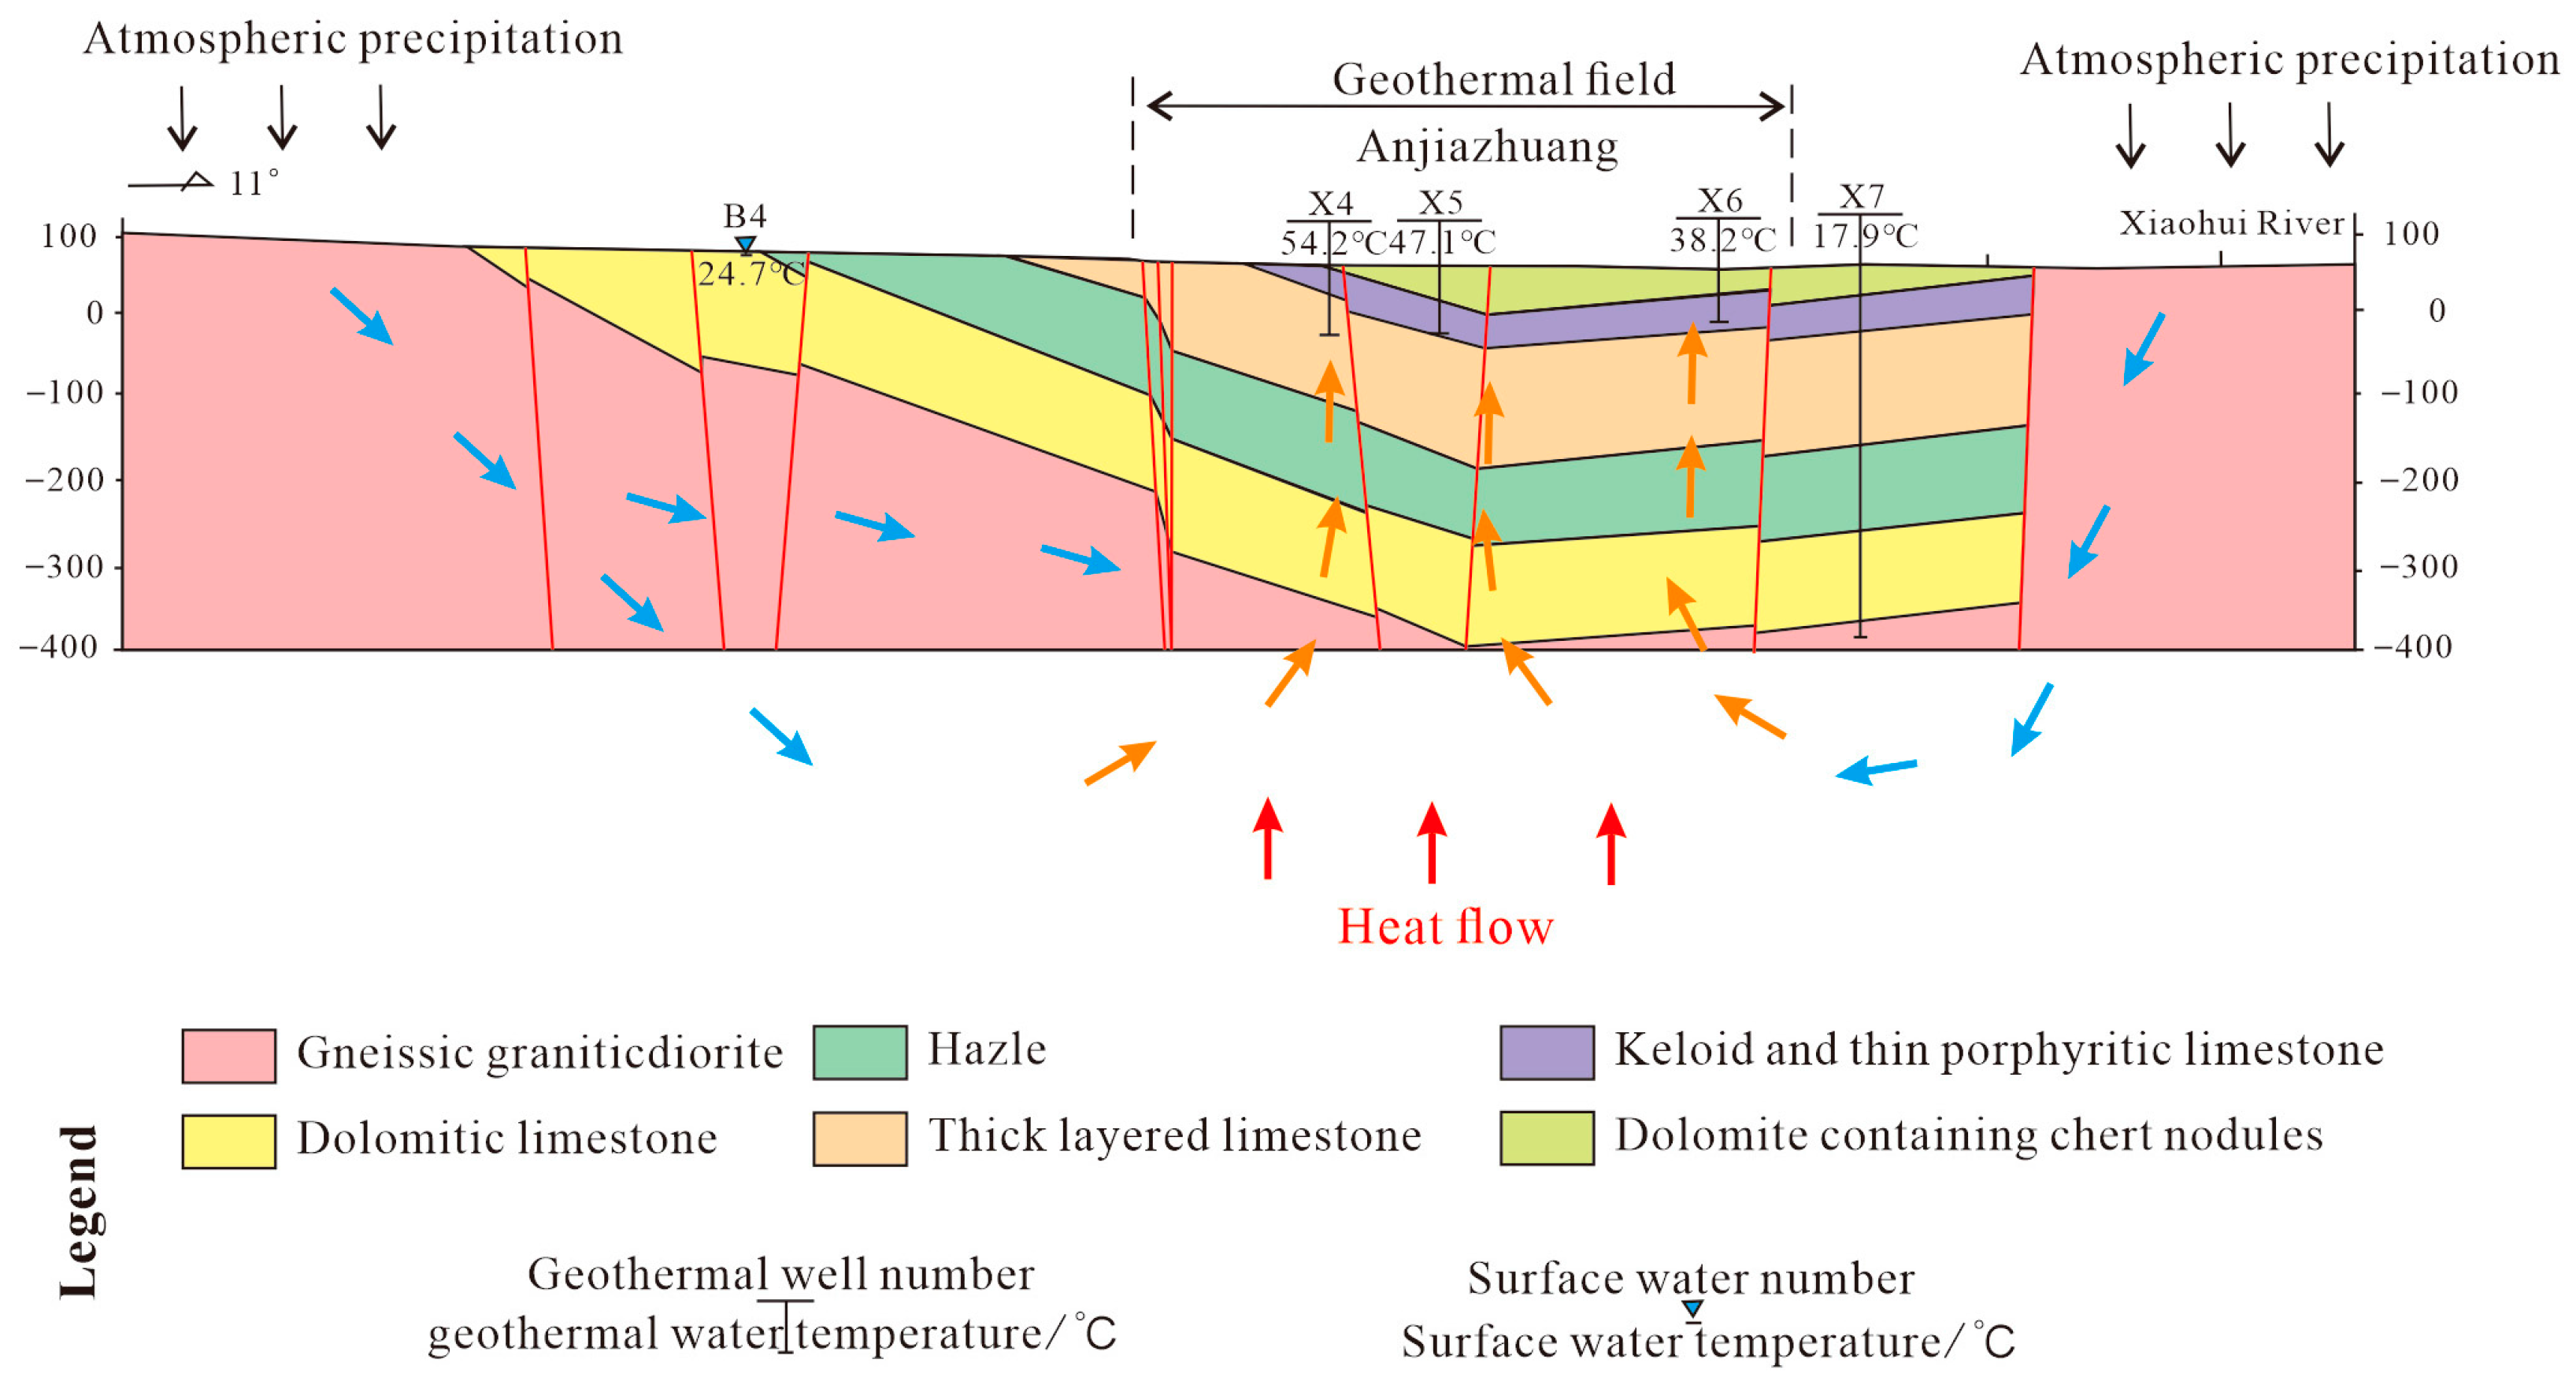
2) represents a deep-circulation convective system developing as a strip-shaped thermal reservoir within warm water resources. Located at the structural junction between the Tailai Depression and Taishan Uplift, this system is tectonically controlled by the intersection of two major fault systems: the NEE-striking Taishan Fault and NNW-trending Daidaoan Fault. The geological framework consists of Yanshanian igneous rocks formed through intense faulting and magmatic activity, underlain by Cambrian limestone hydrothermal reservoirs. These reservoirs exhibit a north-to-south roof depth variation from 200 to 800 m, characterized by complex structural conditions, poor hydrodynamic properties, and increasing ground temperatures with depth. The system’s thermal dynamics are governed by fault-induced fracture zones serving as groundwater migration pathways, deep-cutting fractures connecting to heat sources, and thick shale overburden providing effective thermal insulation. Groundwater undergoes deep convective circulation, acquiring heat before accumulating in shallow karst fissures, ultimately forming the geothermal resource at the fault intersection (
Figure 10).
3.4.4. The Qiaogou Geothermal Area of Culai Town
The Qiaogou geothermal field in Culai Town (0.30 km
2) is situated at the structural boundary between the Tailai Depression and Xinfushan Uplift, forming a banded thermal reservoir along tectonic fractures. The system develops over Neoarchean granodiorite basement that underwent intense folding, forming the Culai Mountain Complex Anticline of Mount Tai (
Figure 10). The tectonic conditions are complex. The geothermal area is located in the southeast of the intersection of the Culai Mountain Fault and the Panghe Fault. The water temperature is relatively high, and the water volume is large, belonging to warm water or warm water (
Figure 10).
3.4.5. The Anjiazhuang Geothermal Area in Feicheng
The study area is situated at the structural junction between the Wenkou Depression and Bushan Uplift, covering approximately 18.23 km
2. The region exhibits well-developed fault systems, among which the NNE-trending tectonic system serves as the primary thermal-controlling structure for the Anjiazhuang geothermal field (
Figure 10). The thermal reservoir comprises Cambrian strata dominated by dolomite, dolomitic limestone, and marl limestone, exhibiting both banded and layered distributions. Reservoir temperatures demonstrate significant spatial variation, with the highest values occurring proximal to thermal-conductive fractures. Sand shale has good waterproofing performance, low thermal conductivity, and large thickness. When it covers the thermal reservoir, it forms a cover layer with good thermal insulation performance.
4. Conclusions
There is a dual mechanism for groundwater recharge: rapid infiltration of the preferred flow in the fissure medium and slow seepage due to evaporation loss through the gas containment zone. The types of hydrochemistry can be classified into five categories, but there is not much difference within the same geothermal area. The types of water chemistry can be classified into five categories, but within the same geothermal area, the differences in water chemistry types are not significant. Hydrogeochemical ion traceability indicates that the SI of carbonate rocks is greater than 0 and they are in a saturated state. There is forward cation exchange in the study area. Due to the presence of a gypsum plant, the sulfate ion content in some samples is high.
This study reveals a thermal reservoir temperature range of 53.54–101.5 °C, with significant mixing of shallow cold water indicated by recharge elevations between 2865.76 and 4126.69 m. Comparative analysis shows that the Anjiazhuang and Qiaogou geothermal fields exhibit higher reservoir temperatures than the Daidaoan area. Within the Wen River mid-reach study area, extensive thermal water discharges occur along fault fracture zones. These manifestations result from complex structural features formed by multiple secondary faults in the karst terrain. The fault systems serve dual functions: as conduits for geothermal fluid migration, and as pathways for deep heat transfer.
Other reasons, such as the residual heat of magmatic activity, can be ignored due to the earlier ejection period or less distribution. In addition, the possibility of radioactive elements existing in the rock mass is relatively small, and decay energy is not considered either. Notably, the estimated reservoir temperatures at monitoring sites X1 (Daidaoan) and X6 (Anjiazhuang) were relatively low. Sustainable development strategies should be implemented for these resources to prevent overexploitation and ensure long-term utilization.
