Article

Construction-Induced Waterlogging Simulation in Pinglu Canal Using a Coupled SWMM-HEC-RAS Model: Implications for Inland Waterway Engineering

1
College of Geomatics and Geoinformation, Guilin University of Technology, Guilin 541004, China
2
Ecological Spatiotemporal Big Data Perception Service Laboratory, Guilin 541004, China
3
Guangxi Key Laboratory of Spatial Information and Geomatics, Guilin University of Technology, Guilin 541004, China
*
Author to whom correspondence should be addressed.
Water 2025, 17(16), 2415; https://doi.org/10.3390/w17162415
Submission received: 4 July 2025 / Revised: 6 August 2025 / Accepted: 13 August 2025 / Published: 15 August 2025
(This article belongs to the Topic Hydraulic Engineering and Modelling)

Abstract

Focusing on the Lingshan section of Guangxi’s Pinglu Canal, this study addresses frequent waterlogging during construction under subtropical monsoon rainfall. Human disturbances alter hydrological processes, causing project delays and economic losses. We developed a coupled Storm Water Management Model (SWMM 1D hydrological) and Hydrologic Engineering Center—River Analysis System 2D (HEC-RAS 2D hydrodynamic) model. High-resolution Unmanned Aerial Vehicle—Light Detection and Ranging (UAV-LiDAR) Digital Elevation Model (DEM) delineated sub-catchments, while the Green-Ampt model quantified soil conductivity decay. Synchronized runoff data drove high-resolution HEC-RAS 2D simulations of waterlogging evolution under design storms (1–100-year return periods) and a real event (10 May 2025). Key results: Water depth exhibits nonlinear growth with return period—slow at low intensities but accelerating beyond 50-year events, particularly at temporary road junctions where embankments impede flow. Additionally, intensive intermittent rainfall causes significant ponding at excavation pit-road intersections, and optimized drainage drastically shortens recession time. The study reveals a “rapid runoff generation–restricted convergence–prolonged ponding” mechanism under construction disturbance, validates the model’s capability for complex scenarios, and provides critical data for real-time waterlogging risk prediction and drainage optimization during the canal’s construction.

1. Introduction

The Guangxi Pinglu Canal, as the first strategic canal project linking inland rivers to the sea since the founding of the People’s Republic of China, serves as a critical backbone of the New Western Land-Sea Corridor. Stretching 134.2 km from the Xijin Reservoir area in Hengzhou, Nanning, to the Beibu Gulf via Lingshan County, Qinzhou, it will enable navigation for 5000-ton vessels upon completion [1]. Its construction marks a milestone in reshaping water resource allocation and shipping patterns in South China, with significant strategic implications for national waterway networks and regional economic development. However, located in a rainfall-prone region of Guangxi, the construction phase (2023–2026) spans multiple rainy seasons. During channel excavation, cofferdam installation, and frequent flow diversion operations, waterlogging in construction channels—triggered by heavy rainfall under extreme weather or frequent rainstorms—has caused severe consequences, including earthwork suspension, equipment damage, and project delays. Waterlogging has become a critical bottleneck: data from the 2023 rainy season reveal nearly 60 days of delays in the Lingshan section alone due to machinery idling and soil softening. This context underscores the urgent practical and engineering significance of in-depth research on construction-phase waterlogging in large-scale hydraulic projects.
Numerous studies have addressed waterlogging simulations at river and watershed scales: Zhang, Qiao et al. [2] applied the SWMM model to analyze regional flooding amid urban expansion; Dasallas, An, et al. [3] developed an integrated multi-scale rainfall-runoff and flood inundation model for extreme rainfall events in the Marikina-Pasig Basin, Philippines; Rajib, Golden et al. [4] pioneered a large-scale watershed model incorporating surface depression storage, addressing the neglect of micro-topography in traditional models; Cheng, Ma et al. [5] validated the HEC-HMS model’s efficacy for rainfall-runoff simulation in hilly small watersheds; Lv, Kong et al. [6] enhanced simulation accuracy for complex channels in the Yongding River using a 1D hydrodynamic model based on Saint-Venant equations, supporting ecological water replenishment strategies. However, these studies primarily focus on natural channels or urban scenarios, lacking targeted modeling for dynamic boundary conditions during construction. Key site-specific factors remain unaddressed: e.g., transient terrain from channel excavation alters flow diffusion paths, earthwork stockpiles create localized flow barriers, and surface soil compaction reduces infiltration rates.
For the Pinglu Canal studied here, construction activities—including dynamic excavation, earthwork stockpiling, and temporary drainage layouts—significantly alter regional hydrological conditions. Although literature on waterlogging simulation during large-scale construction remains scarce, hydrological and hydrodynamic models remain core tools for analyzing such scenarios. Hydrological-hydrodynamic modeling for predicting regional waterlogging distribution is still a conventional and effective measure for stormwater monitoring and management in urban, riverine, and watershed contexts. Common traditional hydrological models include: SWMM [7], SWAT [8,9], TOPMODEL [10,11,12], and the Xinanjiang Model [13,14,15]. These enable rapid simulation via simplified physical processes, suitable for large basins or data-scarce settings. These models vary in their adaptability to construction-phase hydrological simulations. SWAT, designed for long-term hydrological processes in large basins, struggles to capture short-term storm runoff dynamics critical to construction-site waterlogging. TOPMODEL, which relies on topographic indices to simulate runoff generation, is less effective in disturbed terrains where construction activities have drastically altered microtopography. The Xinanjiang Model, while widely used in humid regions, overlooks the impact of artificial drainage systems. In contrast, SWMM’s ability to simulate spatiotemporal heterogeneity of surface runoff under anthropogenic disturbances. Hydrodynamic models include HRC-RAS 1D/2D [16,17,18], MIKE 11/21/3D [19,20,21], and LISFLOOD-FP [22,23], which simulate flow details via fluid mechanics equations. However, studies show hydrological models effectively simulate runoff but fail to capture dynamic inundation features, while hydrodynamic models excel in channel/floodplain routing but neglect key hydrologic processes like rainfall-runoff generation. Thus, coupling these models has become vital for flood and waterlogging simulation. Recent research focuses on 1D-2D coupling with proven success: Zhou and Liu [24] coupled BTOP (distributed hydrological) and RRI (hydrodynamic) models, using BTOP’s upstream flow to drive RRI for efficient large-scale inundation modeling; Chen, Wu et al. [25] integrated DRIVE (watershed) and SWMM (urban) with dual inundation algorithms (river overflow + urban waterlogging), validated via typhoon events in Haikou, China; Cheng, Yang et al. [26] improved SWMM-TELEMAC-2D coupling, where SWMM simulates pipe flow/overflow, feeding TELEMAC-2D for high-precision urban flood risk analysis in Beijing’s Tongzhou District; Anand, Gosain et al. [27] linked SWAT (hydrologic) and iRIC (hydrodynamic) to assess flood risks under current, levee-free, and future encroachment scenarios in the Yamuna Basin.
While hydrological-hydrodynamic models are well-established for watershed flood control and urban waterlogging, their application to stormwater management in large hydraulic construction projects remains exploratory. Construction environments like the Pinglu Canal exhibit distinct complexities: transient channel morphology from dynamic excavation, intense disturbances to surface hydrology from frequent construction activities, and intricate interactions between temporary drainage systems and natural runoff collectively form a research gap inadequately addressed by conventional models. Current literature lacks mechanistic insights into construction-phase waterlogging responses, hindering accurate risk prediction at critical project nodes during storms. This not only threatens construction safety and schedules but may also trigger cascading economic losses. Against this backdrop, after comparing the advantages and disadvantages of the current mainstream hydrological and hydrodynamic models, as well as their compatibility with the scenario of this study (Table 1), we have decided to adopt the one-dimensional hydrological model Storm Water Management Model (SWMM) and the two-dimensional hydrodynamic model Hydrologic Engineering Center—River Analysis System 2D (HEC-RAS 2D). To construct a coupled model suitable for complex construction boundaries, this study addresses on-site challenges by developing a coupled 1D hydrological (SWMM) and 2D hydrodynamic (HEC-RAS 2D) model tailored to complex construction boundaries, using the Lingshan section as an empirical case. We systematically introduce integrated hydrological-hydrodynamic modeling to large-scale hydraulic construction scenarios, aiming to:
(1)
Reveal spatiotemporal evolution mechanisms of channel waterlogging under combined dynamic topography and anthropogenic interventions;
(2)
Enable dynamic optimization of drainage infrastructure deployment;
(3)
Provide actionable insights for ensuring timely canal commissioning and enhancing water safety management in comparable projects.

2. Materials and Methods

2.1. Study Area

Lingshan County, Qinzhou City, Guangxi Zhuang Autonomous Region, features a typical subtropical monsoon climate with an annual rainfall of 1800 mm. Precipitation concentrates from April to September (>75% of yearly total). In this paper, we select the Lingshan section of the Pinglu Canal as the experimental research area. This section of the river is about 8 km long and is a key construction segment in the mid-reach of the canal (Figure 1). The channel trends northwest–southeast, connecting the temporary diversion channel in Luwu Town at its upstream end to the Jiuzhou River downstream, within geographic coordinates 108°52′15″ E–108°56′30″ E and 22°18′00″ N–22°21′45″ N. The study area encompasses the main construction corridor and a 2-km buffer zone on both banks, totaling approximately 20 km2. The topographic features surrounding the river channel have undergone drastic dynamic alterations due to construction activities. Based on the relevant data provided by the engineering team and the findings of our field investigations, the specific manifestations are as follows: Channel excavation depths of 5–11 m form continuously distributed linear foundation trenches; Earthwork stockpiles elevate ground surfaces by 3–5 m, radically altering natural drainage pathways; Construction-exposed bare soil covers >60% of the area. Field measurements were conducted at 30 sampling points in disturbed and undisturbed areas using a double-ring infiltrometer. Multiple factors, such as the increase in soil bulk density caused by compaction from heavy machinery, the exposure of low-permeability subsoil due to topsoil removal, and the reduction in macropore connectivity resulting from soil structure damage, led to a significant decrease in surface infiltration capacity due to soil compaction. Field measurements showed that the saturated hydraulic conductivity in compacted areas decreased by 40–70% compared with natural soil, which further exacerbated the risk of surface runoff convergence and retention under heavy rain conditions.
We conducted waterlogging simulations using terrain data collected during 2024–2025. High-resolution topography from specific periods established a baseline framework for static-scenario simulations, prioritizing validation of the model’s applicability and predictive accuracy during typical construction phases. This establishes a methodological foundation for future real-time terrain updates and dynamic drainage optimization by engineering teams. In practical applications, dynamic parameter iteration and model refinement can be achieved through regular Unmanned Aerial Vehicle (UAV) surveys integrated with Building Information Modeling (BIM)-based construction progress management systems. Our experimental results thus validate the reliability of this dynamic implementation approach.

2.2. SWMM Model

The Storm Water Management Model (SWMM) [28], developed by the United States Environmental Protection Agency (US EPA), represents an open-source hydrologic-hydraulic modeling framework designed for dynamic simulation of rainfall-runoff processes. Its core architecture integrates three principal modules: hydrology (quantifying surface runoff generation and routing), hydraulics (simulating flow dynamics in drainage networks), and water quality (assessing pollutant transport) [29]. Through continuous refinement, the latest iteration (SWMM 5.2) [30] now incorporates advanced functionalities, including Low Impact Development (LID) facility controls and real-time operational rule-based regulation of hydraulic structures. A key strength lies in its granular modeling capabilities for complex drainage infrastructure—explicitly resolving processes such as overland flow accumulation, pressurized/unpressurized flow in pipes/open channels, and dynamic responses of engineered control structures. While extensively applied in urban stormwater management and watershed-scale runoff modeling, direct applications to dynamically altered construction boundaries remain limited. Nevertheless, foundational studies validate its adaptability: Yao, Hu et al. [31] demonstrated SWMM’s reliability in simulating storm runoff within Gui’an New District’s complex terrain, and Zhang, Qiao et al. [32] leveraged SWMM to parse hydrodynamic changes in urban water system connectivity projects under anthropogenic disturbances.
Within this study, the SWMM framework is tailored to simulate surface hydrological processes under construction-induced disturbances in the Pinglu Canal’s physiographic setting. For runoff generation and convergence calculations, the kinematic wave equation is adopted to quantify runoff dynamics across construction zones, selected for its computational efficiency in capturing rapid flow responses over steep, disturbed terrains. Infiltration processes are characterized by the Green-Ampt model, which explicitly parameterizes time-varying infiltration rates in compacted soils—critical given construction-induced permeability reduction. Regarding flow routing, the absence of subsurface drainage networks necessitates exclusive focus on open-channel hydraulics; thus, the kinematic wave routing method is implemented to simulate unsteady flow propagation in temporary diversion channels and excavated reaches, balancing accuracy and stability for mild-slope conditions typical of the canal’s mid-reach profile.

2.3. HEC-RAS 2D Model

The HEC-RAS 2D model, an open-source two-dimensional hydrodynamic solver developed by the Hydrologic Engineering Center of the US Army Corps of Engineers [33], specializes in simulating flow diffusion processes across natural channels, floodplains, and complex terrains. Its computational core resolves the two-dimensional Shallow Water Equations (SWEs)—a set of partial differential equations governing free-surface flow dynamics—through robust numerical schemes. Specifically, the model iteratively solves: Mass continuity equation (Equation (1)), ensuring water volume conservation; Momentum equations (Equations (2) and (3)), quantifying inertial and pressure forces in x/y directions under variable bed friction.
Validated in flood propagation mapping, inundation extent prediction, and flood control infrastructure assessment [34,35], HEC-RAS 2D’s unstructured mesh adaptability delivers high-fidelity simulations of transient flow interactions with engineered structures and micro-topographic features.
ζ t + p x + q y = 0
p t + x p 2 h + y p q h = n 2 p g p 2 + q 2 h 2 g h ζ x + p f + ρ x h τ x x ρ y h τ x y
q t + y q 2 h + y p q h = n 2 q g p 2 + q 2 h 2 g h ζ y + q f + ρ y h τ y y ρ x h τ x y
where ζ denotes the surface elevation (m),   p and q represent the unit discharges in the x- and y-directions, respectively (m3/s),   h is the water depth (m),   n is Manning’s roughness coefficient,   g is gravitational acceleration (m/s2),   ρ is water density (kg/m3),   f is the Coriolis parameter (s−1) and τ x x , τ y y , τ x y are components of the directional effective shear stress.
The model employs a finite volume method (FVM) for numerical solution, utilizing unstructured meshes to accommodate complex topographies while ensuring computational stability through explicit time-stepping schemes [36]. Within our framework, HEC-RAS 2D serves as the core hydrodynamic engine, tasked with two critical functions: Ingesting runoff inputs from SWMM-generated boundary conditions; Resolving the spatial diffusion dynamics of surface waterlogging across construction-disturbed terrains. Its physics-based SWE solver quantitatively captures terrain-induced flow impedance effects and diversion efficiency of temporary drainage channels—delivering spatially explicit decision support for identifying high-risk ponding zones and optimizing drainage infrastructure layouts. Such high-resolution spatial diagnostics, unattainable via traditional 1D hydraulic models, underscore the indispensable role of 2D hydrodynamic modeling in complex engineering scenarios characterized by rapidly evolving anthropogenic footprints.

2.4. A Coupled SWMM-HEC-RAS 2D Model

Large-scale hydraulic construction scenarios impose unique demands on model coupling due to multiscale interactions between hydrological processes and hydrodynamic responses. In this study, we selected the SWMM and HEC-RAS 2D models for coupling to construct a hydrological-hydrodynamic framework oriented toward dynamically changing construction boundaries. The core objective lies in achieving synergistic analysis of localized precision management and macroscopic flow diffusion dynamics. This coupling design transcends mere data transfer, instead capitalizing on profound physical and functional complementarity between the two models: SWMM employs distributed hydrological process simulation to characterize spatiotemporal heterogeneity of surface runoff in construction-disturbed zones, with particular proficiency in quantifying proactive regulation effects of temporary drainage facilities; HEC-RAS 2D leverages two-dimensional shallow water equation theory to unravel nonlinear hydrodynamic behaviors governing flow diffusion under complex terrain constraints.
The model coupling achieves precise integration of hydrological-hydrodynamic processes through a spatial-temporal dual-scale synergistic mechanism: In the spatial dimension, SWMM focuses on abrupt changes in hydrological parameters caused by construction disturbances using sub-catchments as micro units, while HEC-RAS 2D parses the macroscopic flow field with unstructured grids to capture the reconstruction effects of engineering elements (such as foundation pit scarps and temporary roads) on regional flow paths, forming a nested relationship from local hydrological responses to global hydrodynamic evolution. In the temporal dimension, SWMM adopts a 5-min time step to adapt to the attenuation process of the Green-Ampt infiltration model and the dynamic regulation cycle of drainage facilities, whereas HEC-RAS 2D uses a 1-min time step to ensure the numerical stability of the shallow water equations under complex construction terrain. The two models exchange data through a Python 3.8.10 middleware: SWMM’s 5-min runoff data is converted into 1-min sequences via sliding window linear interpolation for input into HEC-RAS 2D; conversely, HEC-RAS 2D’s 1-min inundation depth data is fed back through 5-min moving averages to dynamically update the surface roughness in SWMM. Finally, the temporal step coupling error is controlled within ±5% through mass conservation verification, ensuring the physical consistency between hydrological runoff generation and hydrodynamic confluence.
The core focus of model coupling lies in enabling 2D hydrodynamic simulation and precise identification of waterlogging zones. Beyond parameter data output by the SWMM hydrological model, this requires Digital Elevation Model (DEM) and Digital Surface Model (DSM) data covering the channel extent within the study area to support mesh generation for the HEC-RAS model. Upon initializing the hydrodynamic modeling environment, an n × m computational grid is created. This grid structure systematically subdivides the modeling domain into smaller, manageable units, thereby enhancing simulation accuracy. Each grid cell represents a discrete segment of the study river corridor, enabling the software to compute and analyze flow dynamics and waterlogging behavior with higher computational efficiency. Subsequently, the boundary conditions for the HEC-RAS 2D model are defined. This is accomplished by inputting SWMM-generated water level hydrographs from designated drainage network nodes and inflow hydrographs from the upstream channel domain into corresponding nodes of the 2D hydrodynamic computational grid. Leveraging SWMM’s computational capabilities, hydraulic and hydrological outputs are instantaneously fed into HEC-RAS, enabling concurrent execution of both models within an integrated framework. The coupled model yields spatially explicit waterlogging flow velocities and depths across discrete channel segments, providing comprehensive delineation of ponding conditions within any arbitrarily selected mesh cell of the computational domain.

2.5. Data Sources

We structured the data framework around the hydrological-engineering coupled characteristics of the Pinglu Canal’s Lingshan section during its construction phase. The dataset integrates multi-source acquisitions through systematic consolidation, comprising: Terrain data (DEM/DSM), Meteorological rainfall records, Construction engineering parameters, and Field validation measurements.
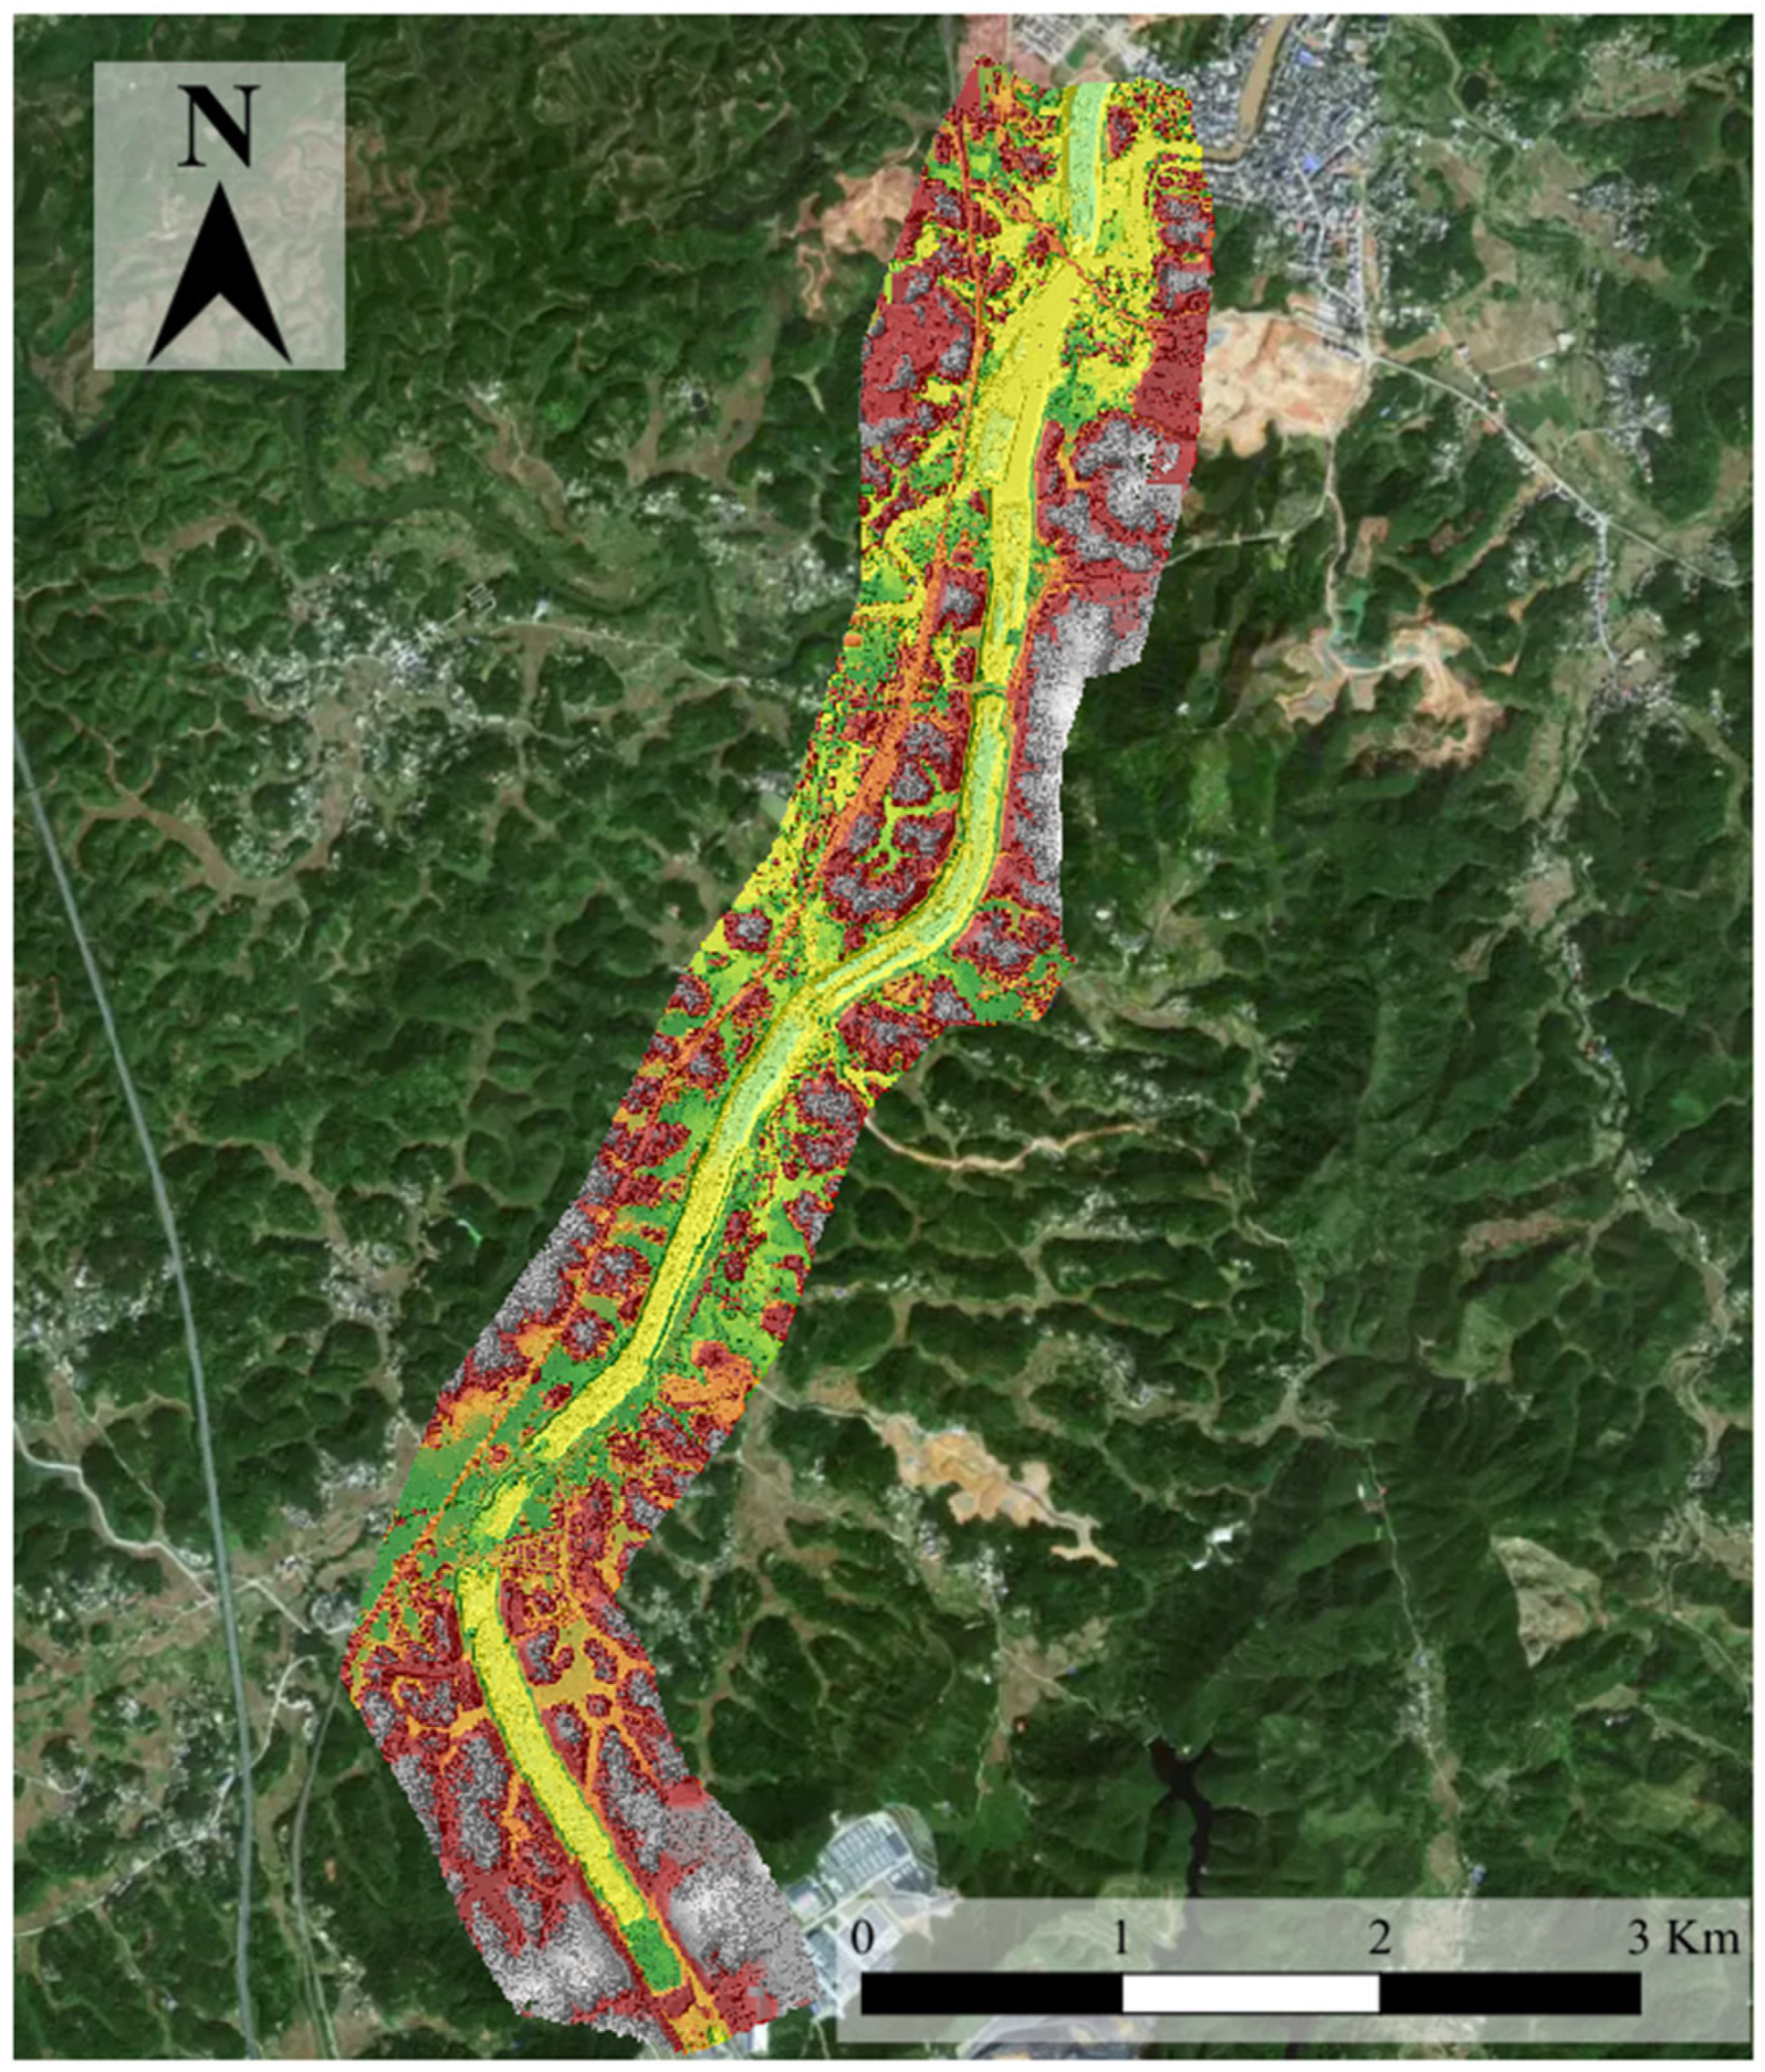
Terrain data was acquired through Unmanned Aerial Vehicle—Light Detection and Ranging (UAV-LiDAR) scanning in May 2025, generating a 10-cm resolution Digital Elevation Model that comprehensively covers the canal corridor and adjacent buffer zones. Among them, the UAV-LiDAR data were verified using 100 ground control points measured by Real-Time Kinematic—Global Positioning System (horizontal accuracy: ±3 cm, vertical accuracy: ±2 cm). The root mean square error of the DEM was 5.2 cm (Figure 2). Meteorological datasets incorporate both hourly rainfall observations from the Qinzhou Meteorological Bureau (2023–2025) and Chicago design storm hyetographs for multiple return periods derived from the Guangxi Rainstorm Intensity Formula. To address climate change impacts on extreme precipitation, design storm intensities were augmented by 20% based on the Intergovernmental Panel on Climate Change Sixth Assessment Report (IPCC AR6) Shared Socioeconomic Pathway 5-8.5 (SSP5-8.5) scenario projections. Engineering parameters provided by the Pinglu Canal Project Department include geometric specifications of temporary drainage channels, deployment locations of mobile pumping stations, and their rated performance metrics—all cross-verified against field measurements and equipment manuals.

3. Results and Discussion

3.1. Calibration and Validation of SWMM Model

Parameters involved in the SWMM model are classified into non-calibrated parameters (correction) and calibrated parameters (empirical). Non-calibrated parameters include: sub-catchment average slope, sub-catchment area, impervious area percentage, and characteristic overland flow width—are directly extracted from geospatial data processed through ArcGIS. Calibrated parameters comprise Manning’s coefficients for impervious/pervious surfaces, depression storage depths for impervious/pervious areas, maximum/minimum infiltration rates, and infiltration decay coefficients. Initial value ranges for these calibrated parameters were established based on the SWMM User’s Manual and relevant literature [37,38], followed by iterative refinement to obtain the final calibrated parameter set documented in Table 2.
Manning’s coefficients (N-Imperv, N-perv) are dimensionless parameters characterizing surface roughness. Their calibration ranges, combining model manual recommendations and on-site measured data, ensure alignment with the actual surface conditions of the construction area. The basis for the ranges of infiltration-related parameters (Max. Infil. Rate, Min. Infil. Rate, Decay) all derives from field test data from 30 typical measurement points in the study area, and they are cross-validated with parameter ranges of similar disturbed environments in existing literature to ensure rationality.
To further verify the applicability of the model under different rainfall intensities during the construction period, we selected 3 independent rainfall events (15 April, 28 April, and 7 May 2025) for validation. These events cover typical rainfall patterns in the study area, including short-duration heavy rainfall and long-duration moderate rainfall, ensuring the robustness of the calibrated parameters. The specific information of each event is as follows: For the event on 15 April 2025, the 24-h cumulative rainfall was 92.6 mm, with the peak intensity of 6.2 mm/h occurring between 14:00 and 15:00, which was a moderate-intensity rainfall event; for the event on 28 April 2025, the 24-h cumulative rainfall was 45.3 mm, and the peak intensity of 3.8 mm/h appeared between 06:00 and 07:00, which was a typical low-intensity, long-duration rainfall event in the early rainy season; for the event on 7 May 2025, the 24-h cumulative rainfall reached 168.9 mm, with the peak intensity of 9.5 mm/h occurring between 18:00 and 19:00, reflecting a high-intensity rainfall event with rapid runoff generation, simulating extreme rainfall conditions during the construction period. Subsequently, we used three evaluation statistical indicators, namely Nash-Sutcliffe Efficiency (NSE), coefficient of determination (R2), and root mean square error (RMSE), to quantitatively evaluate the model performance. The model simulation results of the three rainfall events were compared with the on-site measured water level data at key monitoring points, and the statistical performance indicators were calculated. See Table 3.
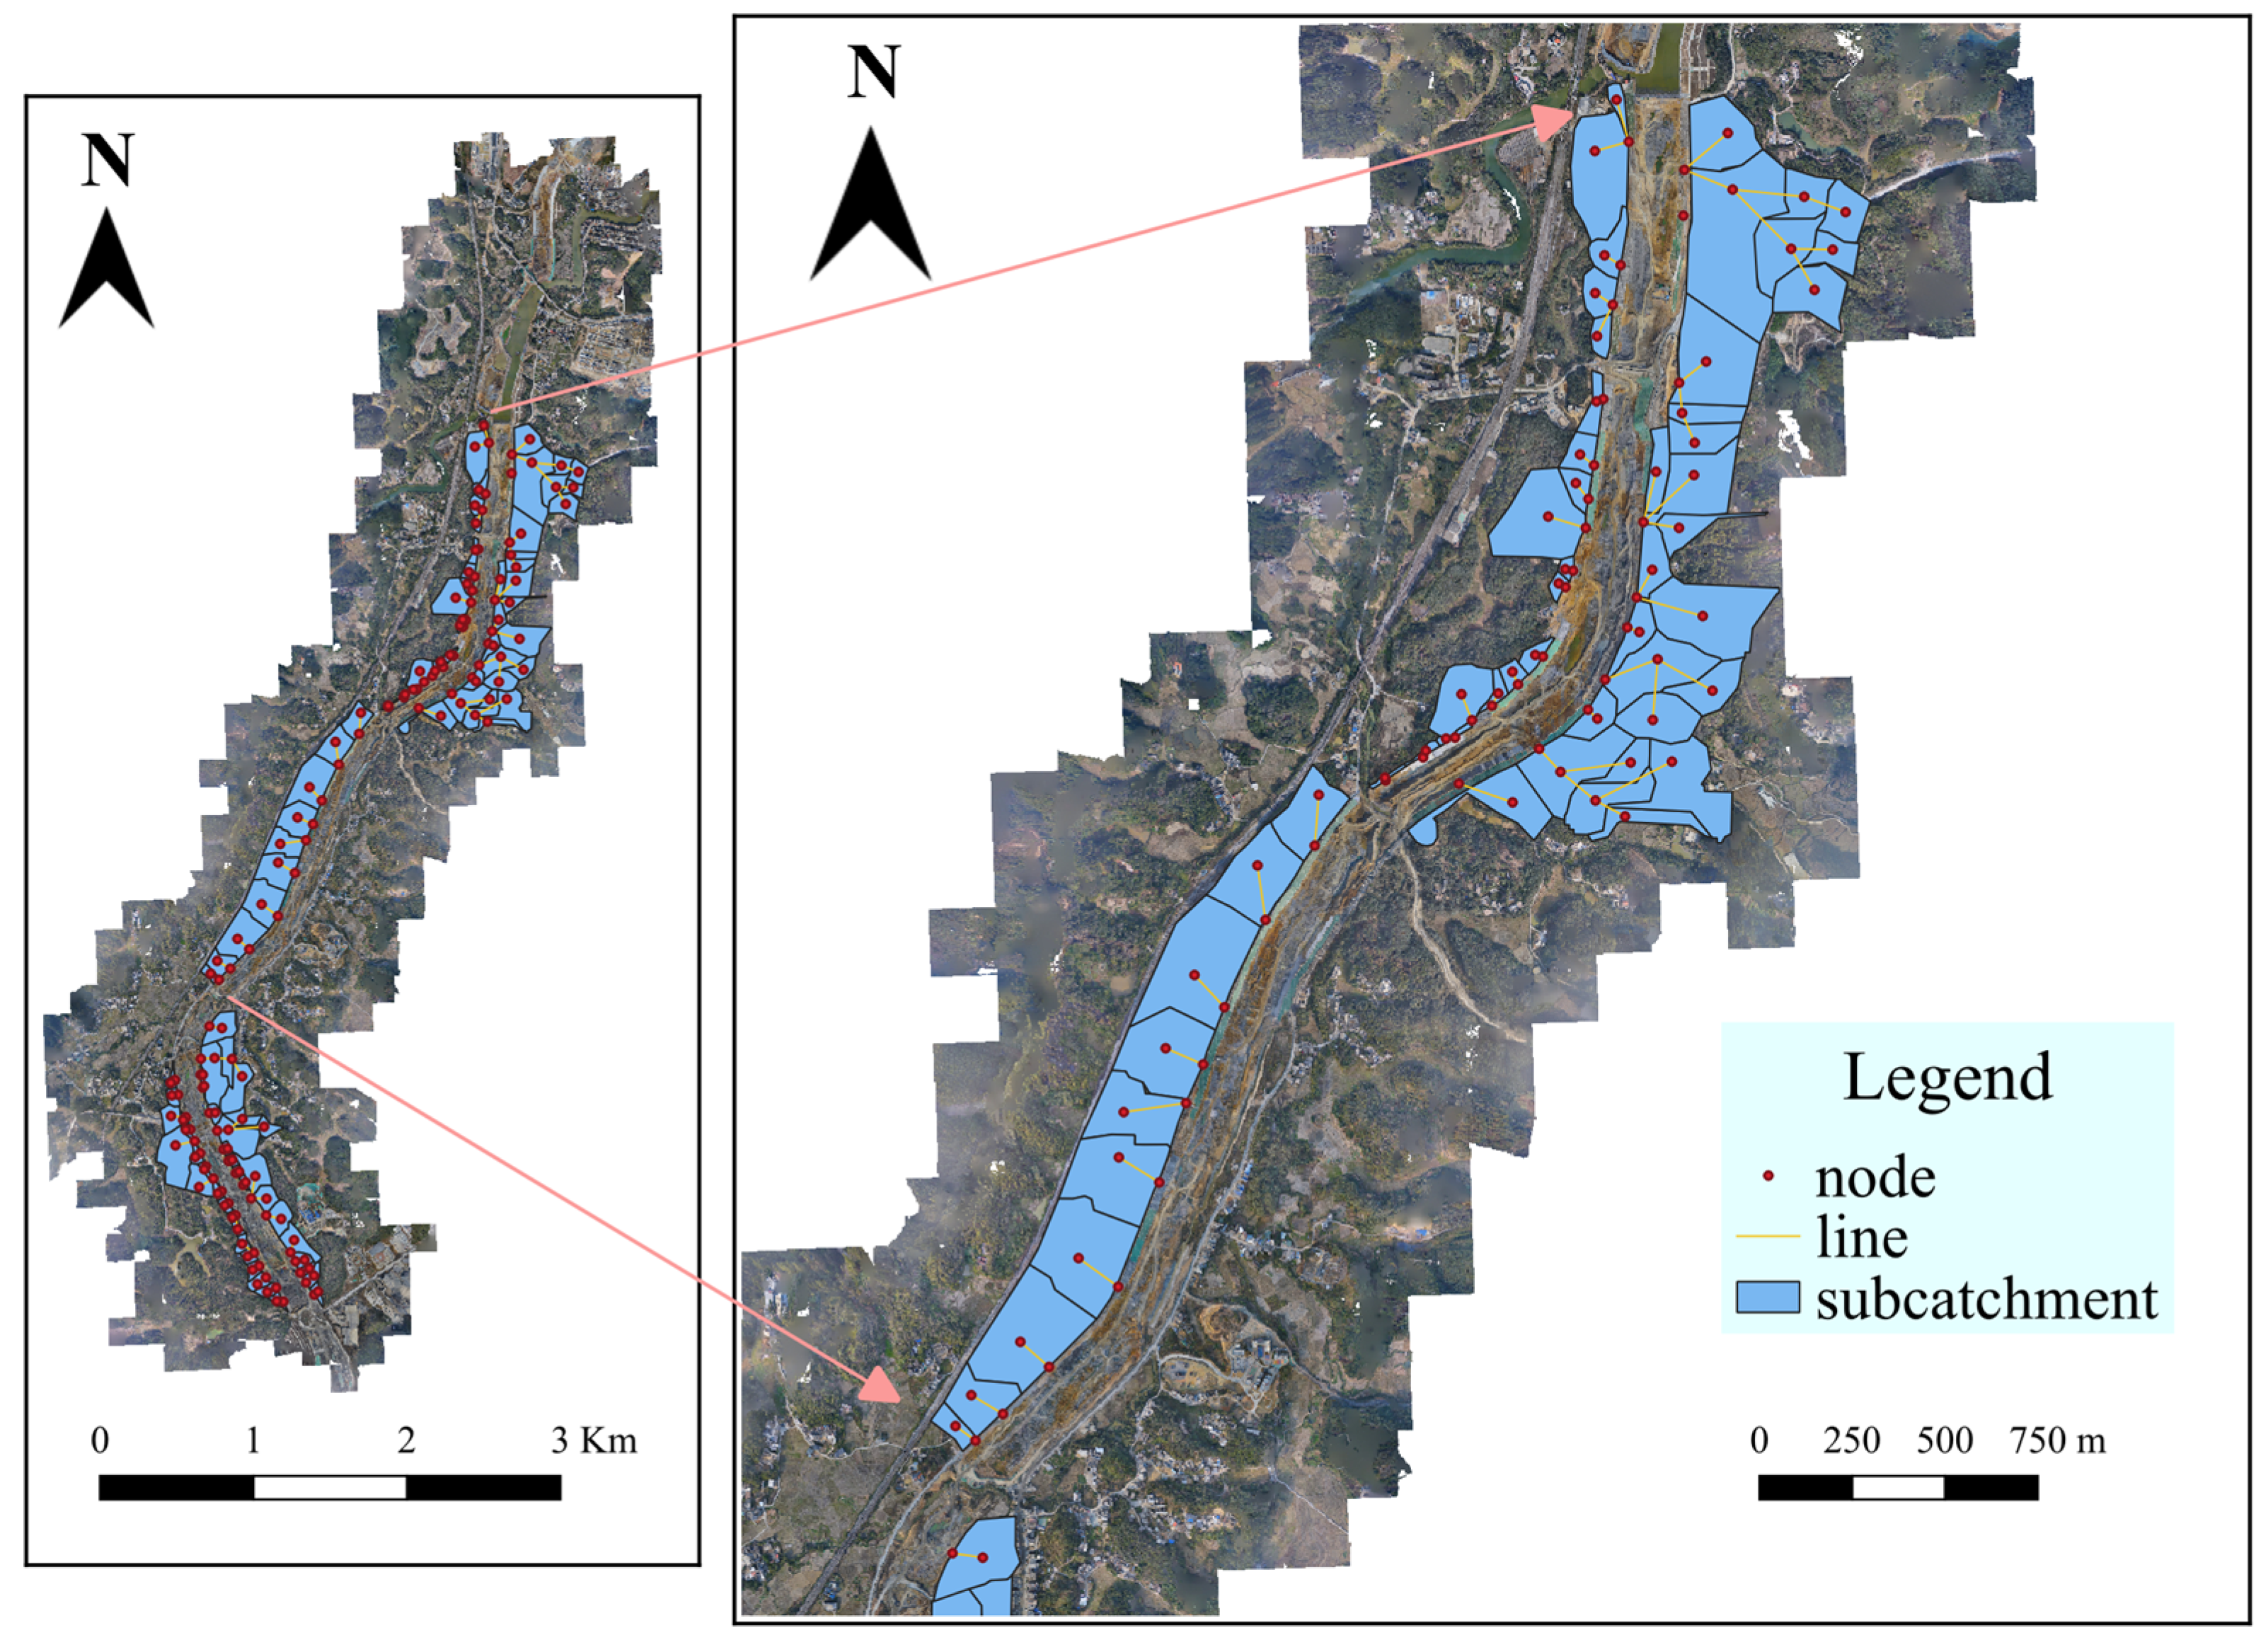
All three validation events achieved NSE > 0.78, R2 > 0.82, and RMSE < 0.13 m, indicating that the model can maintain stable performance under low-, medium-, and high-intensity rainfall scenarios. This confirms the reliability of the calibrated parameters in simulating complex hydrological processes under construction disturbances. Among them, the model processing results of the rainfall event on 7 May 2025 (Figure 3) are highly consistent with the field survey results, demonstrating that the SWMM model and the relevant parameter settings after calibration have high accuracy in the study area.

3.2. Construction of SWMM-HEC-RAS 2D Coupling Model

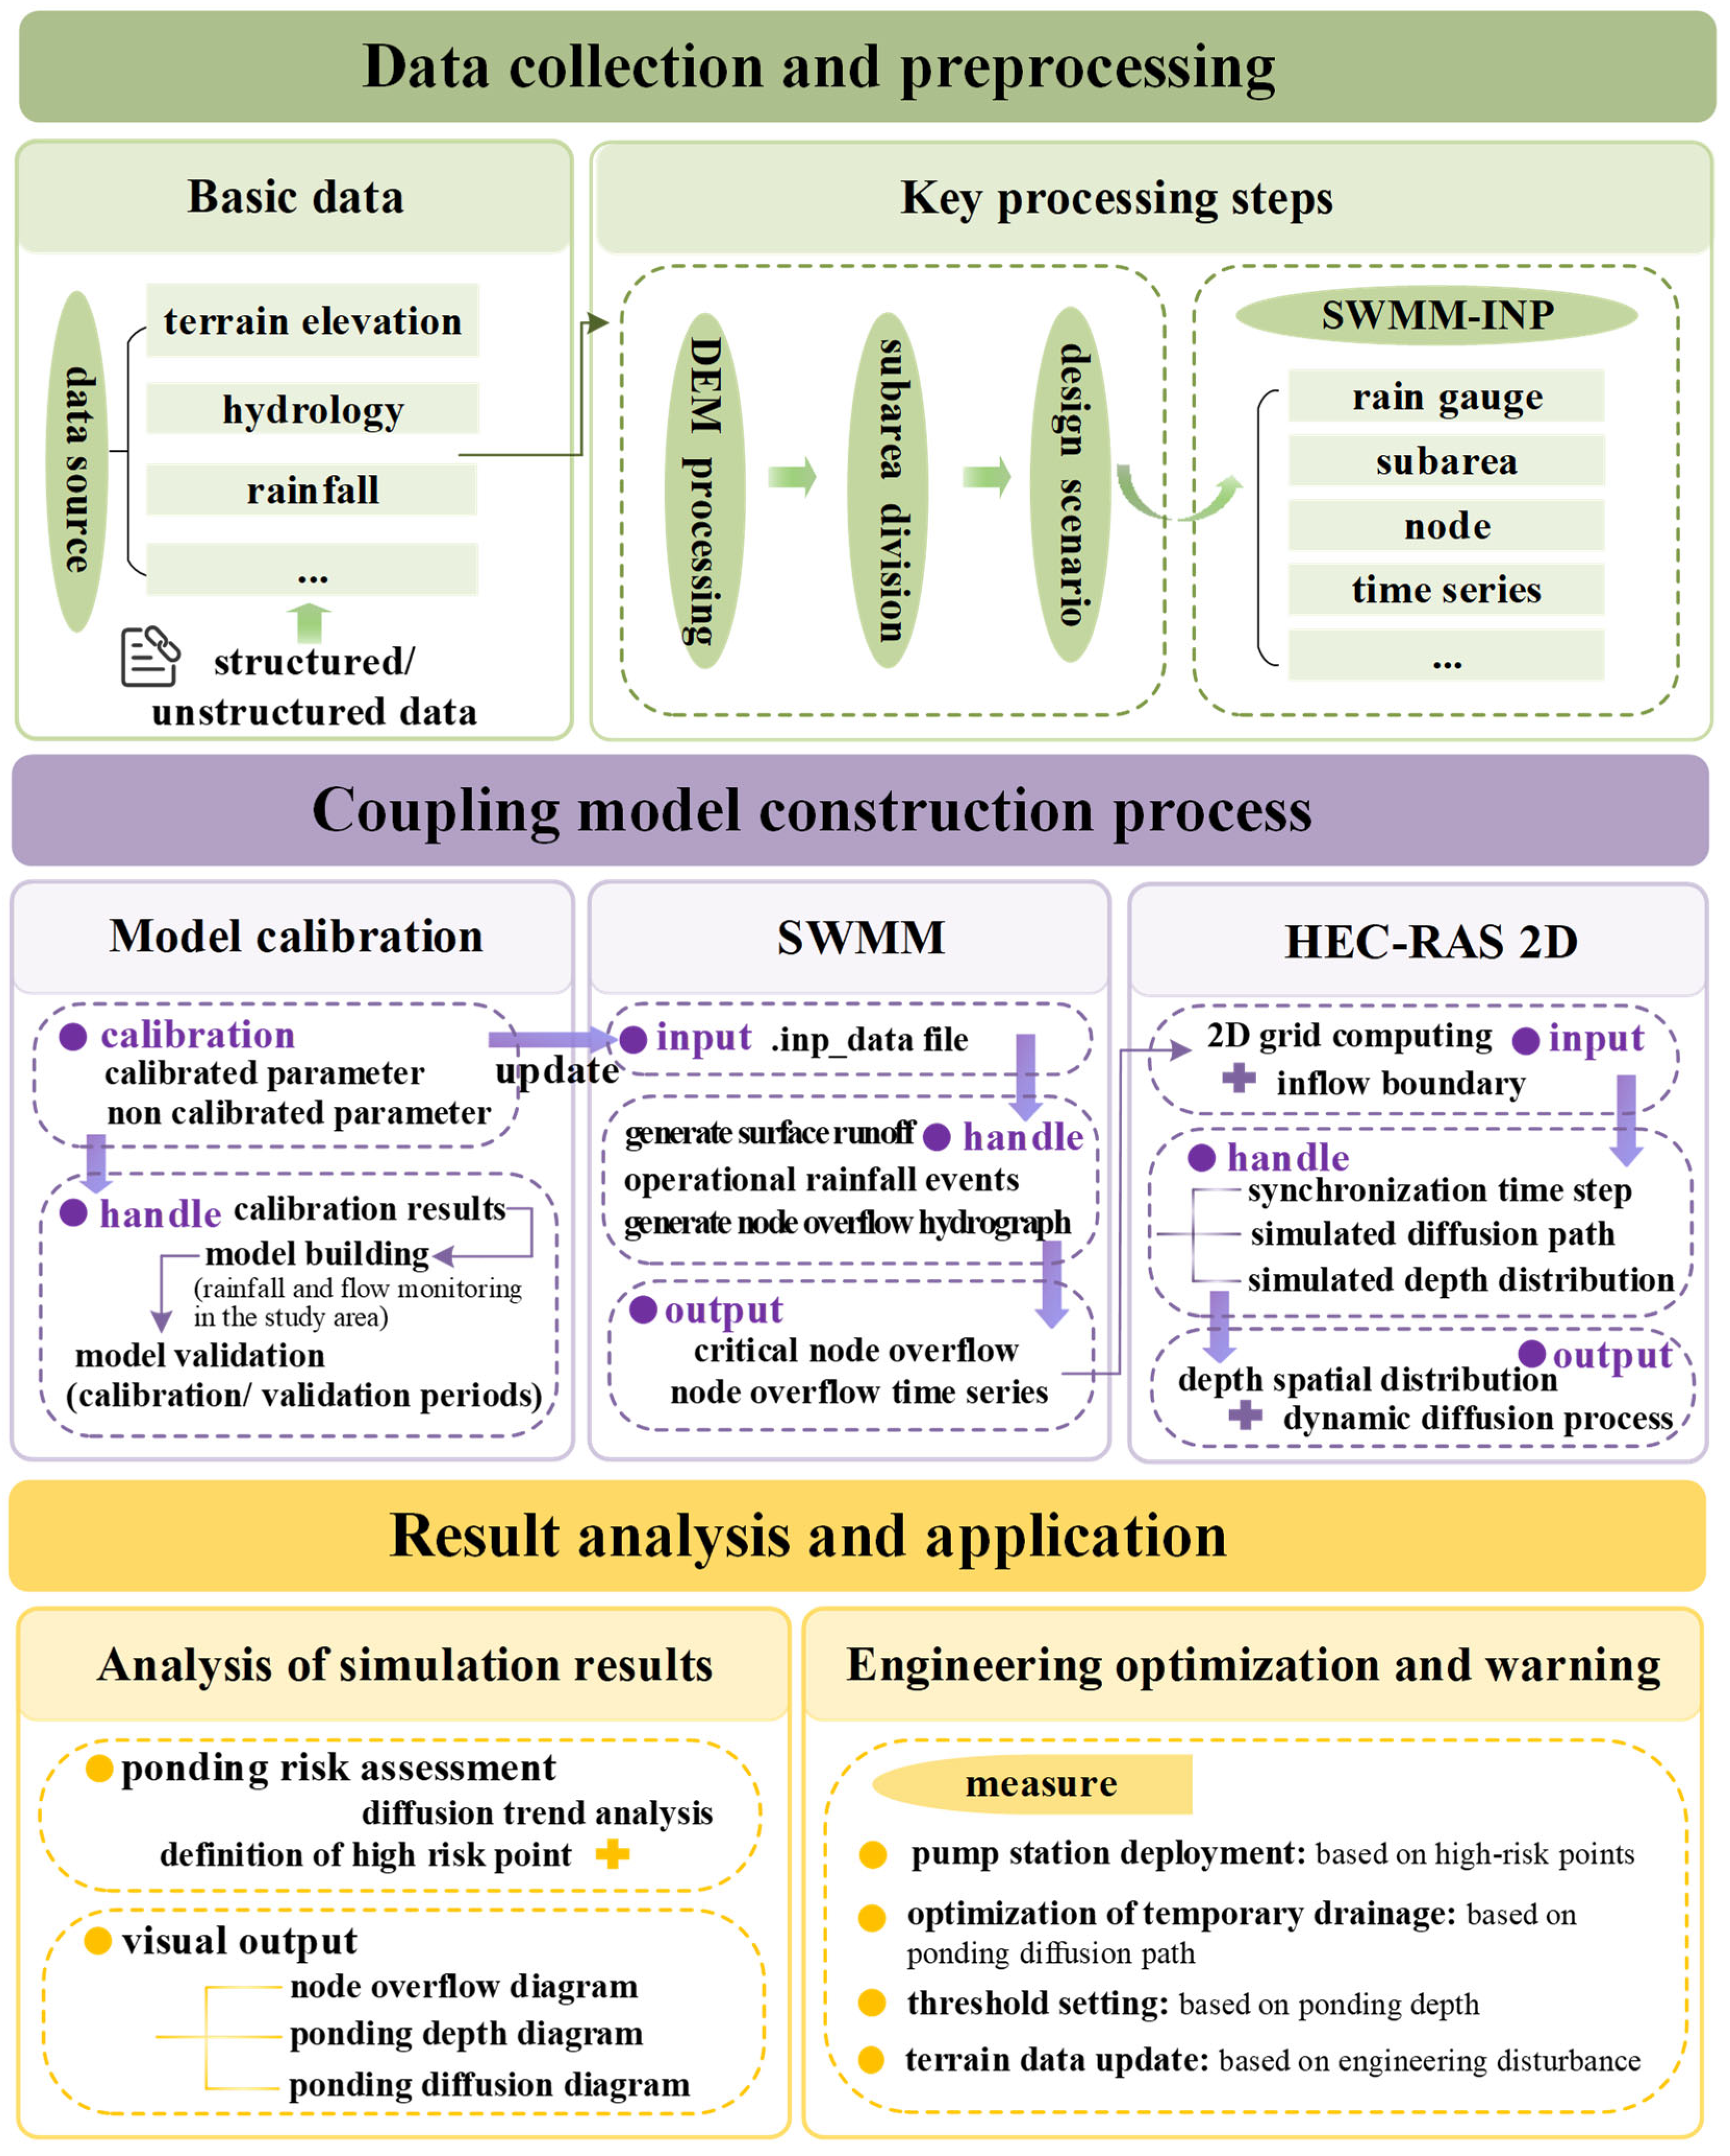
We implemented a temporal real-time coupling approach to integrate the SWMM 1D runoff generation-convergence model with the HEC-RAS 2D flood propagation model, enabling high-fidelity simulation of surface runoff and overland flow processes during the construction phase. By utilizing SWMM-generated overland runoff data as boundary conditions for HEC-RAS 2D, this approach bridges micro-topography-influenced runoff generation processes with overland flow propagation. The methodological framework implemented in this study is presented in Figure 4.
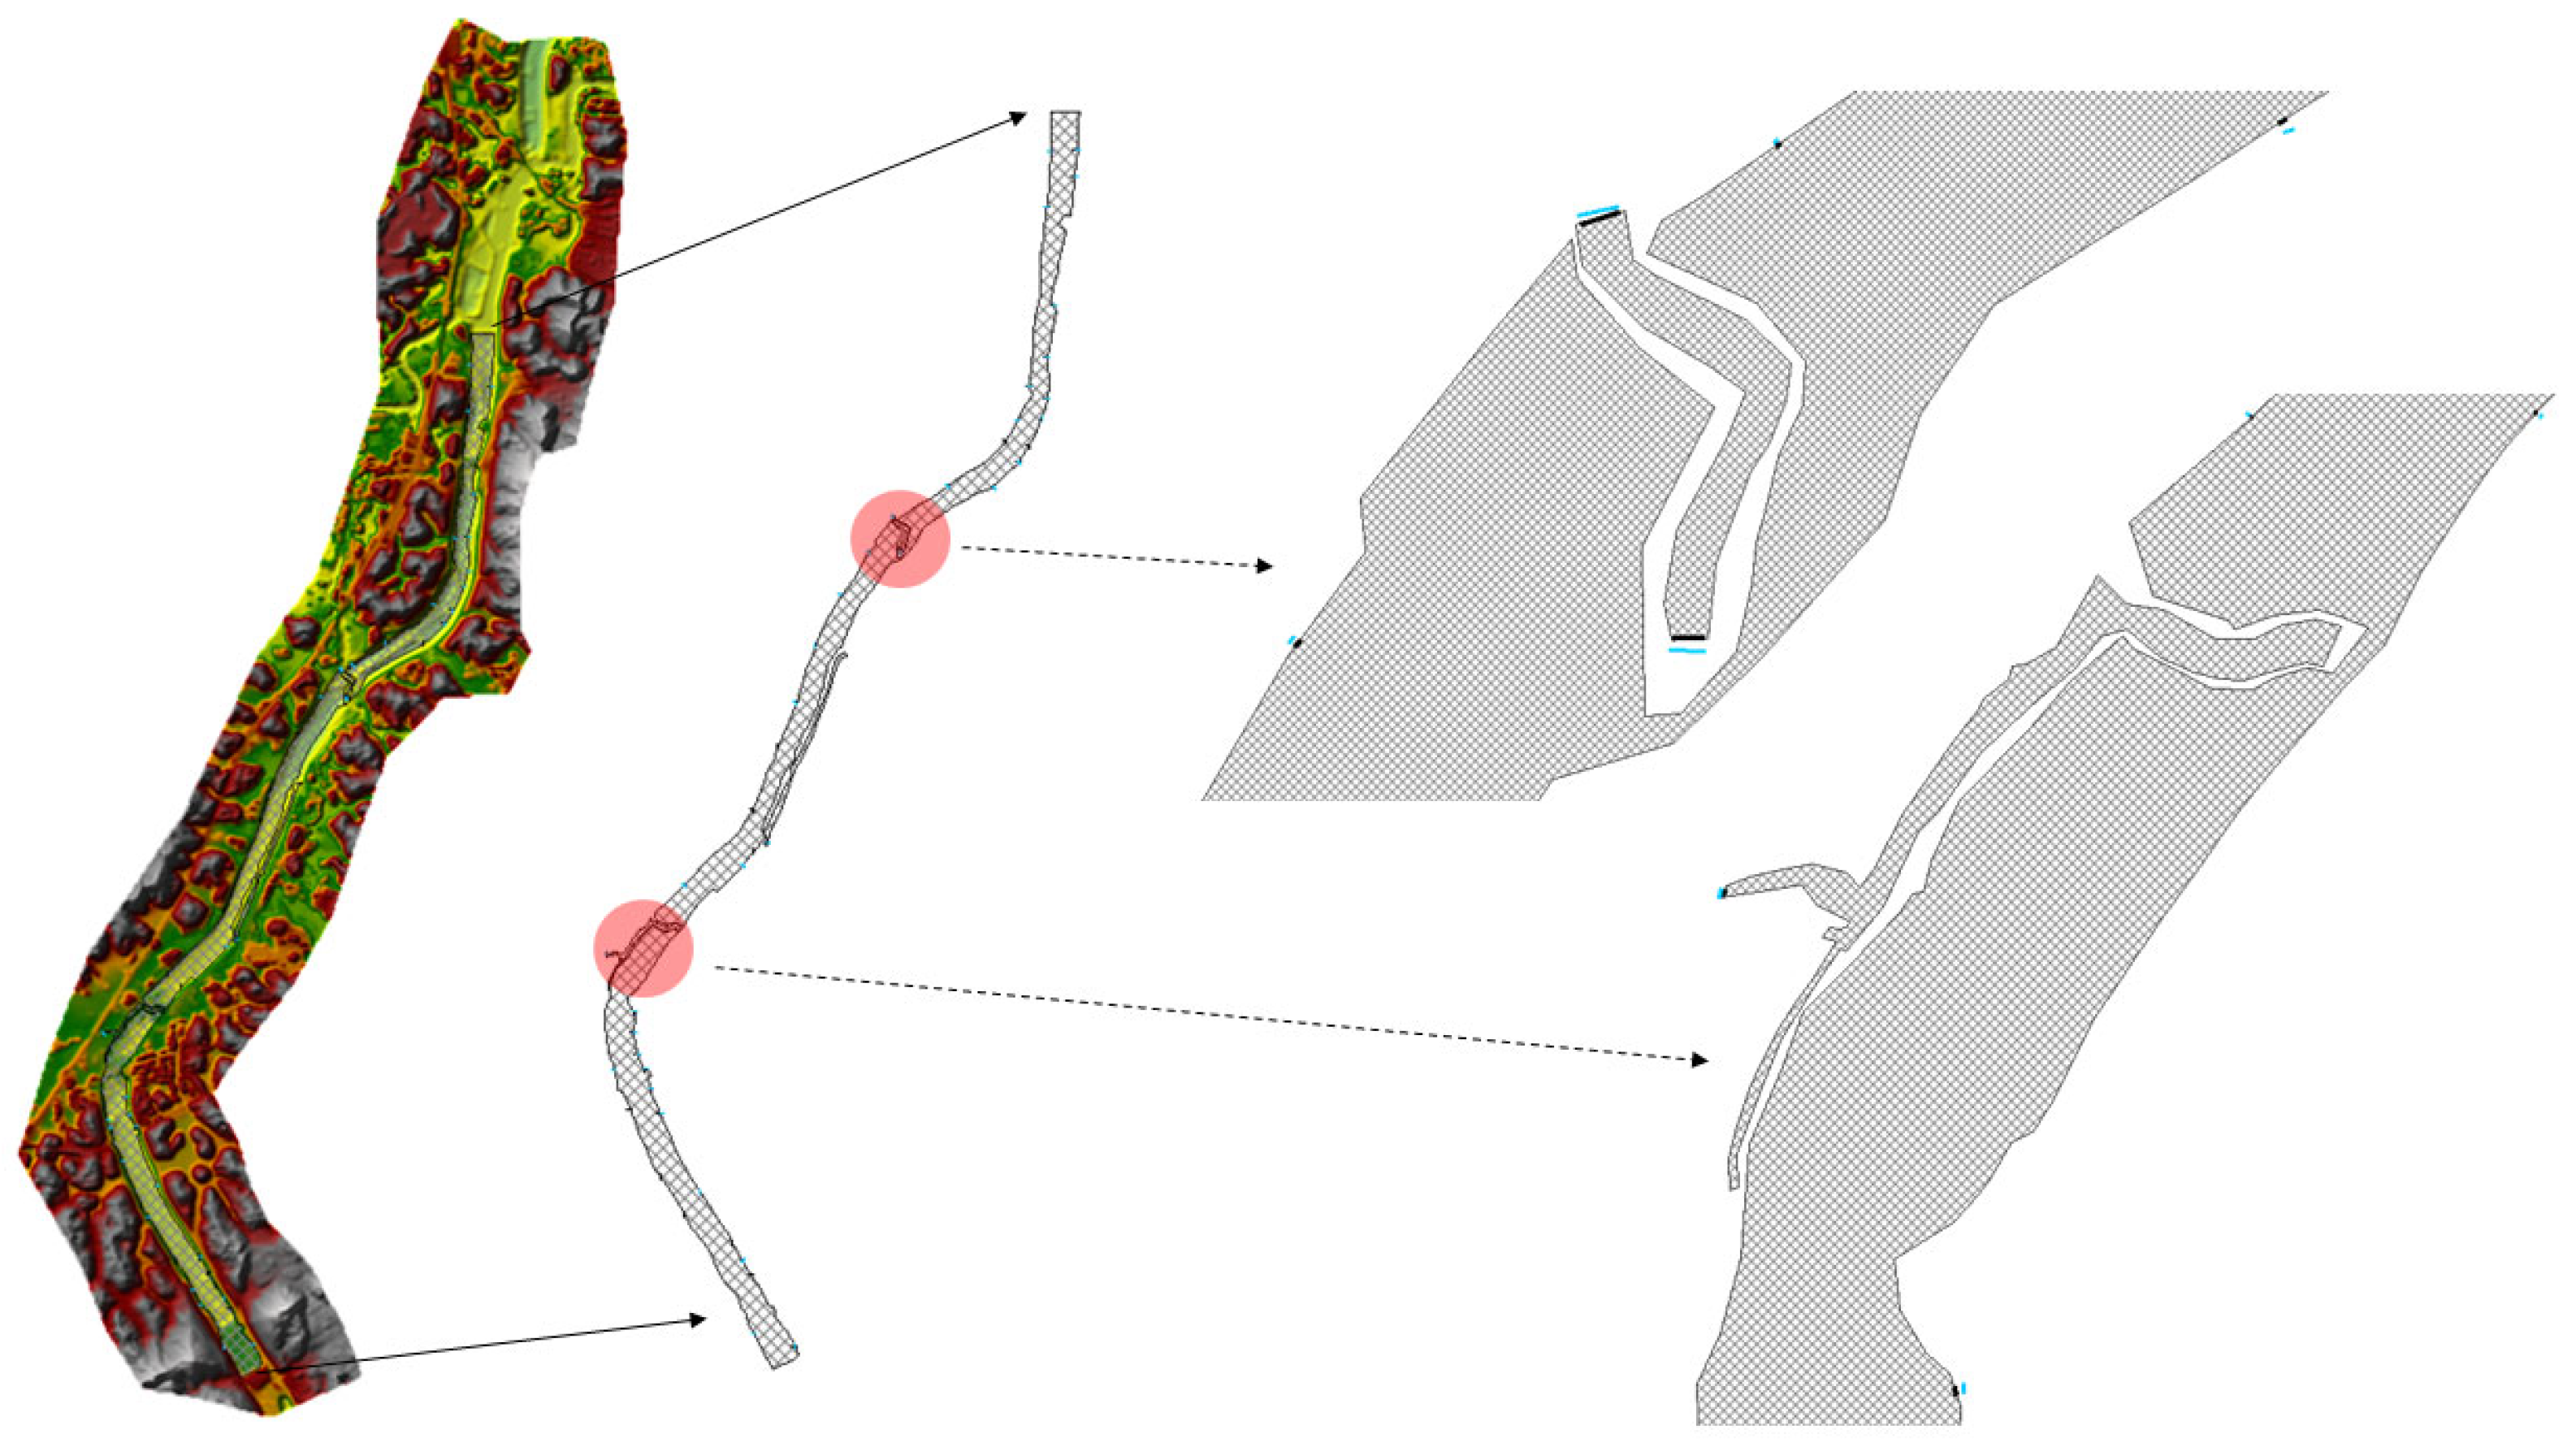
Initially, the SWMM 1D hydrological model was constructed within ArcGIS using integrated geospatial datasets. Input parameters included sub-catchment boundaries, slopes, and impervious area ratios derived from 10-cm resolution DEM, with Green-Ampt model quantification of infiltration rate attenuation in construction-disturbed zones. SWMM exported surface runoff hydrographs at discrete time steps as CSV time-series files. Subsequently, a Python-based interface was engineered to enable SWMM-HEC-RAS 2D data exchange. This module processed runoff outputs into HEC-RAS-compatible boundary files containing geographic coordinates and discharge chronologies at sub-catchment outlets, ensured spatiotemporal coherence through timestep synchronization and unit conversion, and embedded processed data into the 2D hydrodynamic framework. Within the HEC-RAS 2D phase (Figure 5), unstructured computational meshes generated from topographic DEM facilitated shallow water equation simulations driven by SWMM-derived boundary conditions, yielding HDF5-format spatiotemporal distributions of water depth, flow velocity, and inundation extent. Ultimately, hydrodynamic outputs were converted to GeoTIFF rasters. The coupled system implemented real-time sequential interaction wherein SWMM dynamically updated runoff outputs while HEC-RAS 2D concurrently executed simulations, establishing closed-loop feedback.

3.3. Result Analysis

3.3.1. Simulation Analysis of Ponding Under Different Return Period Design Rainstorm Scenarios

To analyze stormwater ponding dynamics under varying rainfall intensities and assess their regional impacts, we constructed six design storm scenarios (return periods: 1a, 5a, 10a, 20a, 50a, and 100a) using the Chicago hyetograph method. This approach integrates the topographic and climatic characteristics of Lingshan County, Qinzhou, Guangxi. Rainfall intensity calculations strictly adhered to the Guangxi Provincial Standard Technical Specification for Storm Intensity Formula Development (DB45/T 2155-2020), which has remained the current regulatory framework since its enactment on 20 November 2020. The standard is administered by the Guangxi Meteorological Standardization Technical Committee under the oversight of the Guangxi Zhuang Autonomous Region Market Supervision Administration. The Qinzhou storm intensity formula derived per this standard is:
q = 1815.359 ( 1 + 0.594 l g   P ) / ( t + 6.669 ) 0.596
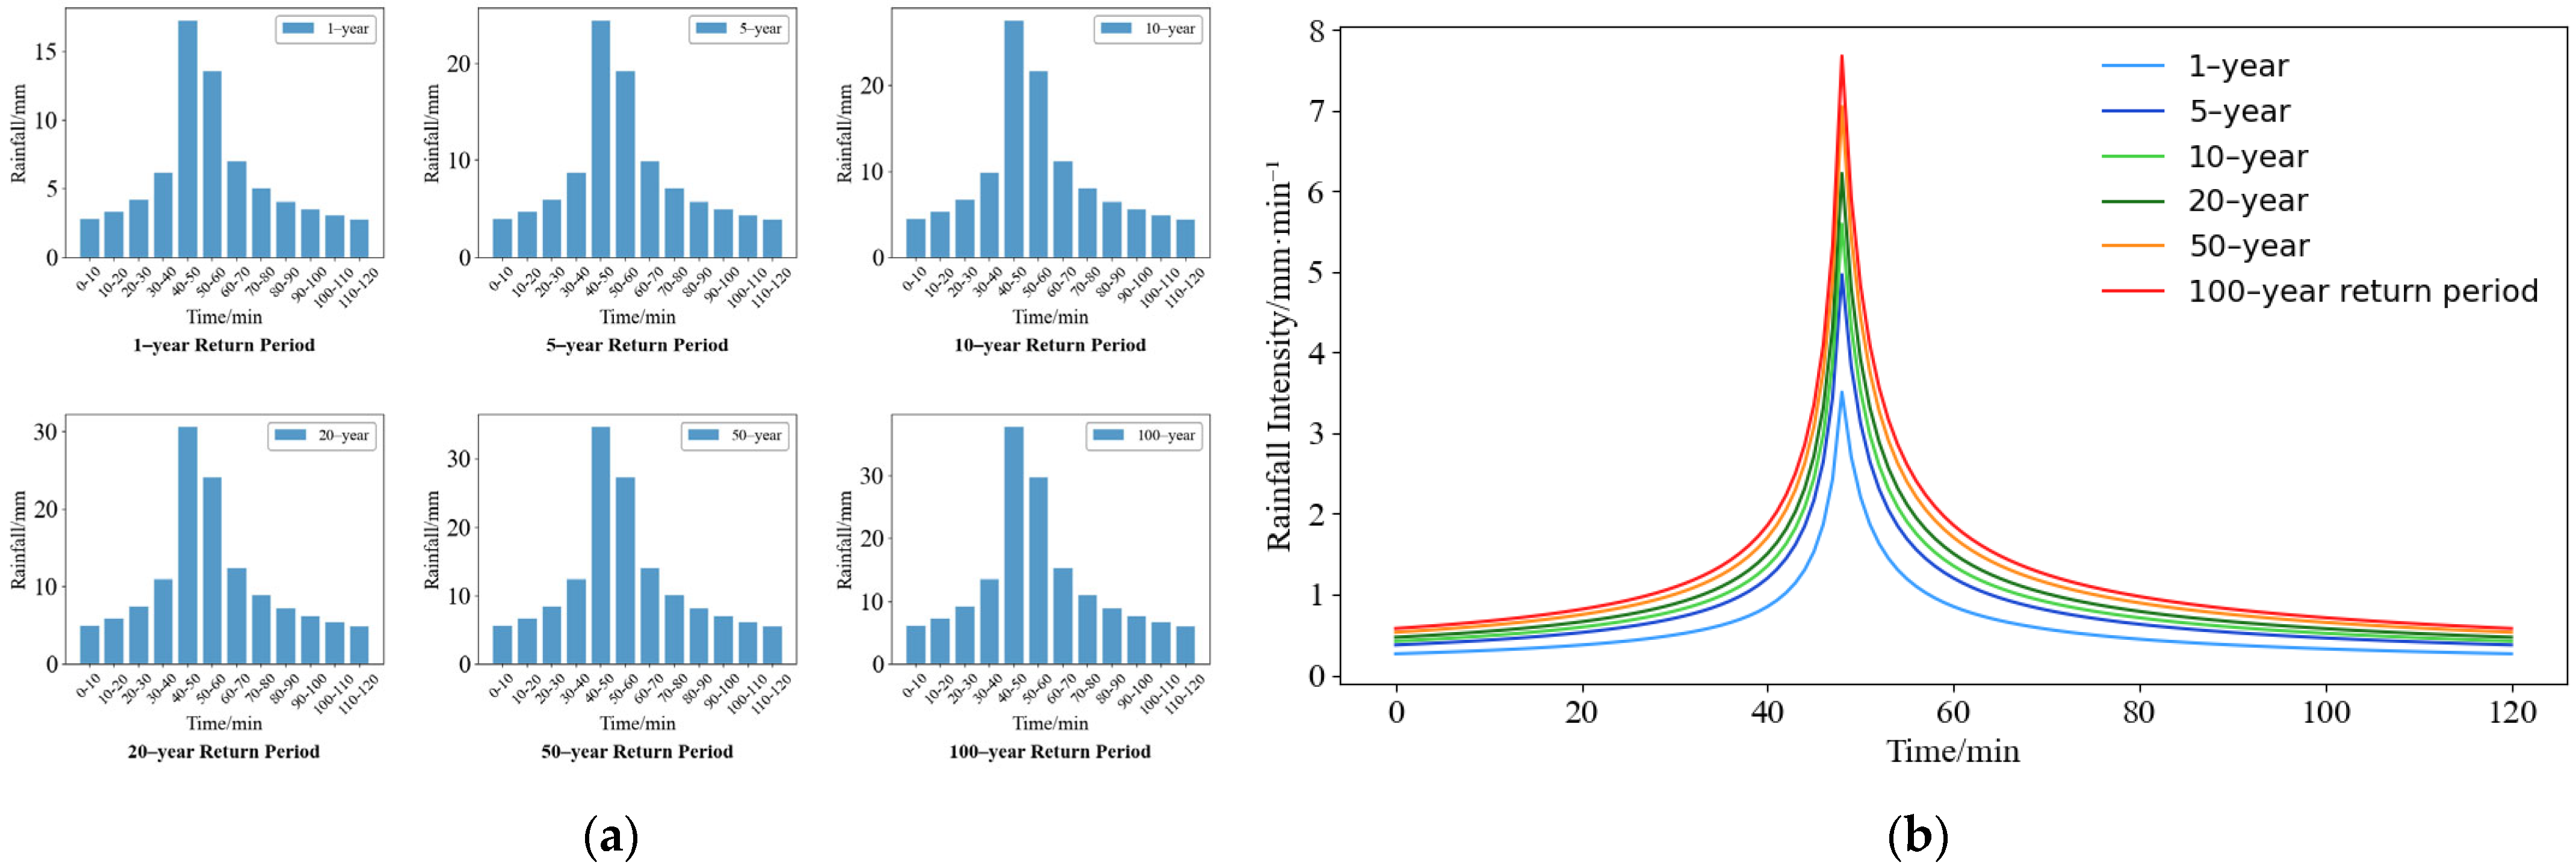
where: q is the rainstorm intensity (mm/min), P is the return period (a), and t is the rainfall duration (min). The rainfall peak coefficient is 0.4, the rainfall interval is 1 min, and the duration is 120 min. The design rainfall and rainfall intensity process of each return period (Figure 6).
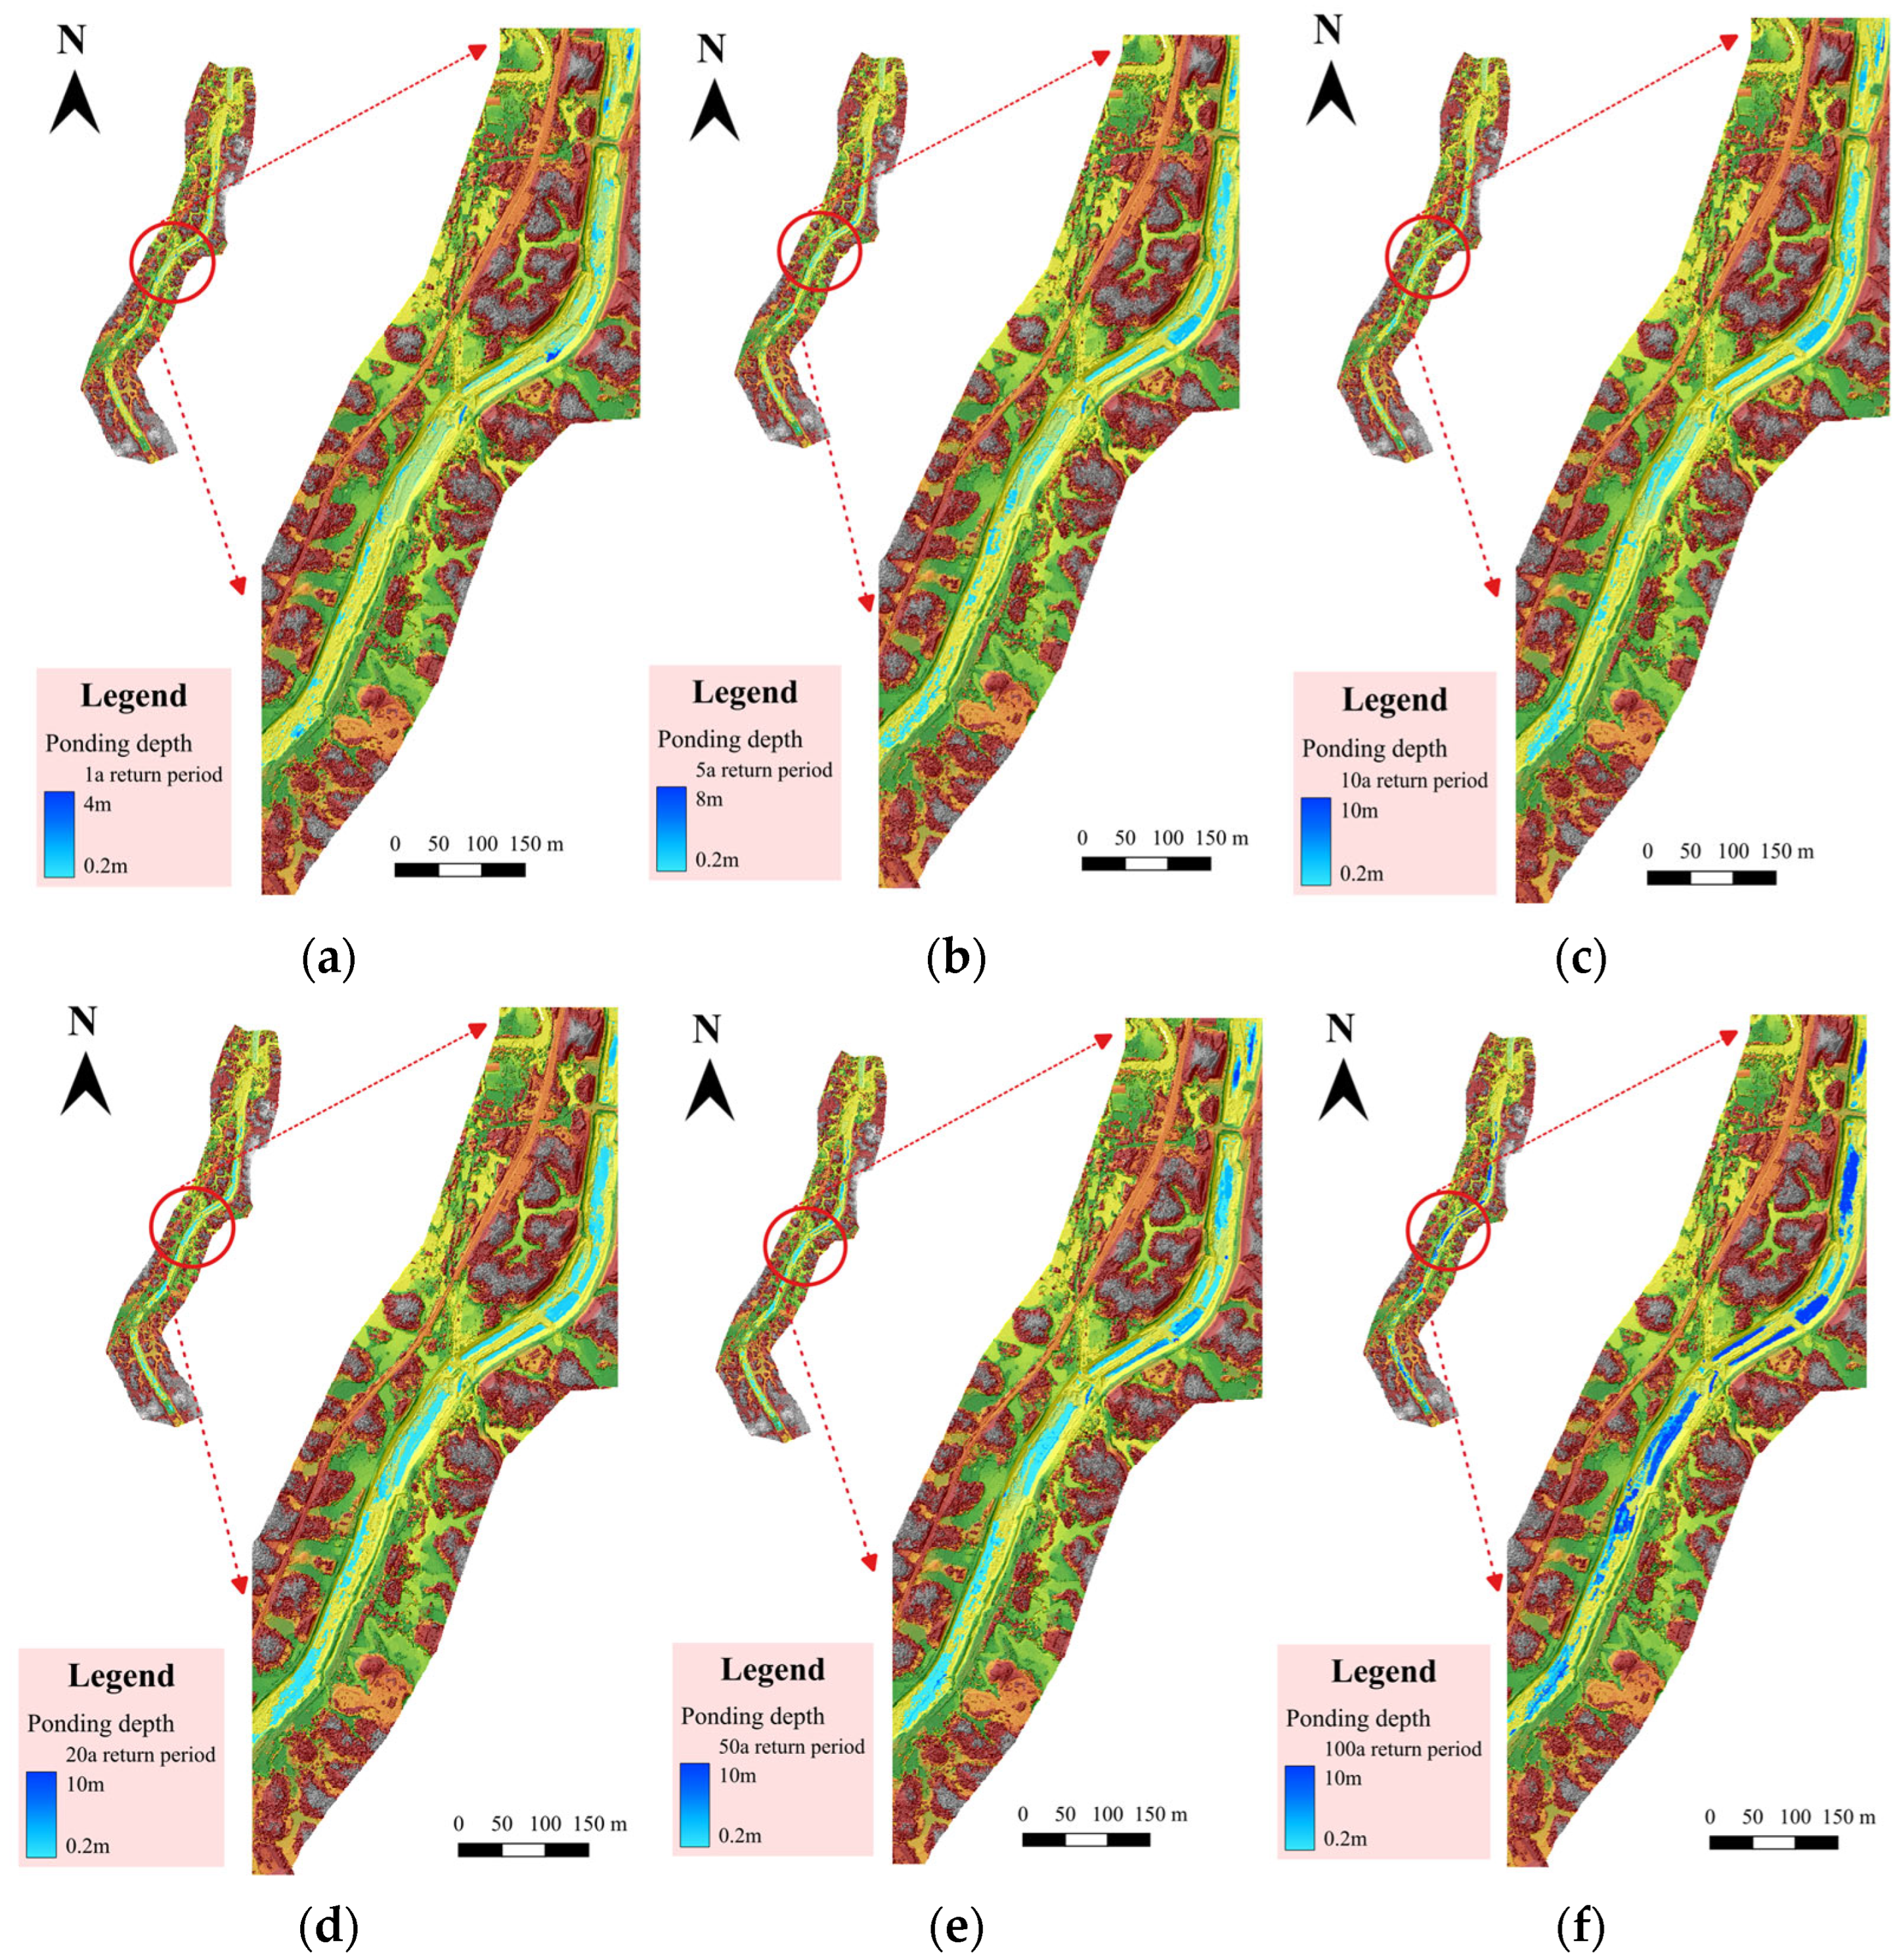
Rainfall analysis reveals that as the return period increases from 1 to 100 years: Peak intensity rises from 3.51 to 7.68 mm/min (+118%), and Cumulative rainfall over 120 min surges from 67.16 to 250.51 mm (+273%). These metrics demonstrate exponential escalation of stormwater stress on construction zones under extreme weather. Using these rainfall scenarios (1a, 5a, 10a, 20a, 50a, and 100a) as inputs, the coupled model simulated ponding depth distributions after 60-min events, generating six spatial inundation maps (Figure 7). Color gradients visualize water depth variations: The color shading from light blue to dark blue represents the gradual increase in ponding depth. These plots effectively illustrate the spatial progression of ponding under escalating storm intensities.
Preliminary analysis of the simulation maps reveals that under low return periods such as in Figure 7a,b, ponding shows scattered distribution, primarily concentrated in locally low-lying foundation pit areas of the construction zone, with small extent and shallow depth. As return periods increase, as shown in Figure 7e,f, the ponding area expands significantly, forming continuous inundation at temporary road intersections and drainage-vulnerable sections where depth increases sharply. This visual change directly demonstrates the nonlinear growth trend of construction-site ponding risk with storm intensity: under low-return-period storms, ponding growth remains relatively gradual; during high-return-period storms, ponding depth and coverage exhibit accelerated growth. To quantify this pattern, we employed multi-scenario simulations and mathematical statistical analysis to reveal the unique response mechanism of construction-phase channel ponding: First, based on the coupled SWMM-HEC-RAS 2D model, design storms of six return periods were input to simulate spatial depth distributions under each scenario (Figure 7). Maximum ponding depths for all return periods were recorded. Observing these data reveals that ponding depth growth relative to return periods displays a nonlinear characteristic of “gentle at low return periods, accelerated at high return periods” (Figure 8).
To verify whether disturbances in model parameters would affect the simulation performance of rainfall simulations, we conducted sensitivity tests on two key parameters—Manning’s roughness coefficient and soil saturated hydraulic conductivity—for evaluating the model’s robustness: After perturbing the N-Imperv and N-perv parameters by ±20%, the maximum inundation area simulated for the 100-year return period rainstorm changed by 12–18%. The high-roughness temporary road areas showed higher sensitivity (18% change), while the excavated areas showed a 12% change, indicating that man-made structures are more sensitive to roughness. After perturbing the soil saturated hydraulic conductivity by ±20%, the runoff peak variation rate for the 50-year return period rainstorm ranged from 8% to 15%. The compacted soil areas, due to their low initial hydraulic conductivity, exhibited a 15% change, while the undisturbed areas showed an 8% change. This indicates that compacted soil areas are more sensitive than undisturbed areas, confirming the impact of construction compaction on infiltration. The results show that parameter fluctuations within a reasonable range will not alter the simulation trend, with no significant deviation in the simulation trend, thus demonstrating the robustness of the model.
To further quantitatively predict ponding depths and reveal ponding response mechanisms under different storm scenarios, we constructed a mathematical model based on maximum ponding depth data (1.51, 1.93, 2.50, 3.68, 6.32, and 8.56 m, respectively) to characterize the relationship between return period P and maximum ponding depth D.
When exploring the nonlinear relationship between waterlogging depth D and rainstorm return period P, the model derivation followed a progressive logic: from initial fitting to defect analysis, and then to correction and optimization. Initially, a pure power function D = aPb was used to fit the data, but significant prediction deviations were found under low return periods (P ≤ 20a), with the Nash-Sutcliffe Efficiency only 0.68. The root cause lies in our neglect of the “threshold effect” of temporary drainage facilities in the construction area—that is, when the return period corresponding to rainfall is P ≤ 2a, the on-site temporary pump station (rated flow 120 m3/h, served catchment area 0.8 km2) can quickly drain surface waterlogging within 3 h, significantly reducing the actual waterlogging depth. This leads to systematically overestimated predictions of the pure power function for low return periods.
To correct this defect, we decided to try introducing a drainage threshold term c, revising the model form to D = a(P + c)b, where c represents the “critical rainfall value at which drainage facilities start to function effectively.” Through on-site drainage capacity tests, it was found that the pump station can fully dominate the drainage process when the return period corresponding to rainfall is P ≤ 2a, so c = 2 was determined. The parameters were calibrated by the least squares method, obtaining a = 1.02 and b = 0.45, thus optimizing the power function model into a power function model with a constant term: D = 1.02(P + 2)0.45. Verification shows that the error of the optimized power function model is significantly reduced: the residual for the extremely low return period of 1a decreased from 0.36 m to 0.13 m, and the residual for the extremely high return period of 100a decreased from 0.82 m to 0.35 m. Errors for low return periods are controlled within 10%, and the consistency between the predicted value and the observed value for the high return period P = 100a reaches 99.4%.
The model can quickly output the maximum waterlogging depth under different return periods. Such quantitative prediction can provide a direct basis for the engineering party to pre-allocate drainage resources (e.g., determining the number of mobile pump stations and the scale of temporary drainage ditches), avoiding the blindness of judgment based solely on experience, and can also serve as a basis for hierarchical early warning.
To quantify the uncertainty of model predictions, a 95% confidence interval was calculated for the fitted power function relationship. The analysis reveals that the 95% confidence interval shows a “slowly expanding” trend as the return period increases: for low return periods (1–10 a), the half-width of the interval is ≤0.15 m; for the extreme return period (100 a), the half-width increases to 0.35 m. This indicates a slight rise in the uncertainty of waterlogging depth prediction under extreme rainstorms, yet the core law of the “power-law correlation between waterlogging depth and return period” remains stable. Although the prediction uncertainty of extreme events is relatively higher, the maximum half-width of the 95% confidence interval (0.35 m) accounts for only 4.1% of the corresponding predicted value (8.56 m), which demonstrates that the model has high robustness in predicting the trend of waterlogging depth. Statistical validation of the fitted model was conducted using the Nash-Sutcliffe Efficiency (NSE) and Kling-Gupta Efficiency (KGE) indices. The results show that NSE = 0.92 and KGE = 0.94, indicating a high degree of consistency between the predicted values and the simulated values. This verifies the high fitting accuracy of the power function model for the relationship between waterlogging depth and return period.
The mathematical model’s predictions show less than 10% overall deviation from coupled model simulations, outperforming the initial power function in practical applicability. This establishes a more reliable quantitative tool for construction-phase water safety management while laying groundwork for future research on construction activity-flood risk relationships. Developed with May 2025 terrain data, this threshold model suits mid-construction risk assessment. Future implementations should update parameters quarterly with real-time topographic data. For the rainstorm scenario with P > 100 a, it is necessary to couple the two-dimensional hydrodynamic model HEC-RAS 2D verification to avoid the extrapolation uncertainty of a single mathematical model.

3.3.2. Simulation Analysis of Ponding Under Real Rainfall During Construction

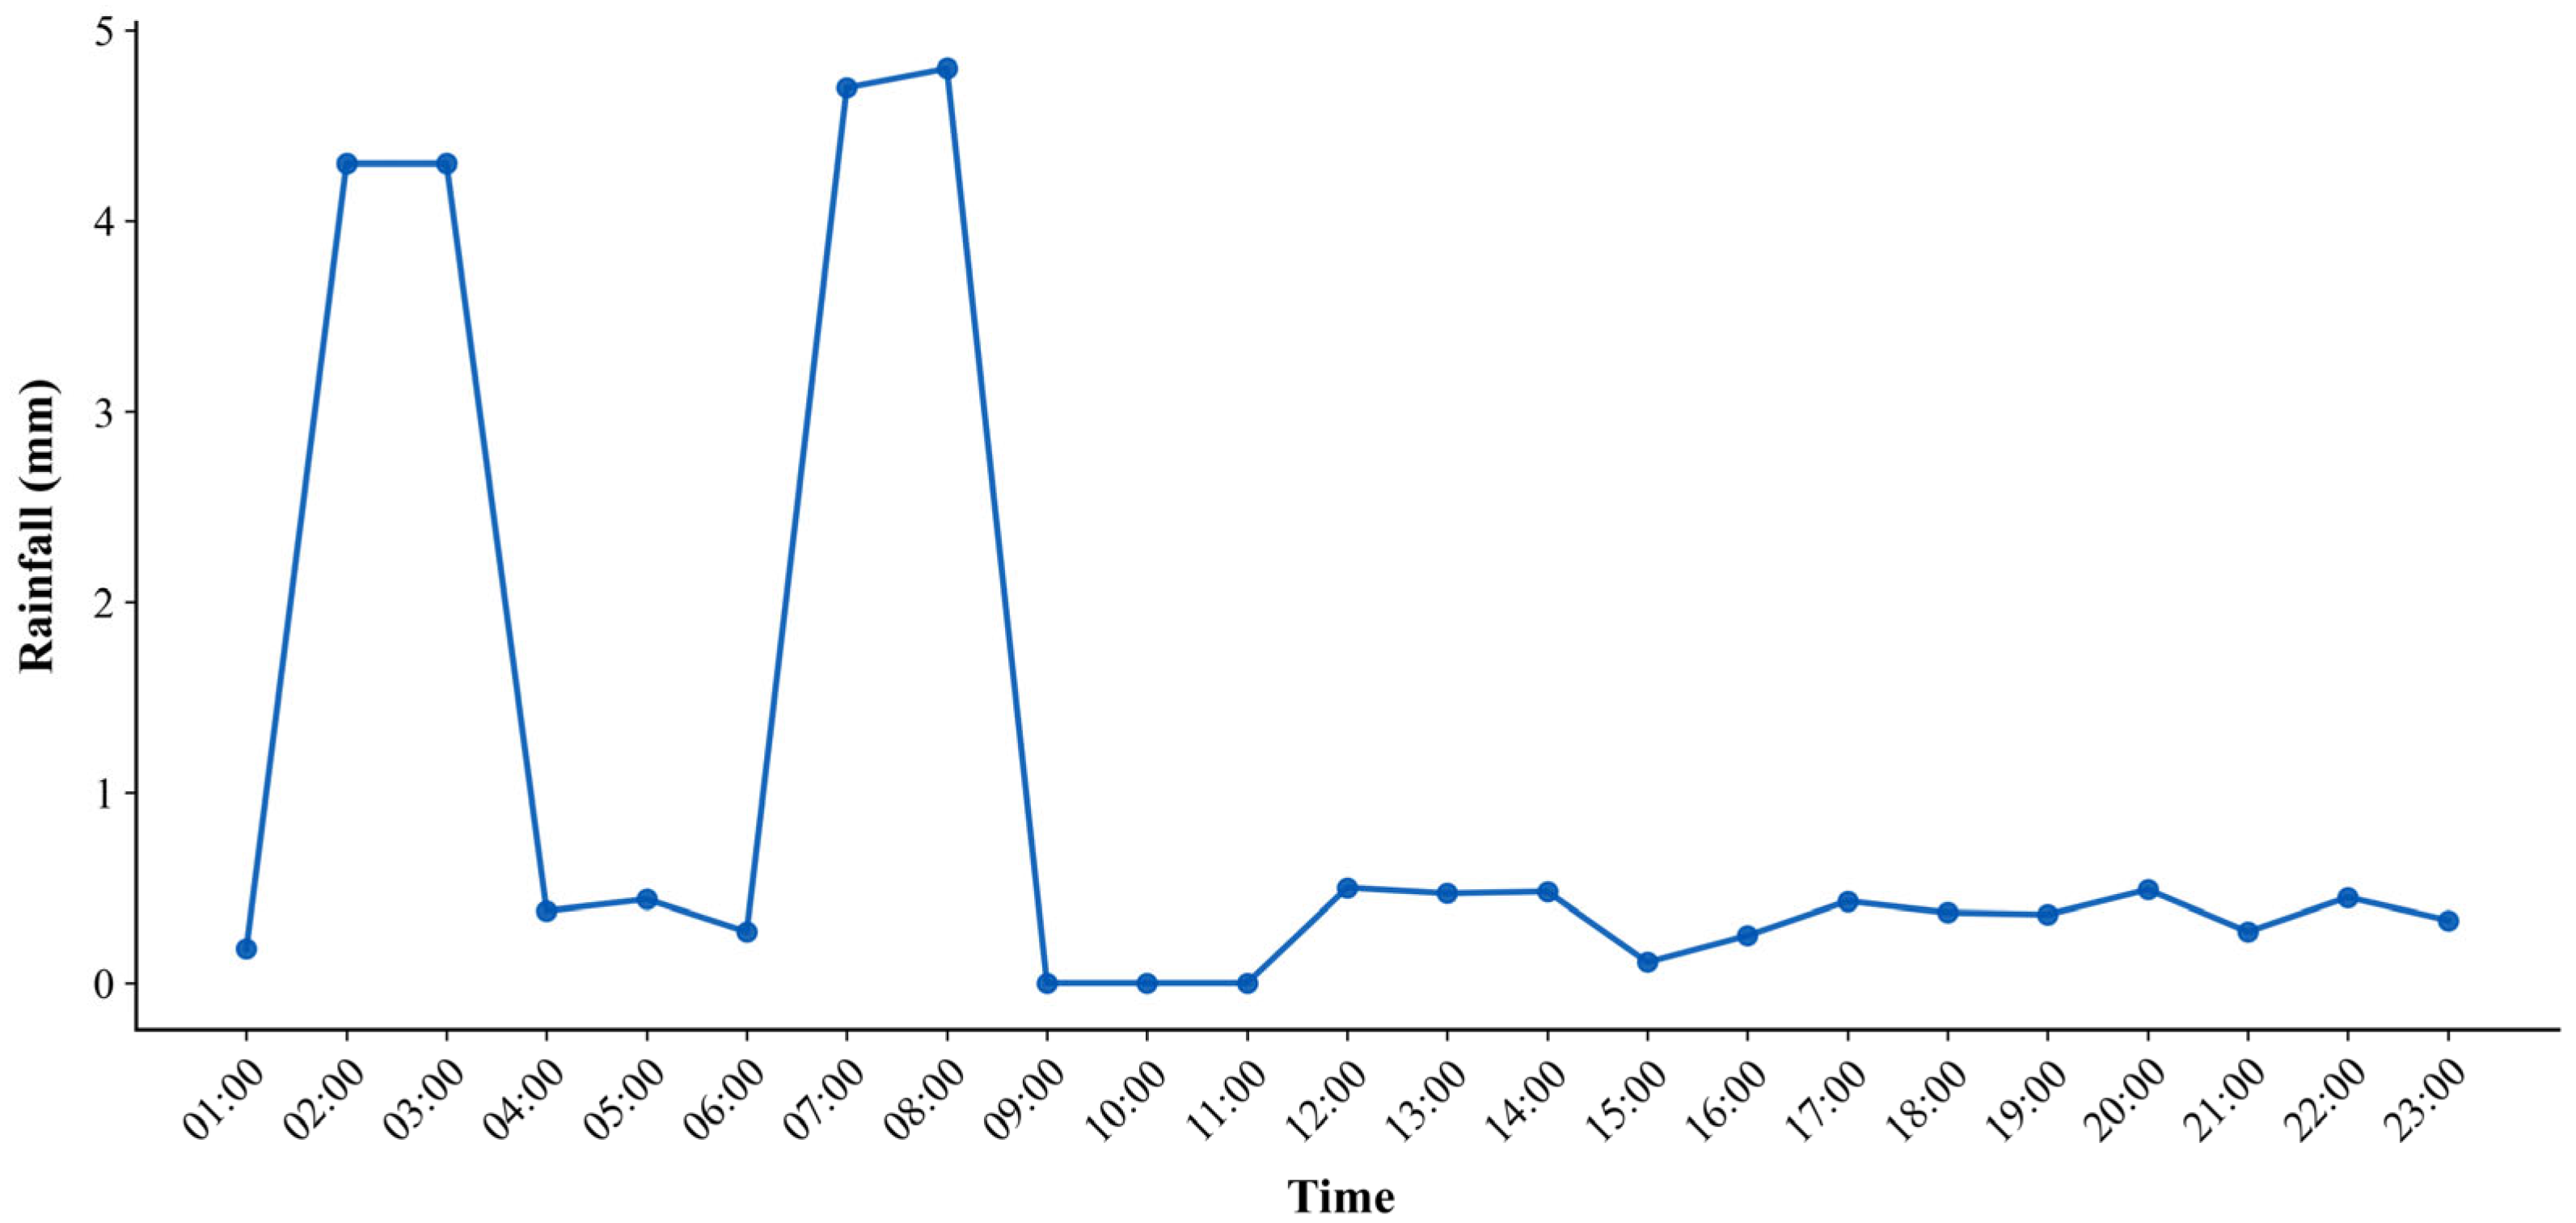
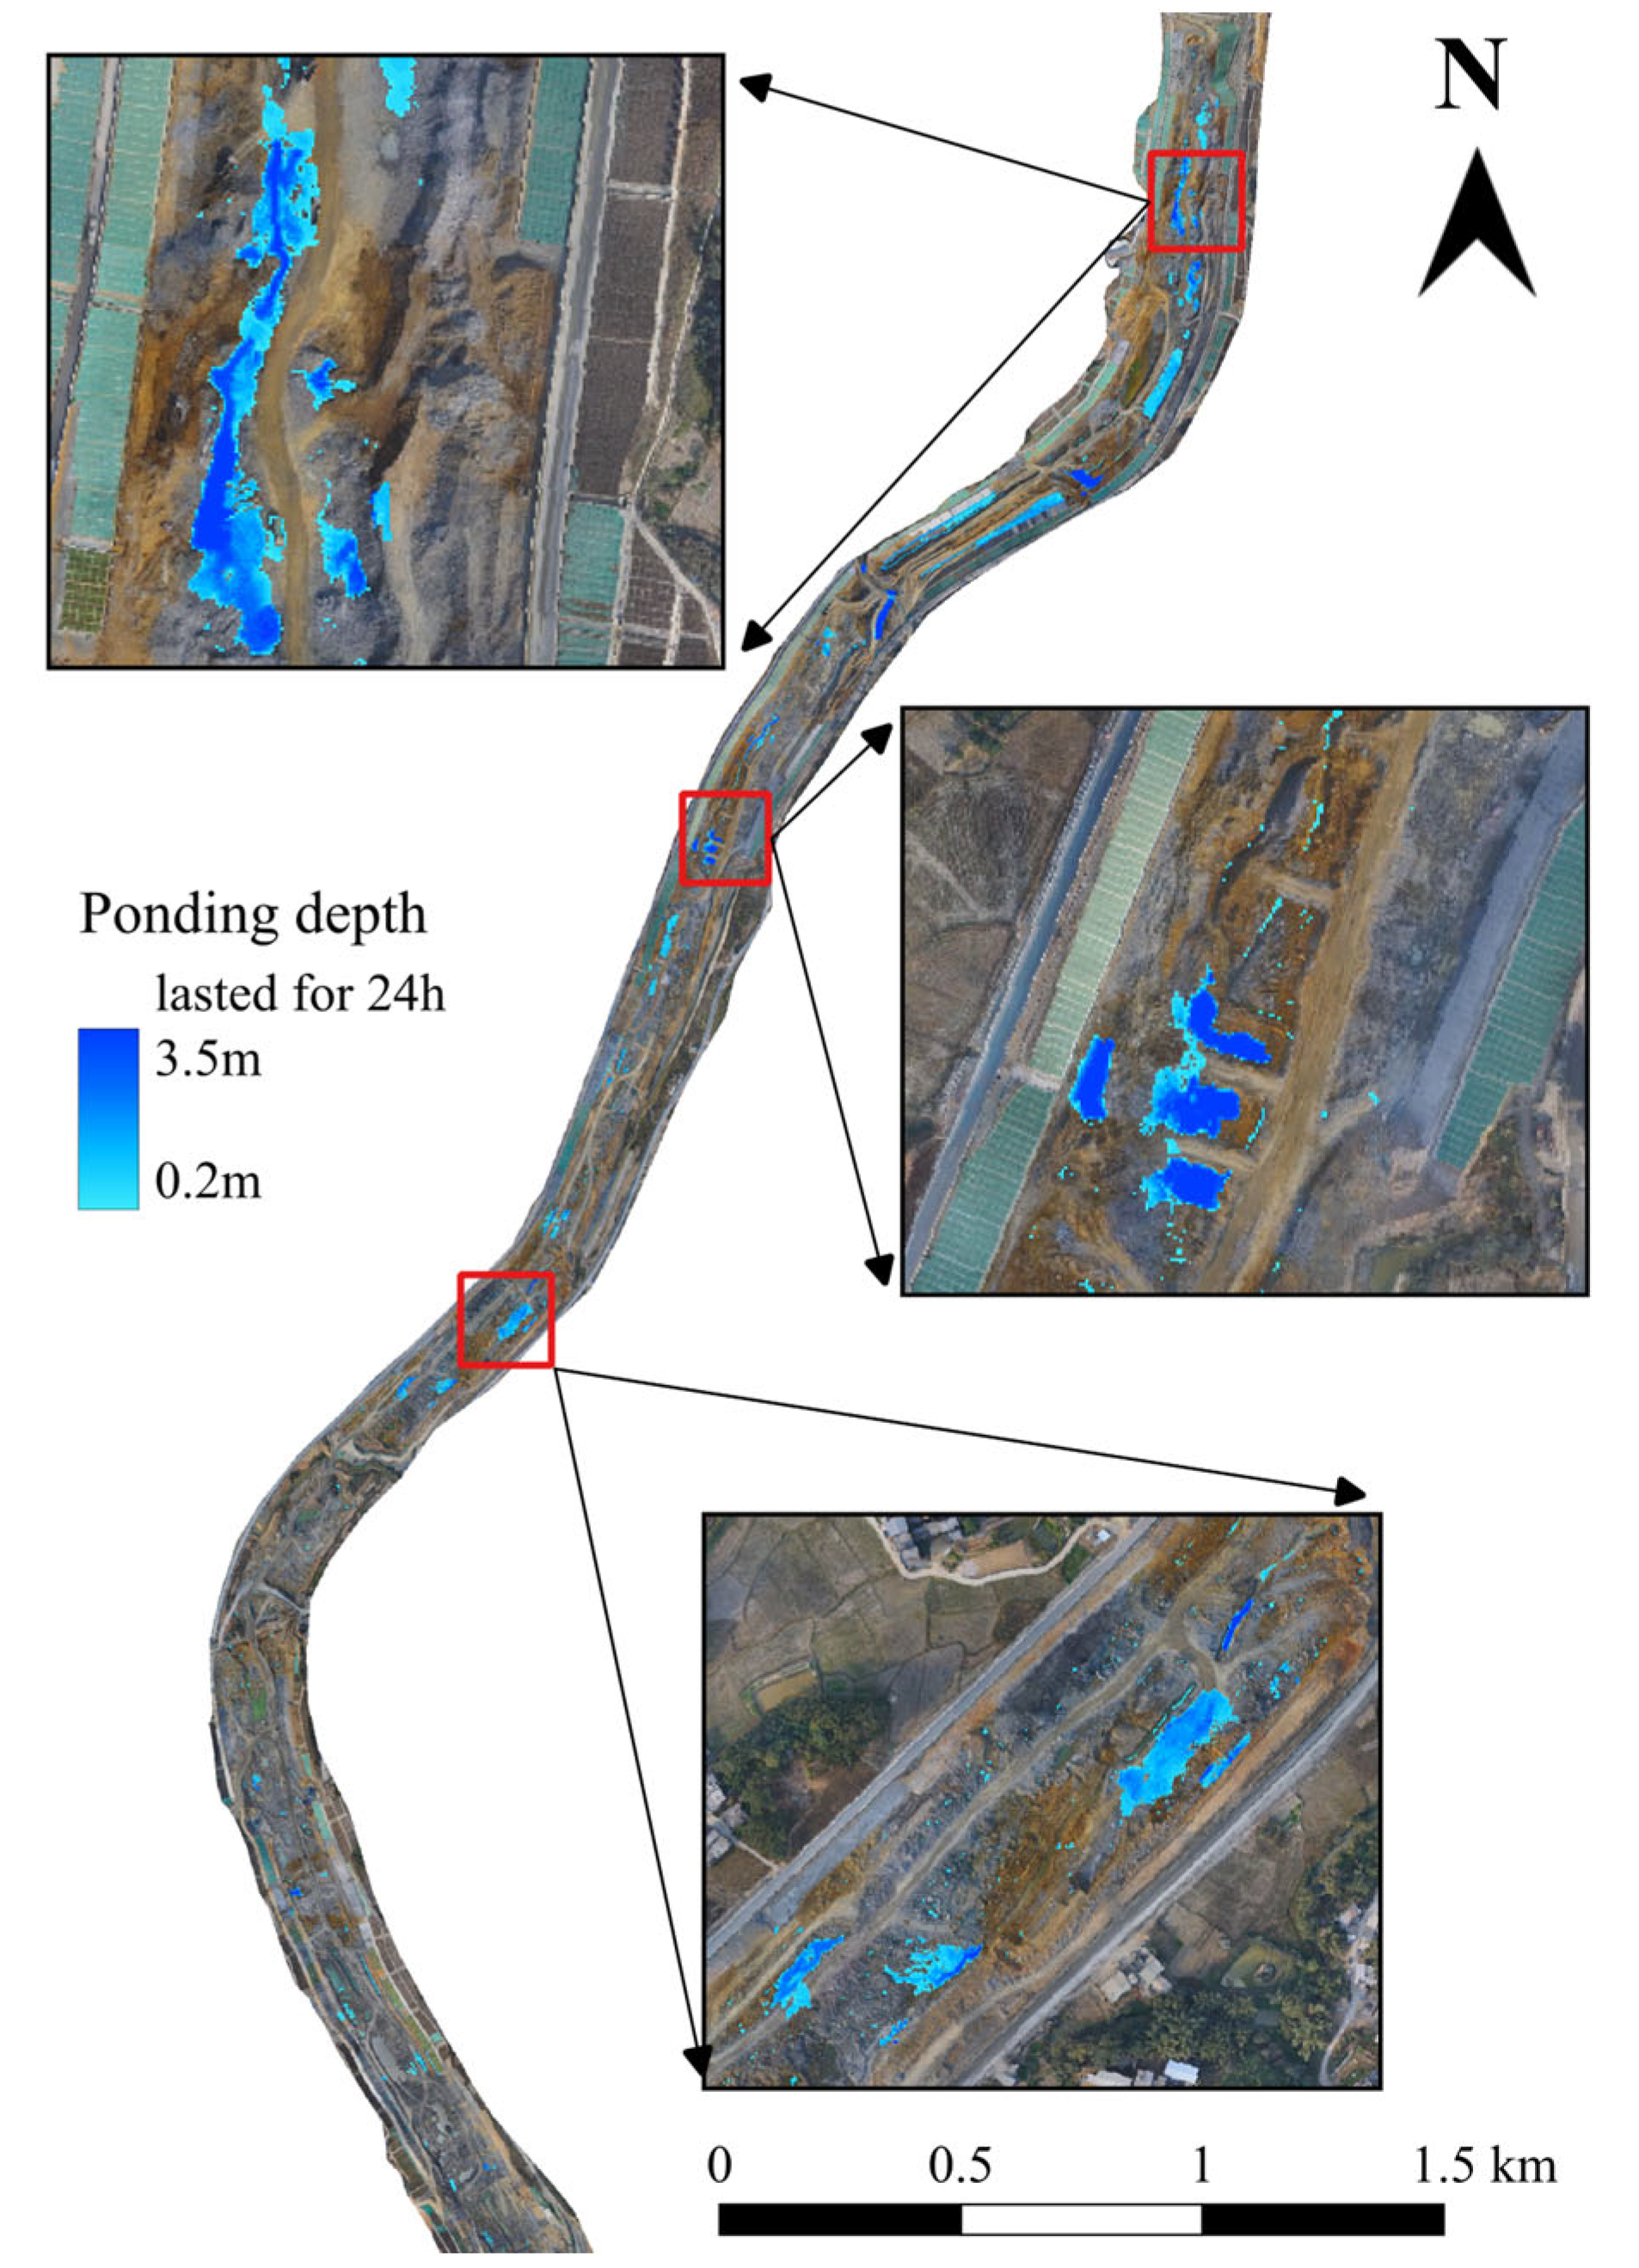
To evaluate the coupled model’s applicability in real rainfall scenarios and reliability under actual construction conditions, we selected the recent 10 May 2025 rainfall event in the study area (24-h cumulative rainfall: 24.8 mm, peak intensity: 4.8 mm/h, Figure 9) to drive SWMM-HEC-RAS 2D simulations. This event exhibited “intermittent heavy rainfall with multi-peak runoff” characteristics, featuring short-duration downpours of 4.3 mm/h (02:00–03:00) and 4.8 mm/h (07:00–08:00), which readily trigger localized ponding in construction zones.
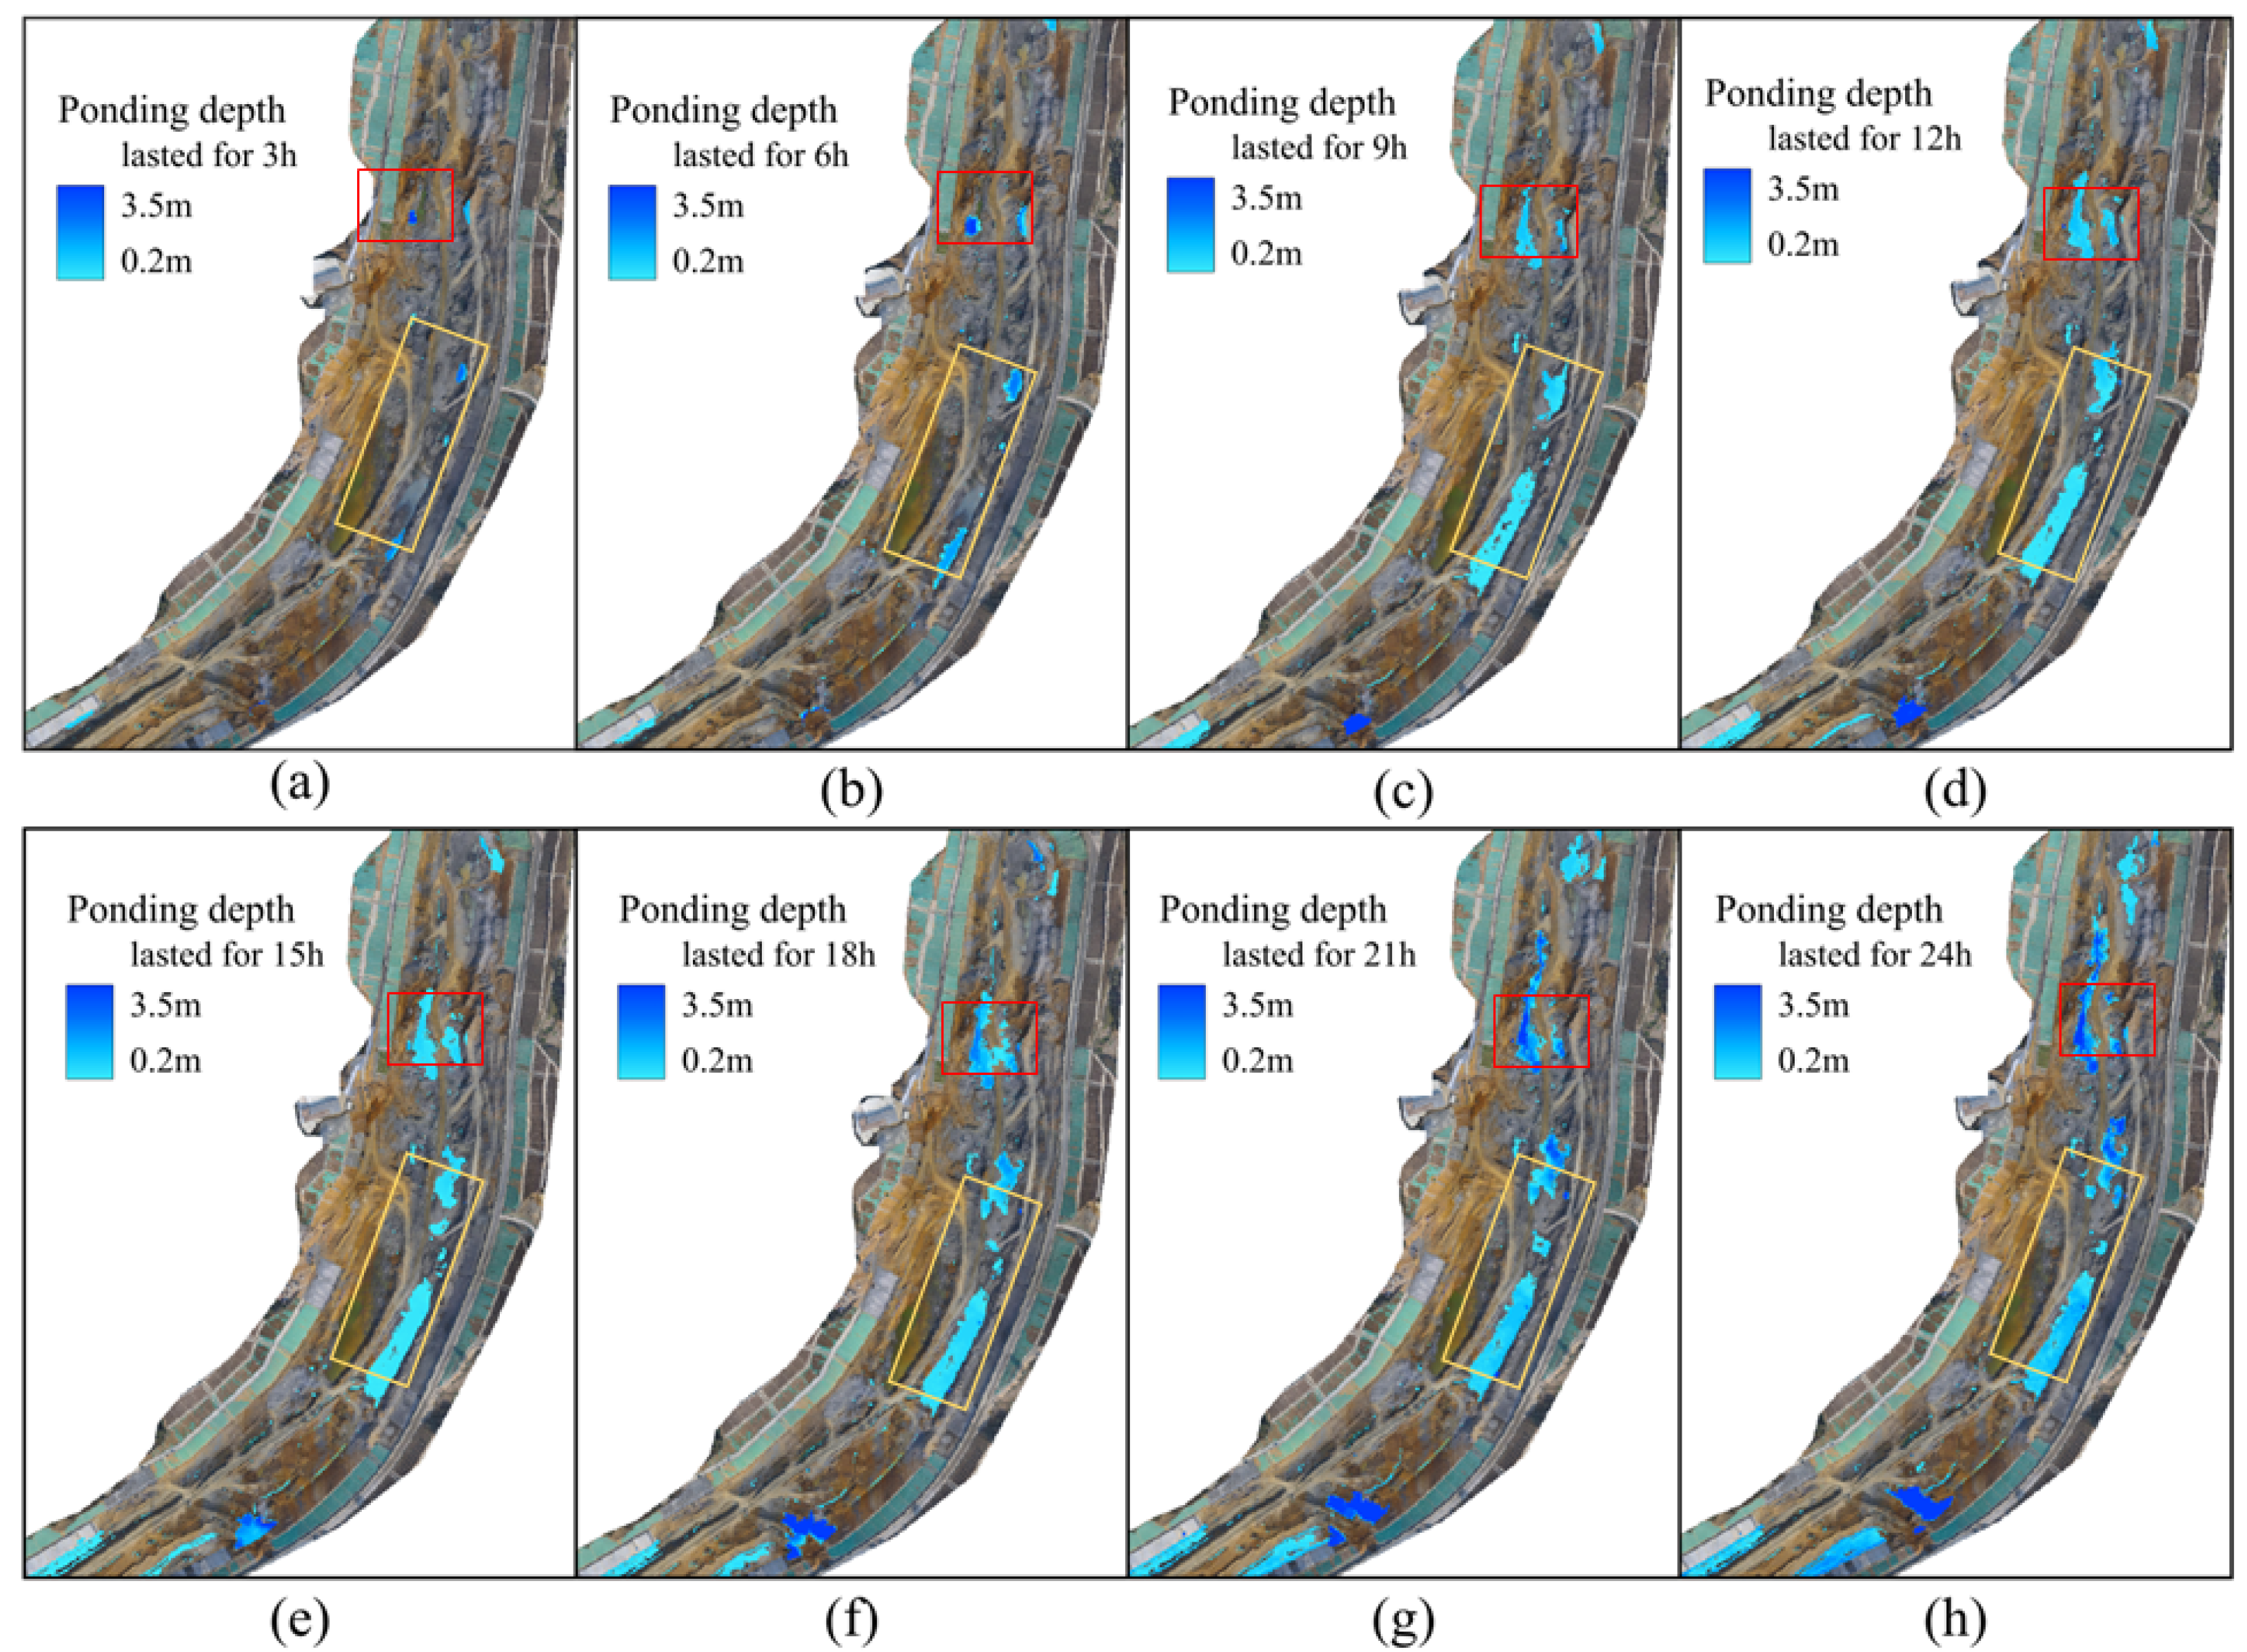
We analyzed the ponding evolution within the canal channel at three-hour intervals during this rainfall event (Figure 10). Results revealed that one hour after the initial heavy rainfall (3-h cumulative), ponding first emerged in the northwestern foundation pit cluster with an average depth of 0.8 m. As rainfall intensified during the second downpour phase, ponding expanded eastward to earthwork stockpile zones by 08:00, reaching 2.5 m depth at temporary road intersections and forming contiguous inundated areas. After nine cumulative hours, rainfall diminished and stabilized while soil permeability approached saturation, exhausting natural drainage capacity. From 12 to 24 h, both ponding depth and coverage exhibited persistent growth, necessitating proactive deployment of drainage infrastructure for timely clearance operations to minimize construction disruptions caused by water accumulation. Furthermore, we determined the return period of this rainfall event by back-calculation using the Guangxi rainstorm intensity formula (Equation (4)): based on the 24-h cumulative rainfall (24.8 mm) and peak intensity (4.8 mm/h, i.e., 0.08 mm/min), substitution into the formula yielded a corresponding return period of 1.5 years, which falls within the low-intensity range between the 1-year and 5-year return periods in design storm scenarios. This result verifies the simulation reliability of the coupled model under low-return-period rainfall—as it is consistent with the hydrological response patterns of the 1-year and 5-year design storms, further supporting the model’s predictive capability for typical rainfall-induced waterlogging in the construction area.
Figure 11 delineates the final ponding distribution during this rainfall event, visually revealing its spatiotemporal characteristics. Based on high-risk ponding concentration zones identified, targeted drainage planning and early warning strategies are proposed: Within the lowest foundation pit cluster (ponding epicenter), deploy mobile pumping stations with temporary steel drainage pipes, complemented by interception ditches along pit perimeters to channel water into the main canal. At temporary road intersection hotspots, install high-capacity pumps while excavating herringbone-shaped diversion channels connecting to the western diversion open channel. Along earthwork stockpile boundaries, construct annular drainage trenches with sump pits and submersible pumps at regular intervals. By concentrating pump deployment in peak ponding zones (depth ≥ 2 m) and reshaping terrain to form drainage corridors, recession time for similar rainfall events could be significantly reduced. This adaptive approach requires real-time coordination with the project’s BIM model to dynamically optimize facility placement in sync with construction progress.
For the proposed drainage measures mentioned above, we have also conducted an analysis of their costs and feasibility to ensure that there is practical support for the implementation of the drainage plan in this engineering project.
In terms of cost, targeting waterlogging-sensitive areas such as foundation pit groups (risk areas with water depth > 0.5 m) and temporary road intersections (waterlogging backwater areas) revealed by simulations, and combined with the dynamically updated construction progress of the Pinglu Canal based on the BIM model, a “graded response + dynamic adaptation” drainage plan is proposed: for low recurrence periods (≤10 years), “open ditches + small water pumps” are adopted; for medium recurrence periods (once in 10–50 years), mobile pump stations are activated; for high recurrence periods (≥once in 50 years), temporary steel drainage pipe networks are linked. We have quantified the costs based on local market and engineering data in 2025, as shown in Table 4.
The monthly budget of the construction section is based on 2025 cost data for a Pinglu Canal construction segment (≈4.8 million CNY). Costs include equipment deployment, operation and maintenance, and material loss.
In terms of the feasibility of the plan, we have fully demonstrated it from three perspectives: construction coordination, technical adaptation, and risk redundancy. Firstly, the layout of drainage facilities is dynamically linked with the construction BIM model, and the direction of the pipe network can be adjusted according to the weekly excavation progress to ensure the seamless connection of the “excavation–drainage–support” processes (field test verification shows that the response time for plan adjustment is <6 h). Secondly, the deployment time of mobile pump stations, including pipeline connection, is <4 h, which meets the time requirement of “heavy rainfall warning to emergency response”. Finally, the plan covers extreme events with a 100-year recurrence period and reserves 15% equipment redundancy, such as standby pump stations and emergency pipe reserves, to deal with uncertain factors such as “rainfall intensity exceeding expectations” and “sudden changes in the construction surface”.

4. Conclusions

This study successfully deciphered the waterlogging response mechanisms in the Pinglu Canal’s Lingshan construction section through a coupled SWMM-HEC-RAS 2D modeling framework. Our analyses reveal a distinct nonlinear progression: under low-return-period storms (1–20 years), ponding disperses sporadically in localized foundation pits, whereas high-return-period events (50–100 years) trigger contiguous inundation expanding toward drainage-vulnerable zones. The optimized power-function model quantitatively established return period-depth relationships with <10% prediction error. Validation against the 10 May 2025 rainfall event demonstrated exceptional agreement between simulated ponding evolution and construction logs, confirming model transferability to real-world conditions. Proposed drainage deployment strategy: it is characterized by targeted pump clustering at the hydraulic bottlenecks of the northwest foundation pit group and temporary intersections, as well as in the terrain-reshaped drainage corridors, including the herringbone diversion channels and annular ditches—which significantly shortens the recession time. According to the simulation of the rainfall event on 10 May 2025, the unoptimized baseline recession time for ponding with a depth of ≥0.2 m was 32 h. With the optimized strategy, the recession time in critical areas with a depth of ≥2 m was shortened to 13–21 h, a reduction of 35–60%. Specifically, the recession time of the northwest foundation pit group, identified as the epicenter of ponding, was reduced from 28 h to 11 h, verifying the effectiveness of this strategy in mitigating construction disruptions caused by long-term waterlogging. This provides actionable visual guidance for engineering decision-making, particularly regarding mobile pump allocation and temporary channel routing.
Despite the model’s effectiveness in simulating construction-induced waterlogging, several limitations should be noted. First, the topographic data rely on quarterly UAV-LiDAR updates, and drastic daily terrain changes during rapid excavation may introduce errors in dynamic construction phases. Second, simulations for extreme events exceeding the 100-year return period involve extrapolation uncertainty, requiring validation with on-site monitoring data to enhance reliability. Third, the current framework does not account for local flow obstruction by temporary structures, which could affect fine-scale waterlogging distribution; future work will integrate detailed BIM models to address this. These limitations provide directions for refining the model to better support complex hydraulic construction scenarios.
In future research, we will further enhance the model’s dynamic adaptability and engineering linkage: (1). Real-time terrain-engineering synchronization—UAV-LiDAR and BIM progress data will continuously update topographic parameters and drainage infrastructure status, enabling stage-specific model calibration throughout construction phases. (2). Closed-loop drainage response systems—embedding dynamic parameters will forge predictive flood-facility coordination mechanisms, transforming passive simulation into proactive intervention. (3). Extreme scenario validation framework—multi-source verification will prioritize the SSP5-8.5 climate scenario and complex construction disturbances, with a particular focus on assessing the compound flood risks when typhoons coincide with earthwork operations. SSP5-8.5 is a high-emission scenario in the IPCC AR6, which focuses on extreme climate risks under unmitigated greenhouse gas emissions. This scenario emphasizes the potential intensification of extreme rainfall events, which is crucial for evaluating future waterlogging risks during the operation phase of the Pinglu Canal. (4). watershed-scale application—methodology extension to the entire Pinglu Canal will integrate basin-scale hydrologic modeling, systematically evaluating long-term impacts of linear infrastructure construction on regional water cycles. This cross-scale approach will establish a replicable technical framework for hydraulic safety management in mega-linear projects globally.

Author Contributions

All authors contributed to the study conception and design. Conceptualization, J.L. and J.F.; methodology, J.F.; software, Y.Z.; validation, J.L., J.F. and Q.W.; formal analysis, J.L. and J.F.; investigation, J.F. and Y.Z.; writing—original draft preparation, J.F.; writing—review and editing, J.L. and Q.W.; visualization, Y.Z.; funding acquisition, Q.W. All authors have read and agreed to the published version of the manuscript.

Funding

This work was supported by the Guangxi Young and Middle-aged Teachers’ Basic Scientific Research Ability Improvement Project under Grant No. 2024KY0281; This work was supported by the Guangxi Key Laboratory of Spatial Information and Geomatics Program under Grant No. 21-238-21-24; This work was supported by the Guilin University of Technology Research Development Fund under Grant No. RD2300151852; This work was supported by the Qingmiao Talent Research Project Funding. Author Qingyang Wang has received research support from the Qingmiao Talent Research Project.

Data Availability Statement

The data presented in this study are available on request from the corresponding author due to the data involve Guangxi Pinglu Canal, a national strategic inland waterway engineering project, including sensitive construction-phase topographic parameters, engineering technical indicators, and on-site monitoring data. These data are related to the project’s construction safety and national strategic infrastructure information, and their public release is restricted in accordance with the management regulations of national key engineering projects.

Conflicts of Interest

The authors declare no conflicts of interest.

References

  1. Guangxi Zhuang Autonomous Region People’s Government. Press Conference on “Guangxi Accelerating the Construction of Major Infrastructure and Building the Pinglu Canal with High Standards and Quality”. Available online: http://www.gxzf.gov.cn/zt/xwfb/wssthjbh0728_211489/dt/t18583470.shtml (accessed on 20 June 2024).
  2. Zhang, X.; Qiao, W.; Xiao, Y.; Lu, Y. Analysis of Regional Flooding in the Urbanization Expansion Process Based on the SWMM Model. Nat. Hazards 2023, 117, 1349–1363. [Google Scholar] [CrossRef]
  3. Dasallas, L.; An, H.; Lee, S. Developing an Integrated Multiscale Rainfall-Runoff and Inundation Model: Application to an Extreme Rainfall Event in Marikina-Pasig River Basin, Philippines. J. Hydrol. Reg. Stud. 2022, 39, 100995. [Google Scholar] [CrossRef]
  4. Rajib, A.; Golden, H.E.; Lane, C.R.; Wu, Q. Surface Depression and Wetland Water Storage Improves Major River Basin Hydrologic Predictions. Water Resour. Res. 2020, 56, e2019WR026561. [Google Scholar] [CrossRef]
  5. Cheng, X.; Ma, X.; Wang, W.; Xiao, Y.; Wang, Q.; Liu, X. Application of HEC-HMS Parameter Regionalization in Small Watershed of Hilly Area. Water Resour. Manag. 2021, 35, 1961–1976. [Google Scholar] [CrossRef]
  6. Lv, P.; Kong, L.; Chuo, R.; Liu, H.; Cai, S.; Zhao, M. Application of One-Dimensional Hydrodynamic Coupling Model in Complex River Channels: Taking the Yongding River as an Example. Water 2024, 16, 1161. [Google Scholar] [CrossRef]
  7. Rossman, L.A. Storm Water Management Model User’s Manual, Version 5.0; National Risk Management Research Laboratory, Office of Research and Development, US Environmental Protection Agency: Cincinnati, OH, USA, 2010.
  8. Zhao, W.J.; Sun, W.; Li, Z.L.; Fan, Y.W.; Song, J.S.; Wang, L.R. A Review on SWAT Model for Stream Flow Simulation. Adv. Mater. Res. 2013, 726–731, 3792–3798. [Google Scholar] [CrossRef]
  9. Nasiri, S.; Ansari, H.; Ziaei, A.N. Simulation of Water Balance Equation Components Using SWAT Model in Samalqan Watershed (Iran). Arab. J. Geosci. 2020, 13, 421. [Google Scholar] [CrossRef]
  10. Beven, K.J.; Kirkby, M.J. A Physically Based, Variable Contributing Area Model of Basin Hydrology/Un Modèle à Base Physique de Zone d’Appel Variable de l’Hydrologie Du Bassin Versant. Hydrol. Sci. Bull. 1979, 24, 43–69. [Google Scholar] [CrossRef]
  11. Beven, K.J.; Kirkby, M.J.; Freer, J.E.; Lamb, R. A History of TOPMODEL. Hydrol. Earth Syst. Sci. 2021, 25, 527–549. [Google Scholar] [CrossRef]
  12. Goudarzi, S.; Milledge, D.; Holden, J. A Generalized Multistep Dynamic (GMD) TOPMODEL. Water Resour. Res. 2023, 59, e2022WR032198. [Google Scholar] [CrossRef]
  13. Li, Z.; Xin, P.; Tang, J. Study of the Xinanjiang Model Parameter Calibration. J. Hydrol. Eng. 2013, 18, 1513–1521. [Google Scholar] [CrossRef]
  14. Zhao, R.J. The Xinanjiang Model Applied in China. J. Hydrol. 1992, 135, 371–381. [Google Scholar] [CrossRef]
  15. Zang, S.; Li, Z.; Zhang, K.; Yao, C.; Liu, Z.; Wang, J.; Huang, Y.; Wang, S. Improving the Flood Prediction Capability of the Xin’anjiang Model by Formulating a New Physics-Based Routing Framework and a Key Routing Parameter Estimation Method. J. Hydrol. 2021, 603, 126867. [Google Scholar] [CrossRef]
  16. Patel, D.P.; Ramirez, J.A.; Srivastava, P.K.; Bray, M.; Han, D. Assessment of Flood Inundation Mapping of Surat City by Coupled 1D/2D Hydrodynamic Modeling: A Case Application of the New HEC-RAS 5. Nat. Hazards 2017, 89, 93–130. [Google Scholar] [CrossRef]
  17. Arash, A.M.; Yasi, M. The Assessment for Selection and Correction of RS -Based DEMs and 1D and 2D HEC-RAS Models for Flood Mapping in Different River Types. J. Flood Risk Manag. 2022, 16, e12871. [Google Scholar] [CrossRef]
  18. Dahal, V.; Kunwar, S.; Bhandari, S.; Chaudhary, S.; Gautam, S.; Bhatt, N.; Regmi, R.K. Analyzing Sedimentation Patterns in the Naumure Multipurpose Project (NMP) Reservoir Using 1D HEC-RAS Modeling. Sci. Rep. 2024, 14, 22134. [Google Scholar] [CrossRef]
  19. Panda, R.K.; Pramanik, N.; Bala, B. Simulation of River Stage Using Artificial Neural Network and MIKE 11 Hydrodynamic Model. Comput. Geosci. 2010, 36, 735–745. [Google Scholar] [CrossRef]
  20. Zhang, K.; Li, Q.; Zhang, J.; Shi, H.; Yu, J.; Guo, X.; Du, Y. Simulation and Analysis of Back Siltation in a Navigation Channel Using MIKE 21. J. Ocean. Univ. China 2022, 21, 893–902. [Google Scholar] [CrossRef]
  21. Ghosh, A.; Suara, K.; McCue, S.W.; Yu, Y.; Soomere, T.; Brown, R.J. Persistency of Debris Accumulation in Tidal Estuaries Using Lagrangian Coherent Structures. Sci. Total Environ. 2021, 781, 146808. [Google Scholar] [CrossRef]
  22. Sharifian, M.K.; Kesserwani, G.; Chowdhury, A.A.; Neal, J.; Bates, P. LISFLOOD-FP 8.1: New GPU-Accelerated Solvers for Faster Fluvial/Pluvial Flood Simulations. Geosci. Model Dev. 2023, 16, 2391–2413. [Google Scholar] [CrossRef]
  23. Wilson, M.D.; Coulthard, T.J. Tracing and Visualisation of Contributing Water Sources in the LISFLOOD-FP Model of Flood Inundation (within CAESAR-Lisflood Version 1.9j-WS). Geosci. Model Dev. 2023, 16, 2415–2436. [Google Scholar] [CrossRef]
  24. Zhou, L.; Liu, L. Enhancing Dynamic Flood Risk Assessment and Zoning Using a Coupled Hydrological-Hydrodynamic Model and Spatiotemporal Information Weighting Method. J. Environ. Manag. 2024, 366, 121831. [Google Scholar] [CrossRef]
  25. Chen, W.; Wu, H.; Kimball, J.S.; Alfieri, L.; Nanding, N.; Li, Y.; Jiang, L.; Wu, W.; Tao, Y.; Zhao, S.; et al. A Coupled River Basin-Urban Hydrological Model (DRIVE-Urban) for Real-Time Urban Flood Modeling. Water Resour. Res. 2022, 58, e2021WR031709. [Google Scholar] [CrossRef]
  26. Cheng, S.; Yang, M.; Li, C.; Xu, H.; Chen, C.; Shu, D.; Jiang, Y.; Gui, Y.; Dong, N. An Improved Coupled Hydrologic-Hydrodynamic Model for Urban Flood Simulations under Varied Scenarios. Water Resour. Manag. 2024, 38, 5523–5539. [Google Scholar] [CrossRef]
  27. Anand, J.; Gosain, A.K.; Khosa, R. Hydrological and Hydrodynamic Modelling for Flood Management: A Case Study of the Yamuna River Basin in Delhi. J. Hydrol. Reg. Stud. 2024, 56, 101960. [Google Scholar] [CrossRef]
  28. Gironás, J.; Roesner, L.A.; Rossman, L.A.; Davis, J. A New Applications Manual for the Storm Water Management Model (SWMM). Environ. Model. Softw. 2010, 25, 813–814. [Google Scholar] [CrossRef]
  29. Peng, Z.; Lin, X.; Simon, M.; Niu, N. Unit and Regression Tests of Scientific Software: A Study on SWMM. J. Comput. Sci. 2021, 53, 101347. [Google Scholar] [CrossRef]
  30. Amerinia, S. Assessment of Low-Impact Development Practices on Stormwater Management Using SWMM 5.2: A Case Study of Shiraz, Iran; Memorial University of Newfoundland: St. John’s, NL, Canada, 2023. [Google Scholar] [CrossRef]
  31. Yao, Y.; Hu, C.; Liu, C.; Yang, F.; Ma, B.; Wu, Q.; Li, X.; Soomro, S. Comprehensive Performance Evaluation of Stormwater Management Measures for Sponge City Construction: A Case Study in Gui’an New District, China. J. Flood Risk Manag. 2022, 15, e12834. [Google Scholar] [CrossRef]
  32. Zhang, X.; Qiao, W.; Huang, J.; Li, H.; Wang, X. Impact and Analysis of Urban Water System Connectivity Project on Regional Water Environment Based on Storm Water Management Model (SWMM). J. Clean. Prod. 2023, 423, 138840. [Google Scholar] [CrossRef]
  33. Brunner, G.W. HEC-Ras River Analysis System: User’s Manual; US Army Corps of Engineers, Hydrologic Engineering Center: Davis, CA, USA, 2021. [Google Scholar]
  34. Quirogaa, V.M.; Kurea, S.; Udoa, K.; Manoa, A. Application of 2D Numerical Simulation for the Analysis of the February 2014 Bolivian Amazonia Flood: Application of the New HEC-RAS Version 5. Ribagua 2016, 3, 25–33. [Google Scholar] [CrossRef]
  35. Tamiru, H.; Dinka, M.O. Application of ANN and HEC-RAS Model for Flood Inundation Mapping in Lower Baro Akobo River Basin, Ethiopia. J. Hydrol. Reg. Stud. 2021, 36, 100855. [Google Scholar] [CrossRef]
  36. Bates, P.D. Integrating Remote Sensing Data with Flood Inundation Models: How Far Have We Got? Hydrol. Process. 2012, 26, 2515–2521. [Google Scholar] [CrossRef]
  37. Brown, I.W.; McDougall, K.; Alam, M.J.; Chowdhury, R.; Chadalavada, S. Calibration of a Continuous Hydrologic Simulation Model in the Urban Gowrie Creek Catchment in Toowoomba, Australia. J. Hydrol. Reg. Stud. 2022, 40, 101021. [Google Scholar] [CrossRef]
  38. Wang, T.; Zhang, L.; Zhai, J.; Wang, L.; Zhao, Y.; Liu, K. Automatic Calibration of SWMM Parameters Based on Multi-Objective Optimisation Model. J. Hydroinformatics 2024, 26, 683–706. [Google Scholar] [CrossRef]
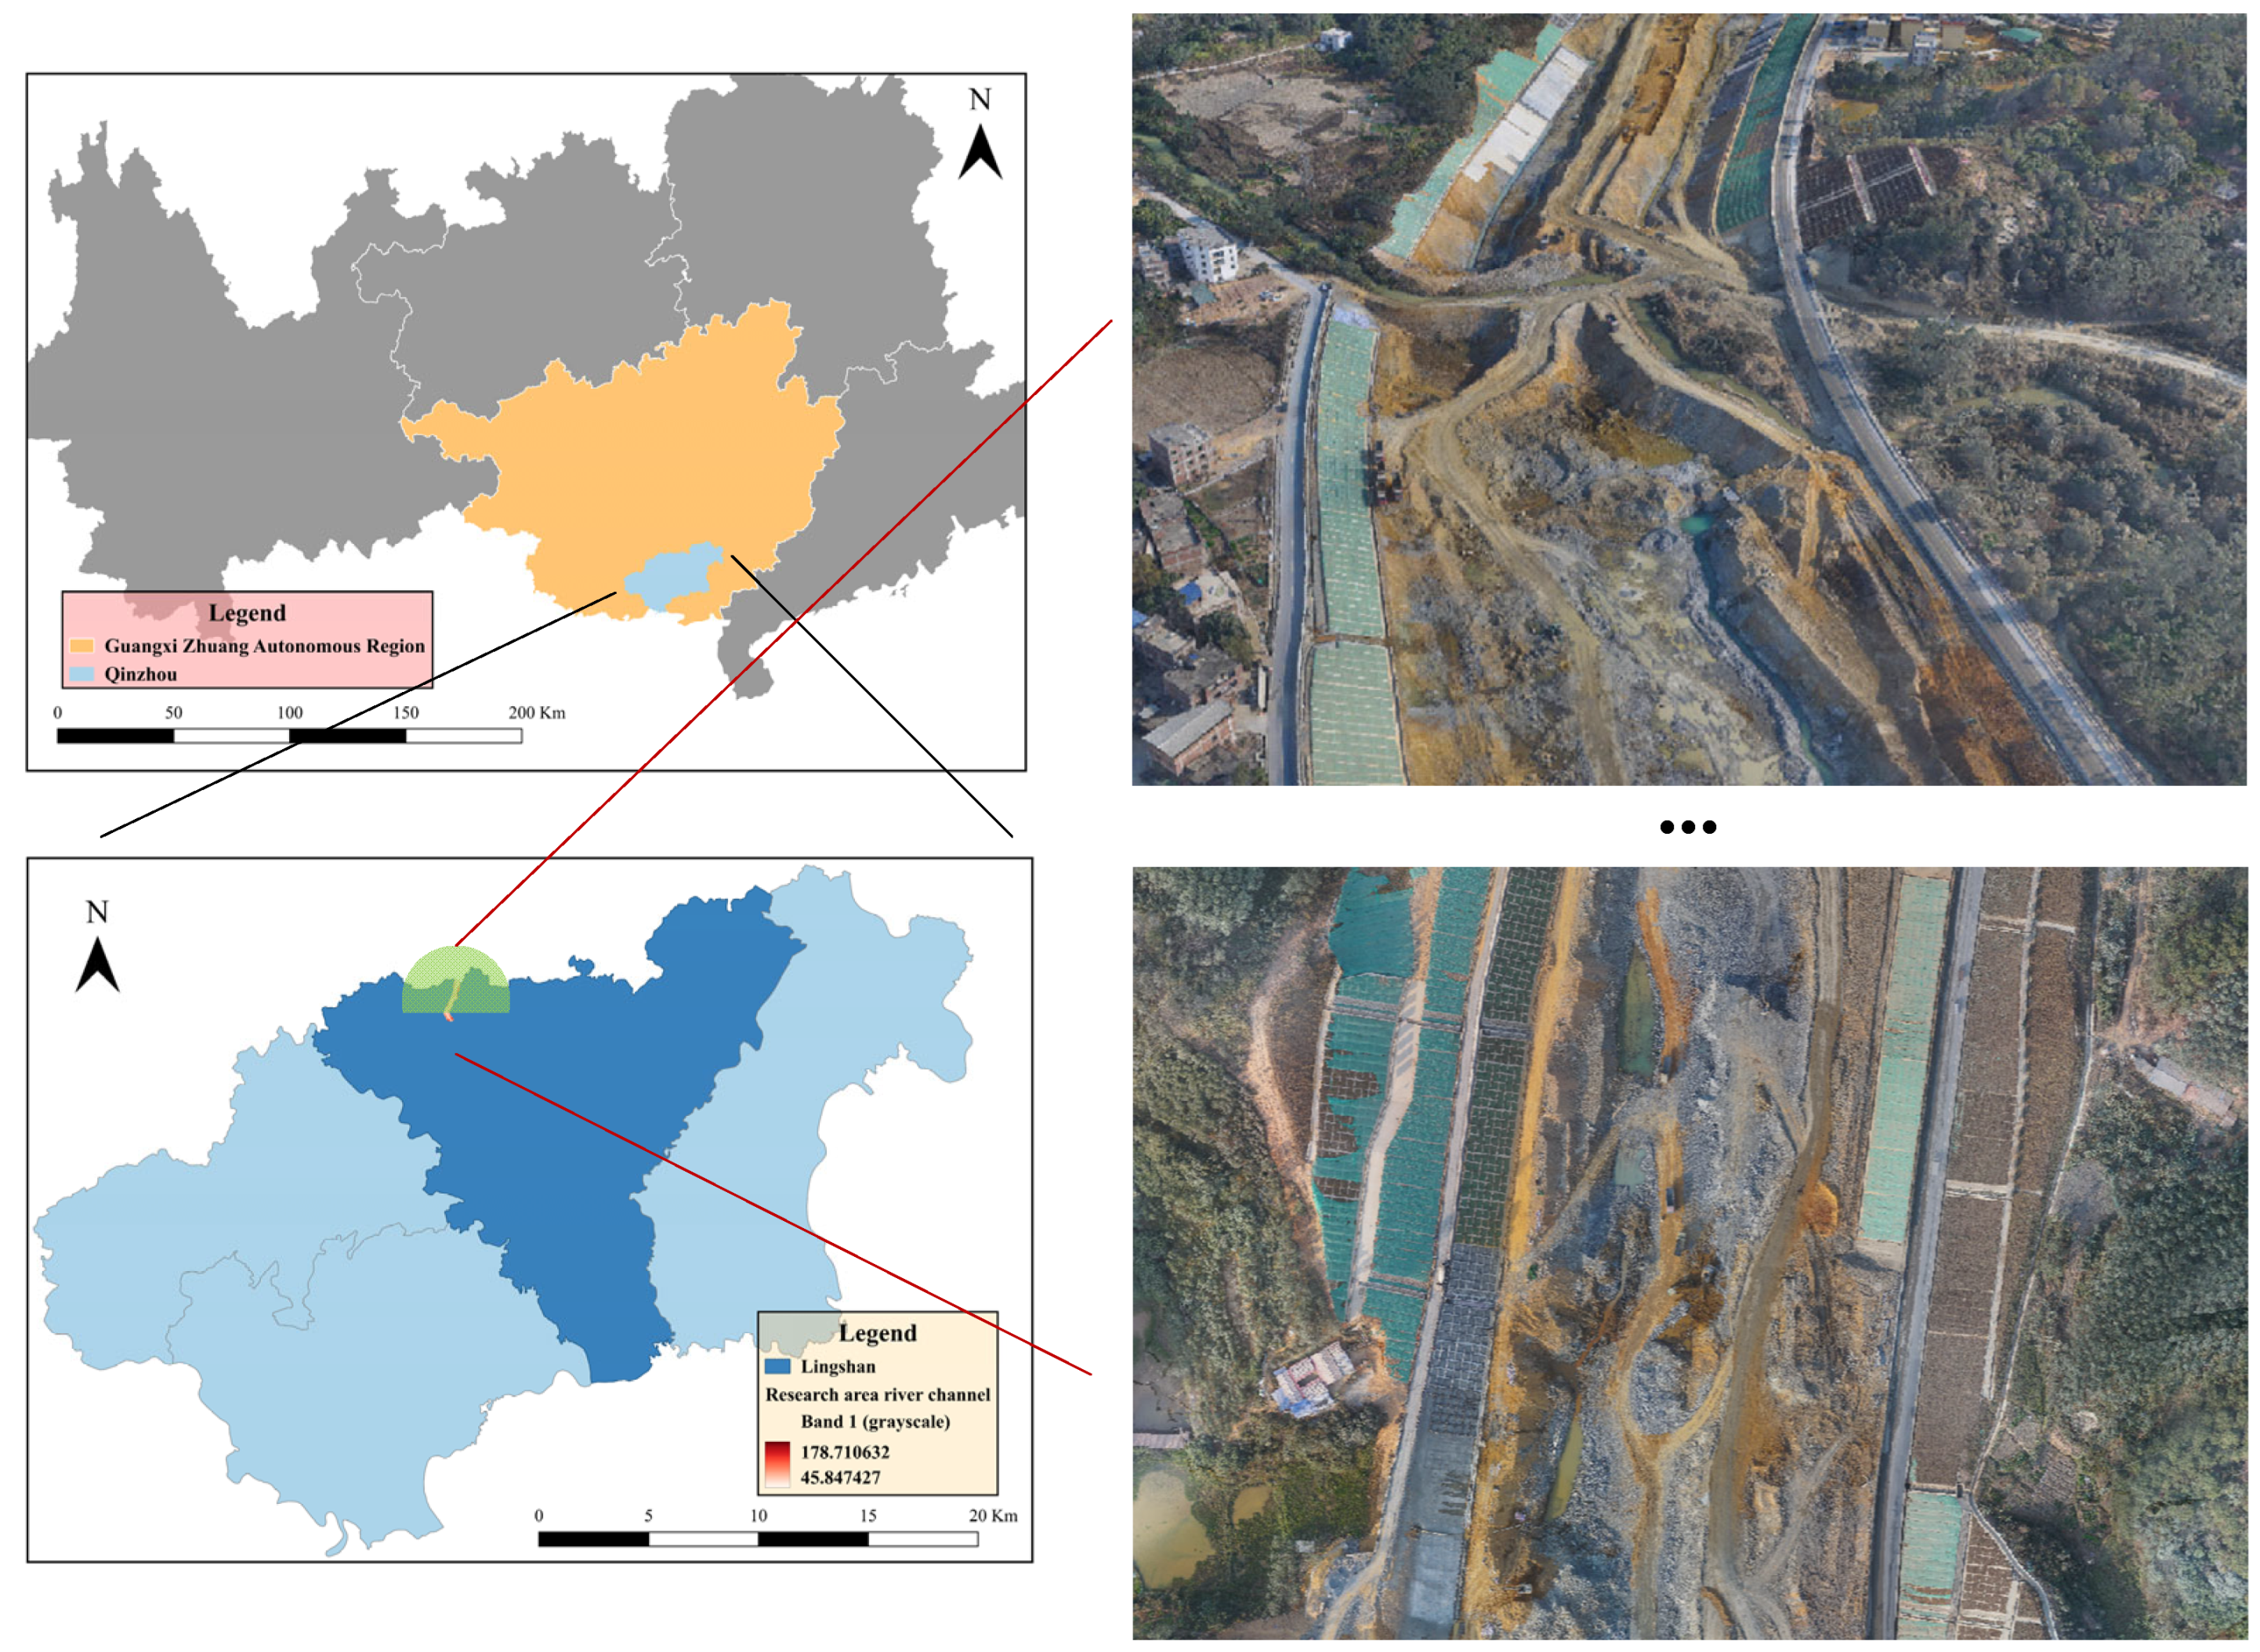
Figure 1. Schematic of the study area in the Lingshan section of Pinglu Canal (108°52′15″ E–108°56′30″ E, 22°18′00″ N–22°21′45″ N). The 8-km channel trends northwest–southeast, with construction-induced 5–11 m excavation trenches and 3–5 m earthwork stockpiles, providing topographic input for the model.
Water 17 02415 g001
Figure 2. 10-cm resolution DEM of the study area (UAV-LiDAR, May 2025). Covering 20 km2, the data show construction topography for HEC-RAS 2D mesh generation. Colors indicate elevation gradients: yellow represents low-lying canal channels and excavation zones, green denotes transitional slopes, red refers to upland hills, and gray stands for peripheral highlands or data boundaries.
Water 17 02415 g002
Figure 3. SWMM model validation for the 7 May 2025 rainfall event. Sub-catchment division and runoff simulation agree with field data, verifying applicability under construction topography.
Water 17 02415 g003
Figure 4. Coupling framework of SWMM-HEC-RAS 2D, showing data interaction processes. Schematic diagram illustrating the cross-scale coupling logic, clarifying the technical approach. Data synchronization is achieved through Python middleware: first, SWMM’s 5-min runoff hydrographs are upscaled to 1-min intervals via linear interpolation for HEC-RAS 2D, while HEC-RAS 2D’s 1-min inundation depths are downscaled to 5-min averages for SWMM’s surface roughness updates, ensuring computational efficiency; second, the subcatchment runoff is converted into boundary flow per unit length; finally, mass balance is maintained by controlling the difference between inflow and storage change within 5%.
Water 17 02415 g004
Figure 5. HEC-RAS 2D computational mesh (unstructured) and boundary conditions, with elevation-gradient colors (yellow: low-lying canal channels/excavation zones; green: transitional slopes; red: upland hills; gray: peripheral highlands/data boundaries). SWMM-derived flows drive 2D hydrodynamic simulation of ponding spatiotemporal distribution.
Water 17 02415 g005
Figure 6. Design storm processes for different return periods (1a, 5a, 10a, 20a, 50a, 100a) constructed based on the Guangxi storm intensity formula. (a) shows the cumulative rainfall process within 120 min for each return period, and (b) shows the rainfall intensity-duration curve.
Water 17 02415 g006
Figure 7. Simulated spatial distributions of ponding depth in the construction area under design storms with different return periods. The background terrain (DEM) uses elevation—gradient colors: yellow denotes low—lying canal channels and excavation zones, green indicates transitional slopes, red represents upland hills, and gray stands for peripheral highlands or data boundaries. Panels (af) correspond to ponding conditions after 60 min of 1a, 5a, 10a, 20a, 50a, and 100a return period storms, respectively. The gradient from light to dark colors represents ponding depth increasing from 0.2 m to 10 m.
Water 17 02415 g007
Figure 8. Nonlinear relationship curve between ponding depth and storm return period.
Water 17 02415 g008
Figure 9. Hourly rainfall process line for the actual rainfall event on 10 May 2025. The event had a 24-h cumulative rainfall of 24.8 mm and a peak intensity of 4.8 mm/h.
Water 17 02415 g009
Figure 10. Evolution of ponding in the canal channel during the actual rainfall event. Panels (ah) show the distribution of ponding depth at 3, 6, 9, 12, 15, 18, 21, and 24 h of continuous rainfall, respectively. The red bounding box denotes the Northwest foundation pit cluster (the initial waterlogging zone, where ponding first emerged), and the yellow bounding box indicates the Temporary Road junction (a critical convergence node, with peak ponding depth observed during the event).
Water 17 02415 g010
Figure 11. Final distribution of ponding after 24 h of the actual rainfall event. The figure shows that ponding is mainly concentrated in the northwestern foundation pit cluster (ponding epicenter), temporary road intersections, and areas surrounding earthwork stockpiles, with depths ranging from 0.2 to 3.5 m.
Water 17 02415 g011
Table 1. Comparison Table of Hydrological and Hydrodynamic Models.
ModelAdvantagesDisadvantagesExplanation
SWATSuitable for long-term hydrological simulation of large watershedsinsufficient accuracy in simulating short-term rainstorm runoffwaterlogging during the construction period is a short-term process, which requires higher temporal resolution
TOPMODELBased on the terrain index, it is suitable for mountainous watershedsdifficult to handle complex terrains under artificial disturbancesThe terrain of the construction area changes dynamically, which is inconsistent with the model assumptions
MIKE 11/21High accuracy in hydrodynamic simulationHigh computational cost and weak adaptability to temporary construction boundariesCoupling efficiency lower than that of the SWMM-HEC-RAS combination
SWMM-HEC-RAS1D hydrology + 2D hydrodynamics coupling, balancing efficiency and accuracyRequires support from fine topographic dataThis study overcomes this limitation through UAV-LiDAR data
Table 2. Calibration results of model parameters.
MeaningParameter NameCalibration ResultsCalibration Range Basis (Source)
manning coefficient of impervious areaN-Imperv0.035Determined by SWMM User Manual’s recommended range (0.02–0.04) for hardened ground and this study’s 30 on-site measured averages (0.030–0.038).
manning coefficient of pervious areaN-perv0.08Referring to the study on hydrological scenario disturbed areas (0.07–0.09),this study’s area vegetation coverage (<10%) measured data was matched.
storage capacity in impervious area/mmS-Imperv2Determined based on on-site measured depression storage (1.8–2.5 mm) of construction area hardened pavement.
depression storage in permeable area/mmS-perv4Referring to disturbed soil porosity test results (4–6 mm) and Green-Ampt model’s default depression storage range for permeable surfaces.
maximum infiltration rate/mm·h−1Max. Infil. Rate82Based on double-ring infiltrometer measured disturbed soil maximum infiltration rate (75–90 mm·h−1)
minimum infiltration rate/mm·h−1Min. Infil. Rate10For stable infiltration rate of saturated soil, referring to measured disturbed soil infiltration data in saturation (8–12 mm·h−1)
Infiltration attenuation
coefficient
Decay4.2Based on fitting of infiltration rate decay curve for rainfall duration, referring to parameter range of similar hydrological infiltration models (3.7–4.5)
Table 3. Model Performance Evaluation of the SWMM Model for Construction-Period Rainfall Events.
Rainfall Event24 h Cumulative Rainfall (mm)Peak Intensity (mm/h)NSER2RMSE (m)
15 April 202592.66.20.780.820.13
28 April 202545.33.80.810.850.11
8 May 2025168.99.50.830.870.09
Table 4. Cost of Construction-Period Drainage Measures.
Measure TypeCore Equipment/MaterialsUnit Price (CNY)Typical Usage (For 50-Year Return Period)Single-Item Cost (10,000 CNY)Proportion of Monthly Section Budget
Small Submersible Pumps50 m3/h portable pumps800/day (rental)5 units × 3 days1.20.25%
Mobile Pumping Stations200 m3/h diesel pump trucks1200/day (rental)2 units × 5 days1.20.25%
Temporary Steel PipelinesΦ300 mm spiral steel pipes80/m (incl. installation)1.5 km12.02.5%
Emergency Open Ditches0.5 m × 0.3 m trapezoidal ditches50/m (incl. shoring)2 km10.02.1%
Disclaimer/Publisher’s Note: The statements, opinions and data contained in all publications are solely those of the individual author(s) and contributor(s) and not of MDPI and/or the editor(s). MDPI and/or the editor(s) disclaim responsibility for any injury to people or property resulting from any ideas, methods, instructions or products referred to in the content.