Article

Evaluation of Groundwater Quality and Health Risk Assessment During the Dry Season in the Xin’an River Basin, China

1
Yantai Center of Coastal Zone Geological Survey, China Geological Survey, Yantai 264000, China
2
Observation and Research Station of Land-Sea Interaction Field in the Yellow River Estuary, Yantai 264000, China
*
Author to whom correspondence should be addressed.
Water 2025, 17(16), 2412; https://doi.org/10.3390/w17162412
Submission received: 9 July 2025 / Revised: 5 August 2025 / Accepted: 12 August 2025 / Published: 15 August 2025

Abstract

A total of 162 groundwater samples were collected during November and December 2022 in the Xin’an River Basin during the dry season. In this research, the concentrations of various indicators in most samples did not exceed the prescribed standards. The indicators with the largest number of exceedances were iodine and manganese, with 22 and 23 samples, respectively. Overall, the groundwater quality in the Xin’an River Basin was generally good, with only 7 samples with the EWQI values greater than 150, which exhibited poor groundwater quality. The primary factors influencing groundwater quality were the concentrations of I, Mn, and Al, which were predominantly affected by water–rock interactions. Groundwater quality in the Xin’an River Basin was mainly influenced by natural factors rather than anthropogenic activities. Both the carcinogenic and non-carcinogenic health risks posed by groundwater in the Xin’an River Basin were higher for children than for adults. The long-term chronic cumulative effect was the most important factor contributing to both carcinogenic and non-carcinogenic health risks. Iodine presented the highest non-carcinogenic health risks for both adults and children. In regions where high-iodine groundwater was distributed, it is recommended to enhance the monitoring of iodine concentrations in the groundwater.

1. Introduction

Groundwater, a crucial component of water resources, significantly influences economic development, ecological systems, and social life [1,2,3]. It serves as a vital source for irrigated agriculture, as well as for household and industrial use [4]. With rapid population growth and the continuous expansion of industrial and agricultural activities [5], groundwater pollution has become a significant environmental issue in many countries and regions [6]. The quality of groundwater is increasingly important for the overall development of society [7]. Currently, the rising resource demands of human societies are exerting a progressively detrimental impact on the environment, and human activities are facing growing criticism for their effects on groundwater quality [8].
Groundwater quality is influenced by both natural geological processes and human activities due to the complex nature of geological settings and the dynamic effects of anthropogenic actions [9,10]. Natural phenomena—including precipitation, evaporation, water–rock interactions, groundwater recharge and discharge, and redox reactions—drive the dissolution and precipitation of minerals, thereby regulating the levels of various chemical constituents [11,12,13,14]. Simultaneously, human activities, particularly changes in land use patterns associated with urbanization (such as waste disposal and septic system contamination), irrigation return flows, and the excessive application of agricultural fertilizers, have altered the concentrations of elements such as potassium, chloride, nitrate, and fluoride [15,16,17]. Groundwater is highly sensitive to environmental changes and human impacts [18,19]. Ultimately, the availability of groundwater depends not only on its quantity but also on its hydrochemical composition [20].
According to the Report on the State of the Ecology and Environment in China, 76.1% of groundwater is unsuitable for drinking. Assessing groundwater quality and evaluating associated human health risks are fundamental to understanding the groundwater environment [21]. The increasing decline in groundwater quality has made it challenging to manage this vital resource [22]. Inorganic pollution is the primary form of groundwater contamination and degradation due to its hidden, persistent, and biologically toxic nature. For example, contaminants such as arsenic, fluoride, and nitrogenous species (nitrites and nitrates), which can persist in groundwater for extended periods, have been linked to severe health issues, including cancer, skeletal fluorosis, and methemoglobinemia. These contaminants cannot be detected by the naked eye when enriched in groundwater [23]. Prolonged exposure to such pollutants can significantly jeopardize human health [24]. Therefore, understanding the key factors influencing groundwater quality is essential not only for maintaining a healthy environment [25] but also for ensuring groundwater safety, which is closely linked to human health [26]. Integrating water quality assessments with health risk evaluations can enhance our understanding of environmental groundwater quality and its status, thereby strengthening water risk management and groundwater control [27].
The Xin’an River flows through Anhui and Zhejiang provinces, nourishing an area of 11,700 square kilometers within its basin and providing a safe drinking water supply to the communities along its course. The groundwater quality in the Xin’an River Basin is a critical factor influencing the local natural environment and public health. Therefore, understanding the characteristics of groundwater pollutants, scientifically assessing the associated health risks, and identifying the primary risk factors are essential for effectively managing these risks and ensuring the safety of drinking water in the basin. Furthermore, the findings of this study can offer a scientific basis for implementing an ecological protection compensation mechanism in the Xin’an River Basin.

2. Materials and Methods

2.1. Study Area

The study area is the Xin’an River Basin, which spans both Anhui Province and Zhejiang Province. The Xin’an River has a total length of 373 km and drains an area of approximately 11,700 square kilometers (Figure 1). The Xin’an River Basin is situated in the middle and low mountainous regions of southern Anhui Province and western Zhejiang Province. It experiences a subtropical monsoon climate characterized by four distinct seasons. The average annual temperature is approximately 17 °C, and the average annual precipitation is around 1700 mm. The majority of rainfall occurs from April to July, which is considered the wet season, while the least rainfall is recorded from October to February of the following year, which is the dry season. The Tunxi Basin, a typical red-bed basin, lies within the Xin’an River Basin, and Qiandao Lake is the largest reservoir in the region.

2.2. Sample Collection

To conduct this study, 162 groundwater samples were collected in the Xin’an River Basin between November and December 2022. Each sampling point was located using GPS, and the distribution is illustrated in Figure 1c. The sampling was carried out in strict accordance with the groundwater sample collection specifications established by the China Geological Survey. Prior to sampling, the sample bottles were thoroughly cleaned with distilled water and rinsed three times with water from the sample source. The collected 2 L water samples were transported to the laboratory within 7 days at a temperature of 4 °C. The test indicators included pH, calcium ion (Ca2+), magnesium ion (Mg2+), sodium ion (Na+), potassium ion (K+), bicarbonate (HCO3), sulfate (SO42−), chloride (Cl), nitrate nitrogen (NO3-N), nitrite nitrogen (NO2-N), ammonium nitrogen (NH4+-N), iodine (I), manganese (Mn), aluminum (Al), nickel (Ni), zinc (Zn), copper (Cu), cadmium (Cd), lead (Pb), mercury (Hg), arsenic (As), selenium (Se), fluoride (F), total dissolved solids (TDS), and total hardness (TH). The test methods and detection limits are listed in Table 1. The balance errors between anions and cations in all tested samples were less than ±5%.

2.3. Methods of Assessment

2.3.1. Groundwater Quality Assessment

Water quality indices integrate multiple variables into a single value, which is then associated with a risk category that defines its suitability for drinking [28]. The entropy-weighted water quality index (EWQI) is a method that employs information entropy to determine the distribution weights of water quality indicators [29,30]. This approach reflects the impact of various parameters on overall water quality [31,32] and transforms water quality data to accurately represent the current status [33]. Consequently, the results of water quality evaluations become more precise and reliable [34]. The calculation steps are as follows:
① The eigenvalue matrix X is computed.
X = x 11 x 12 x 1 n x 21 x 22 x 2 n x ij x m 1 x m 2 x mn
where m represents the total number of groundwater samples, and n represents the number of chemical parameters of groundwater.
② The standard matrix Y is calculated.
y i j = x i j x i j min x i j max x i j min
Y = y 11 y 12 y 1 n y 21 y 22 y 2 n y i j y m 1 y m 2 y m n
where y i j is the standardized process; x i j max and x i j min are the maximum and minimum values of the chemical parameters of groundwater, respectively.
③ The P i j is the index j value for sample i.
P i j = y i j + 10 4 i = 1 m y i j + 10 4
where P i j is the jth index value of sample i. To avoid y i j being 0, a correction coefficient of 10−4 is adopted.
④ Calculate the information entropy ej.
e j = 1 l n m i = 1 m P i j × l n P i j
⑤ Calculate the weight of information entropy Wj.
W j = 1 e j j = 1 n 1 e j
⑥ Calculate the quality grades of each indicator.
q j = C j S j × 100
where Cj represents the measured concentration of the jth index of the groundwater sample, and Sj is the limit concentration for Class III water quality standards as stipulated in the “Groundwater Quality Standard” (GB/T14848-2017) [35].
Among the various indicators, the calculation process for the value of qj in relation to pH is quite unique. To ensure that the calculation yields a positive result, it is determined using the following formula:
q p H = C p H S p H × 100
where CpH is the measured value of pH, and SpH is the allowable limit of pH. When the measured pH is greater than 7, SpH = 8.5; when the measured pH is less than 7, SpH = 6.5.
⑦ Calculate the value of EWQI.
E W Q I = j = 1 m W j × q j
The grades and classifications of EWQI are shown in Table 2.

2.3.2. APCS-MLR Model

The fundamental principle of APCS-MLR involves obtaining standardized factor scores and feature vectors through principal component analysis (PCA) for quantitative source apportionment [36]. During this process, the contribution rates of each component can be quantified [37]. The method is described as follows.
① Standardize the initial data.
A m n = Y m n Y ¯ n σ n
where Y m n represents the content of the indicator n of the sample m, and Y ¯ n and σ n are, respectively, the average value and standard deviation of the content of indicator n.
② Substitute a virtual sample data with a content of 0 for the indicator n and standardize it.
A n 0 = 0 Y n ¯ σ n = Y n ¯ σ n
③ The principal factor scores of both the main factors and the virtual sample are calculated separately through factor analysis. The APCS is obtained by subtracting the virtual sample scores from the main factor scores. A multivariate linear regression analysis is then conducted, using the APCS as the independent variable and the index contents as the dependent variables. The resulting regression coefficients represent the contribution of each APCS source to the concentration levels in the samples. The calculation method is as follows.
Y n = b 0 n + t = 1 t q t n × A P C S t
where b 0 n is a constant term, q t n is the regression coefficient of the independent variable APCS, and A P C S t is the absolute principal factor score of factor t.
④ Calculate the contribution rates of known pollution sources and unknown pollution sources, respectively.
P C t n k = q t n × A P C S t ¯ b n + q t n × A P C S t ¯
P C t n u = b n b n + q t n × A P C S t ¯
where P C t n k represents the contribution rate of the known sources, and P C t n u represents the contribution rate of the unknown source.

2.3.3. Human Health Risk Assessment Based on Monte Carlo Simulation Analysis

High concentrations of pollutants in groundwater can pose significant health risks to individuals [38]. Previous studies have indicated that the oral ingestion of groundwater pollutants is more detrimental to human health than inhalation or dermal contact [39,40]. Ingestion of drinking water is the primary exposure pathway through which pollutants in water bodies enter the human body [41]. Therefore, this article focuses exclusively on analyzing health risks associated with the drinking water route. Assessing both non-carcinogenic and carcinogenic health risks is essential for understanding the impact of pollution on water quality, regardless of compliance with concentration limits [42]. According to the health risk assessment model recommended by the United States Environmental Protection Agency (USEPA), the methods for calculating non-carcinogenic and carcinogenic health risks from exposure to harmful substances through drinking water are as follows:
A D D i = c w · I R · E D · E F B W · A T
H Q = A D D i R f D i
C R = A D D i × S F i
where HQ is the non-carcinogenic risk index, and CR is the carcinogenic risk index. A D D i is the average daily exposure dose per unit body weight exposed through the drinking water route; S F i is the carcinogenic slope factor exposed through the drinking water route; R f D i is the average daily intake reference dose exposed through the drinking water route; and c w represents the measured value of the concentration of the components in the groundwater.
The Monte Carlo method was employed for both uncertainty and sensitivity analyses of each parameter. The uncertainty analysis involves first defining the distribution functions for each variable, then randomly sampling from these distributions, and finally generating the probability distribution of the simulation results [43]. Regarding the sensitivity analysis, a greater absolute sensitivity value indicates a stronger impact on health risk. A positive sensitivity value signifies a positive correlation with health risk [44]. In this study, Oracle Crystal Ball software integrated with Excel was used for data processing. The number of iterations per run was set to 10,000, and the confidence level was established at 95% to obtain an approximate solution for risk assessment. The values and definitions of each parameter [45] are presented in Table 3 and Table 4.
The levels of carcinogenic and non-carcinogenic health risks have been clearly defined by the USEPA. The HQ of less than 1 indicates a relatively low non-carcinogenic health risk. Conversely, an HQ of 1 or greater suggests the potential for adverse effects on human health [46,47]. The carcinogenic risk is categorized into three levels: low level (CR < 10−6), acceptable level (10−6 ≤ CR ≤ 10−4), and unacceptable level (CR > 10−4) [48].

2.4. Statistical Analysis

The data were processed and statistically analyzed using SPSS 26 and Microsoft Excel 365. The graphs were created with CorelDRAW X8, Origin 2022, and ArcGIS 10.8.

3. Results and Analysis

3.1. Hydrochemical Characteristics

3.1.1. Descriptive Statistical Analysis

The concentration statistics for each index are presented in Table 5. Using the limit concentrations for Class III water quality standards as stipulated in the “Groundwater Quality Standard” (GB/T 14848-2017), most samples did not exceed the prescribed limits for various indicators. The indicators with the highest number of exceedances are I and Mn, followed by Al. Only a few samples exceeded the standards for Ni, pH, As, NH4+-N, Ca, SO42−, Zn, Hg, Se, F, and TH. There were no samples exceeding the standard in other indicators. Considering skewness and kurtosis, the points where SO42−, NH4+-N, Ni, Hg, Se, and F exceeded the standards were identified as abnormally high values, suggesting the possibility of point-source pollution. The coefficient of variation for multiple indicators was relatively high (>100%), indicating significant spatial variability and a pronounced degree of local enrichment. The concentrations of heavy metals (Hg, Cd, As, Pb, Cu, Zn, and Ni) were all at relatively low levels. Regarding the spatial distribution of concentrations, the exceedance points for I and Mn were primarily located in the Tunxi Basin, situated in the middle and upper reaches of the basin, which may be related to the hydrogeological conditions of this area.

3.1.2. Gibbs Diagram

The sources of chemical components in groundwater are numerous. Generally, it is believed that the primary factors influencing the concentration of chemical components in groundwater include mineral weathering, evaporation and crystallization, atmospheric precipitation, and human activities [49,50]. The Gibbs diagram could be utilized to analyze the main factors affecting the chemical composition of groundwater [51,52]. According to Figure 2, the Cl/(Cl + HCO3) and Na+/(Na+ + Ca2+) ratios for the vast majority of samples were less than 0.5, indicating that the groundwater in the Xin’an River Basin was primarily influenced by rock weathering. Among the nine samples with EWQI values greater than 150, both Cl/(Cl + HCO3) and Na+/(Na+ + Ca2+) ratios were also less than 0.5, suggesting that the poor groundwater quality in certain areas of the Xin’an River Basin was not attributable to human activities but rather results from natural water–rock interactions.

3.1.3. Ion Ratio Analysis

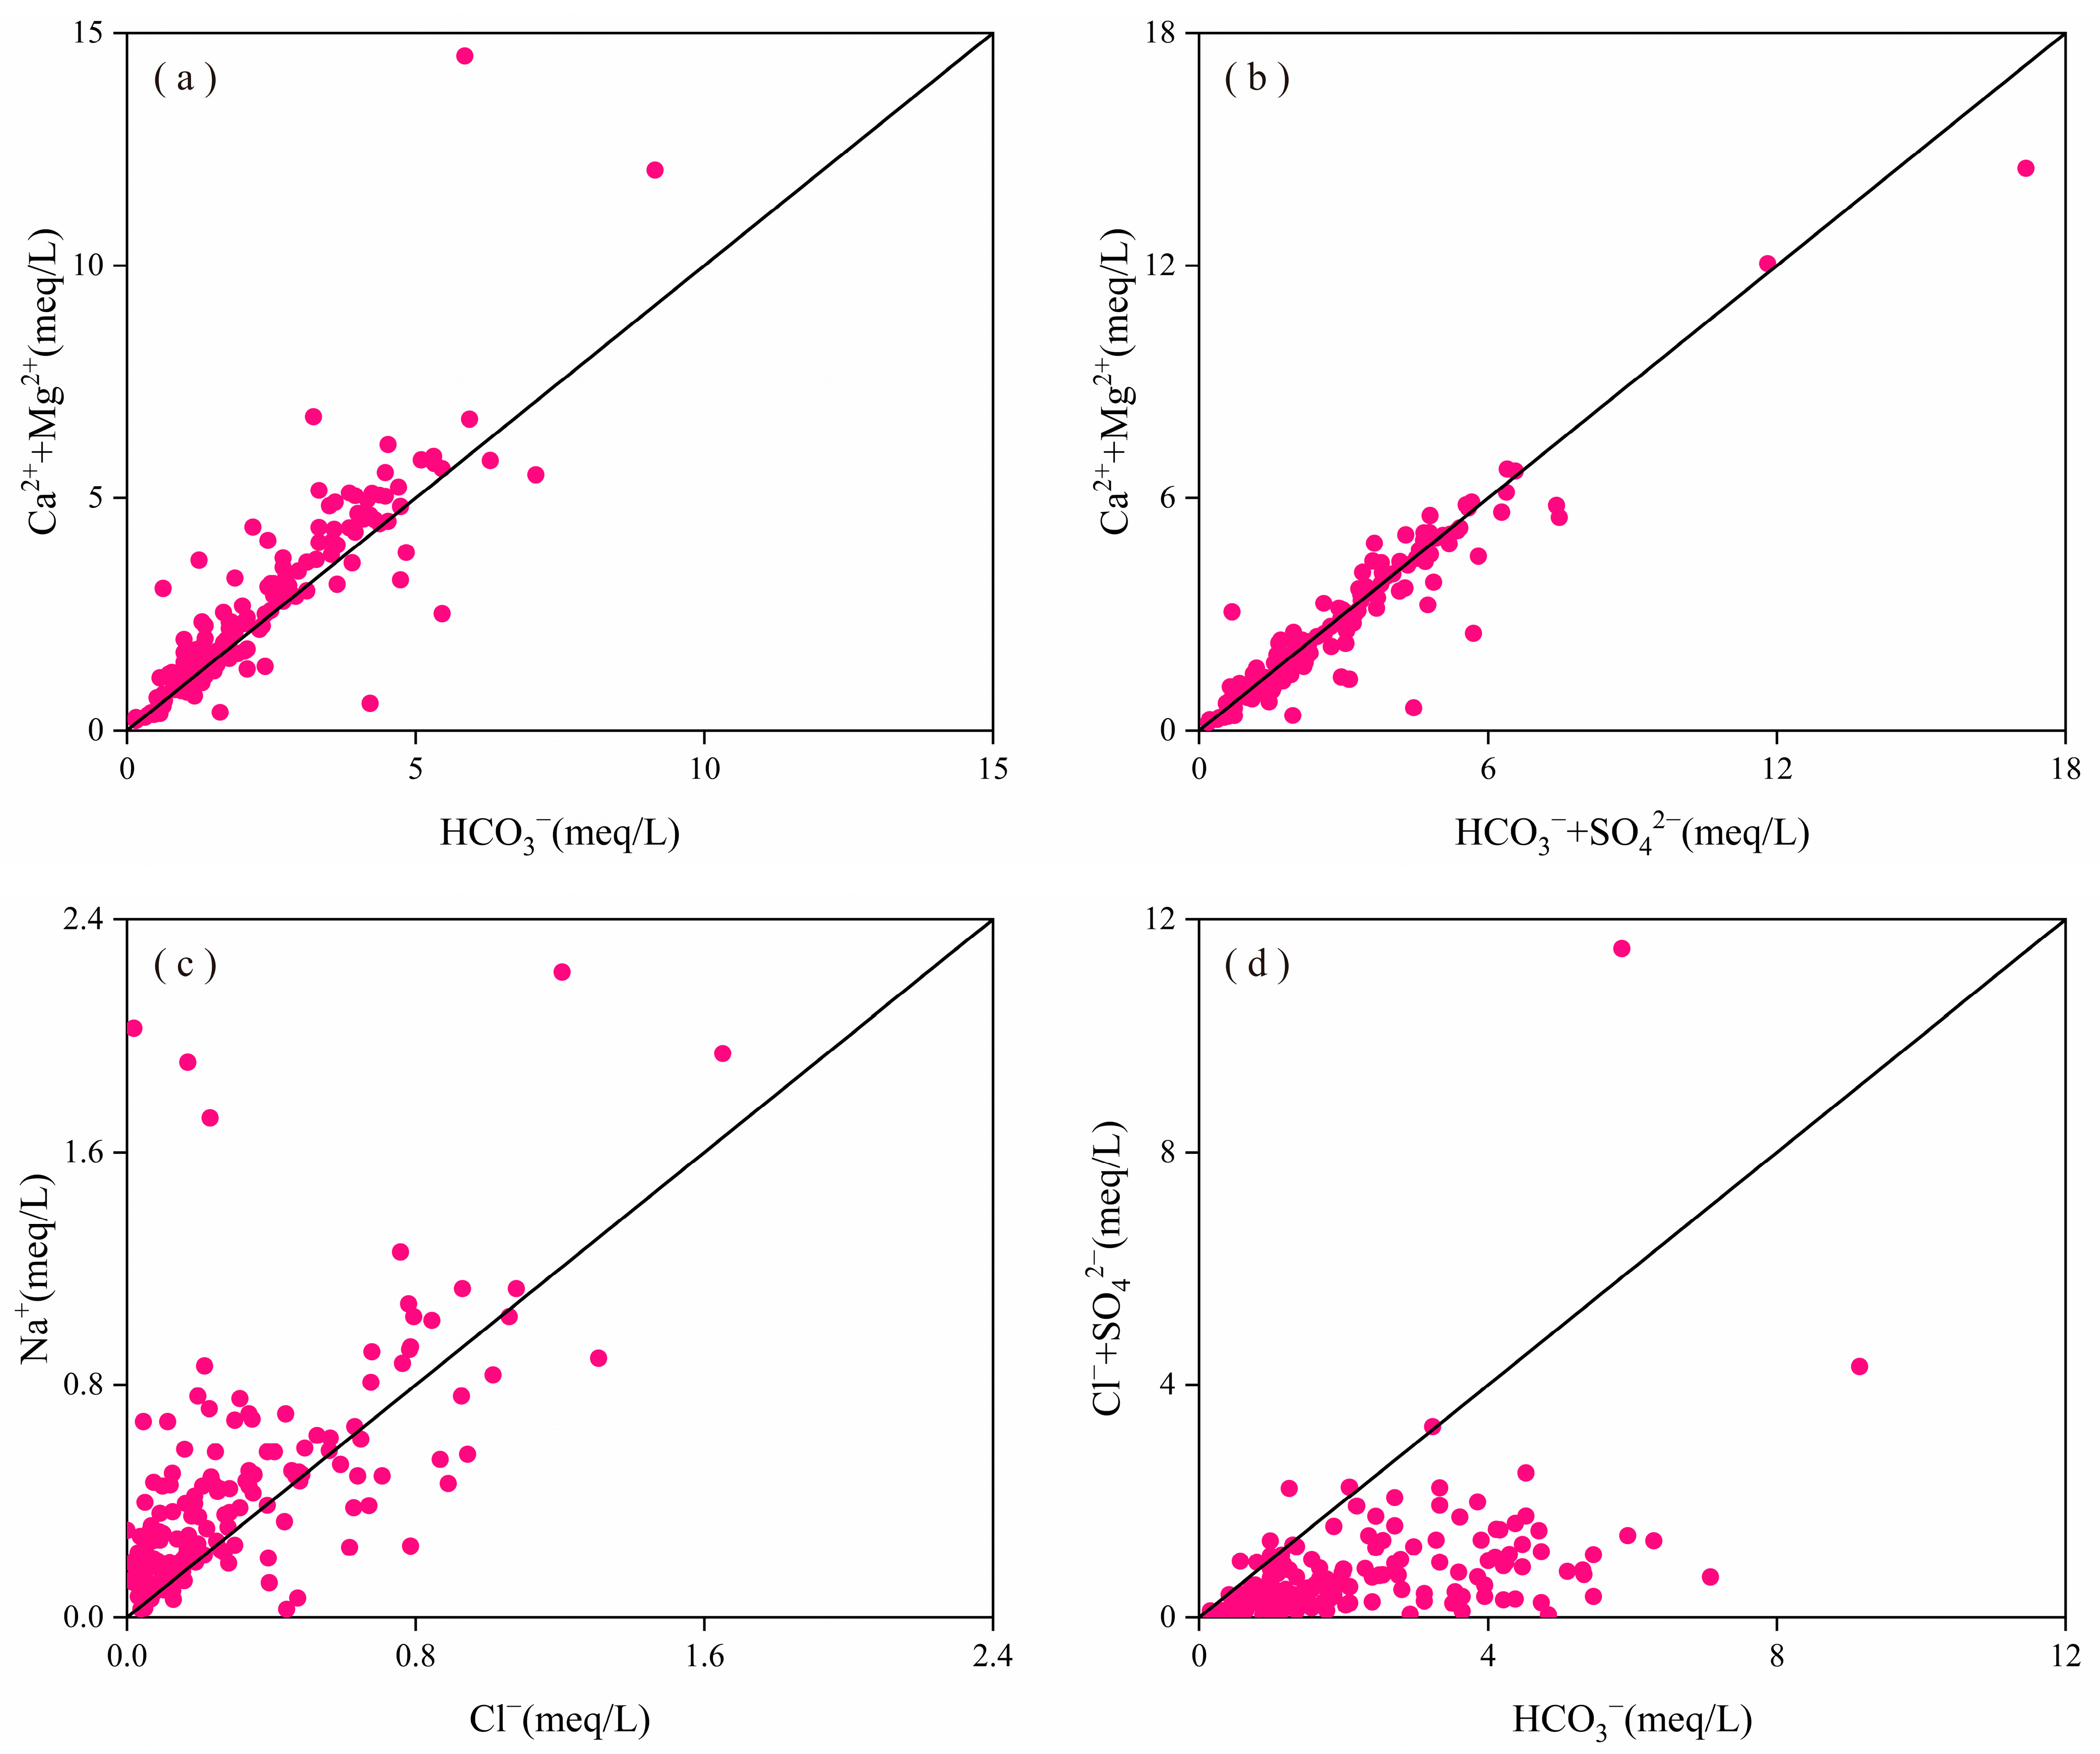
The sources of Ca2+, Mg2+, HCO3, and SO42− in groundwater were analyzed using the ratio of milliequivalent concentrations of (Ca2+ + Mg2+) to HCO3 and (HCO3 + SO42−). According to Figure 3a, most of the groundwater samples in the Xin’an River Basin were above the 1:1 reference line, indicating that Ca2+ and Mg2+ originated not only from the decomposition of carbonate rocks but also from other calcium and magnesium mineral sources. Further analysis in Figure 3b, which includes SO42−, showed that most samples cluster near the 1:1 reference line, suggesting that SO42− also contributed to the formation of Ca2+ and Mg2+ in groundwater. This implied that the chemical composition of groundwater was influenced by gypsum dissolution. A small number of samples fell below the 1:1 reference line, indicating that there was an excess of HCO3 and SO42− in the groundwater chemistry, which required other cations for charge balance. This observation suggested that silicate rock dissolution also occurred in the groundwater within the Xin’an River Basin.
The sources of Na+ and Cl in groundwater could be determined by the ratio of Na+ to Cl. According to Figure 3c, most of the groundwater samples in the Xin’an River Basin were distributed above the 1:1 reference line, indicating that Na+ in the groundwater originated not only from the dissolution of rock salt but also from the dissolution of silicate minerals. A few samples fell below the 1:1 reference line, suggesting that some groundwater might have been influenced by human activities.
The above analysis indicated that the water–rock interactions between groundwater and strata in the Xin’an River Basin involved both carbonate karst dissolution and rock salt dissolution. According to Figure 3d, by analyzing the milligram equivalent concentration ratio of (SO42− + Cl) to HCO3, the influence of carbonate rock and rock salt dissolution on the groundwater composition in the Xin’an River Basin could be determined. Since most samples fell below the 1:1 reference line, this suggested that carbonate rock dissolution had a significantly greater impact on the groundwater chemistry in the Xin’an River Basin than rock salt dissolution.

3.2. Analysis of Groundwater Quality and Influencing Factors

3.2.1. Groundwater Quality

The groundwater quality was assessed using the Entropy-Weighted Water Quality Index (EWQI) method. Among the groundwater samples collected from the entire basin, EWQI values ranged from 7.66 to 924.86. The evaluation results (Figure 4) indicated that the majority of samples exhibited excellent (138 cases) or good (12 cases) groundwater quality, collectively accounting for 92.59% of the total. Only a small number of samples showed poor groundwater quality, including 3 samples classified as medium grade, 2 as poor grade, and 7 as extremely poor grade. Samples with poor groundwater quality were predominantly located in the Tunxi Basin, situated in the middle and upper reaches of the Xin’an River Basin, with a few found in the lower reaches.

3.2.2. Influencing Factors

Correlation Analysis
To investigate the influence of water quality indicators on the EWQI, Pearson correlation analysis was conducted between the EWQI and each indicator. Since the Xin’an River Basin is predominantly hilly and mountainous, with small watersheds largely separated by ridges, the hydraulic connectivity of groundwater is relatively weak. Performing correlation analysis across the entire Xin’an River Basin to identify the main factors affecting groundwater quality would yield results that are purely statistical and fail to account for the impact of hydrogeological conditions. The Tunxi Basin, the largest sub-watershed within the Xin’an River Basin, contains most of the sampling points with poor water quality. Therefore, focusing the correlation analysis solely on sampling points within the Tunxi Basin allows for a more accurate identification of the water quality indicators that primarily influence the groundwater EWQI.
Correlation analysis was conducted on 76 groundwater samples in the Tunxi Basin. The results (Table 6) showed that Mn and Al were strongly correlated with the EWQI, while I exhibited a moderate correlation. The correlations between other indicators and the EWQI were not significant. Therefore, Mn, Al, and I were the primary indicators affecting the groundwater quality in the Xin’an River Basin. This conclusion essentially corresponds to a situation in which the number of samples exceeds the acceptable limit. Furthermore, a strong correlation was observed between Mn and Al, suggesting that their main sources may be the same.
Principal Component Analysis
Using principal component analysis (PCA), the sources of the main indicators affecting groundwater quality were examined. Since there were 25 indicators in total at the time, which was excessive, performing PCA on all of them would have resulted in redundant information and hindered the effective analysis of the sources for each component. Therefore, only the main indicators Mn, Al, and I, which affect groundwater quality, along with the seven basic ions Ca2+, Mg2+, Na+, K+, HCO3, SO42−, and Cl—a total of 10 indicators—were selected for principal component analysis to investigate the causes of poor water quality in certain areas of the Xin’an River Basin.
Principal component analysis was performed on 10 selected water quality indicators in the Tunxi Basin, followed by the maximum variance rotation. The results are presented in Table 7. The Kaiser–Meyer–Olkin (KMO) test value was 0.517, with a significance level of 0.00, indicating that the data were suitable for PCA. Principal components with eigenvalues greater than 1 were extracted, resulting in the first four principal components. Both the initial cumulative variance contribution and the cumulative variance contribution after rotation were 74.855%. Therefore, analyzing the first four principal components effectively represents the overall data structure.
The cumulative contribution rate of Principal Component 1 was the highest, indicating that it was the primary factor influencing groundwater in the Xin’an River Basin. The main components associated with this factor were Ca2+, HCO3, Mg2+, and SO42−. Based on the analysis above, water–rock interaction was the dominant process affecting the concentrations of these components in the groundwater. Therefore, Principal Component 1 primarily reflects the dissolution of carbonate rocks, silicate minerals, and sulfate minerals such as gypsum.
The main components of Principal Component 2 were Na+, Cl, and I. Since the Gibbs diagram analysis ruled out the influence of seawater or evaporation concentration, and water–rock interaction was identified as the most significant factor, combined with the result of ion ratio analysis, it was inferred that the main sources of Na+ and Cl were the dissolution of rock salt, while iodine entered the groundwater through co-dissolution.
The main components of Principal Component 3 were Mn and Al. The Tunxi Basin is a typical red-bed basin, where the red beds and the sediments formed by their weathering contained relatively high concentrations of Mn-rich minerals and Al-rich minerals. Under the influence of water–rock interactions, when Mn-containing oxide or hydroxide minerals and Al-containing oxide or hydroxide minerals underwent reductive dissolution, Mn and Al could be released and entered into the groundwater. Therefore, Principal Component 3 primarily reflected the dissolution of minerals rich in Mn and Al.
The primary component of Principal Component 4 is K+. When K+ is the sole dominant ion, it typically indicates a connection to human activities, such as the use of chemical fertilizers. Therefore, Principal Component 4 might originate from agricultural sources.
In conclusion, Principal Components 1 to 3 all indicated geological processes, suggesting that the primary factors influencing the component content in the groundwater of the Xin’an River Basin were natural. This finding was consistent with the results of the Gibbs diagram and ion ratio analyses.
APCS-MLR Model
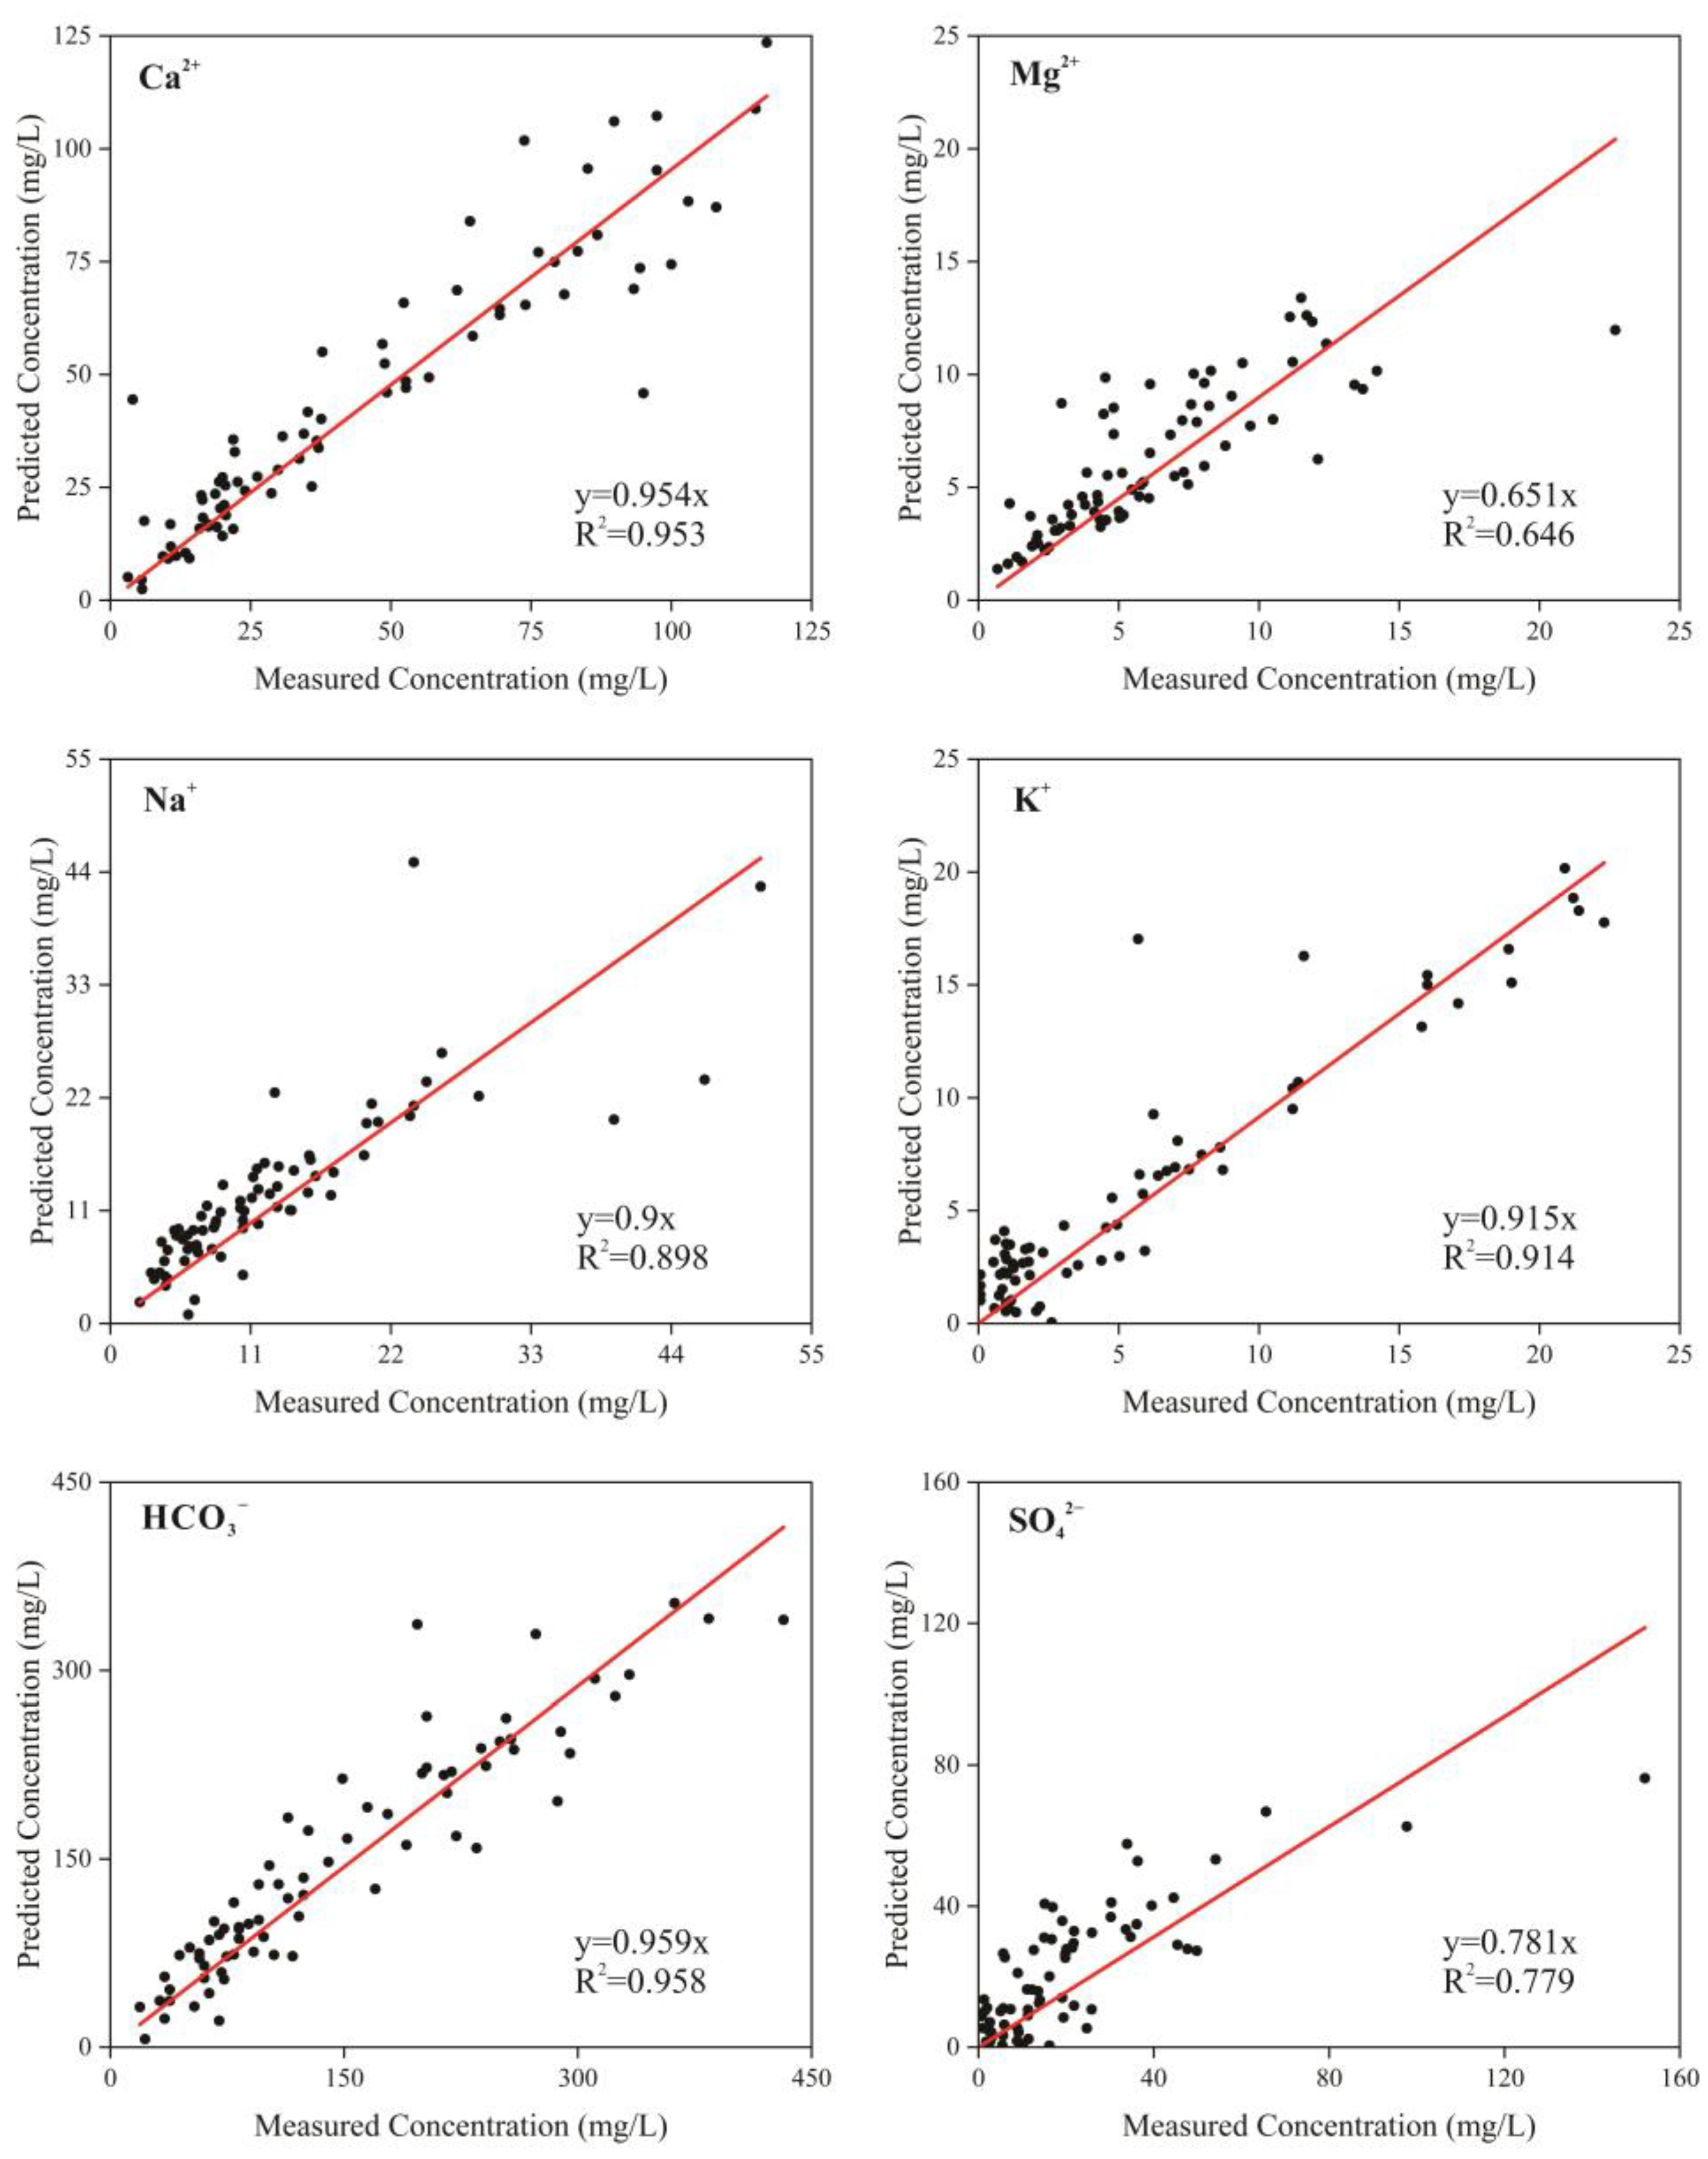
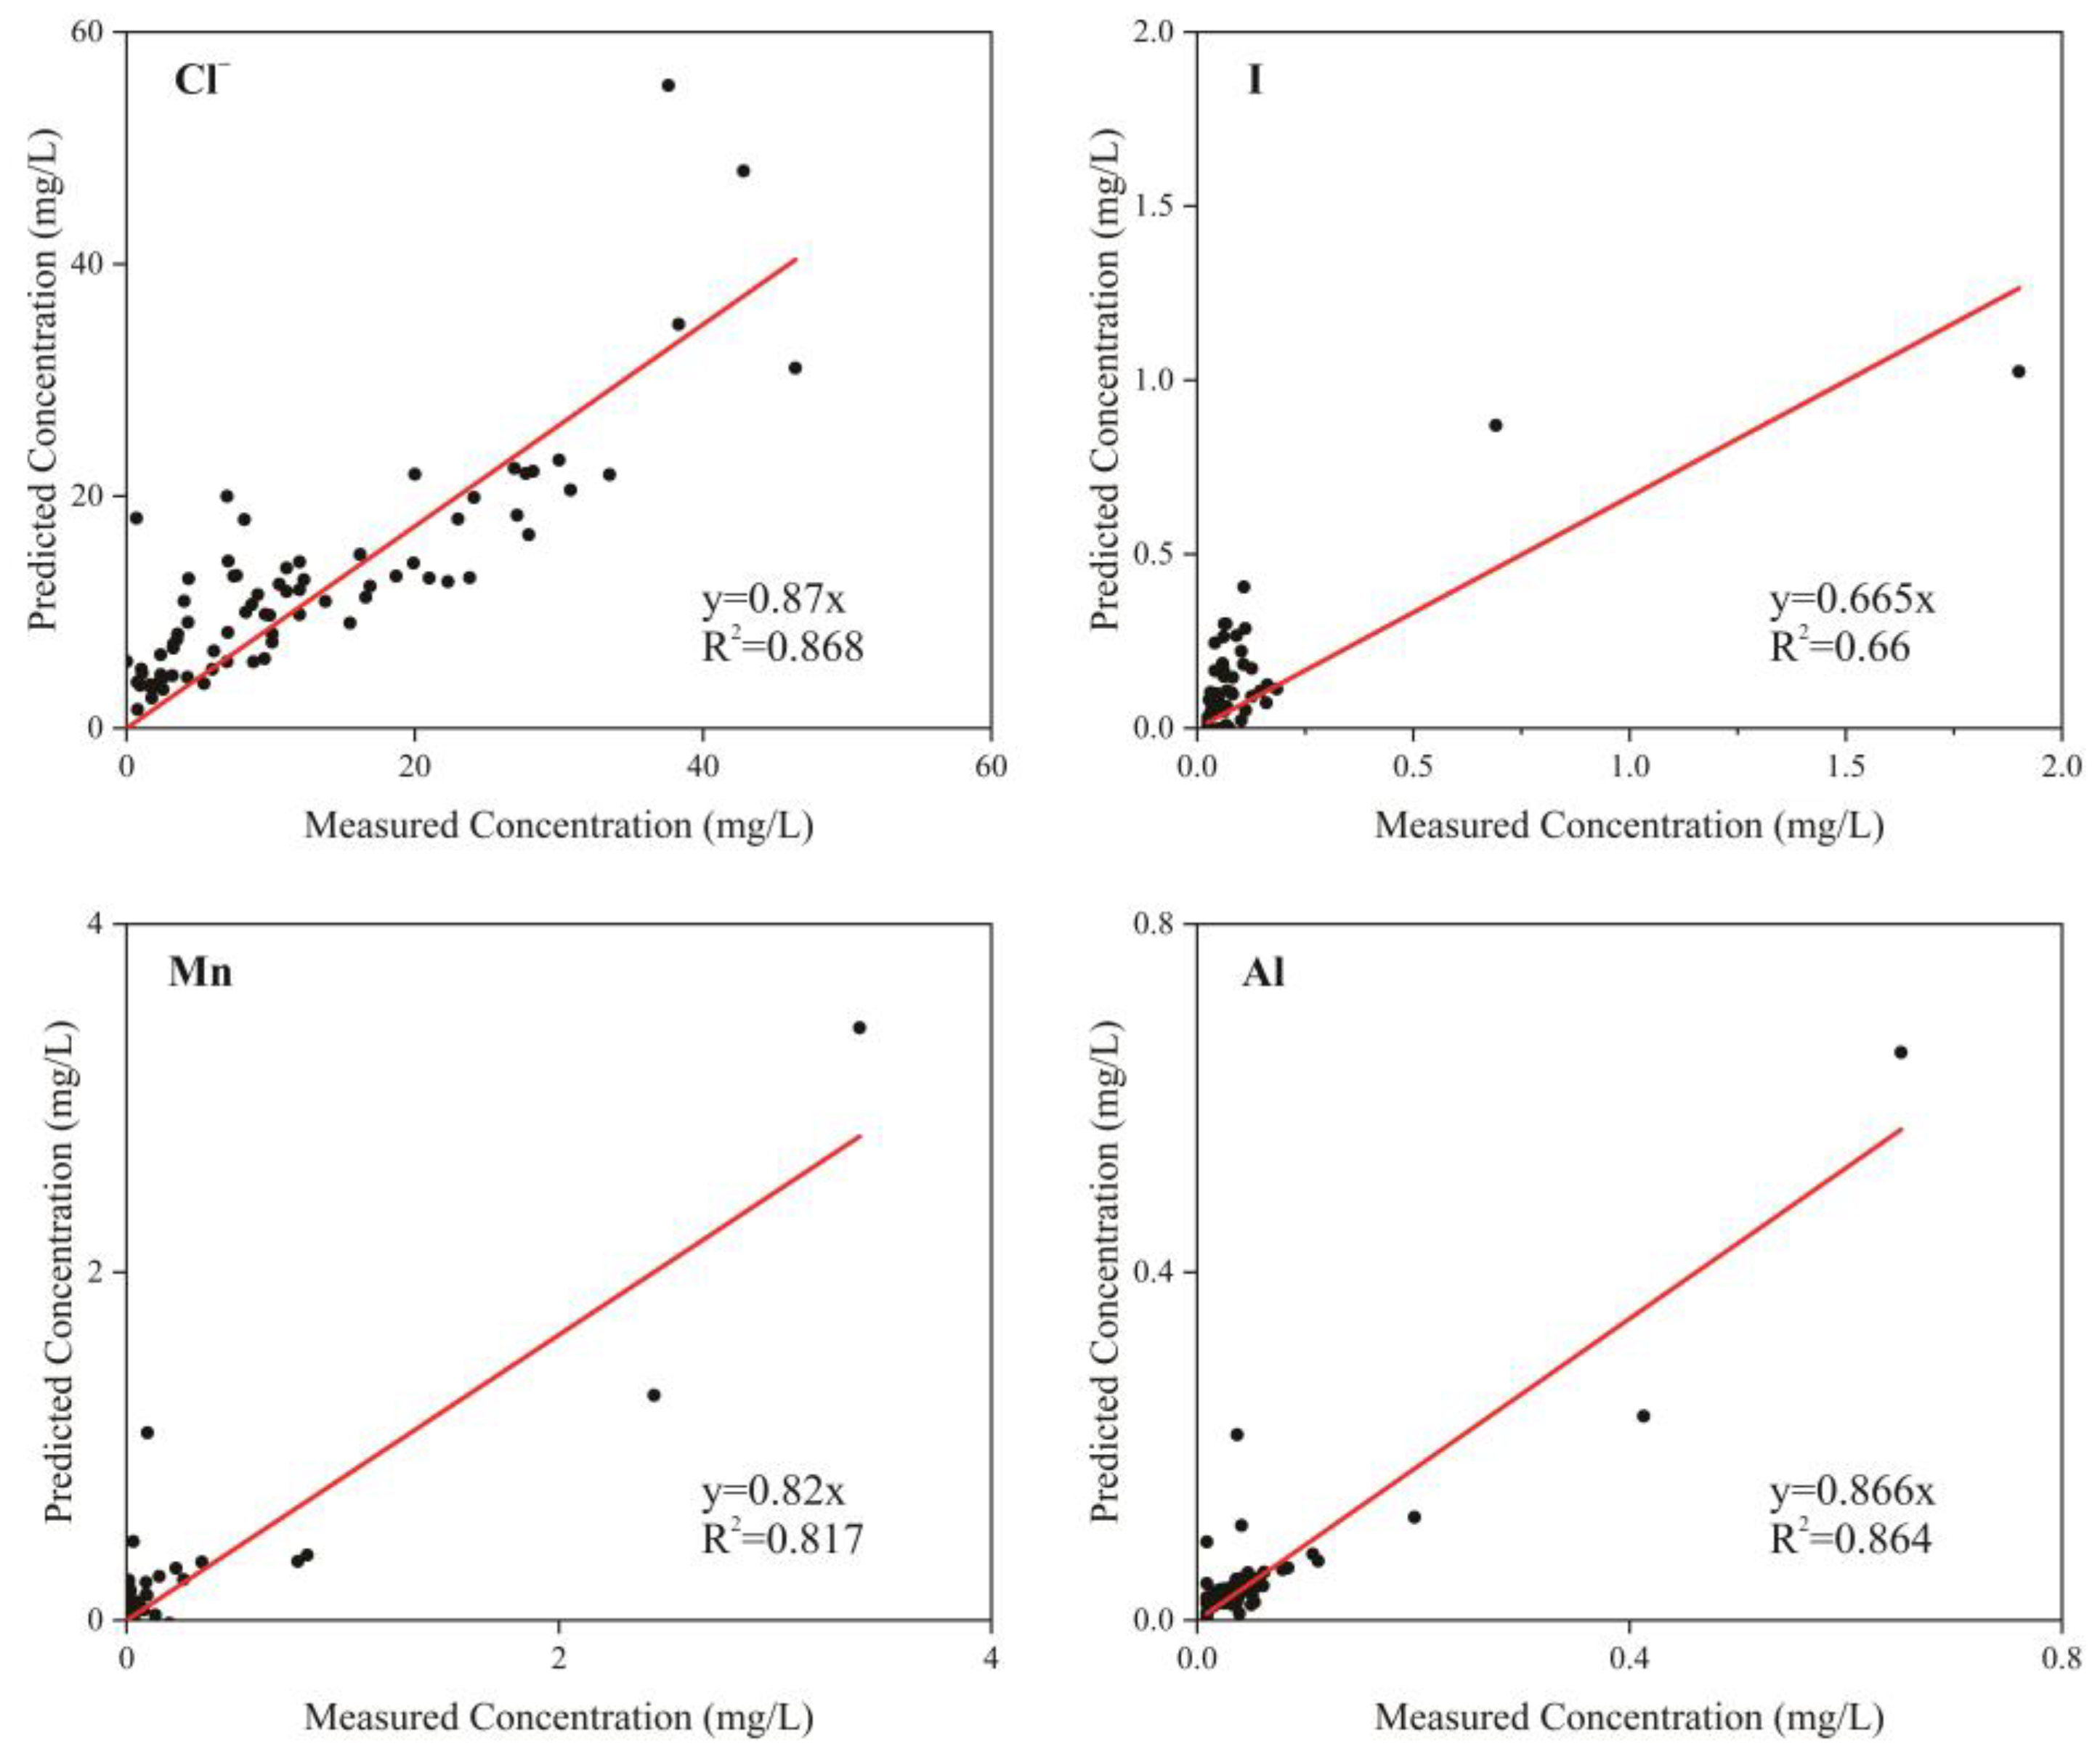
Based on principal component analysis, the functional relationships between the concentrations of various key water quality indicators were established using the APCS-MLR model to simulate water quality conditions. The results showed that the R2 values of the linear fit between predicted and measured concentrations of the main water quality indicators differed very little from the average fitting coefficient, indicating strong consistency between the two. The fitting results are presented in Figure 5. Therefore, in the Xin’an River Basin, the APCS-MLR model demonstrated good applicability for calculating and allocating the sources of groundwater quality indicators.
The results of the APCS-MLR model analysis, presented in Figure 6, are consistent with those of the principal component analysis. The primary sources of Mn, Al, and I—key indicators affecting groundwater quality in the Xin’an River Basin—were identified as natural. The combined contributions of their natural sources (F1–F3) reached 74.31%, 65.46%, and 60.34%, respectively. This indicated that the main cause of the poor water quality in certain areas of the Xin’an River Basin was the influence of the geological background and hydrogeological conditions. Therefore, it is recommended to strengthen groundwater quality monitoring in the Xin’an River Basin and closely observe changes in groundwater quality.

3.3. Human Health Risk Assessment Based on Monte Carlo Simulation Analysis

3.3.1. Daily Intake

The intake of various components in the groundwater of the Xin’an River Basin was evaluated. The daily intakes for adults and children are presented in Table 8.
The average daily absorption amounts of various components in groundwater by adults and children through drinking water routes were as follows: SO42− > NO3-N > F > Mn > I > NH4+-N > Al > Zn > NO2-N > Ni > Pb > Cu > As > Se > Hg > Cd, which corresponded to the concentration of each component in the groundwater. The average daily absorption of each component by children was slightly higher than that of adults. Under normal circumstances, heavy metals pose significant risks to human health; however, in the Xin’an River Basin, the intake of multiple heavy metals from groundwater remains relatively low. Furthermore, the two components with the highest number of samples exceeding acceptable limits, iodine and manganese, also had relatively high intake levels.

3.3.2. Non-Carcinogenic Health Risk

The non-carcinogenic health risks associated with various components in the groundwater of the Xin’an River Basin were evaluated for both adults and children. The assessment of non-carcinogenic risks during the dry season is detailed in Table 9. The overall non-carcinogenic health risk to adults from groundwater in the Xin’an River Basin was relatively low, with average HQ values well below 1. However, the risk to children was comparatively higher, with an average HQ value approaching 1.
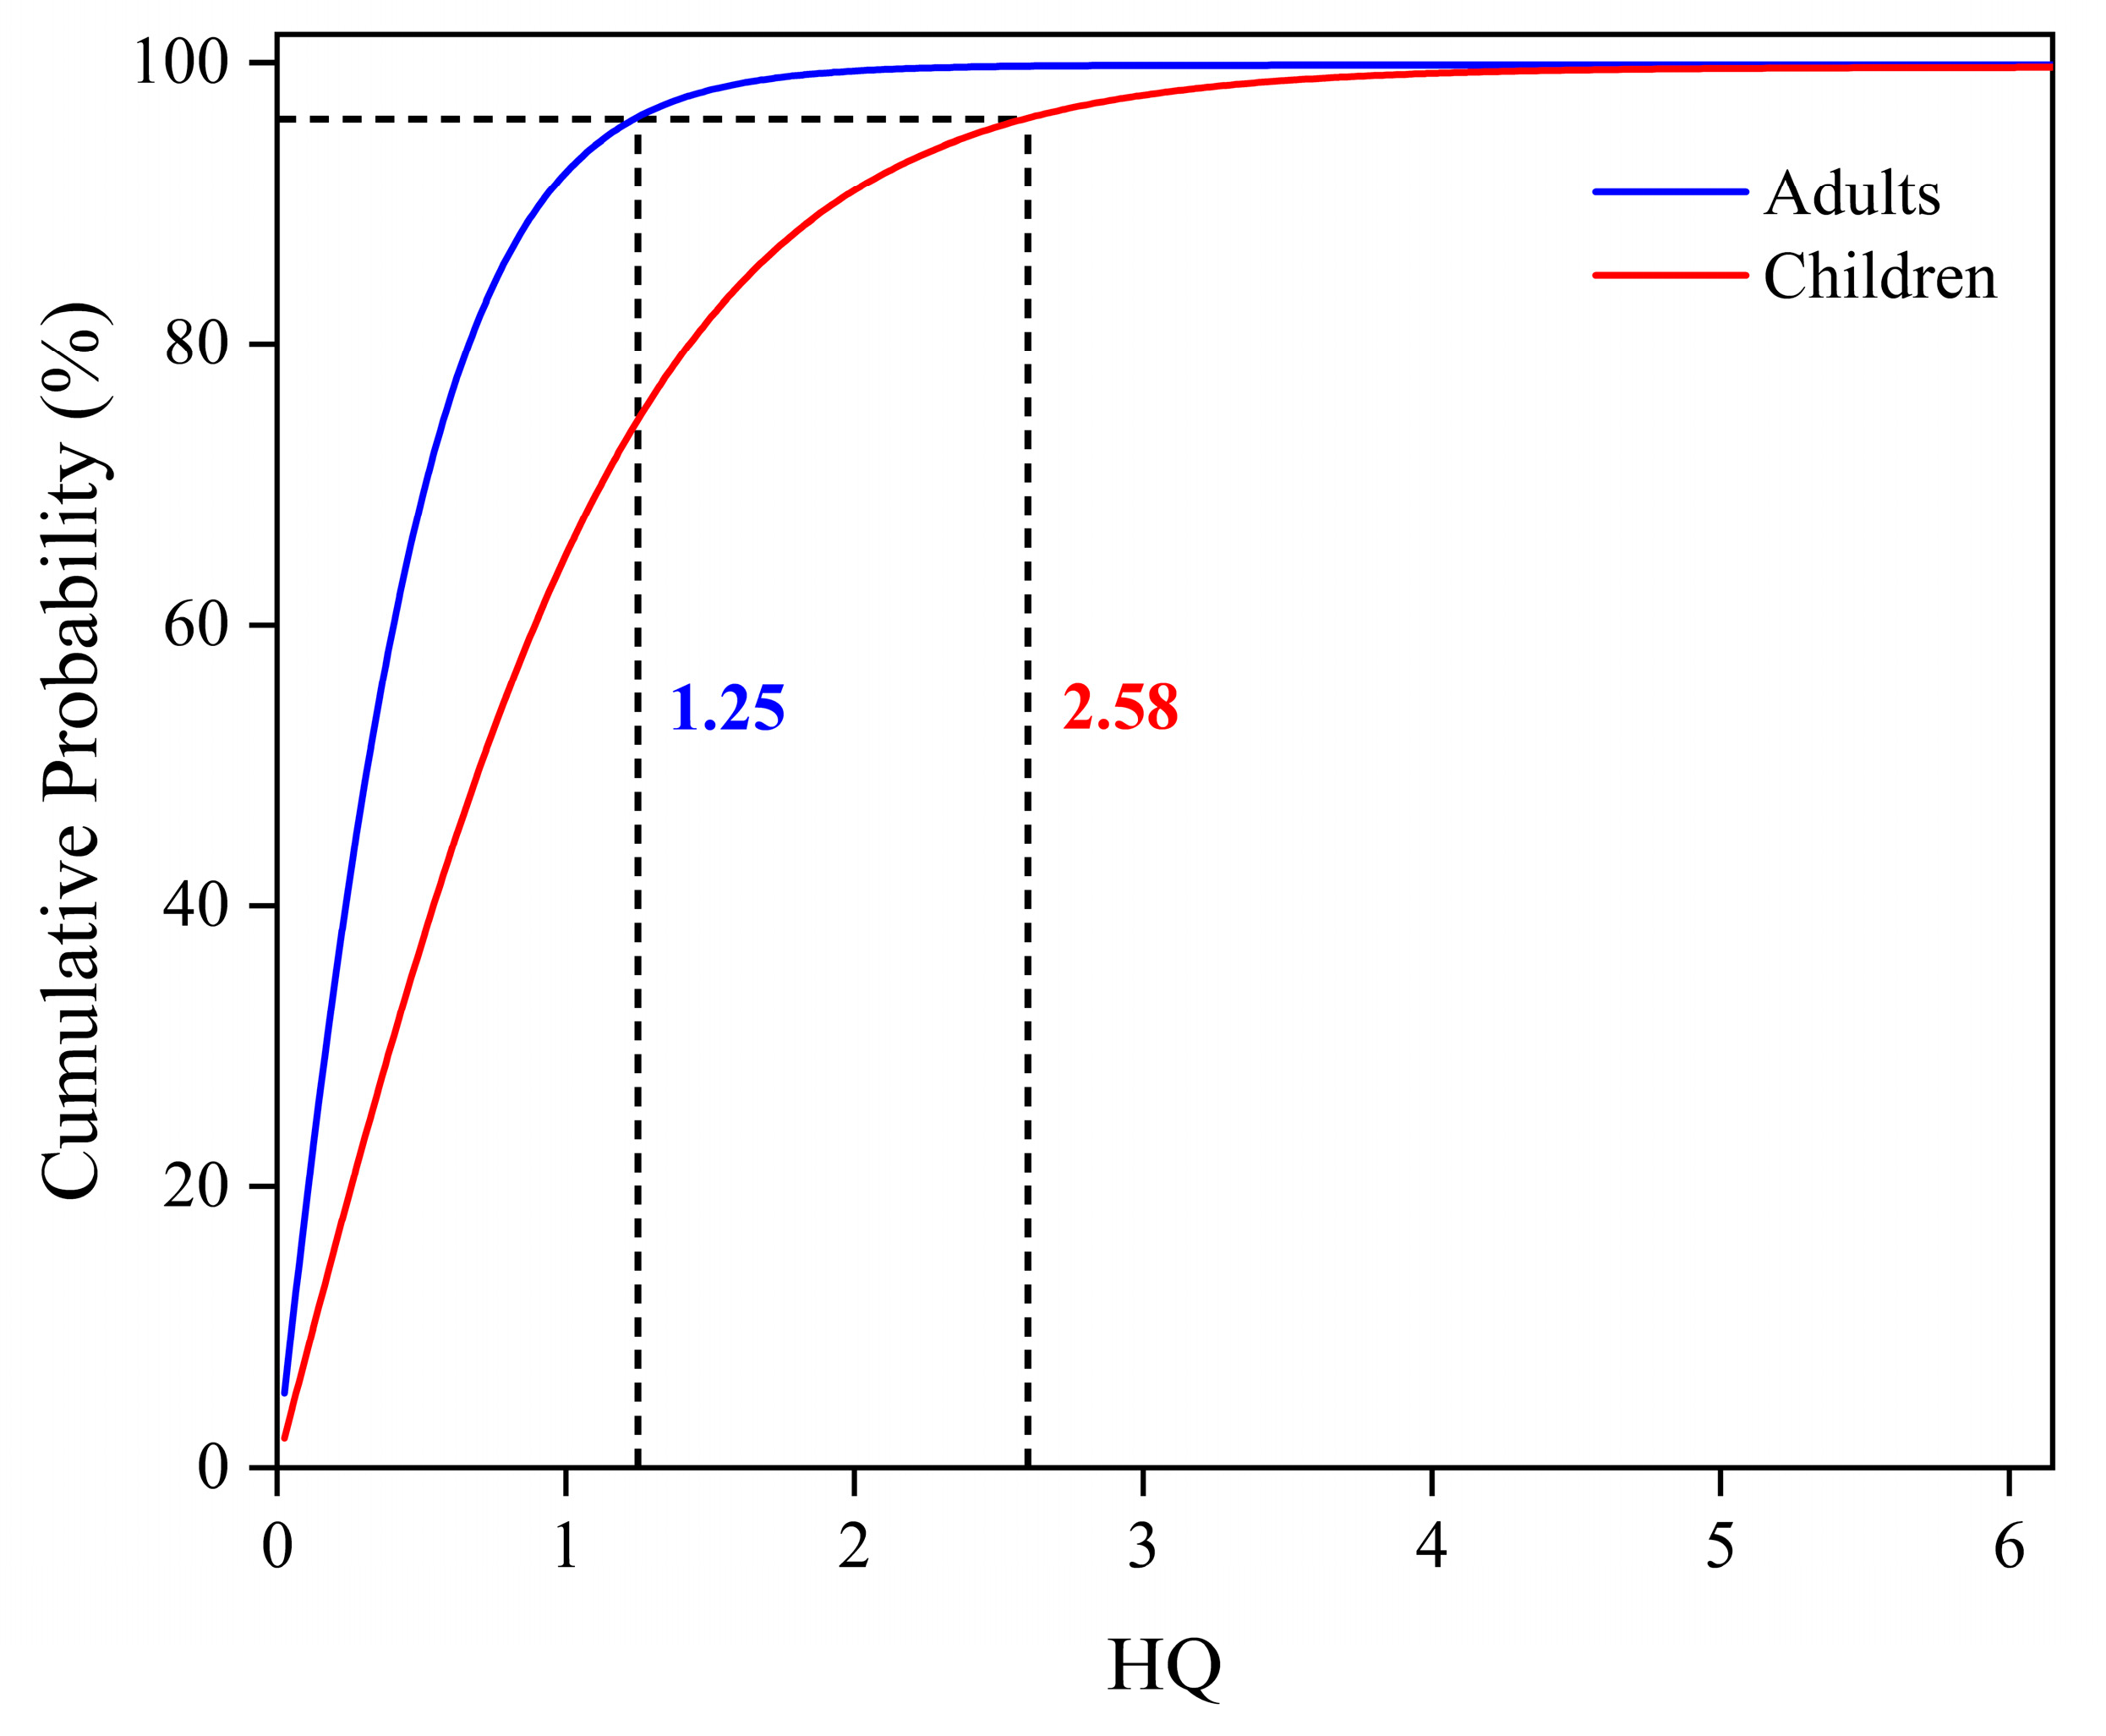
From another perspective (Figure 7), the 95% percentile value of HQ represented the risk in the worst-case scenario, of which the value exceeded 1 for both adults and children—especially for children—it reached 2.58, which indicated that groundwater in some areas posed a relatively high non-carcinogenic health risk to the human body. Additionally, among 10,000 simulated random risk values, only 8.11% of HQ values for adults exceeded 1, compared to 35.49% for children. This suggested that the non-carcinogenic health risk of groundwater in the Xin’an River Basin was significantly higher for children than for adults.
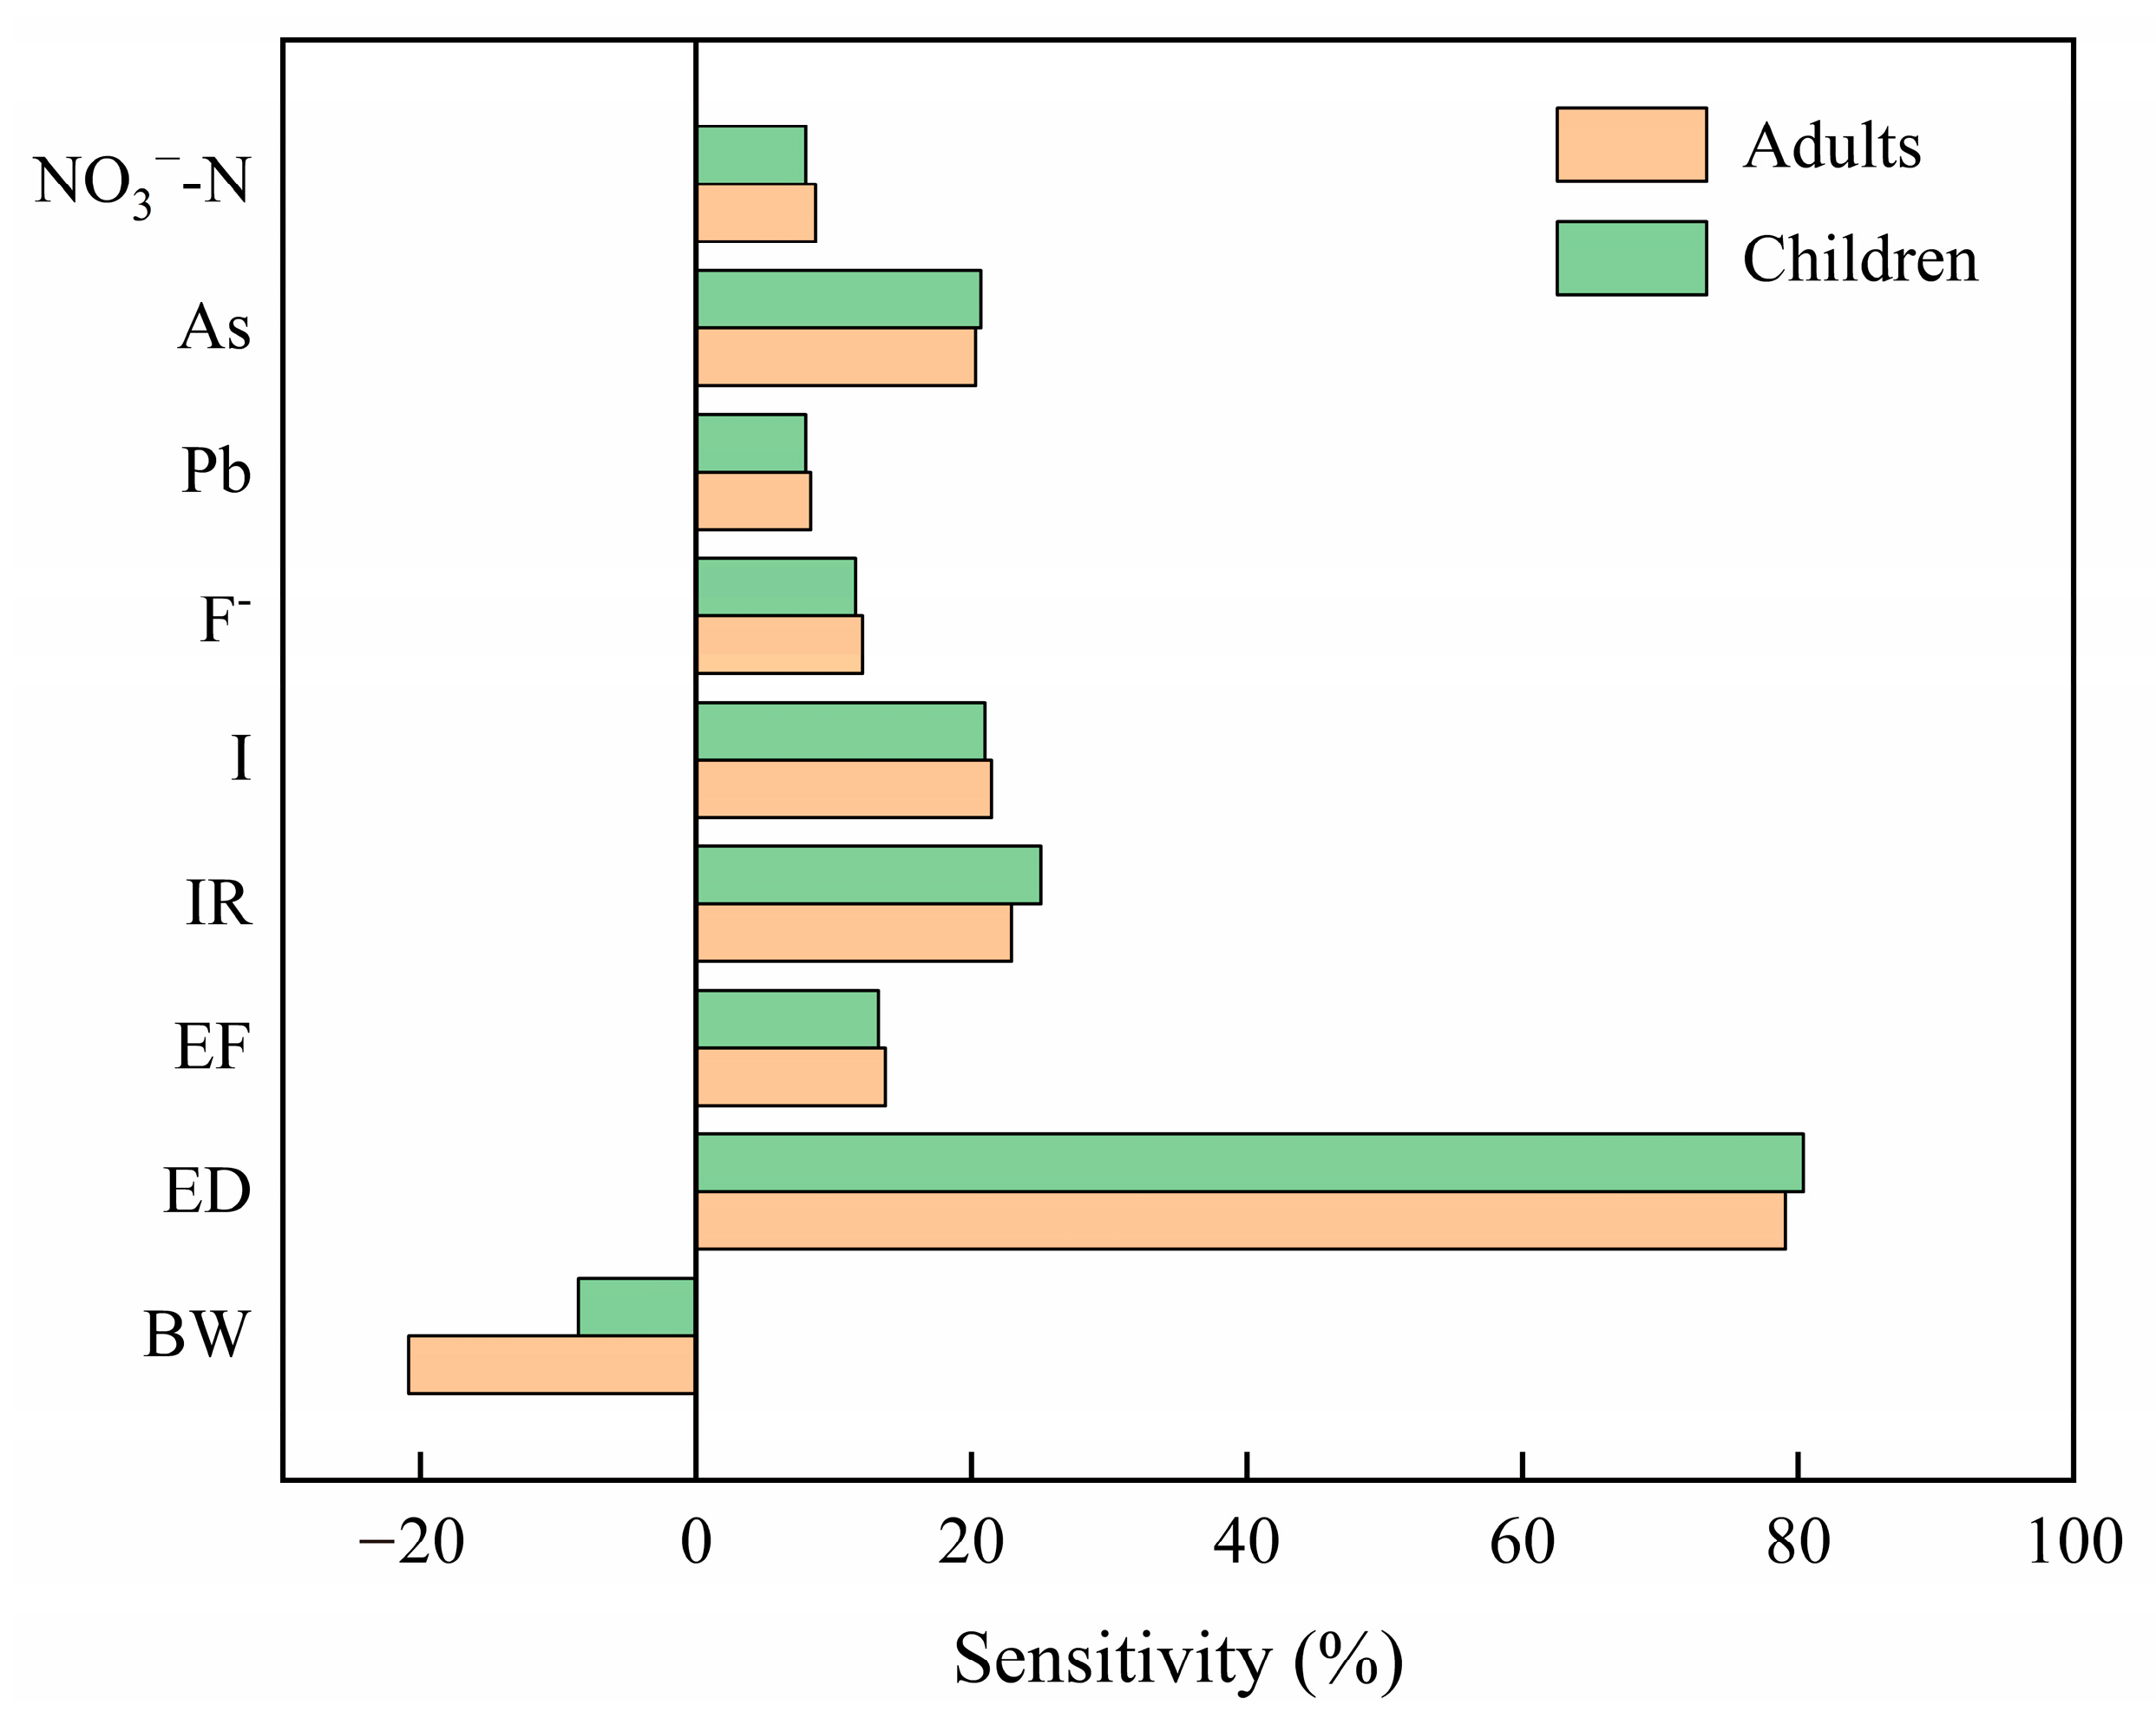
According to the sensitivity analysis (Figure 8), the sensitivity of ED was the highest for both adults and children, significantly exceeding that of other parameters. In other words, the longer the duration of groundwater consumption, the greater the non-carcinogenic health risk. This indicated that the health hazards posed by groundwater in the Xin’an River Basin were not directly caused by specific components but resulted from long-term chronic cumulative effects.
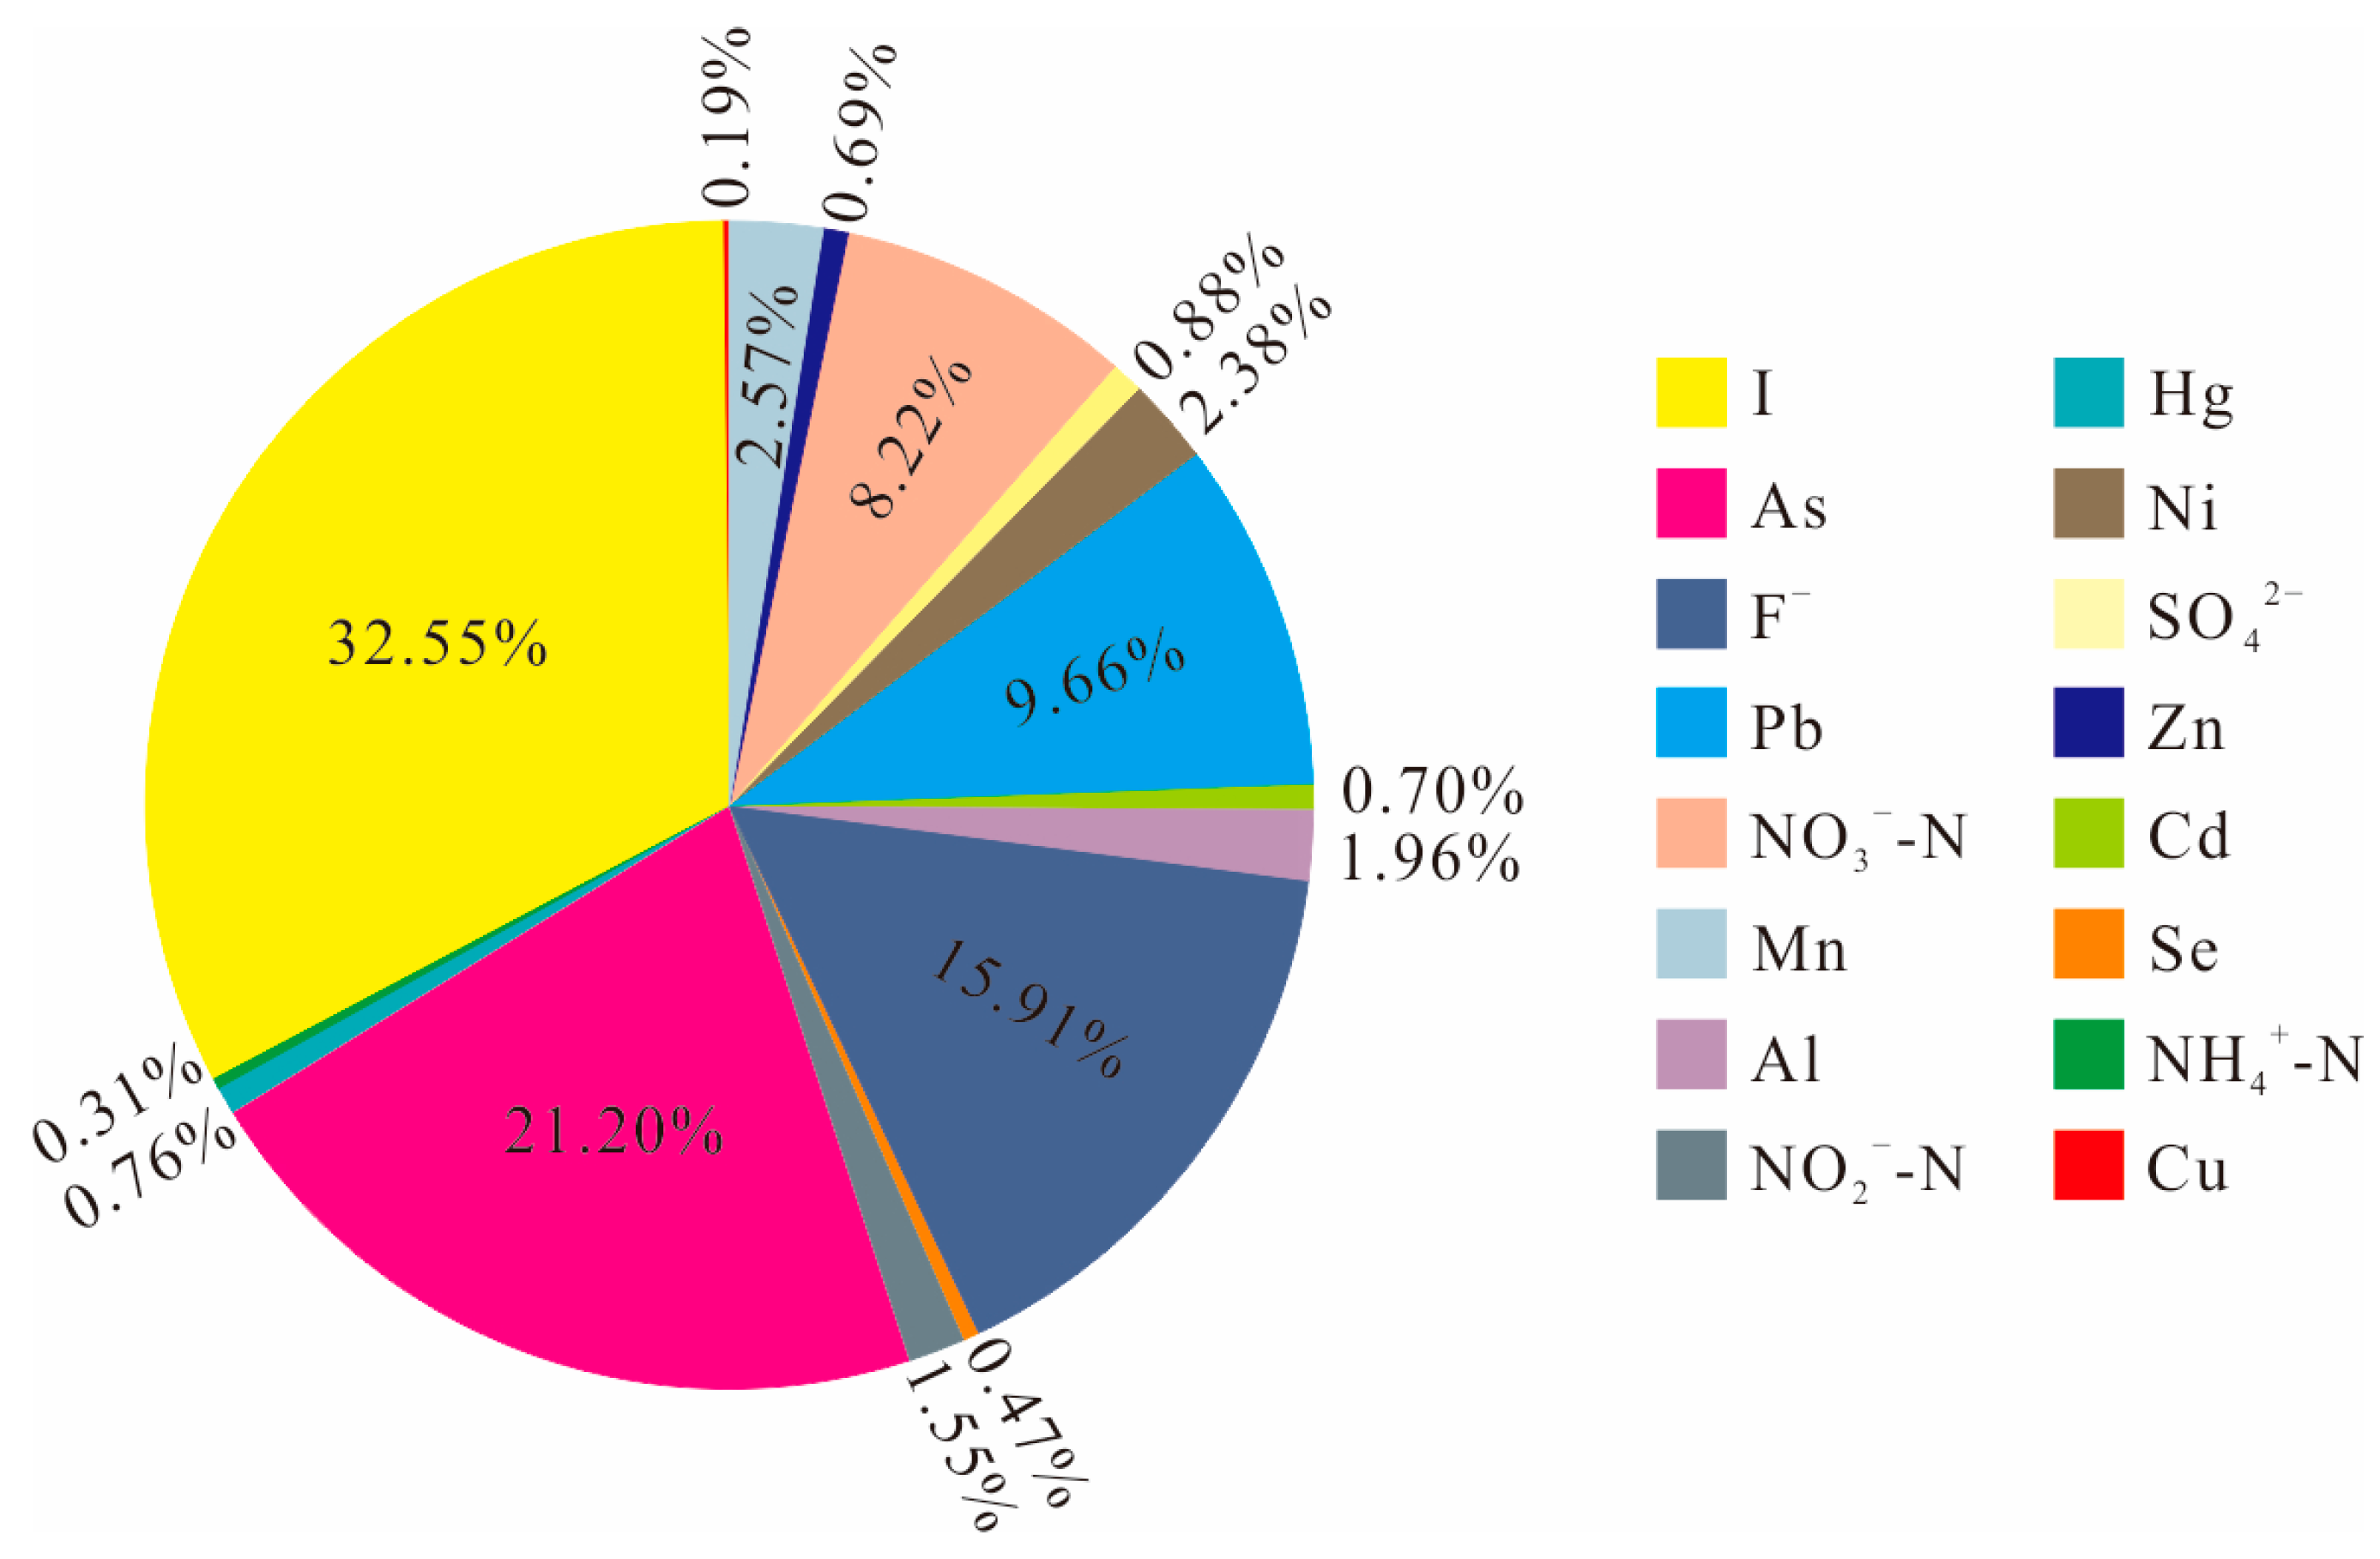
The non-carcinogenic health risks posed by each component in the groundwater of the Xin’an River Basin were analyzed. The risk hierarchy was as follows: I > As > F > Pb > NO3-N > Mn > Ni > Al > NO2-N > SO42− > Hg > Cd > Zn > Se > NH4+-N > Cu. This ranking differed significantly from the order based on the daily intake amounts of each component. Components with higher average daily intake did not necessarily pose greater health risks, due to differences in their chemical properties. For example, arsenic had a relatively low daily intake, ranking only fourth from the bottom, yet it posed the second highest health risk. Figure 9 provides a clearer depiction of each component’s contribution. As shown, i, As, and F presented the highest non-carcinogenic health risks for both adults and children, with contribution rates exceeding 15%—32.55%, 21.20%, and 15.91%, respectively—totaling 69.66%. These three components were the primary contributors to non-carcinogenic health risks in groundwater during the dry season in the Xin’an River Basin, followed by Pb and nitrate NO3-N, with contribution rates of 9.66% and 8.22%, respectively. The remaining components had relatively low contribution rates, ranging from 0.19% to 2.57%. Among the contaminants, I was identified as one of the primary pollutants exceeding acceptable levels in the groundwater, posing the highest health risk. Conversely, Mn was another significant contaminant exceeding the standards, but its associated health risk was relatively low. Although Mn does not exhibit toxic properties to the human body, it can be influenced by microbiological processes in the water supply network, leading to changes in the organoleptic properties of the water. Therefore, Mn removal from the water is necessary. Furthermore, while the vast majority of samples did not exceed the standards for As and F, these components still posed relatively high health risks. Prolonged fluoride consumption can affect the teeth, bones, reproduction, kidneys, the nervous system, gastrointestinal tract, and endocrine system [53]. Meanwhile, arsenic’s hazards to human health primarily manifest as arsenic poisoning and the development of malignant tumors, including bladder, lung, liver, and kidney cancers [54]. This phenomenon was attributed not only to the concentration of each contaminant in the groundwater but also to the differing chemical properties of each substance.
Among the various components of groundwater in the Xin’an River Basin, iodine exhibited the greatest sensitivity and contribution, posing the highest non-carcinogenic health risk. Long-term excessive iodine intake can lead to conditions such as goiter, hypothyroidism, and other disorders affecting the thyroid’s regulatory function. Additionally, it may induce or exacerbate autoimmune thyroiditis [55]. According to existing reports, China was the first country to identify endemic goiter caused by excessive iodine in water sources and currently has the largest known area affected by waterborne excessive iodine worldwide [56]. Iodine is enriched in groundwater in certain areas of the Xin’an River Basin, potentially posing a significant health risk to local populations. Therefore, it is essential to strengthen the monitoring of iodine levels in groundwater within the Xin’an River Basin.

3.3.3. Carcinogenic Health Risk

The carcinogenic health risks associated with groundwater in the Xin’an River Basin were evaluated for both adults and children. The assessment of carcinogenic risks during the dry season is detailed in Table 10. The overall carcinogenic health risk to adults from groundwater in the Xin’an River Basin was acceptable, with average CR values below 10−4. However, the risk to children was elevated, with an average CR value exceeding 10−4. The carcinogenic health risk posed by As in the groundwater of the Xin’an River Basin was significantly higher than that posed by Cd, for both adults and children.
The results of the uncertainty analysis are shown in Figure 10. The 95% percentile value of CR exceeded 10−4 for both adults and children, indicating that groundwater posed a relatively high carcinogenic health risk to humans. Among 10,000 simulated random risk values, only 13.66% of the CR values for adults exceeded 10−4, whereas 36.54% of those for children did. This indicated that the carcinogenic health risk of groundwater in the Xin’an River Basin was significantly higher for children than for adults.
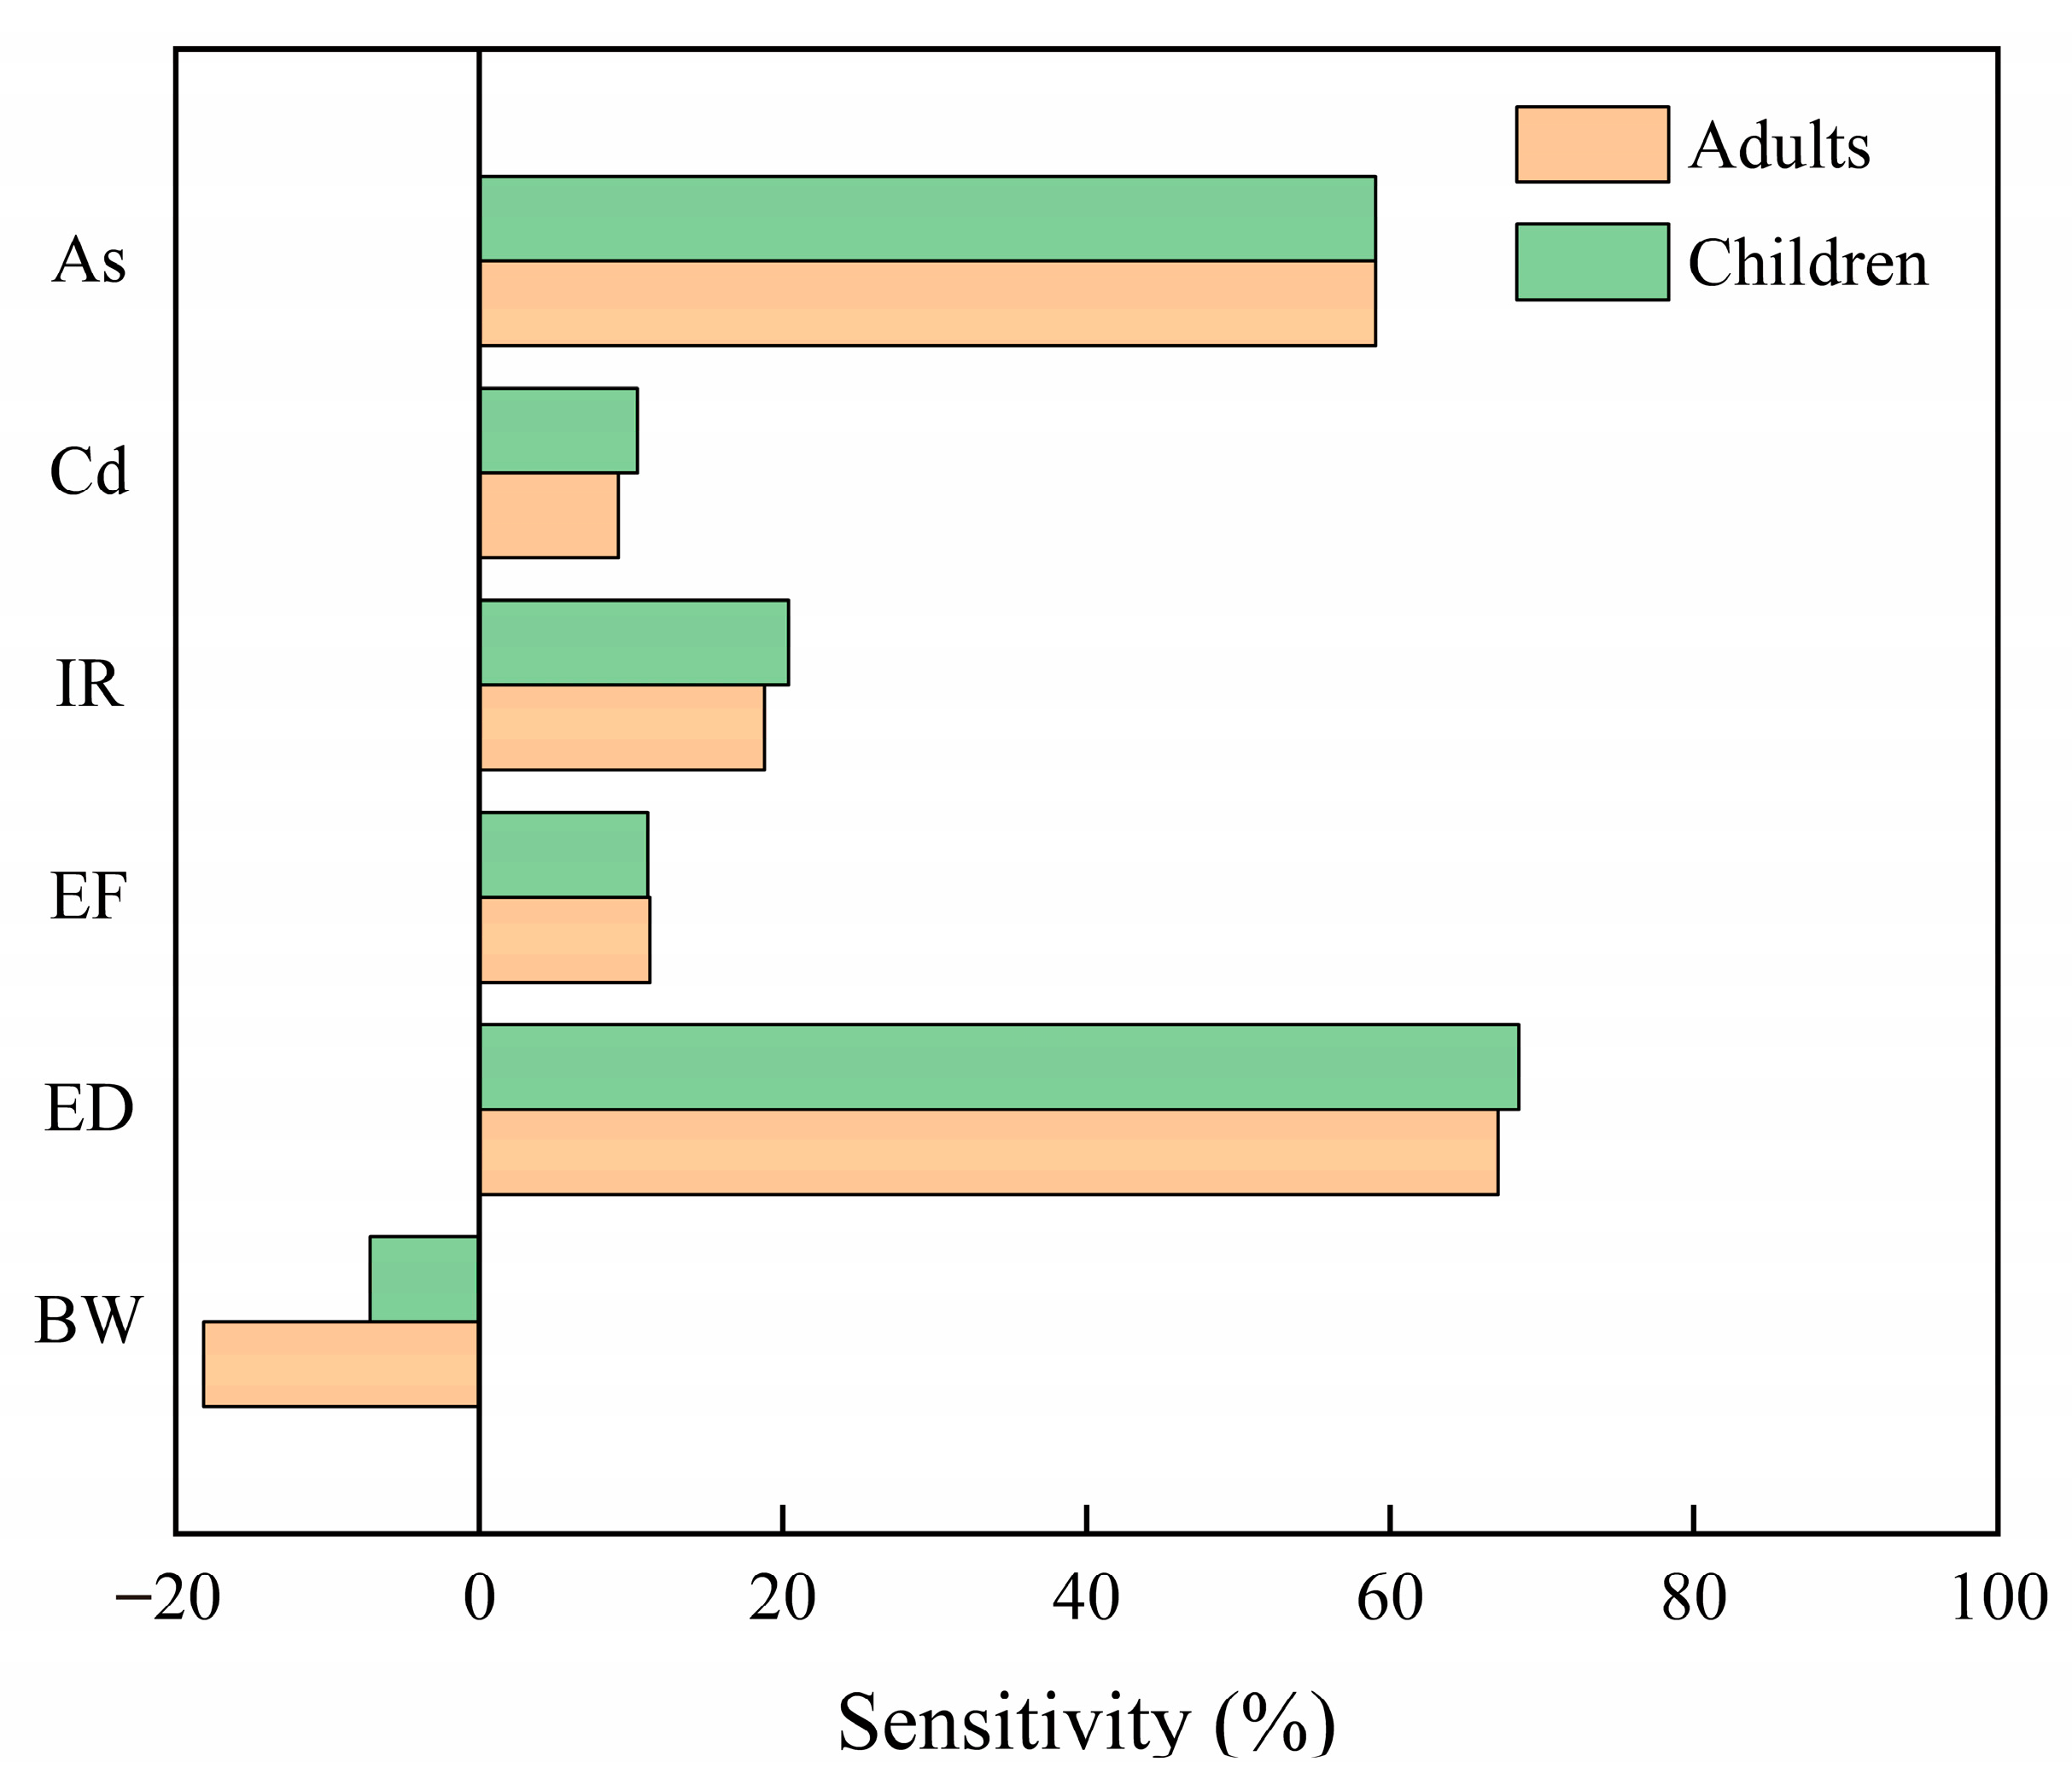
According to the sensitivity analysis (Figure 11), ED and As were the most sensitive parameters for both adults and children, with sensitivity values significantly higher than those of other parameters. Therefore, in the Xin’an River Basin, the carcinogenic health risk posed by groundwater is not only a result of long-term accumulated chronic exposure but also due to direct contact with groundwater containing high concentrations of As, which poses a relatively high risk. It is recommended to strengthen the monitoring of As levels in the groundwater of the Xin’an River Basin.

4. Conclusions

In this study, 162 groundwater samples were collected from the Xin’an River Basin during the dry season to assess the water quality and evaluate potential human health risks. The main conclusions are summarized as follows:
(1) Most groundwater samples did not exceed the prescribed concentration limits for various indicators. However, among the samples that did exceed the standards, iodine and manganese showed the highest number of exceedances, with 22 and 23 samples, respectively. The primary locations where these standards were surpassed were in the Tunxi Basin area, located in the upper reaches of the Xin’an River Basin.
(2) The groundwater quality in the Xin’an River Basin was generally good. More than 92.59% of the groundwater samples had an EWQI value below 100, while only seven samples exhibited an EWQI value above 150, primarily concentrated in the Tunxi Basin area. The components that most significantly affected groundwater quality were Mn, Al, and I.
(3) Based on the analysis of the APCS model, the poor groundwater quality at certain locations was not caused by human activities; rather, it appeared to be a natural consequence of the interaction between water and rock.
(4) The human health risks posed by groundwater in the Xin’an River Basin—both carcinogenic and non-carcinogenic—were higher for children than for adults. The long-term chronic cumulative effect was the most important factor contributing to both carcinogenic and non-carcinogenic health risks. Among the various groundwater constituents in the Xin’an River Basin, I, As, and F contributed most significantly to non-carcinogenic health risks, accounting for 32.55%, 21.20%, and 15.91%, respectively. Meanwhile, As was the most significant component contributing to carcinogenic health risks in the groundwater.
(5) In the Xin’an River Basin, iodine is enriched in groundwater in certain areas, which not only affects water quality but also poses a relatively high health risk. It is recommended that further research be conducted on the genesis mechanism of high-iodine groundwater in this area in future studies.

Author Contributions

Conceptualization, L.Z., M.Z. and Z.Z.; Formal analysis, L.Z., Z.Z., H.W. (Haiyu Wang), Y.L., W.J., X.Z., Y.S., H.W. (Hao Wu) and J.W.; Funding acquisition, B.G., B.L., Q.M. and S.L.; Investigation, L.Z., Z.Z., H.W. (Haiyu Wang), Y.L., W.J., X.Z., Y.S., H.W. (Hao Wu) and J.W.; Methodology, L.Z., M.Z. and Z.Z.; Project administration, B.G., M.Z., B.L., Q.M. and S.L.; Supervision, B.G., B.L., Q.M. and S.L.; Visualization, B.G., B.L., Q.M. and S.L.; Writing—original draft, L.Z., B.G., M.Z. and Z.Z.; Writing—review and editing, L.Z., B.G. and M.Z. All authors have read and agreed to the published version of the manuscript.

Funding

This work was funded by the Geological Survey Programs of the People’s Republic of China (DD20230511, DD20230701308, DD20242687, and DD20251300107).

Data Availability Statement

The datasets used and/or analyzed during the current study are available from the corresponding author on reasonable request.

Conflicts of Interest

The authors declare no conflict of interest.

References

  1. Zhang, Y.; He, Z.; Tian, H.; Huang, X.; Zhang, Z.; Liu, Y.; Xiao, Y.; Li, R. Hydrochemistry appraisal, quality assessment and health risk evaluation of shallow groundwater in the Mianyang area of Sichuan Basin, southwestern China. Environ. Earth Sci. 2021, 80, 576. [Google Scholar] [CrossRef]
  2. Li, Z.; Lu, C.; Zhang, Y.; Yu, X.; Gao, Q.; Yuan, Z.; Wu, C.; Liu, B.; Shu, L. Seasonal groundwater variations in the coastal plain under intense human activities: Hydrochemical evolution, quality degradation, and health risk assessment. J. Environ. Manag. 2025, 388, 126062. [Google Scholar] [CrossRef]
  3. Ren, Y.; Cao, W.; Zhao, L.; Wang, S.; Pan, D.; Zhang, L.; Li, X.; Xiao, S.; Li, Z. Environmental Factors Influencing Groundwater Quality and Health Risks in Northern Henan Plain, China. Expo. Health 2025, 17, 507–522. [Google Scholar] [CrossRef]
  4. Sidhu, J.S.; Chandel, S.; Sahoo, S.; Singh, D.; Singh, K.; Arora, M.; Kaur, H. Hydrogeochemical characterization and geospatial assessment of groundwater quality in the alluvial aquifer of southwestern Punjab in association with health risk assessment due to nitrate and fluoride pollution. Environ. Sci. Pollut. Res. 2025, 32, 11893–11920. [Google Scholar] [CrossRef]
  5. Deng, J.; Yang, G.; Yan, X.; Du, J.; Tang, Q.; Yu, C.; Pu, S. Quality evaluation and health risk assessment of karst groundwater in Southwest China. Sci. Total Environ. 2024, 946, 174371. [Google Scholar] [CrossRef]
  6. Preethi, B.; Subramani, T.; Saravanan, R.; Gopinathan, P.; Huang, Z.; Kumar, B. Health risks due to geogenic and anthropogenic influences on groundwater quality in Southern India’s hard rock terrain. J. Geochem. Explor. 2025, 274, 107762. [Google Scholar] [CrossRef]
  7. Zhang, C.; Li, X.; Hou, X.; Wang, Z.; Ma, J.; Gao, M.; Fu, C.; Bai, Z.; Gui, C.; Zuo, X. Characterization of drinking groundwater quality and assessment of human health risk in Xin’an spring basin, a typical mining and karst area of the northern China. Environ. Earth Sci. 2023, 82, 282. [Google Scholar] [CrossRef]
  8. Edzoa, R.C.; Mbog, M.B.; Tedontsah, V.P.L.; Mamdem, L.B.; Ngon, G.F.N.; Tassongwa, B.; Bitom, D.; Etame, J.; Nguedia, K.D. Influence of leachates produced by urban waste dumps on the water quality and possible risks to public health. Water Pract. Technol. 2024, 19, 82–98. [Google Scholar] [CrossRef]
  9. Panneerselvam, B.; Ravichandran, N.; Kaliyappan, S.P.; Karuppannan, S.; Bidorn, B. Quality and Health Risk Assessment of Groundwater for Drinking and Irrigation Purpose in Semi-Arid Region of India Using Entropy Water Quality and Statistical Techniques. Water 2023, 15, 601. [Google Scholar] [CrossRef]
  10. Wei, S.; Zhang, Y.; Cai, Z.; Bi, D.; Wei, H.; Zheng, X.; Man, X. Evaluation of groundwater quality and health risk assessment in Dawen River Basin, North China. Environ. Res. 2025, 264, 120292. [Google Scholar] [CrossRef]
  11. Zhang, T.; Wang, M.; He, J.; Liu, J.; Gong, L.; Xia, S. Hydrochemical characteristics, evolution and health risk assessment of surface water and groundwater in Lhasa, China. Environ. Earth Sci. 2024, 83, 166. [Google Scholar] [CrossRef]
  12. Lechhab, W.; Lechhab, T.; Tligui, Y.; Lanjri, A.F.; Allah, R.F.; Cacciola, F.; Salmoun, F. Assessing hydrogeochemical characteristics, pollution sources, water quality, and health risks in Northwest Moroccan springs using statistical analysis. Sustain. Water Resour. Manag. 2024, 10, 169. [Google Scholar] [CrossRef]
  13. An, H.; Wang, T.; Meng, X.; Niu, X.; Song, D.; Wang, Y.; Gao, G.; Li, M.; Zhang, T.; Song, H.; et al. Hydrochemical Characteristics and Controlling Factors of Hengshui Lake Wetland During the Dry Season, North China. Water 2025, 17, 1468. [Google Scholar] [CrossRef]
  14. Lv, Y.; Li, X.; Yuan, J.; Tian, H.; Wei, T.; Wang, M.; Dai, Y.; Feng, J.; Zhang, Y.; Yang, P. Hydrogeochemical Signatures and Spatiotemporal Variation of Groundwater Quality in the Upper and Lower Reaches of Rizhao Reservoir. Water 2025, 17, 1659. [Google Scholar] [CrossRef]
  15. Zohud, A.; Alam, L.; Goh, C.T. Evaluation of Groundwater Quality Using the Water Quality Index (WQI) and Human Health Risk (HHR) Assessment in West Bank, Palestine. Hydrology 2023, 10, 198. [Google Scholar] [CrossRef]
  16. Lan, T.; Wang, F.; Bao, S.; Miao, J.; Bai, Y.; Jia, S.; Cao, Y. The human health risk assessment and countermeasures study of groundwater quality. Environ. Geochem. Health 2023, 45, 3215–3228. [Google Scholar] [CrossRef]
  17. Raheja, H.; Goel, A.; Pal, M. Assessment of groundwater quality and human health risk from nitrate contamination using a multivariate statistical analysis. J. Water Health 2024, 22, 350–366. [Google Scholar] [CrossRef]
  18. Mutileni, N.; Mudau, M.; Edokpayi, J.N. Water quality, geochemistry and human health risk of groundwater in the Vyeboom region, Limpopo province, South Africa. Sci. Rep. 2023, 1, 19071. [Google Scholar] [CrossRef]
  19. Zhu, T.; Wu, Q.; Gao, S.; Zeng, J.; Linghu, K.; Zhang, X. Comparative assessment of health risks and water quality of groundwater in urban and rural Guiyang, Southwest China: Insights from PMF and Monte Carlo Simulation. Ecotoxicol. Environ. Saf. 2025, 299, 118359. [Google Scholar] [CrossRef] [PubMed]
  20. Jadoon, W.A.; Zaheer, M.; Tariq, A.; Sajjad, R.U.; Varol, M. Assessment of hydrochemical characteristics, health risks and quality of groundwater for drinking and irrigation purposes in a mountainous region of Pakistan. Environ. Sci. Pollut. Res. 2024, 31, 43967–43986. [Google Scholar] [CrossRef]
  21. Yan, Y.; Zhang, Y.; Yao, R.; Wei, C.; Luo, M.; Yang, C.; Chen, S.; Huang, X. Groundwater suitability assessment for irrigation and drinking purposes by integrating spatial analysis, machine learning, water quality index, and health risk model. Environ. Sci. Pollut. Res. 2024, 31, 39155–39176. [Google Scholar] [CrossRef]
  22. Li, Q.; Kang, X.; Lin, G.; Yang, G.; Wu, P.; Zuo, W.; Xie, T.; Liu, Y. Groundwater quality characteristics and health risk assessment in the valley plain area of the western Qinghai-Tibet plateau. J. Contam. Hydrol. 2023, 257, 104221. [Google Scholar] [CrossRef]
  23. Zahra, A.; Ali, M.; Ali, N.; Khan, A.; Zairov, R.; Sinyashin, O.; Wang, Y.; Zafar, S.; Khan, F.-A. A comprehensive analysis of the impact of arsenic, fluoride, and nitrate-nitrite dynamics on groundwater quality and its health implications. J. Hazard. Mater. 2025, 487, 137093. [Google Scholar] [CrossRef]
  24. Wang, Y.; Liu, J.; Yu, X.; Yan, Y.; Chen, Q.; Chen, S. Evaluation of groundwater quality and health risk assessment in southeastern Tibet, China. Environ. Earth Sci. 2023, 82, 455. [Google Scholar] [CrossRef]
  25. Pratap, D.V.; Singh, C.S.; Aftab, A.; Kumar, S.A. Hydrogeochemical quality investigation of groundwater resource using multivariate statistical methods, water quality indices (WQIs), and health risk assessment in Korba Coalfield Region, India. Stoch. Environ. Res. Risk Assess. 2025, 39, 937–958. [Google Scholar] [CrossRef]
  26. Yohannes, B.A.; Olli, V.; John, G.; Tafa, O.B.; Akintayo, A.M.; Peizhe, S.; Yongkui, Y.; Lin, Z. A framework for assessing freshwater vulnerability along China’s Belt and Road Initiative: An exposure, sensitivity and adaptive capacity approach. Environ. Sci. Policy 2022, 132, 247–261. [Google Scholar] [CrossRef]
  27. Ma, K.; Ren, H.; Zhou, T.; Wu, F.; Zhang, G. Water quality analysis and health risk assessment of the Lanzhou section of the Yellow River. Water Supply 2022, 22, 2024–2033. [Google Scholar] [CrossRef]
  28. Marrugo-Negrete, J.; Paternina-Uribe, R.; Enamorado-Montes, G.; Herrera-Arango, J.; Rosso-Pinto, M.; Ospino-Contreras, J.; Pinedo-Hernández, J. Groundwater quality assessment in the La Mojana region of northern Colombia: Implications for consumption, irrigation, and human health risks. Appl. Water Sci. 2024, 14, 1–15. [Google Scholar] [CrossRef]
  29. Kumari, A.; Sinha, A.; Singh, D.B.; Pasupuleti, S. Source apportionment and health risk assessment in chromite mining area: Insights from entropy water quality indexing and Monte Carlo simulation. Process Saf. Environ. Prot. 2024, 184, 526–541. [Google Scholar] [CrossRef]
  30. Zheng, Y.; Wei, D.; Gan, J.; Zou, L.; Zhu, R.; Zhang, Y. Hydrochemical insights, water quality, and human health risk assessment of groundwater in a coastal area of southeastern China. Environ. Monit. Assess. 2024, 196, 959. [Google Scholar] [CrossRef]
  31. Edjah, A.K.-M.; Banoeng-Yakubo, B.; Ewusi, A.; Sakyi-Yeboah, E.; Saka, D.; Turetta, C.; Cozzi, G.; Atta-Peters, D.; Chegbeleh, L.P. Assessment of groundwater quantity, quality, and associated health risk of the Tano river basin, Ghana. Acta Geochim. 2024, 43, 325–353. [Google Scholar] [CrossRef]
  32. Wang, Z.; Wang, Y.; Shi, M.; Ji, W.; Li, R.; Wang, X. Coordinated analysis of groundwater spatiotemporal chemical characteristics, water quality, and potential human health risks with sustainable development in semi-arid regions. Environ. Geochem. Health 2024, 46, 370. [Google Scholar] [CrossRef]
  33. Maleky, S.; Faraji, M.; Hashemi, M.; Esfandyari, A. Investigation of groundwater quality indices and health risk assessment of water resources of Jiroft city, Iran, by machine learning algorithms. Appl. Water Sci. 2025, 15, 3. [Google Scholar] [CrossRef]
  34. Kumar, A.; Singh, A. Entropy-based groundwater quality evaluation with multivariate analysis and Sobol sensitivity for non-carcinogenic health risks in mid-Gangetic plains, India. Environ. Geochem. Health 2025, 47, 186. [Google Scholar] [CrossRef]
  35. GB/T 14848-2017; Ministry of Land and Resources and Ministry of Water Resources of the People’s Republic of China. Standard for Groundwater Quality. Standards Press of China: Beijing, China, 2017.
  36. Li, S.; Su, H.; Han, F.; Li, Z. Source Identification of Trace Elements in Groundwater Combining APCS-MLR with Geographical Detector. J. Hydrol. 2023, 623, 129771. [Google Scholar] [CrossRef]
  37. Ruan, D.; Bian, J.; Wang, Y.; Wu, J.; Gu, Z. Identification of groundwater pollution sources and health risk assessment in the Songnen Plain based on PCA-APCS-MLR and trapezoidal fuzzy number-Monte Carlo stochastic simulation model. J. Hydrol. 2024, 632, 130897. [Google Scholar] [CrossRef]
  38. Bouselsal, B.; Satouh, A.; Egbueri, J.C. Evaluating water quality, mineralization mechanisms, and potential health risks of nitrate contamination in the Continental Intercalaire aquifer of Reggane, Algeria. Environ. Earth Sci. 2024, 83, 539. [Google Scholar] [CrossRef]
  39. Hou, Q.; Pan, Y.; Zeng, M.; Wang, S.; Shi, H.; Huang, C.; Peng, H. Assessment of groundwater hydrochemistry, water quality, and health risk in Hainan Island, China. Sci. Rep. 2023, 13, 12104. [Google Scholar] [CrossRef]
  40. Dasari, B.M.; Aradhi, K.K.; Banothu, D.; Kurakalva, R.M. Assessment of groundwater quality, source identification, and health risk around oil and gas drilling sites. Environ. Earth Sci. 2024, 83, 312. [Google Scholar] [CrossRef]
  41. Wang, S.; Chen, J.; Zhang, S.; Bai, Y.; Zhang, X.; Jiang, W.; Yang, S. Shallow groundwater quality and health risk assessment of fluoride and arsenic in Northwestern Jiangsu Province, China. Appl. Water Sci. 2024, 14, 119. [Google Scholar] [CrossRef]
  42. Maurya, S.; More, A.B.; Gupta, G.; Saxena, A.; Singh, A. Hydrochemical Evaluation of Groundwater Quality and Human Health Risk Assessment of Fluoride and Nitrate: A Case Study of Pratapgarh District UP, India. Water Air Soil Pollut. 2025, 236, 204. [Google Scholar] [CrossRef]
  43. Yang, L.; Wu, Q.; Gao, S.; Peng, M.; Zhu, J.; Zeng, J.; Shi, L.; Li, X. Assessment of trace elements contamination and human health risk based on Monte Carlo simulation in a karst groundwater system affected by industrial activities. Ecotoxicol. Environ. Saf. 2024, 290, 117550. [Google Scholar] [CrossRef] [PubMed]
  44. Vesković, J.; Miletić, A.; Lučić, M.; Onjia, A. Appraisal of contamination, hydrogeochemistry, and Monte Carlo simulation of health risks of groundwater in a lithium-rich ore area. Environ. Geochem. Health 2024, 46, 468. [Google Scholar] [CrossRef]
  45. Lei, M.; Zhou, J.; Zhou, Y.; Sun, Y.; Ji, Y.; Zeng, Y. Spatial distribution, source apportionment and health risk assessment of inorganic pollutants of surface water and groundwater in the southern margin of Junggar Basin, Xinjiang, China. J. Environ. Manag. 2022, 319, 115757. [Google Scholar] [CrossRef]
  46. Elbarghmi, R.; Ghalit, M.; Abourrich, M.; El khalki, S.; Jodeh, S.; Azzaoui, K.; Lamhamdi, A. Assessment of groundwater quality and health risks in Ketama region (intrarif), Morocco. Environ. Syst. Res. 2024, 13, 30. [Google Scholar] [CrossRef]
  47. Rahman, S.M.; Masum, H.; Ishtiaque, A.; Sarwar, S.; Hussam, A. Water quality index and health risk assessment for heavy metals in groundwater of Kashiani and Kotalipara upazila, Gopalganj, Bangladesh. Appl. Water Sci. 2024, 14, 106. [Google Scholar] [CrossRef]
  48. Zhao, L.; Wang, Z.; Kong, L.; Zhao, Z.; Geng, B.; Gu, S.; Li, Y.; Han, X.; Liu, S.; Li, B.; et al. Risk assessment of soil heavy metals in mining activity areas: A case study in Eastern Shandong Province, China. Environ. Earth Sci. 2023, 82, 513. [Google Scholar] [CrossRef]
  49. Fan, B.L.; Zhao, Z.Q.; Tao, F.X.; Liu, B.J.; Tao, Z.H.; Gao, S.; Zhang, L.H. Characteristics of carbonate, evaporite and silicate weathering in Huanghe River basin: A comparison among the upstream, midstream and downstream. J. Asian Earth Sci. 2014, 96, 17–26. [Google Scholar] [CrossRef]
  50. Edet, A.; Ukpong, A.; Ekwere, A.; Wiche, O.; Nganje, T.; Adamu, C.; Kudamnya, E. Assessment of surface water and groundwater quality and their associated human health risks around dumpsites, Cross River State, Southern Nigeria. Environ. Earth Sci. 2025, 84, 234. [Google Scholar] [CrossRef]
  51. Gibbs, R.J. Mechanisms controlling world water chemistry. Science 1970, 170, 1088–1090. [Google Scholar] [CrossRef]
  52. Kong, L.; Chu, H.; Hou, G.; Zeng, J.; Zhao, L.; Han, X.; Li, Y.; Zhou, F.; Yin, M.; Zhang, X. Characteristics and mechanisms of sea (salt) water intrusion in Laizhou City, Shandong Province, China. Front. Mar. Sci. 2025, 12, 1578175. [Google Scholar] [CrossRef]
  53. Zheng, Z.; Li, P.; Elumalai, V.; Zhou, T. Impacts of Land Use/Land Cover Changes on Groundwater Fluoride and Arsenic Levels: A Case Study in the Central Yinchuan Plain, China. Expo. Health 2025, 17, 1095–1110. [Google Scholar] [CrossRef]
  54. Alarcón-Herrera, M.T.; Martin-Alarcon, D.A.; Gutiérrez, M.; Reynoso-Cuevas, L.; Martín-Domínguez, A.; Olmos-Márquez, M.A.; Bundschuh, J. Co-occurrence, possible origin, and health-risk assessment of arsenic and fluoride in drinking water sources in Mexico: Geographical data visualization. Sci. Total Environ. 2020, 698, 134168. [Google Scholar] [CrossRef] [PubMed]
  55. Wang, Y.; Li, J.; Xie, X. Genesis and occurrence of high iodine groundwater. Earth Sci. Front. 2022, 29, 1–10. [Google Scholar] [CrossRef]
  56. Li, J.; Zhao, S.; Jiang, Z.; Xie, X.; Deng, Y.; Shi, L.; Kappler, A.; Van Cappellen, P.; Wang, Y. Spatial distribution and formation mechanisms of high-iodine groundwater throughout China. Earth-Sci. Rev. 2025, 265, 105134. [Google Scholar] [CrossRef]
Figure 1. Map of the Xin’an River Basin. (a) Map of China; (b) Location of the Xin’an River Basin; (c) Distribution map of groundwater sample sites.
Water 17 02412 g001
Figure 2. Gibbs Diagram of Groundwater in the Xin’an River Basin. (a) The relationship between TDS and Na+/(Na+ + Ca2+). (b) The relationship between TDS and Cl/(Cl + HCO3).
Water 17 02412 g002
Figure 3. The Relationship Between Ion Ratios of Groundwater in the Xin’an River Basin. (a) The relationship between (Ca2+ + Mg2+) and HCO3. (b) The relationship between (Ca2+ + Mg2+) and (HCO3 + SO42−). (c) The relationship between Na+ and Cl. (d) The relationship between (SO42− + Cl) and HCO3.
Water 17 02412 g003
Figure 4. Entropy-Weighted Groundwater Quality Map of the Xin’an River Basin.
Water 17 02412 g004
Figure 5. Comparison of measured and predicted concentrations of the indicators.
Water 17 02412 g005aWater 17 02412 g005b
Figure 6. Source Analysis of the Main Components in Groundwater in the Xin’an River Basin.
Water 17 02412 g006
Figure 7. Uncertainty Analysis of the Non-carcinogenic Health Risk of Groundwater During the Dry Season in the Xin’an River Basin.
Water 17 02412 g007
Figure 8. Sensitivity Analysis of the Non-carcinogenic Health Risk of Groundwater During the Dry Season in the Xin’an River Basin.
Water 17 02412 g008
Figure 9. The Contribution of Each Component in Groundwater During the Dry Season in the Xin’an River Basin to Human Health Risks.
Water 17 02412 g009
Figure 10. Uncertainty Analysis of Carcinogenic Health Risks of Groundwater During the Dry Season in the Xin’an River Basin.
Water 17 02412 g010
Figure 11. Sensitivity Analysis of Carcinogenic Health Risks of Groundwater During the Dry Season in the Xin’an River Basin.
Water 17 02412 g011
Table 1. Test Method and Detection Limit of Each Indicator.
IndicatorTest MethodDetection LimitIndicatorTest MethodDetection Limit
Ca2+Inductively Coupled Plasma Optical Emission Spectrometer (ICP-OES)0.004AlInductively Coupled Plasma Mass Spectrometry (ICP-MS)0.009
Mg2+0.01Ni0.007
Na+0.01Zn0.001
K+0.01Cu0.006
HCO35Cd0.002
Mn0.01Pb0.05
HgAtomic Fluorescence Spectroscopy (AFS)0.0001TH10
As0.001SO42−Ion Chromatograph (ICS)0.2
Se0.03Cl0.1
NO2-NUltraviolet-Visible Spectroscopy (UV-Vis)0.005NO3-N0.02
NH4+-N0.007F0.006
I0.025TDS4
pHGlass Electrode (GE)0.1
Note: All the detection limits are denoted in mg/L except pH (no units).
Table 2. Grade Classification of EWQI.
EWQIGradesClassifications
EWQI ≤ 50IExcellent
50 < EWQI ≤ I100IIGood
100 < EWQI ≤ 150IIIMedium
150 < EWQI ≤ 200IVPoor
EWQI > 200VExtremely poor
Table 3. Corresponding reference dose (RFD) and slope factor (SF) values.
IndexRfDIndexRfDIndexRfDIndexRfDIndexSF
As0.0003I0.01Zn0.3Se0.005As1.5
Cd0.0005F0.04Ni0.02SO42−120Cd6.1
Al0.14NO31.6Mn0.14Pb0.0014
Cu0.04NO20.1Hg0.0003NH4+0.97
Note: The unit of RfD is mg·(kg·d)−1, and the unit of SF is kg·d·mg−1.
Table 4. Parameter Values Associated with Health Risk Assessment Methods.
ParametersMeaningRegularities of DistributionReference ValuesUnits
AdultsChildren
IRDaily ingestion rateLogarithmic normal distribution(1.23,0.27)(1.12,0.27)L∙d−1
EFExposure durationTriangular distribution(180,350,365)(180,350,365)d∙a−1
BWThe average weightNormal distribution(56.4,11.9)(16.68,1.48)kg
EDExposure durationUniform distribution(0,70)(0,10)a
ATAverage exposure timePoint109502190d
CwConcentration of each componentDetermined through fittingMeasuredMeasuredmg∙L−1
Table 5. Concentration Statistics for Each Index of Groundwater Samples.
MinMaxAVSDCVSKKUSTDSEL
pH6.139.077.3680.3825.18%0.3373.2266.50–8.504
Ca2+3.1320842.54833.26578.18%1.4743.5882001
Mg2+0.51773.85.9266.632111.91%6.99468.3351500
Na+0.6585110.0118.72987.19%2.296.6952000
K+0.0722.34.4255.020113.44%1.7682.723--
HCO39.52558138.79098.13770.71%1.1411.36--
SO42−0.34354422.96146.706203.41%9.00397.4732501
Cl0.00758.610.86710.71498.59%1.5982.6632500
NO3-N0.06216.3032.8112.870102.09%1.9144.424200
NO2-N0.0050.6670.0390.097247.85%4.07524.6301.00
NH4+-N0.0073.710.0840.307367.41%10.675123.2590.52
I0.0251.90.0740.204276.51%7.98666.2160.00822
Mn0.013.750.1200.454376.87%6.51645.3480.123
Al0.0090.6510.0640.095148.05%3.31213.1170.211
Ni0.000060.2290.00580.0188322.15%10.647125.5140.026
Zn0.000671.4550.0470.117245.75%11.065133.491.01
Cu0.000080.0320.00160.0035217.81%6.17346.061.00
Cd0.000050.000670.00010.0001106.99%4.97527.5620.0050
Pb0.000090.007120.00290.001965.09%−0.151−1.1920.010
Hg0.000040.008790.00010.0007678.97%12.582159.3760.0011
As0.00030.02040.00150.0024158.12%4.34124.9510.013
Se0.00040.01290.00060.0010178.19%11.804145.8380.011
F0.0062.120.1420.177124.56%8.89196.9961.001
TDS8528157.34399.07962.97%0.8880.52310000
TH8.01524119.43785.22771.36%1.2392.3984501
Notes: Min, Max, AV, SD, CV, SK, and KU denote minimum, maximum, average, standard deviation, coefficient of variation, skewness, and kurtosis. STD is the standard for groundwater quality in China (GB/T-14848, 2017). SEL denotes the number of samples exceeding acceptable limit. All concentrations are denoted in mg/L except pH (no units). “-” means that the data is not available.
Table 6. The result of the correlation analysis.
Correlation
EWQIpHCa2+Mg2+Na+K+HCO3SO42−ClNO3-NNO2-NNH4+-NIMnAlNiZnCuCdPbHgAsSeFTDSTH
EWQI1
pH−0.0461
Ca2+0.1930.303 **1
Mg2+0.250 *0.1710.551 **1
Na+0.277 *0.342 **0.243 *0.381 **1
K+−0.0670.068−0.011−0.043−0.1391
HCO30.292 *0.335 **0.911 **0.609 **0.383 **−0.0821
SO42−0.1360.1450.531 **0.462 **0.1850.20.346 **1
Cl0.272 *0.190.281 *0.495 **0.545 **0.080.294 **0.255 *1
NO3-N−0.056−0.045−0.0210.0580.12−0.047−0.1760.0320.313 **1
NO2-N0.262 *−0.0510.256 *0.1380.307 **−0.1610.1930.1310.343 **0.1961
NH4+-N0.0420.356 **−0.103−0.0780.393 **−0.118−0.0130.019−0.038−0.0930.0571
I0.307 **0.0470.130.0460.341 **0.0010.1030.1650.373 **0.1970.103−0.0221
Mn0.972 **−0.0830.1480.229 *0.179−0.0650.264 *0.0740.174−0.1320.226 *0.0160.0811
Al0.609 **−0.003−0.0190.1010.111−0.1290.027−0.0440.169−0.0450.267 *−0.0250.0140.627 **1
Ni0.0360.331 **0.1210.170.0630.1120.0820.400 **−0.01−0.132−0.120.1030.0320.0140.0271
Zn−0.0390.2040.033−0.0290.206−0.138−0.0050.133−0.0070.0060.2010.468 **−0.072−0.0520.1120.2041
Cu0.0690.1020.097−0.070.342 **−0.140.051−0.0020.1340.316 **0.1770.0170.356 **−0.0270.1720.0360.0641
Cd0.0050.0730.230 *0−0.098−0.0560.1270.131−0.092−0.082−0.032−0.0450.136−0.0290.0270.321 **0.1950.111
Pb−0.0070.260 *−0.089−0.0020.10.149−0.042−0.010.1570.069−0.412 **−0.0970.186−0.046−0.070.287 *−0.241 *0.1170.1211
Hg0.019−0.0050.226 *0.1520.131−0.1010.228 *0.0320.132−0.1040.516 **0.075−0.0320.021−0.06−0.054−0.0540.017−0.032−0.2051
As0.240 *0.1170.1940.0580.196−0.0270.262 *0.076−0.030.116−0.044−0.0460.0170.246 *−0.059−0.056−0.1680.12−0.090.228 *−0.0871
Se−0.0760.0140.210.0560.013−0.1280.1130.0580.1090.1910.132−0.067−0.04−0.079−0.073−0.0660.1430.0740.262 *−0.059−0.0170.041
F−0.0560.034−0.0420.0040.0270.228 *−0.0060.1680.034−0.212−0.1160.02−0.021−0.054−0.0070.193−0.037−0.1710.010.178−0.113−0.063−0.0181
TDS0.1560.237 *0.663 **0.479 **0.408 **−0.1390.626 **0.383 **0.295 **0.1170.383 **0.10.1630.095−0.0090.0430.293 *0.1880.112−0.268 *0.2160.1540.144−0.275 *10.622 **
TH0.110.280 *0.874 **0.638 **0.293 *0.0210.822 **0.615 **0.333 **0.0830.196−0.0740.1310.057−0.1440.17−0.0410.084−0.048−0.0840.1720.247 *0.107−0.0030.622 **1
Note: ** At the 0.01 level (two-tailed), the correlation was significant. * At level 0.05 (two-tailed), the correlation was significant.
Table 7. The results of principal component analysis.
IndicatorsPrincipal Component
1234
Ca2+0.9290.061−0.0180.013
Mg2+0.7500.2500.1590.021
Na+0.2840.7420.091−0.227
K+−0.047−0.017−0.0560.920
HCO30.9080.1080.076−0.147
SO42−0.6100.155−0.0380.468
Cl0.2780.7600.1670.138
I−0.0410.773−0.0480.068
Mn0.1740.0660.878−0.011
Al−0.0520.0590.906−0.067
Feature Value2.8171.8361.6661.167
Accumulation(%)28.16618.35716.6611.672
Table 8. Daily intake scale of each component in groundwater during the dry season in the Xin’an River Basin.
IndexNH4+-NSO42−FNO2-NNO3-NAlMnNiI
Adults1.39 × 10−30.492.97 × 10−37.26 × 10−46.14 × 10−21.28 × 10−31.68 × 10−32.21 × 10−41.52 × 10−3
Children2.94 × 10−31.016.30 × 10−31.64 × 10−31.28 × 10−12.78 × 10−33.80 × 10−34.40 × 10−43.28 × 10−3
IndexZnCuCdPbHgAsSeADD
Adults9.68 × 10−43.50 × 10−51.64 × 10−66.32 × 10−51.06 × 10−62.97 × 10−51.09 × 10−50.56
Children1.99 × 10−37.34 × 10−53.48 × 10−61.33 × 10−42.32 × 10−66.26 × 10−52.31 × 10−51.16
Table 9. Non-carcinogenic Health Risks Associated with Groundwater Components During the Dry Season in the Xin’an River Basin.
IndexNH4+-NSO42F
statisticMean95% Confidence IntervalMean95% Confidence IntervalMean95% Confidence Interval
Adults1.44 × 10−3(3.71 × 10⁻⁵, 5.31 × 10⁻³)4.09 × 10⁻³(1.20 × 10⁻⁴, 1.49 × 10⁻²)7.43 × 10⁻²(4.52 × 10⁻³, 2.27 × 10⁻¹)
Children3.03 × 10−3(7.59 × 10⁻⁵, 1.14 × 10⁻²)8.40 × 10⁻³(2.55 × 10⁻⁴, 3.04 × 10⁻²)1.57 × 10⁻¹(9.23 × 10⁻³, 4.82 × 10⁻¹)
IndexINO2-NNO3-N
statisticMean95% Confidence IntervalMean95% Confidence IntervalMean95% Confidence Interval
Adults1.52 × 10−1(7.26 × 10⁻³, 4.53 × 10⁻¹)7.26 × 10⁻³(1.51 × 10⁻⁴, 2.25 × 10⁻²)3.84 × 10⁻²(7.09 × 10⁻⁴, 1.42 × 10⁻¹)
Children3.28 × 10−1(1.43 × 10⁻², 9.85 × 10⁻¹)1.64 × 10⁻²(3.16 × 10⁻⁴, 4.97 × 10⁻²)7.98 × 10⁻²(1.43 × 10⁻³, 2.94 × 10⁻¹)
IndexAlMnNi
statisticMean95% Confidence IntervalMean95% Confidence IntervalMean95% Confidence Interval
Adults9.15 × 10−3(2.58 × 10⁻⁴, 3.41 × 10⁻²)1.20 × 10⁻²(2.24 × 10⁻⁴, 3.73 × 10⁻²)1.11 × 10⁻²(2.67 × 10⁻⁵, 3.72 × 10⁻²)
Children1.99 × 10−2(5.02 × 10⁻⁴, 7.35 × 10⁻²)2.71 × 10⁻²(4.54 × 10⁻⁴, 8.28 × 10⁻²)2.20 × 10⁻²(6.01 × 10⁻⁵, 8.23 × 10⁻²)
IndexZnCuCd
statisticMean95% Confidence IntervalMean95% Confidence IntervalMean95% Confidence Interval
Adults3.23 × 10−3(1.07 × 10⁻⁴, 1.21 × 10⁻²)8.75 × 10⁻⁴(1.12 × 10⁻⁵, 3.49 × 10⁻³)3.28 × 10⁻³(2.39 × 10⁻⁴, 9.21 × 10⁻²)
Children6.63 × 10−3(2.31 × 10−4,2.45 × 10−2)1.83 × 10⁻³(2.29 × 10⁻⁵, 7.51 × 10⁻³)6.93 × 10⁻³(4.71 × 10⁻⁴, 1.95 × 10⁻²)
IndexPbHgAs
statisticMean95% Confidence IntervalMean95% Confidence IntervalMean95% Confidence Interval
Adults4.51 × 10−2(1.49 × 10⁻³, 1.40 × 10⁻¹)3.54 × 10⁻³(2.67 × 10⁻⁴, 7.47 × 10⁻³)9.90 × 10⁻²(3.46 × 10⁻³, 3.55 × 10⁻¹)
Children9.48 × 10−2(3.21 × 10⁻³, 2.91 × 10⁻¹)7.72 × 10⁻³(5.64 × 10⁻⁴, 1.48 × 10⁻²)2.09 × 10⁻¹(7.52 × 10⁻³, 7.15 × 10⁻¹)
IndexSeHQ
statisticMean95% Confidence IntervalMean95% Confidence Interval
Adults2.19 × 10−3(1.69 × 10⁻⁴, 5.79 × 10⁻³)0.467(0.032, 1.25)
Children4.61 × 10−3(3.52 × 10⁻⁴, 1.20 × 10⁻²)0.993(0.066, 2.58)
Table 10. Carcinogenic Health Risks Associated with Groundwater Components During the Dry Season in the Xin’an River Basin.
IndexAsCdCR
statisticMean95% Confidence IntervalMean95% Confidence IntervalMean95% Confidence Interval
Adults4.46 × 10−5(1.56 × 10⁻⁶, 1.60 × 10⁻⁴)1.00 × 10⁻⁵(7.28 × 10⁻⁷, 2.81 × 10⁻⁵)5.46 × 10⁻⁵(2.79 × 10⁻⁶, 1.80 × 10⁻⁴)
Children9.38 × 10−5(3.39 × 10⁻⁶, 3.22 × 10⁻⁴)2.12 × 10⁻⁵(1.44 × 10⁻⁶, 5.94 × 10⁻⁵)1.15 × 10⁻⁴(5.92 × 10⁻⁶, 3.68 × 10⁻⁴)
Disclaimer/Publisher’s Note: The statements, opinions and data contained in all publications are solely those of the individual author(s) and contributor(s) and not of MDPI and/or the editor(s). MDPI and/or the editor(s) disclaim responsibility for any injury to people or property resulting from any ideas, methods, instructions or products referred to in the content.