1. Introduction
Cadmium (Cd), a toxic and persistent heavy metal (HM), increasingly threatens agricultural systems by accumulating in soil and water sources and, ultimately, entering the food chain, compromising both food safety and human health. Among HMs, cadmium stands out as a particularly hazardous metal; in fact, a significant difference between cadmium and other hazardous elements, like mercury (Hg) or arsenic (As), lies in its rapid bioaccumulation within plant tissues, making vegetables a principal conduit for human dietary exposure. As a matter of fact, in Cd-polluted environments, crops like rice readily accumulate cadmium, leading to an elevated daily intake for consumers [
1,
2]. Within plants, Cd ions disrupt protein function by replacing essential metals, like zinc (Zn), calcium (Ca), and iron (Fe), and by reacting with sulphur-containing proteins. Consequently, these interferences, along with Cd ions, impact mitochondrial electron transport and water movement, triggering an increase in proline levels [
3]. Long-term exposure poses significant health risks for humans, including an elevated likelihood of cancer, renal dysfunction, hypertension, damage to the immune and nervous systems, skeletal lesions, and teratogenic effects [
4,
5].
Cadmium naturally exists in the environment in an inorganic form and is primarily released into soil and water through volcanic emissions and the weathering of rocks. However, anthropogenic activities represent the primary source of cadmium contamination, significantly increasing the background levels of cadmium in soil, water, and living organisms [
6]. Cadmium is realized through various industrial processes, including metal smelting and refining and the production of batteries, where it occurs as a secondary byproduct [
7]. Wastewater discharges from these industries introduce significant amounts of this noxious waste into nearby soils and water bodies. Moreover, the mishandling and inadequate recycling of electronic waste contributes to the release of cadmium along with other toxic compounds. Also mining activities focused on extracting zinc, lead, and copper ores can also result in considerable cadmium contamination. In addition, the burning of fossil fuels in power generation, transportation, and industrial operations emits cadmium-containing particulate matter and gases. Urban development further exacerbates cadmium pollution as stormwater runs off from paved surfaces and transports contaminants from cities into adjacent aquatic environments. Finally, certain fertilizers, particularly phosphate-based ones, contain cadmium impurities that can accumulate in agricultural soils; this accumulation not only poses risks to soil quality for agricultural cultivation but also increases the potential for cadmium leaching into groundwater resources [
3].
The World Health Organization (WHO) has set a guideline value of 3 µg/L for cadmium in drinking water [
8]. Following this low Limit of Detection (LoD) for safe tap water, the European Commission enforced strict cadmium monitoring for water safety in different fields, recognizing it as a priority hazardous substance under the European Water Framework Directive [
9]. Moreover, the European Groundwater Directive (EC, 2006) required European Union (EU) member states to define groundwater Cd thresholds. This resulted in national values spanning from 0.08 to 27 µg/L, reflecting varied determination procedures [
10]. These regulatory frameworks commonly aim to control cadmium output from sectors like industry, agriculture, and e-waste disposal.
Managing this metal environmentally effectively requires a multifaceted strategy encompassing several domains [
3]. A primary research area involves advanced remediation technologies that utilize nanotechnology and bioprocesses to eliminate this contaminant through mechanisms such as precipitation, coagulation–sedimentation, reverse osmosis, ion exchange, and material-based adsorption in combination with advanced materials, such as nano-metal oxides [
11], carbon nanotube (CNT)–powdered activated carbon (PAC) composites [
12] or bacterial cellulose membranes [
13]. Alongside these technological solutions, promoting sustainable practices through in situ monitoring is crucial. Emerging research indicates that mineral phosphate fertilizers account for approximately 45% of cadmium input into agricultural soils in the EU; in this context, adopting eco-friendly farming practices and dropping the application of cadmium-rich phosphate fertilizers is mandatory to reduce further environmental contamination and human exposure [
14]. Furthermore, the development and implementation of standardized international regulations are crucial for a cohesive global approach to cadmium control. Lastly, robust monitoring and surveillance systems are indispensable for tracking cadmium concentrations in various environmental segments, enabling early detection of rising levels and the timely prevention of ecological damage [
15].
The development of a monitoring system is feasible through the integration of dedicated custom sensors designed for quantitative analytical assessment. These sensors, once appropriately configured with predefined alarm thresholds, enable the effective identification of environmental contamination. The analytical methodologies used arise on well-established laboratory techniques, such as atomic absorption spectrometry (AAS) [
16], inductively coupled plasma atomic emission spectroscopy (ICP-AES), inductively coupled plasma–mass spectrometry (ICP-MS) [
17], UV-Vis colorimetry–spectroscopy, and a variety of electrochemical approaches [
4,
18]. Despite their capabilities, the cost, operational complexity, and requirement for specialized training severely restrict the broader implementation of these instruments as in-field sensors. Moreover, the direct scaling down of existing laboratory-based Cd(II) detection methods into portable, in situ devices poses considerable difficulties. These challenges often arise from the demanding need to concurrently optimize sensitivity, selectivity, speed, robustness, and ease of use within a reduced footprint and less regulated conditions. Therefore, screening and selection of the most suitable analytical techniques is required. To this end,
Table 1 outlines the most common analytical procedures for prototyping in-field monitoring sensors. Most of these sensors can be broadly categorized into electrochemical and optical methodologies, both capable of achieving trace-level detection of most heavy metals.
Among the aforementioned laboratory techniques suitable for monitoring in the field, electrochemical approaches are particularly well-suited for the development of portable sensors [
23]. This preference occurs from the advantages of electrochemical techniques, such as their high sensitivity, selectivity, time efficiency, and cost-effectiveness, when compared to the other analytical approaches mentioned. Electrochemistry encompasses various techniques, including square wave voltammetry (SWV), differential pulse voltammetry (DPV), anodic stripping voltammetry (ASV), linear sweep voltammetry (LSV), and cyclic voltammetry (CV). Notably, ASV has been the most frequently employed electrochemical technique for Cd(II) detection over the past five years [
4]. Stripping voltammetry produces an analytical signal through a distinct two-phase mechanism. First, during pre-concentration, the working electrode (WE) is usually specifically modified to facilitate the electrochemical accumulation and reduction of cadmium ions (Cd
2+) to elemental cadmium (Cd
0). This deposition occurs under precisely controlled conditions of constant potential and time. Advancements in WE modification frequently involve the direct immobilization of polymers via electro-polymerization. This technique effectively generates a uniform polymer film on the electrode surface, which significantly enhances its stability and reproducibility while also increasing the density of active sites. To further optimize the characteristics of these polymer-based electrodes, suitable nanomaterials are commonly incorporated and blended with the polymer matrix [
28,
29]. Metal-organic frameworks (MOFs) are another exciting option for electrode modification. They have garnered significant interest thanks to their impressive characteristics: large pore volumes, high surface areas, inherent porosity, and especially tunable structures. Their application might be serving a twofold objective: detection and adsorption [
30,
31,
32]. Another effective way to modify working electrodes is through the integration of electron-rich organic molecules. Receptors containing elements like nitrogen (N), oxygen (O), and sulphur (S) are particularly favoured because they exhibit strong and selective binding capabilities with metal ions [
33]. Modified carbon-based working electrodes (WEs) are the most widespread choice for detecting HMs and Cd (II) ions, especially for field detection, using screen-printed electrode (SPE) configurations [
34]. The most common modification for WE in these sensors involves using a thin film of mercury (Hg) [
35]. While Hg offers excellent electrochemical performance and a broad electrochemical window, it comes with the drawback of being an environmentally unfriendly choice. Bismuth (Bi) presents a non-toxic and non-carcinogenic alternative [
35,
36]. However, its practical application is significantly hampered by its inherently low conductivity and tendency to aggregate, which restricts its electrochemical performance. A common strategy to overcome these limitations is to hybridize bismuth with effective conductive materials [
4,
35].
In the second step of ASV analysis, the re-oxidation involves an anodic voltage scan that converts the deposited Cd0 back to Cd2+. This rapid electrochemical reaction generates a strong oxidation peak current directly proportional to the concentration of Cd2+.
This detection method is quite simple; however, it provides two crucial pieces of information from the resulting voltammogram: the peak position, which serves to identify the presence of ions, and the peak current, which enables the accurate quantification of Cd(II) concentration.
The convergence of electrochemistry with microfluidics represents a significant technological advancement, where the inherent versatility and robustness of electrochemical methods facilitate their seamless integration into custom-designed microfluidic architectures [
37]. This synergy has been particularly transformative for environmental monitoring. Specifically, microfluidic devices for heavy metal ion detection are engineered as portable, low-cost, and user-friendly alternatives to conventional laboratory techniques. This presents a paradigm shift away from the limitations of the previously named laboratory methods, which are typically expensive, require bulky equipment, and demand operation by highly trained personnel [
38]. Among the various device architectures, Lab-on-a-Chip (LOC) systems, which are a key application within the broader field of Micro-Electro-Mechanical Systems (MEMS), have become particularly prevalent. The choice of the substrate material for fabricating these devices is a critical determinant of both their ultimate performance and their manufacturability. Polydimethylsiloxane (PDMS) has emerged as a favoured material in research and development, largely due to a unique combination of beneficial properties [
39]. Its well-documented biocompatibility, low material cost, and high optical transparency are significant advantages [
40]. Furthermore, its amenability to rapid prototyping allows researchers to move from design to functional device with exceptional speed and ease.
A 3D-printing methodology was adopted to fabricate an integrated microfluidic electrochemical sensor for cadmium Cd(II) analysis. The device incorporates a flexible screen-printed electrode (SPE) modified with porous Mn
2O
3 derived from a manganese-containing metal-organic framework (Mn-MOF). The design was further refined by optimizing the microfluidic cell’s velocity profiles via the finite element method (FEM). The resulting sensor system achieved an estimated limit of detection of 0.5 μg L
−1 [
41]. Graphene oxide (GO)–aptamer sensors were integrated into a PDMS microfluidic platform to achieve simultaneous detection of Hg
2+ and Pb
2+. The sensor demonstrated high sensitivity, with reported detection limits of 0.70 ppb (Hg
2+) and 0.53 ppb (Pb
2+) [
42]. Also, the development of a complete LOC microsystem for heavy metal analysis was developed by coupling a pre-concentration unit with a mercury-free electrochemical detector. The pre-concentration stage utilized a microelectrodialyser with a 6 μL active volume, which was fabricated using ion-exchange membranes and platinum electrodes. For the detection stage, a boron-doped diamond (BDD) electrode was investigated for Pb
2+ analysis via square-wave anodic stripping voltammetry (SWASV). The BDD electrode provided stable, linear detection within the 20 to 100 ppb range, confirming its feasibility of the integrated system for environmental analysis [
43]. To address the challenges of in-field water quality surveillance, a portable system was engineered around a modular microfluidic platform integrated with a sensitive electrochemical sensor for As(III) detection. A key feature of the system is its flexible, transparent microfluidic modules, fabricated by rapid prototyping, which allow for automated sample handling and analysis. The sensing element is a gold nanoparticle (AuNP)-modified gold thin-film electrode that is reversibly placed within a flow cell. The complete system demonstrated a detection limit of 0.42 μg L
−1 for As(III) [
44].
While the scientific literature presents a growing number of microfluidic systems for heavy metal detection, reflecting significant technological advancements in the precise identification of contaminants, through functionalization of electrodes or enhancing cell design also with innovative materials, many commercially available options rely on monolithic “bulk” designs [
45]. These approaches, while functional, often lead to higher operational costs and increased waste. In contrast, the system presented herein and sustained by several works in the literature introduces a novel modular architecture, sustained by a multidisciplinary approach, which represents a significant departure from conventional platforms. The key innovation of this non-monolithic design is the ability to selectively service or replace individual components, such as the sensing electrode and the detection cell, without discarding the entire apparatus. This modularity not only simplifies maintenance but also substantially extends the operational lifespan of the device, thereby mitigating the long-term costs and environmental impact associated with fully disposable systems.
The overarching objective of this research is to engineer an advanced ASV-based MEMS sensor for the precise and sensitive detection of trace concentrations of cadmium ions (Cd2+) in fresh water in the range of 0–20 µg/L (ppb). This development is specifically aimed at addressing critical needs within the agricultural sector which suffers from the pollution of this dangerous HM. Given the rapid and hazardous accumulation of cadmium in agricultural products, the device is intended to function as an early warning system, facilitating prompt intervention in case the threshold limit is exceeded. The innovative endeavour is to provide real-time, on-site data, supporting approximately 25 daily analyses of water batches designated for irrigation. To enhance detection performance and compliance with the regulatory limit of detection (LoD), commercially available SPEs modified with a thin film of mercury were chosen to be integrated into the prototyping to ensure system reliability.
A central component of the research activities was designing custom-designed flow detection cells for SPE sensors. The cell system was developed and prototyped using 3D printing to facilitate rapid iteration and to reach high-accuracy manufacturing. Its associated flow detection cell was fabricated in polydimethylsiloxane (PDMS) via a replica moulding technique and integrated in a microfluidic system. The successful implementation of such a sophisticated, modular electrochemical system is fundamentally enabled by the unique capabilities of microfluidics, allowing for unparalleled control over the analytical environment. The distinctive characteristics of fluid dynamics at this scale—namely laminar flow, an enhanced surface-to-volume ratio, and rapid mass transfer—are essential for integrating multiple analytical steps. This includes sample preparation, reaction, and the detection zone, all within a single miniaturized platform. By leveraging these principles, it is possible to boost the performance of chemical sensing, minimize reagent consumption, and optimize molecular dynamics at the electrochemical sensor’s interface, making microfluidics an indispensable partner for developing next-generation environmental monitoring tools [
46].
The entire system design and performance was validated through COMSOL Multiphysics simulations, which modelled critical parameters for detection and analysis, such as velocity field and pressure, to optimize inflow conditions for the prototype sensor [
47].
The proposed solution significantly streamlines the current laborious and time-consuming process for environmental monitoring. It directly addresses the gap created by the typical multi-stage procedure, which conventionally involves distinct steps, such as sampling, shipment, and subsequent laboratory analysis. By combining a multidisciplinary approach, this strategy provides a more efficient and cohesive workflow for rapid data acquisition and regulatory compliance.
Safeguarding freshwater resources through precise and timely monitoring is nowadays more and more critical. By ensuring the purity and quality of this essential resource, this research also aims to concurrently protect human health. This dual focus underscores a commitment to both environmental stewardship and public well-being.
2. Materials and Methods
2.1. Simulations
Finite-Element-Method (FEM) simulations were employed to investigate a possible detection device design and parameterization of the sensor prototype to thoroughly assess the performance of each of the three distinct flow detection cells designed across a range of flow rates.
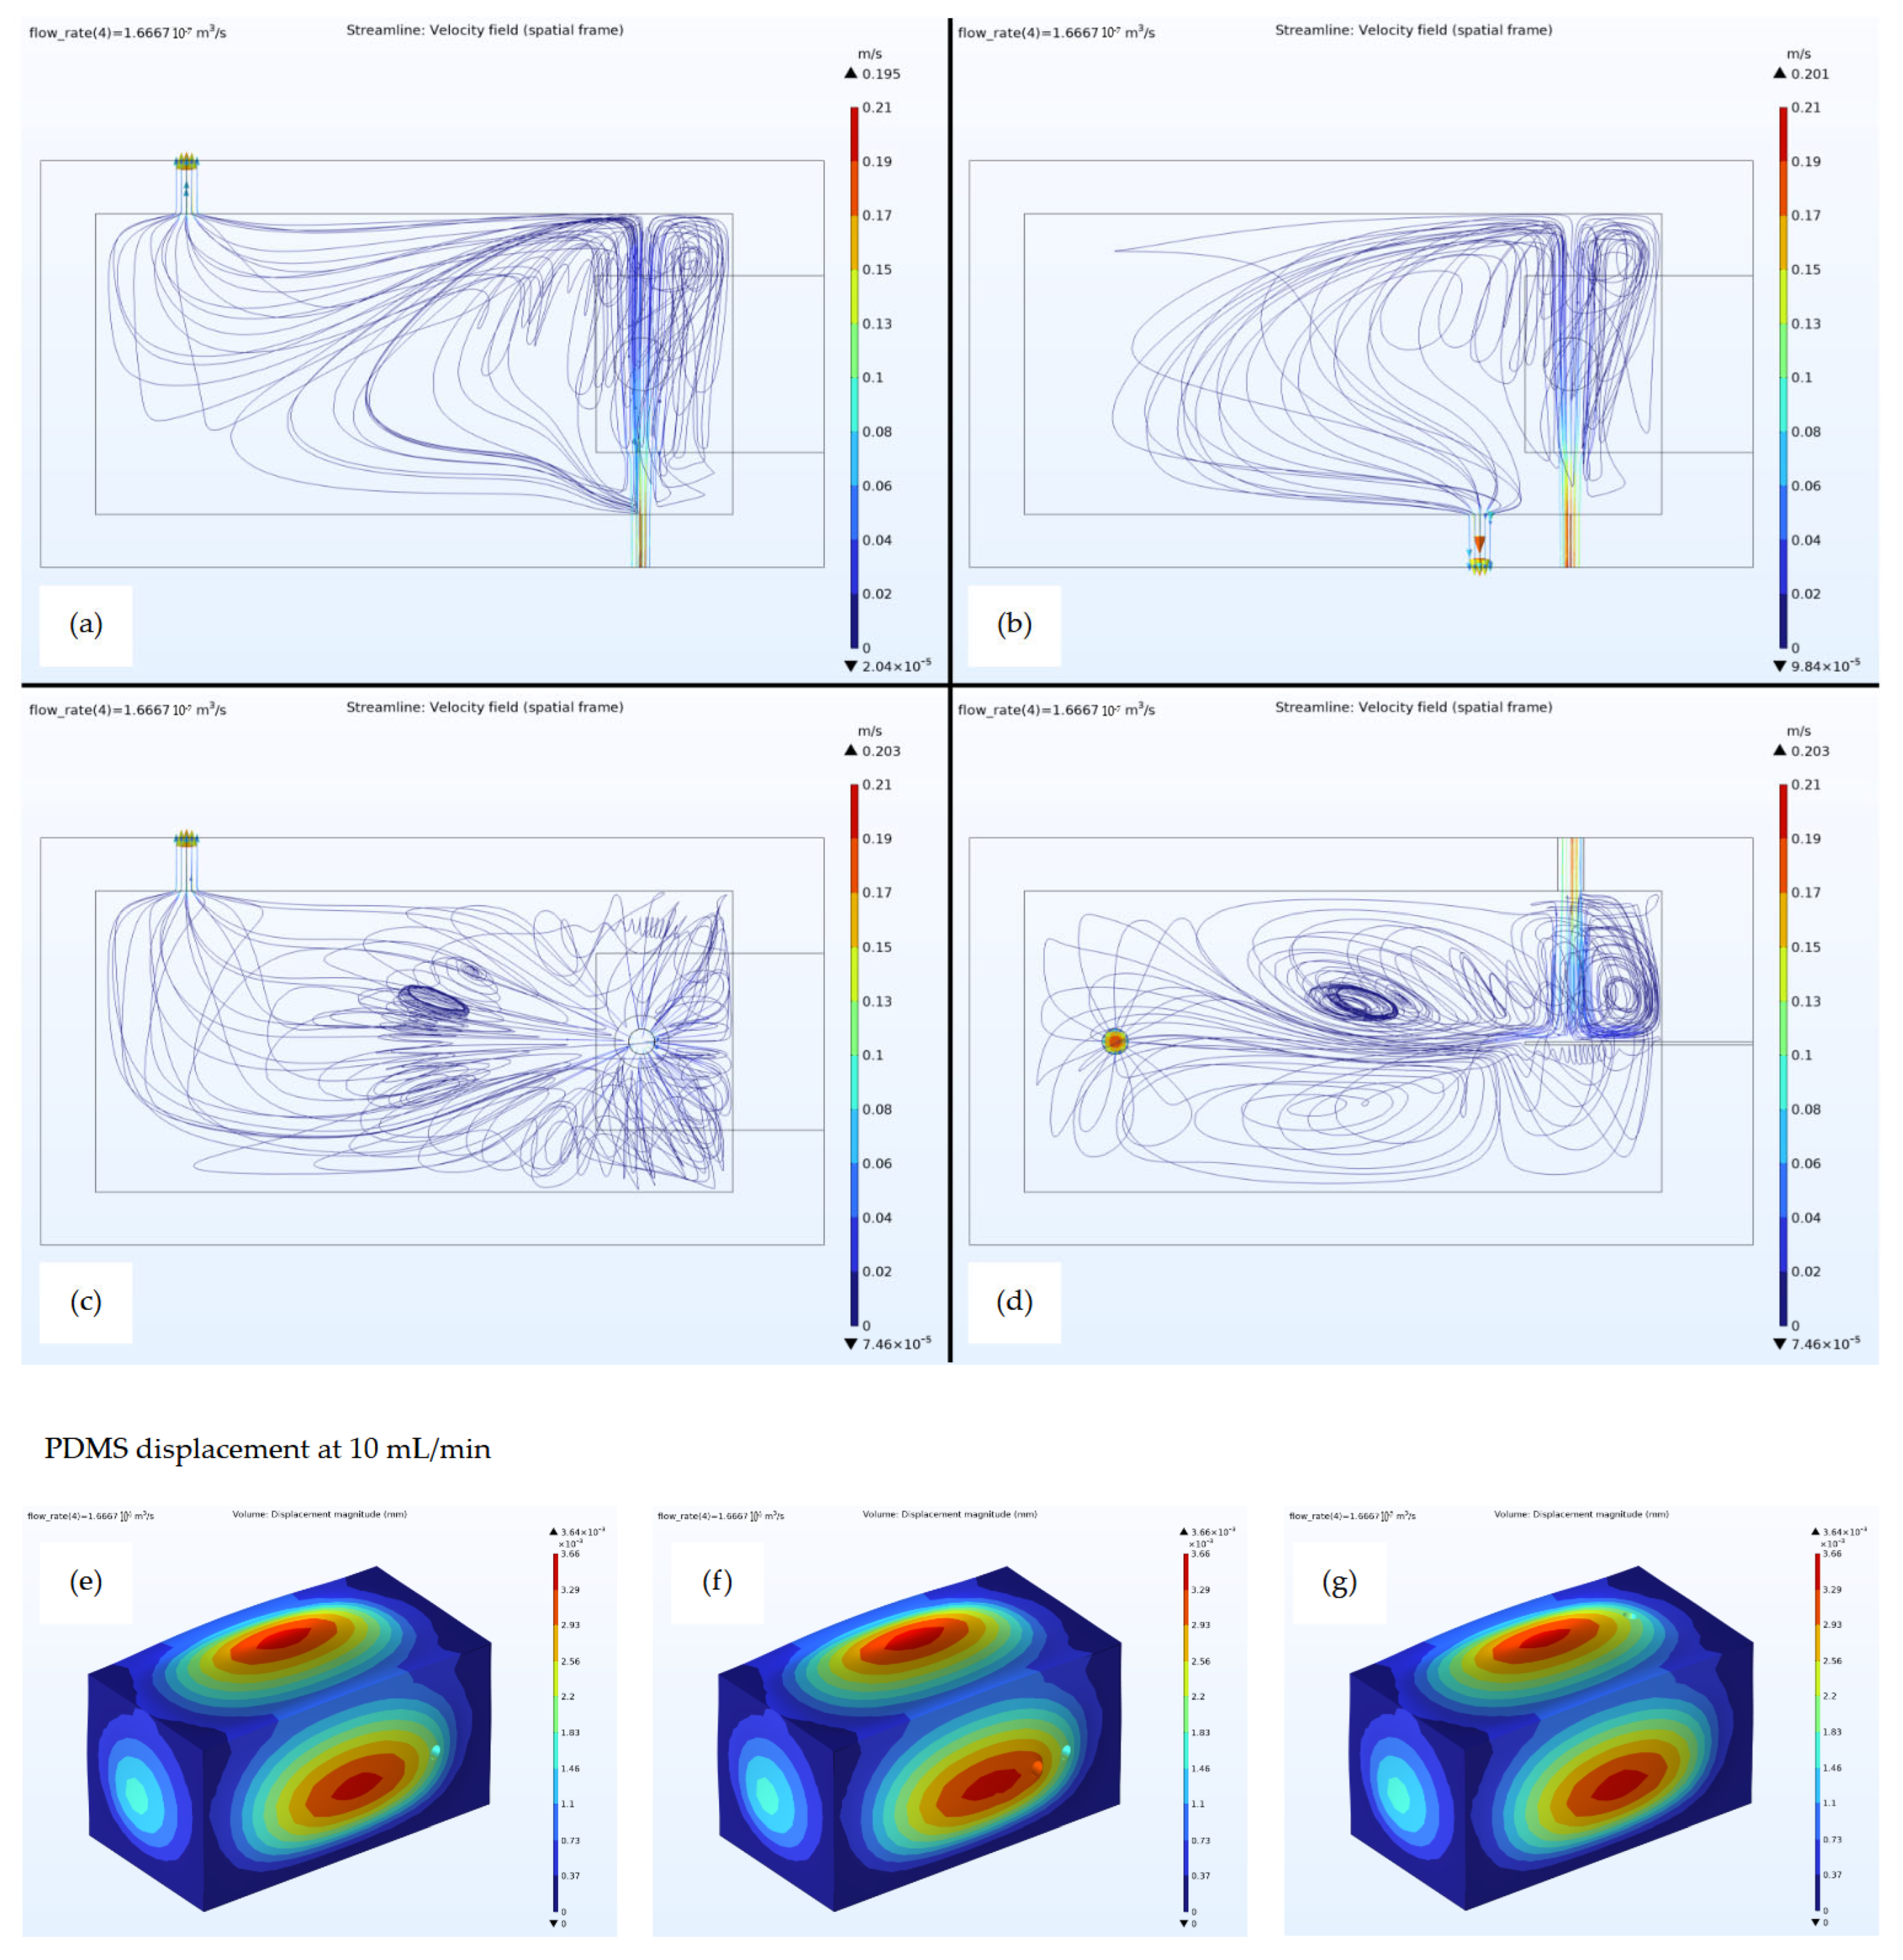
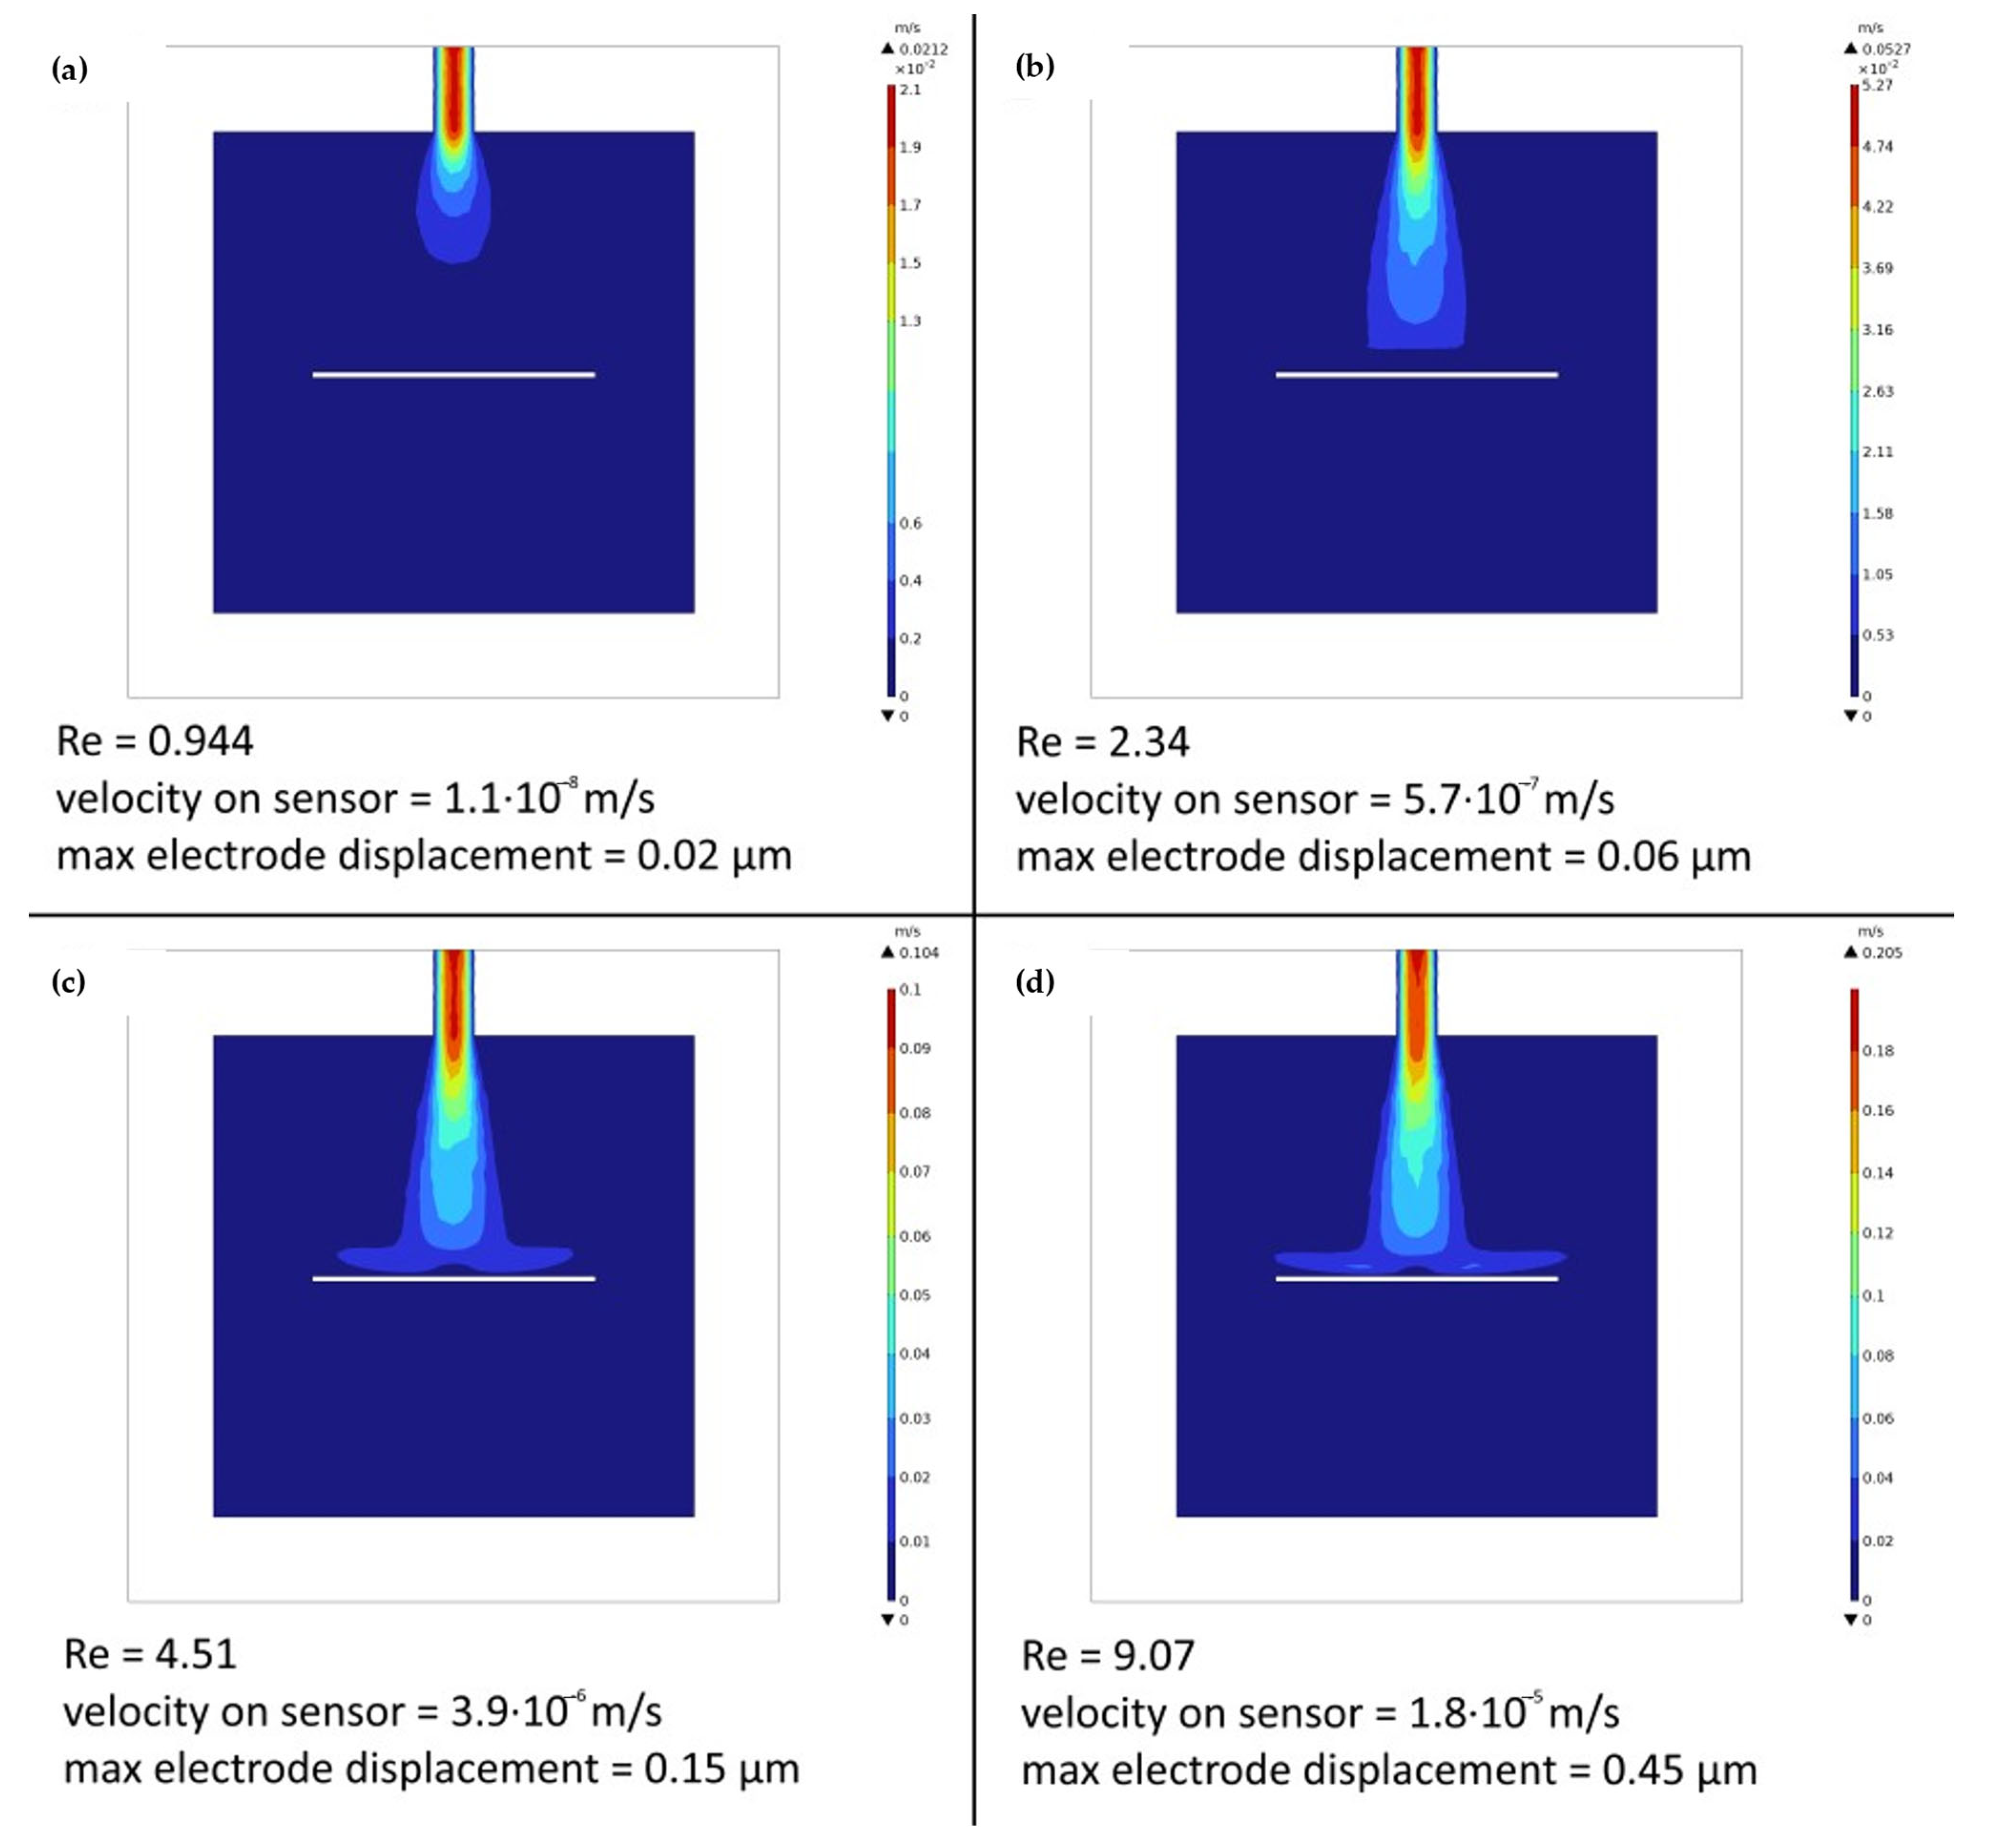
Simulations were conducted in COMSOL Multiphysics (version 6.3), employing the same 3D models used for producing the PDMS moulds. The study was set to couple the Fluid Dynamics and Solid Mechanics modules with the dedicated Multiphysics interface. For each simulated flow rate, the analyses concentrated on generating and evaluating the velocity field, the streamlines, the pressure, and therefore the PDMS displacement relevant to the cell system’s design. These evaluations were crucial for determining the liquid dynamic inside the three developed system designs, acting as a performance reference in the choice of the best design solution.
Then, three different flow cell designs were created, each of them differing only in the positions of the inlet and the outlet. The homogeneity of analyte dispersion was optimally evaluated by considering three distinct flow detection cell configurations. Specifically, the distinguishing factor among these three configurations was the positioning of the inlet and outlet tubes for the sample solution (
Figure 1).
An assessment of the flow detection cell performance involved a systematic evaluation of different flow rates of the sample within the range of 1 mL/min to 10 mL/min, which represents the maximum limit of the hydraulic system.
The volume of the flow detection cell, width of the walls, and dimensions of the holes were kept constant in each of the three designs. For each design, a simulation was then conducted by setting the flow rate as an auxiliary sweep, with the values 1 mL/min, 2.5 mL/min, 5 mL/min, and 10 mL/min. This experimental design sought to delineate an upper boundary, primarily dictated by the pressure imposed on the cell walls.
Materials were assigned to domains. In particular, three COMSOL Multiphysics built-in materials were used: water for the liquid domain, PDMS for the cell walls, and acrylic plastic for the electrode. Data used in these simulations are shown in
Table 2.
The fluid dynamics was evaluated using the stationary Navier–Stokes equations within the COMSOL Multiphysics laminar flow interface, and the following assumptions were made according to the dynamics under analysis: the fluid was considered Newtonian and incompressible, so that both density and viscosity could be assumed to be constants. Furthermore, the no-slip boundary condition was applied on the exterior walls [
49]. This setup is very common for studying these fluidic problems [
47,
50]. The fluid was set to flow from the inlet surface as a fully developed flow, specifying the flow rate parameter. Through the Multiphysics node in COMSOL Multiphysics, the laminar flow interface was coupled with the Solid Mechanics one to capture the effect of the pressure of the fluid on the displacement and stress of the PDMS walls. This can be a very useful tool to predict failures in fluidic devices.
A boundary probe and a domain probe were defined on the electrode for measuring the velocity of the fluid on the surface of the sensor and the displacement of the electrode, respectively.
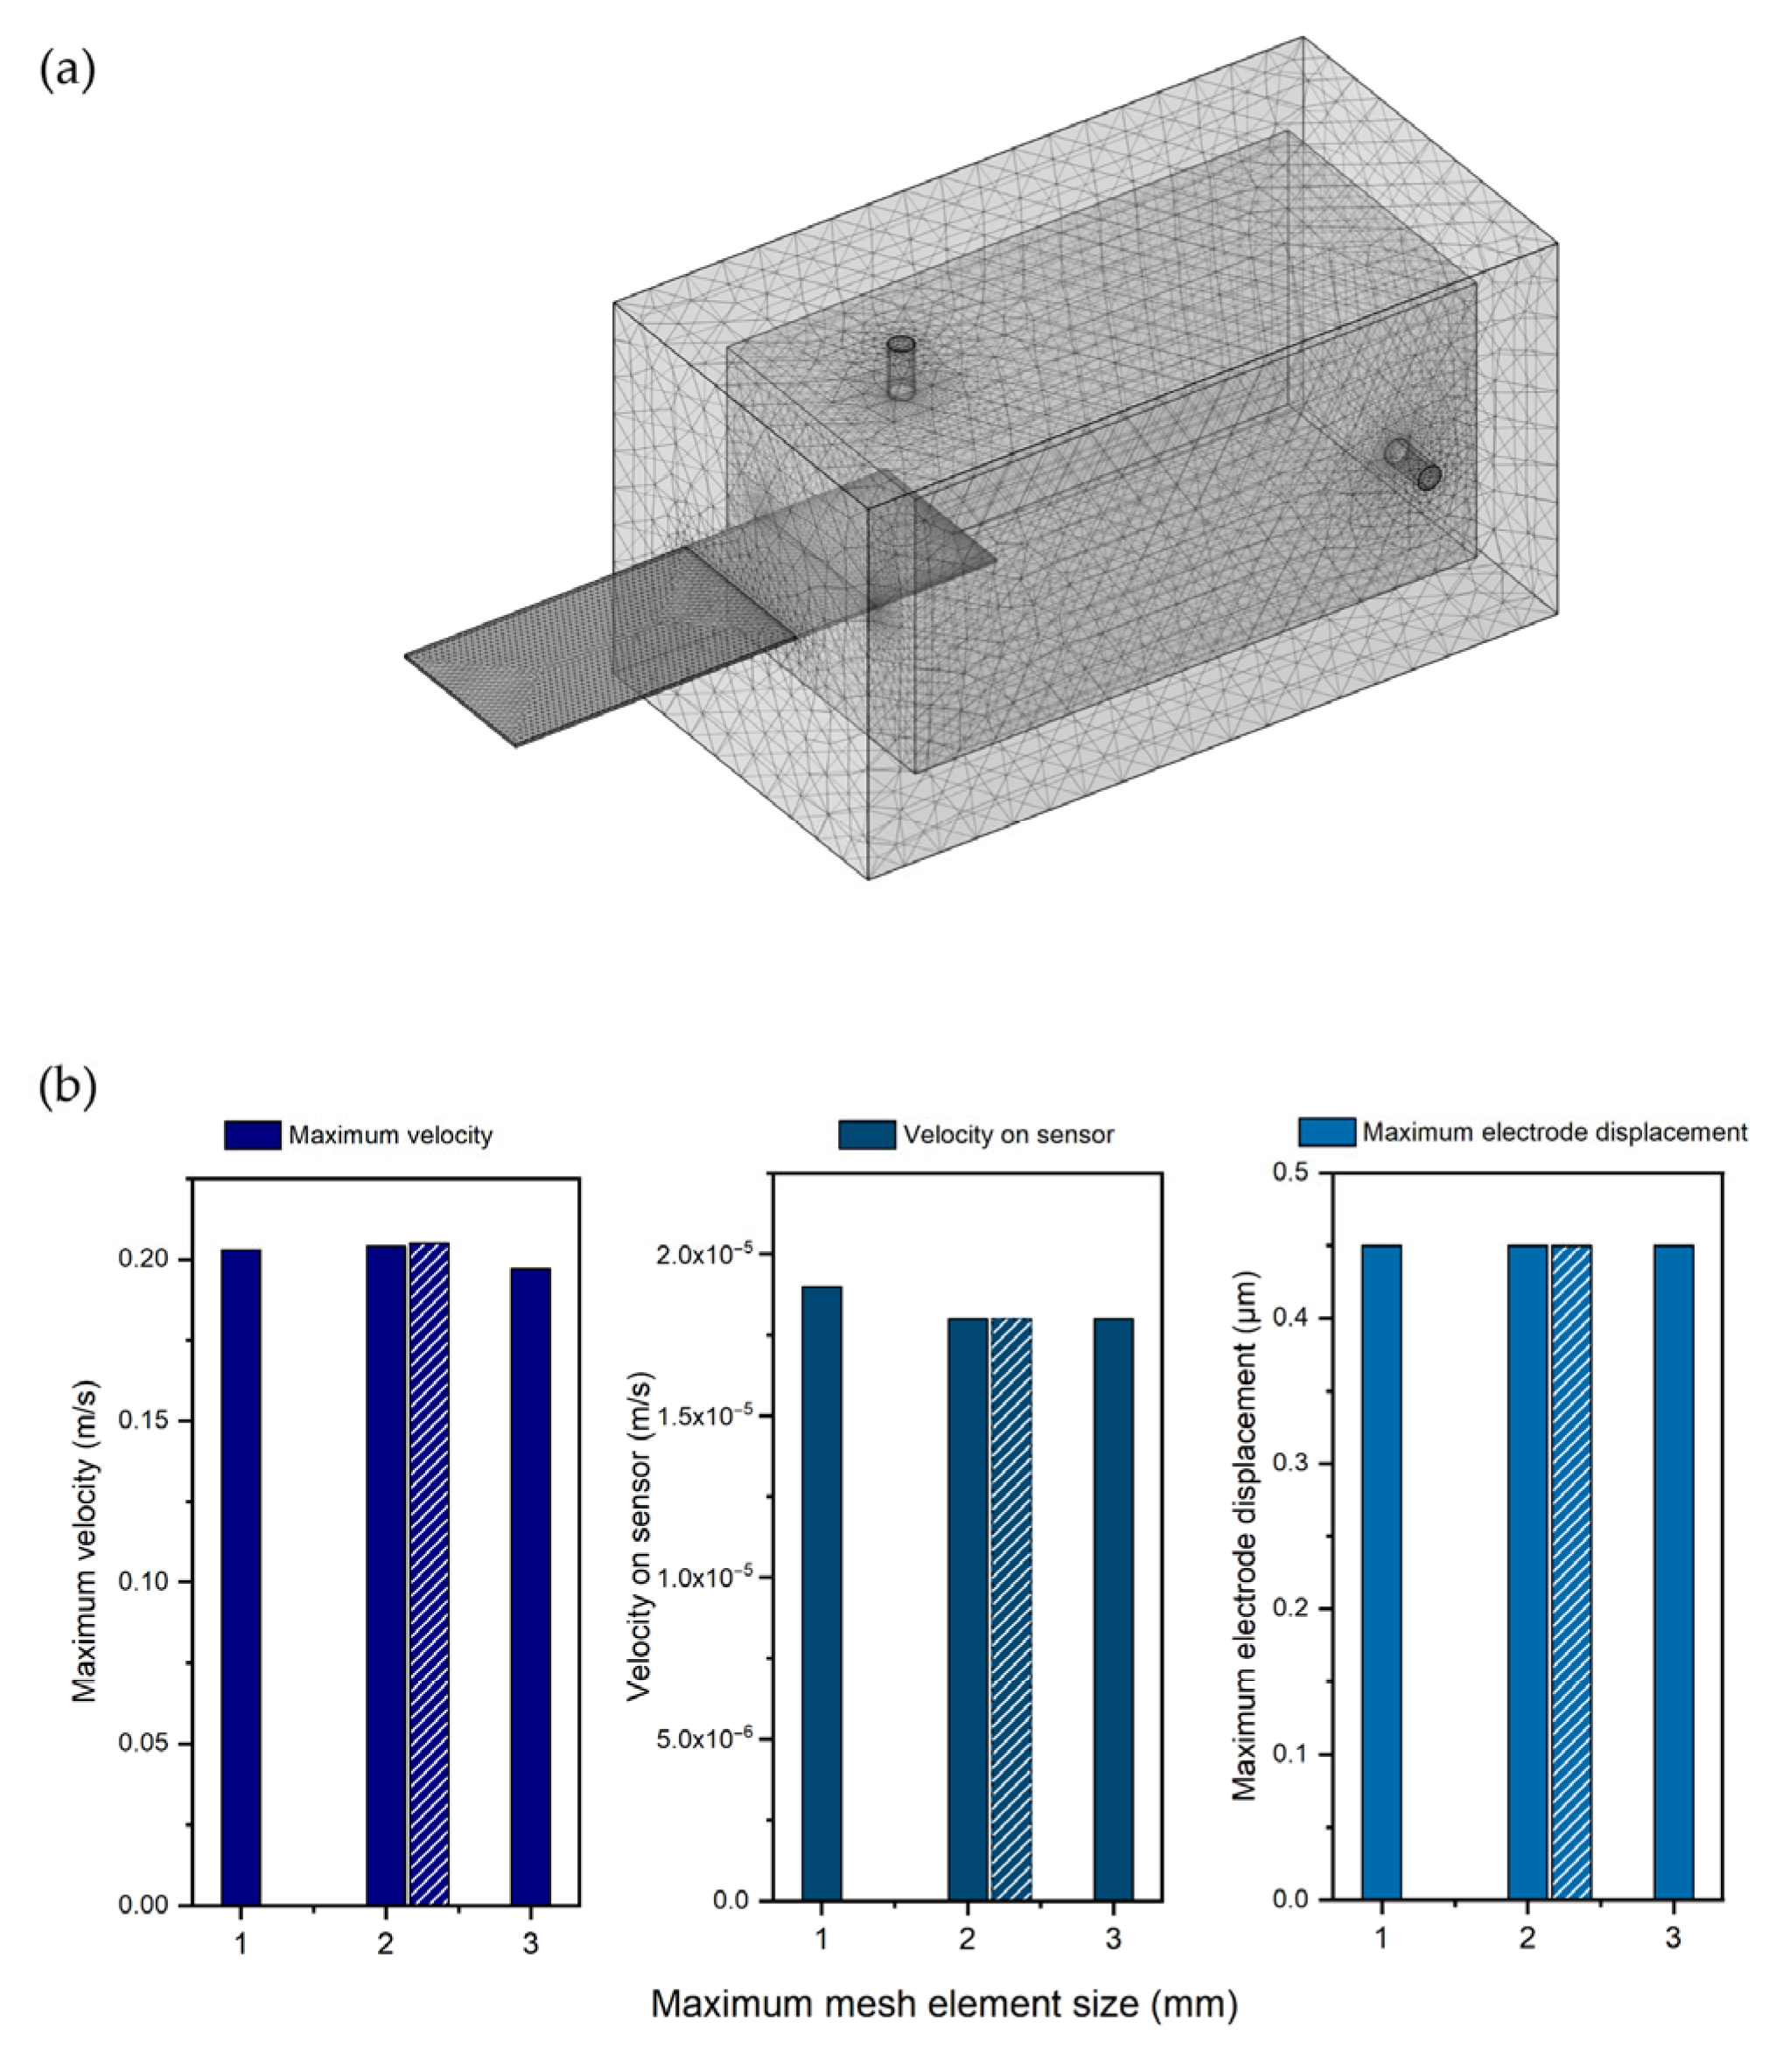
For every domain, an auto-generated physics-based mesh was created. The elements of the mesh had a length between 0.1392 mm and 2.3 mm. A mesh sensitivity study was developed using three different simulations based on the geometry of
Figure 1c and a flow rate of 10 mL/min. Each of them had a different value for the maximum mesh element size. In particular, 1, 2, and 3 mm were chosen to confirm the stability of the results of the selected mesh.
2.2. CAD Design and Fabrication
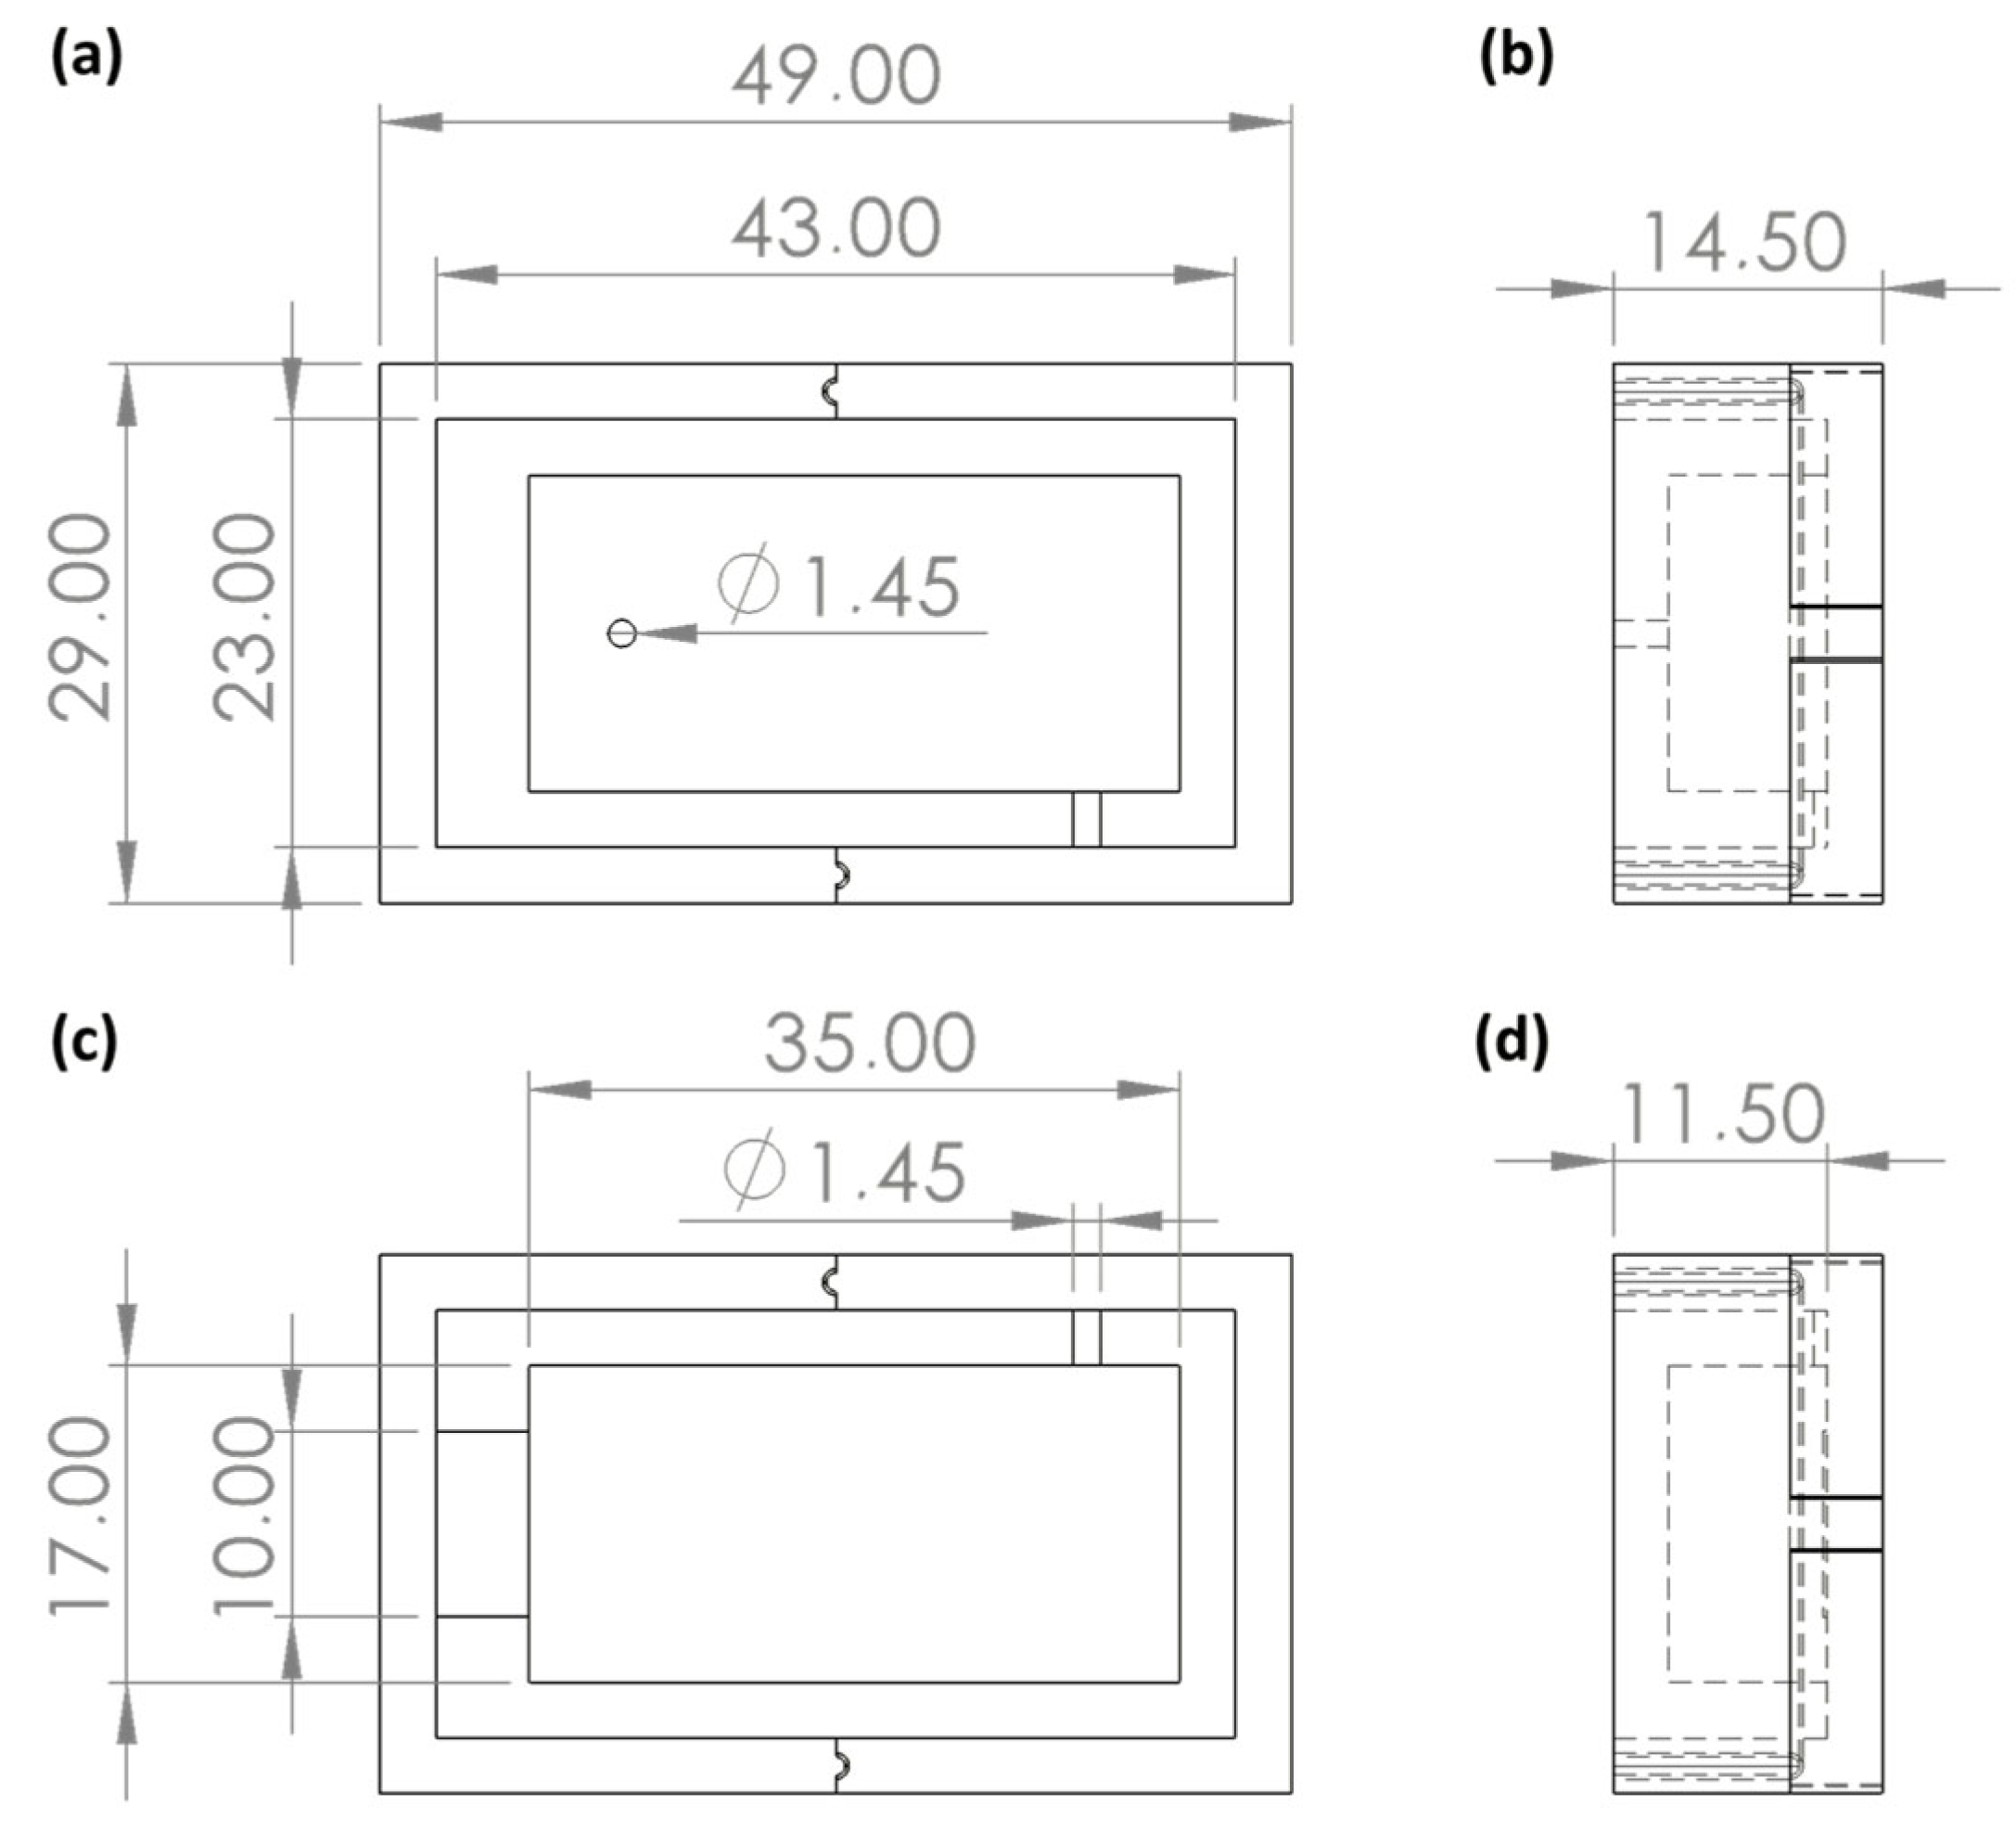
The flow detection cell was composed of a device with two layers, a top layer with an inlet hole on top and part of the cell and a bottom layer with an outlet hole; the sensor housing; and the corresponding part of the flow detection cell, as reported in
Figure 2. The inlet and outlet holes were designed respecting the needs of the diameters of the system tubes. The sensor housing was represented by a little step in the bottom layer that allowed it to be held in place.
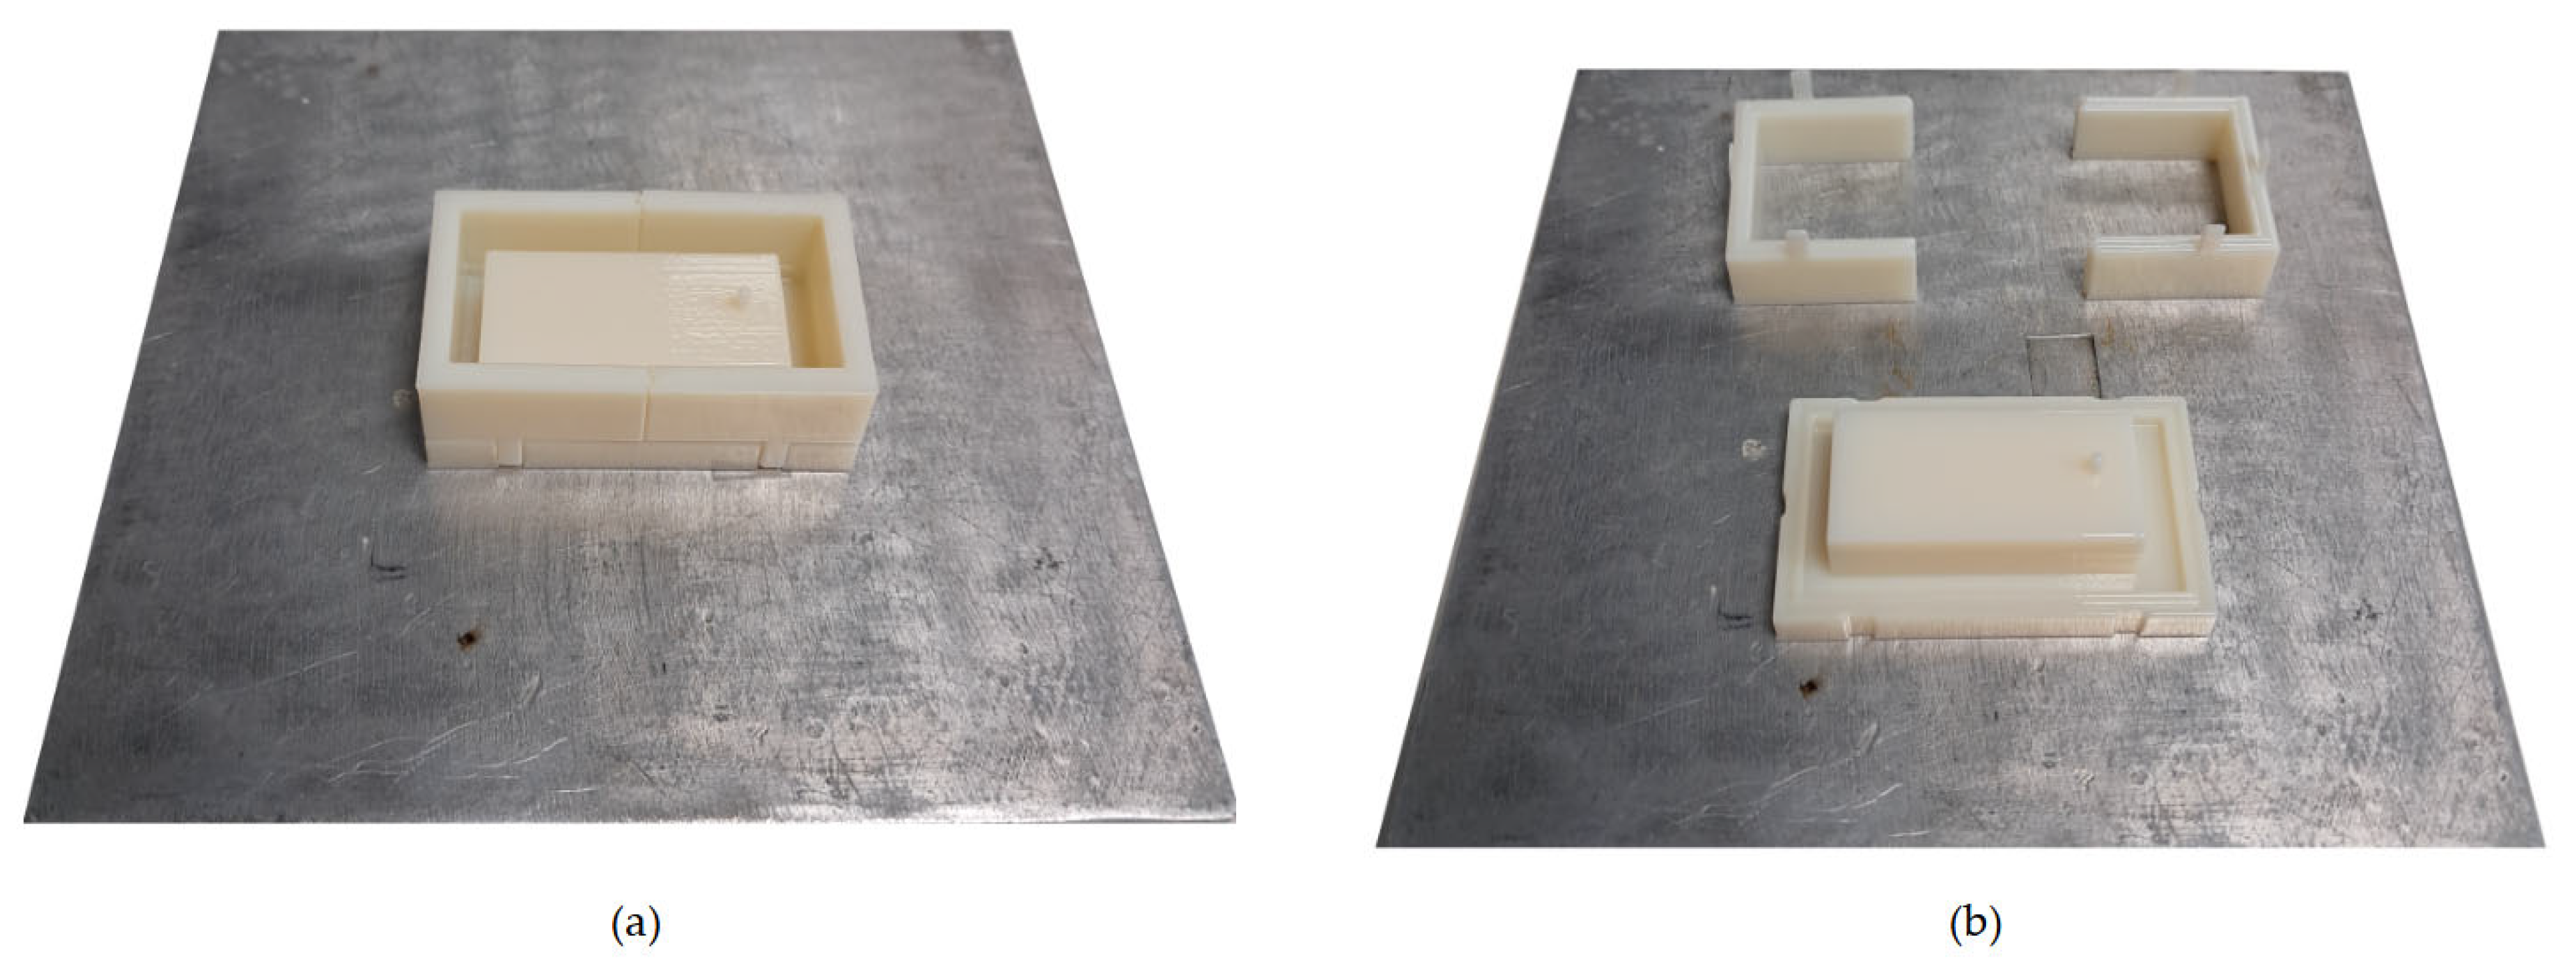
The device was made of PDMS through a replica moulding technique. Moulds of the top and bottom layers were designed as the negative of the desired geometry, as shown in
Figure 2. The two moulds were made of three parts, a baseplate, and a two-part framework for improving and facilitating the detachment replicas from them.
PDMS was chosen as the constitutive material for the system because of its mechanical properties, such as strength, durability, tunability of elasticity and viscoelasticity, and channel deformation tunability, with variations in the curing agent concentration [
51].
PDMS can also ensure chemical inertness with water solutions due to its highly hydrophobic characteristics, which make it suitable for capturing metal ions only after functionalization with sulfonic groups [
52]. This also suggests the need for any sort of surface treatment for ensuring interactions with metal ions, as reported in Li et al.’s work [
53], which functionalized PDMS through a plasma process to guarantee selective passage of Cd
2+ and Pb
2+.
Moulds were 3D-printed with a PolyJet printer, Objet30 from Stratasys (Eden Prairie, MN, USA), using their VeroWhiteTM resin as material (Stratasys, Eden Prairie, MN, USA). The printed parts were post-processed, eliminating each residue of support material, washing them with water, curing them into an oven (UF30, Memmert GmbH+, Schwabach, Germany) at 110 °C overnight, and cleaning them with acetone in an ultrasonic bath (CP104 ultrasonic cleaner, CEIA, Arezzo, Italy) for 5 min at 59 kHz. Then, the PDMS prepolymer and curing agent (SYLGARD™ 184 Silicone Elastomer kit, provided by Sigma-Aldrich, Darmstadt, Germany) were mixed at a ratio of 10:1, degassed, and poured into the post-processed moulds. Lastly, the liquid PDMS was cured into an oven at 90 °C for 1 h, and the cured parts were detached from the moulds using isopropanol (IPA).
The complete device was assembled using two different approaches, plasma oxygen treatment and interlayer bonding, to perform a comparison between these two solutions for layer bonds. Both techniques were performed after PDMS replicas were washed in ethanol in an ultrasonic bath (5 min at 59 kHz), ensuring no residues were contaminating the surface. For plasma treatment, the plasma parameters, set on the Electronic Diener Plasma Surface Technology (Ebhausen, Germany) machine, were a gas supply period of 1 min, an oxygen pressure of 0.7 mbar, and a plasma process duration of 0.30 s at 22% of maximum power. After the plasma treatment, the two layers were joined together, and a thermal treatment was performed on the bonded layers using an oven at 80 °C for 5 min to improve the bond. Lastly, the sensor was positioned in the dedicated step.
For interlayer bonding, a thin layer of non-crosslinked PDMS was laid on the bottom layer, which was then coupled with the top layer. To stabilize the link, the whole system was loaded into an oven at 90 °C for 15 min.
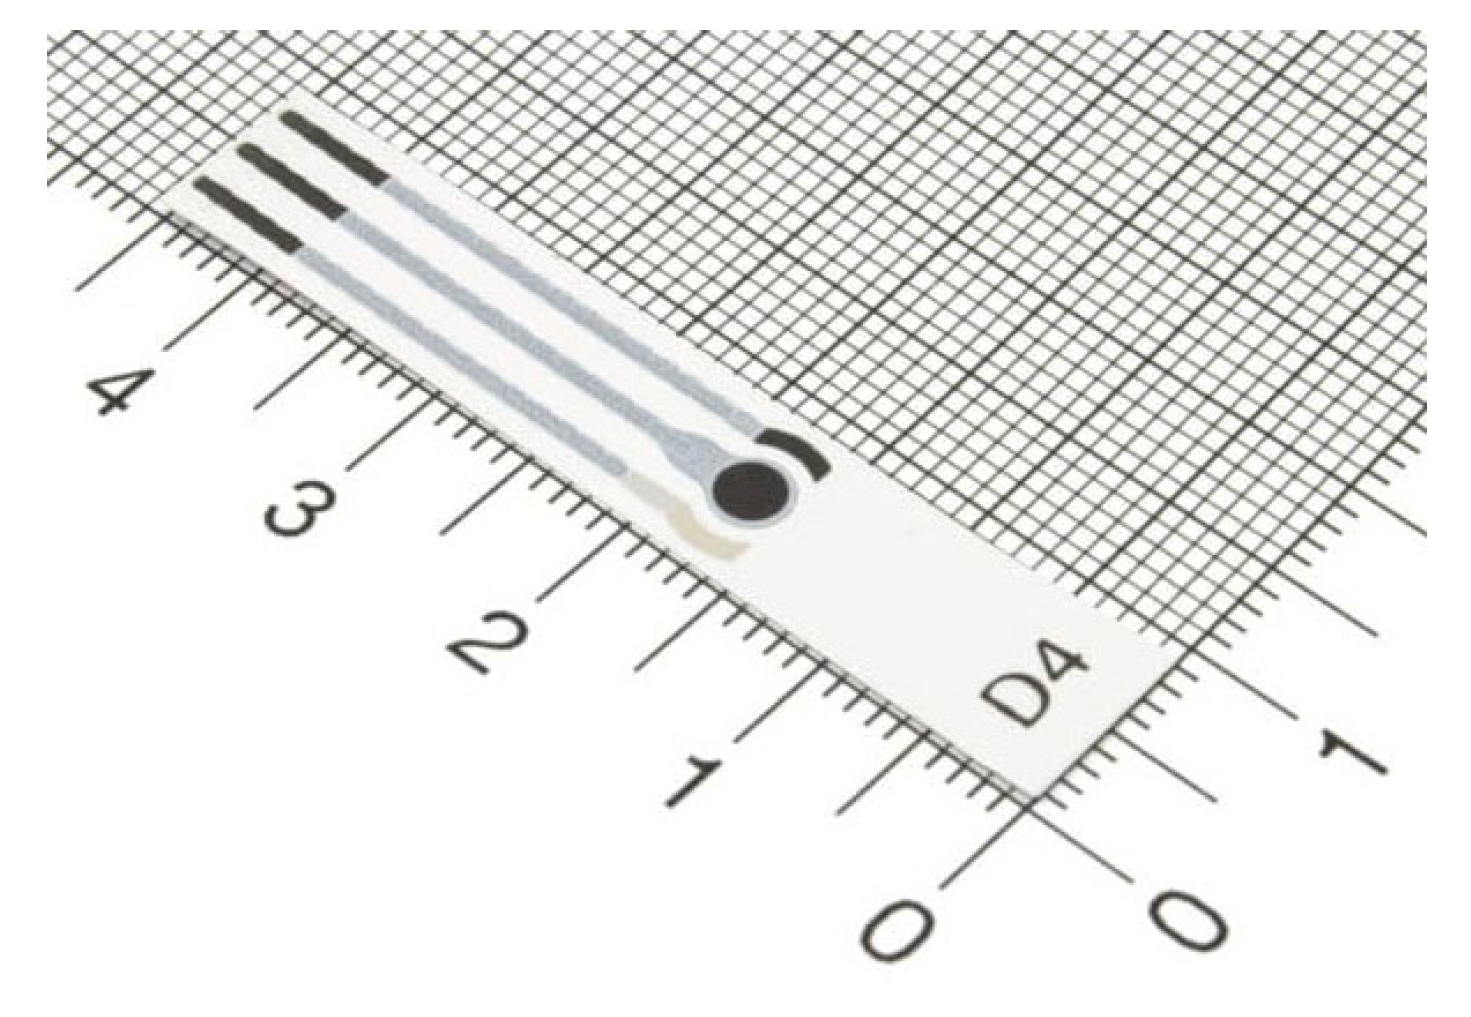
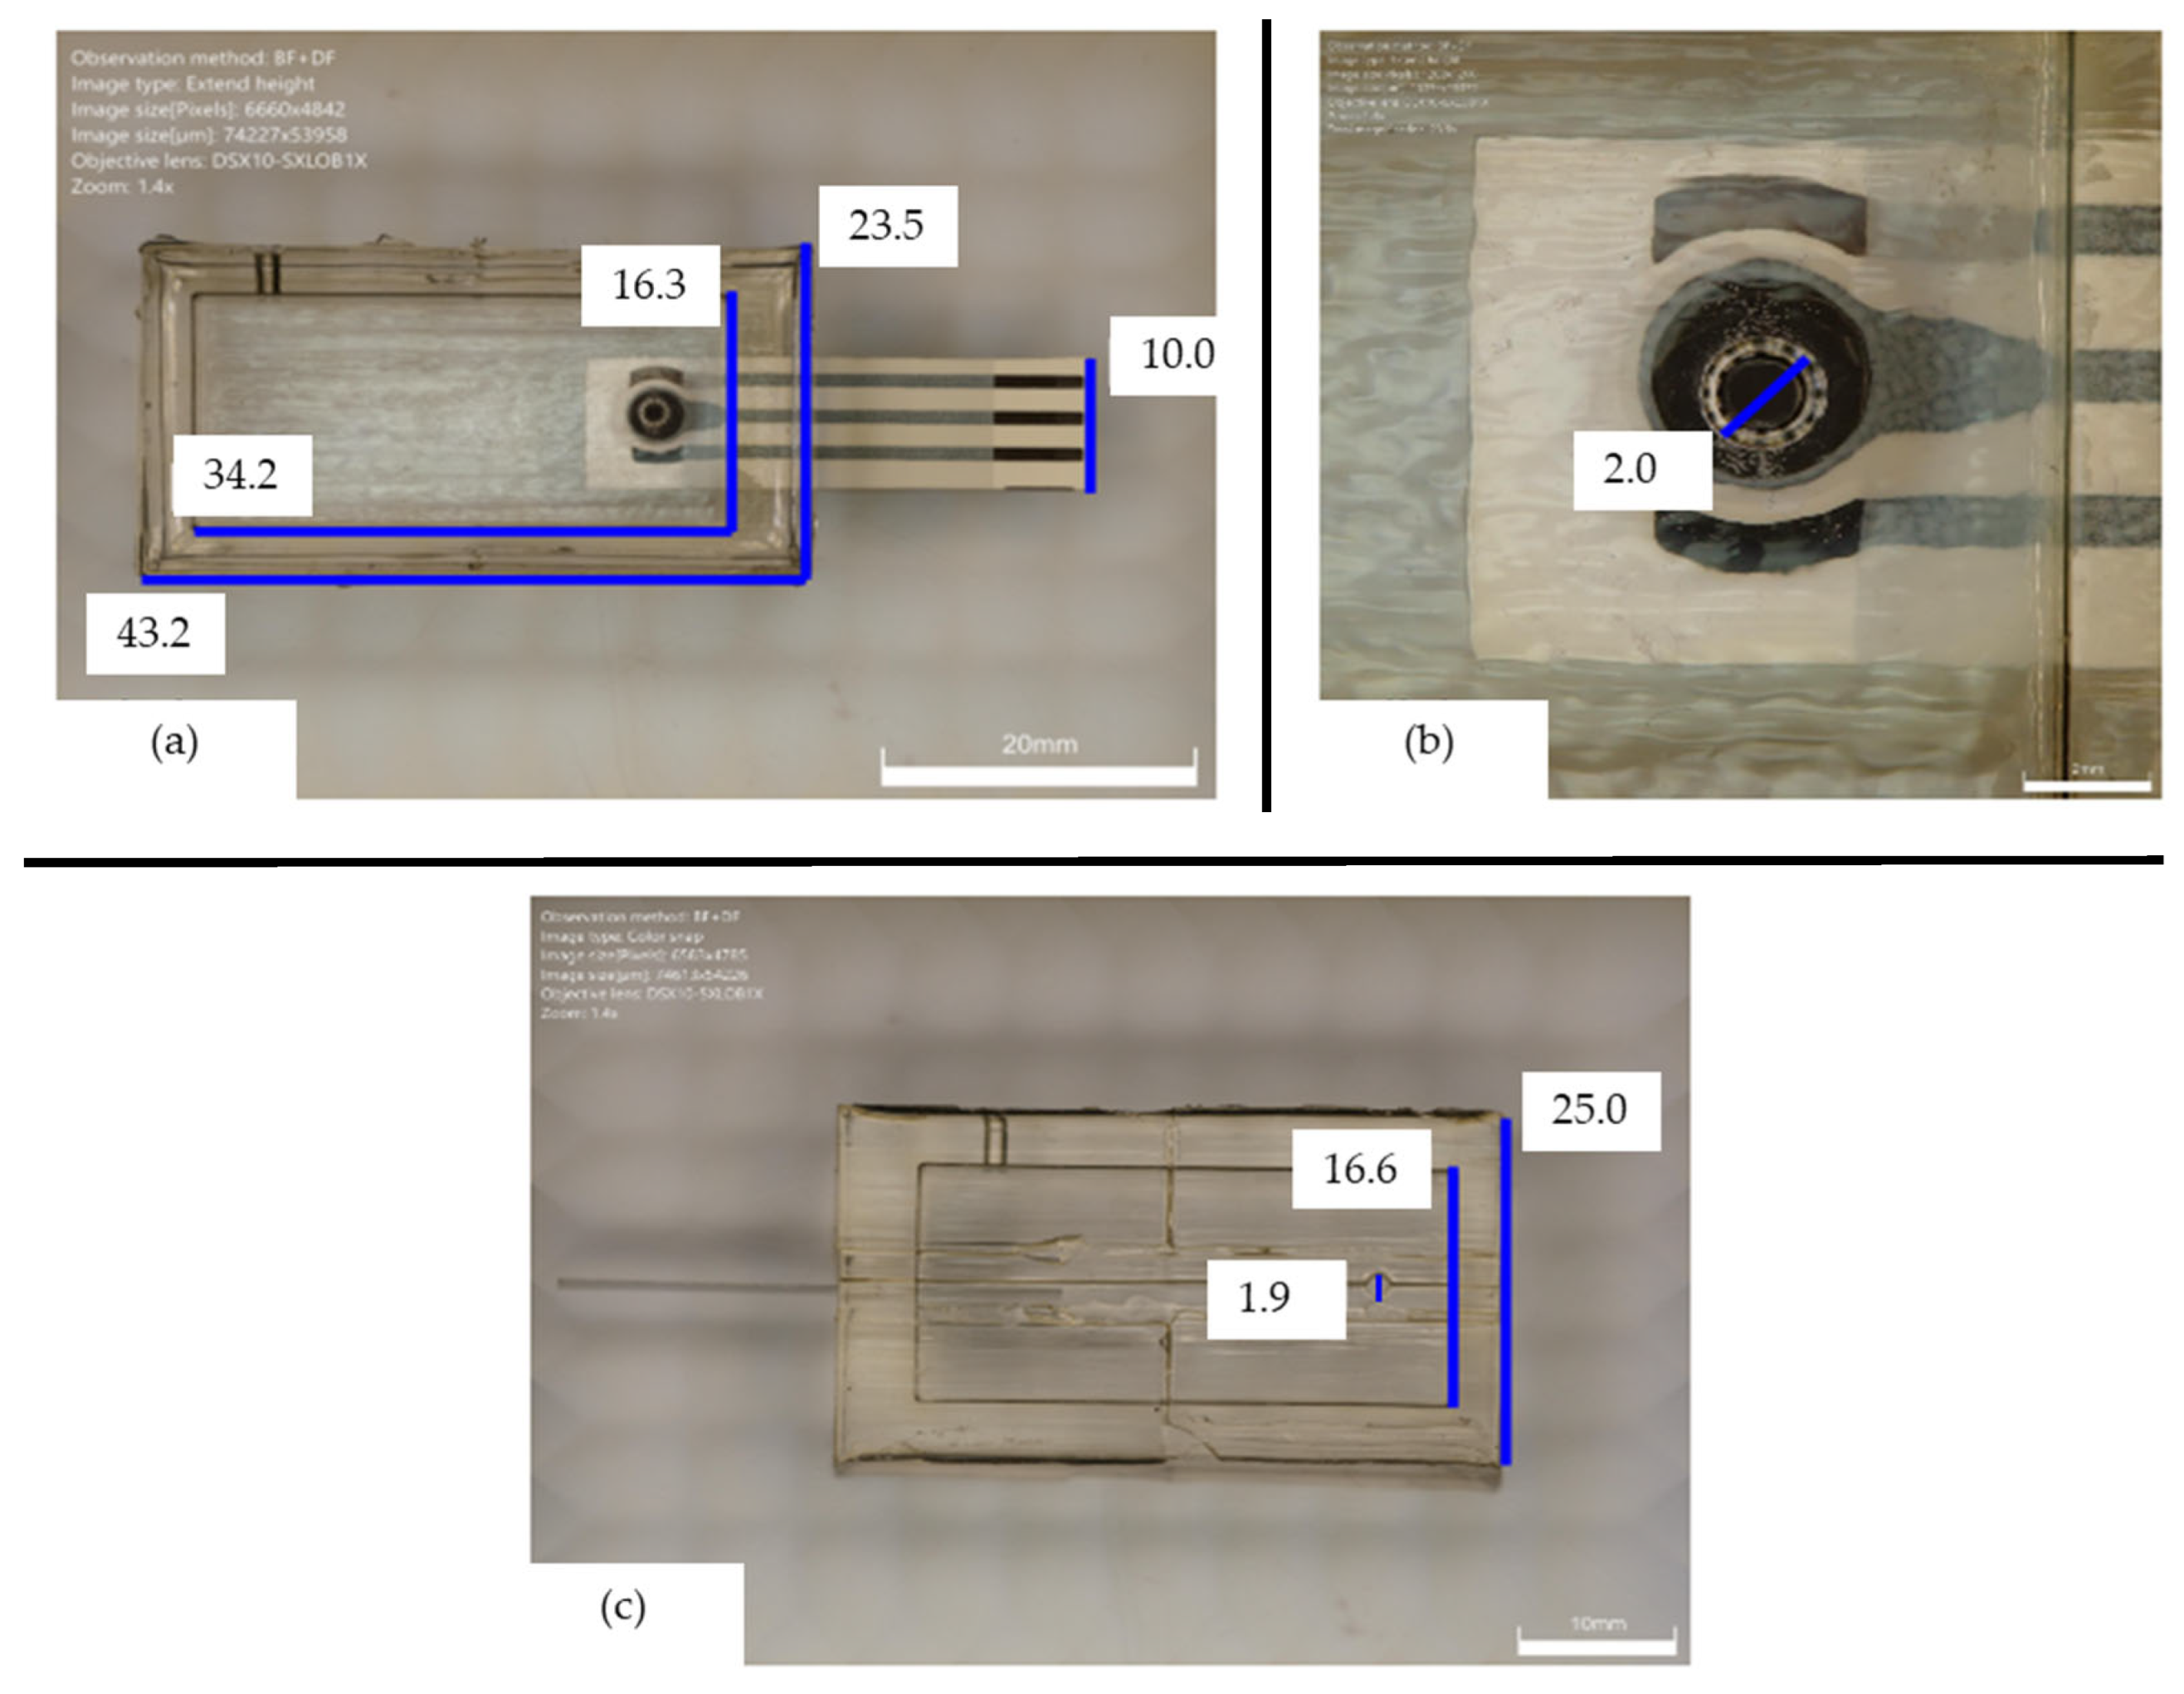
At the end of the bonding process, the selected screen-printed electrode was inserted in the dedicated cavity, ensuring the correct fluid exposed length. The employed electrode was a commercial ItalSens mercury salt-modified graphite sensor (IS-HM1, SPEs, PalmSens, Houten, The Netherlands). The screen-printed electrode (SPE) system, detailed in
Figure 3, features a standard three-electrode arrangement. It incorporates mercury salt on a graphite working electrode (WE), characterized by a 3 mm disc diameter. A graphite counter electrode (CE) and a silver pseudo-reference electrode (RE) are also integrated into the design. The entire sensor is supported on a polyester stripe, with the working electrode’s geometric area measuring 7.07 mm
2 and with a thickness of 350 μm (
Figure 3).
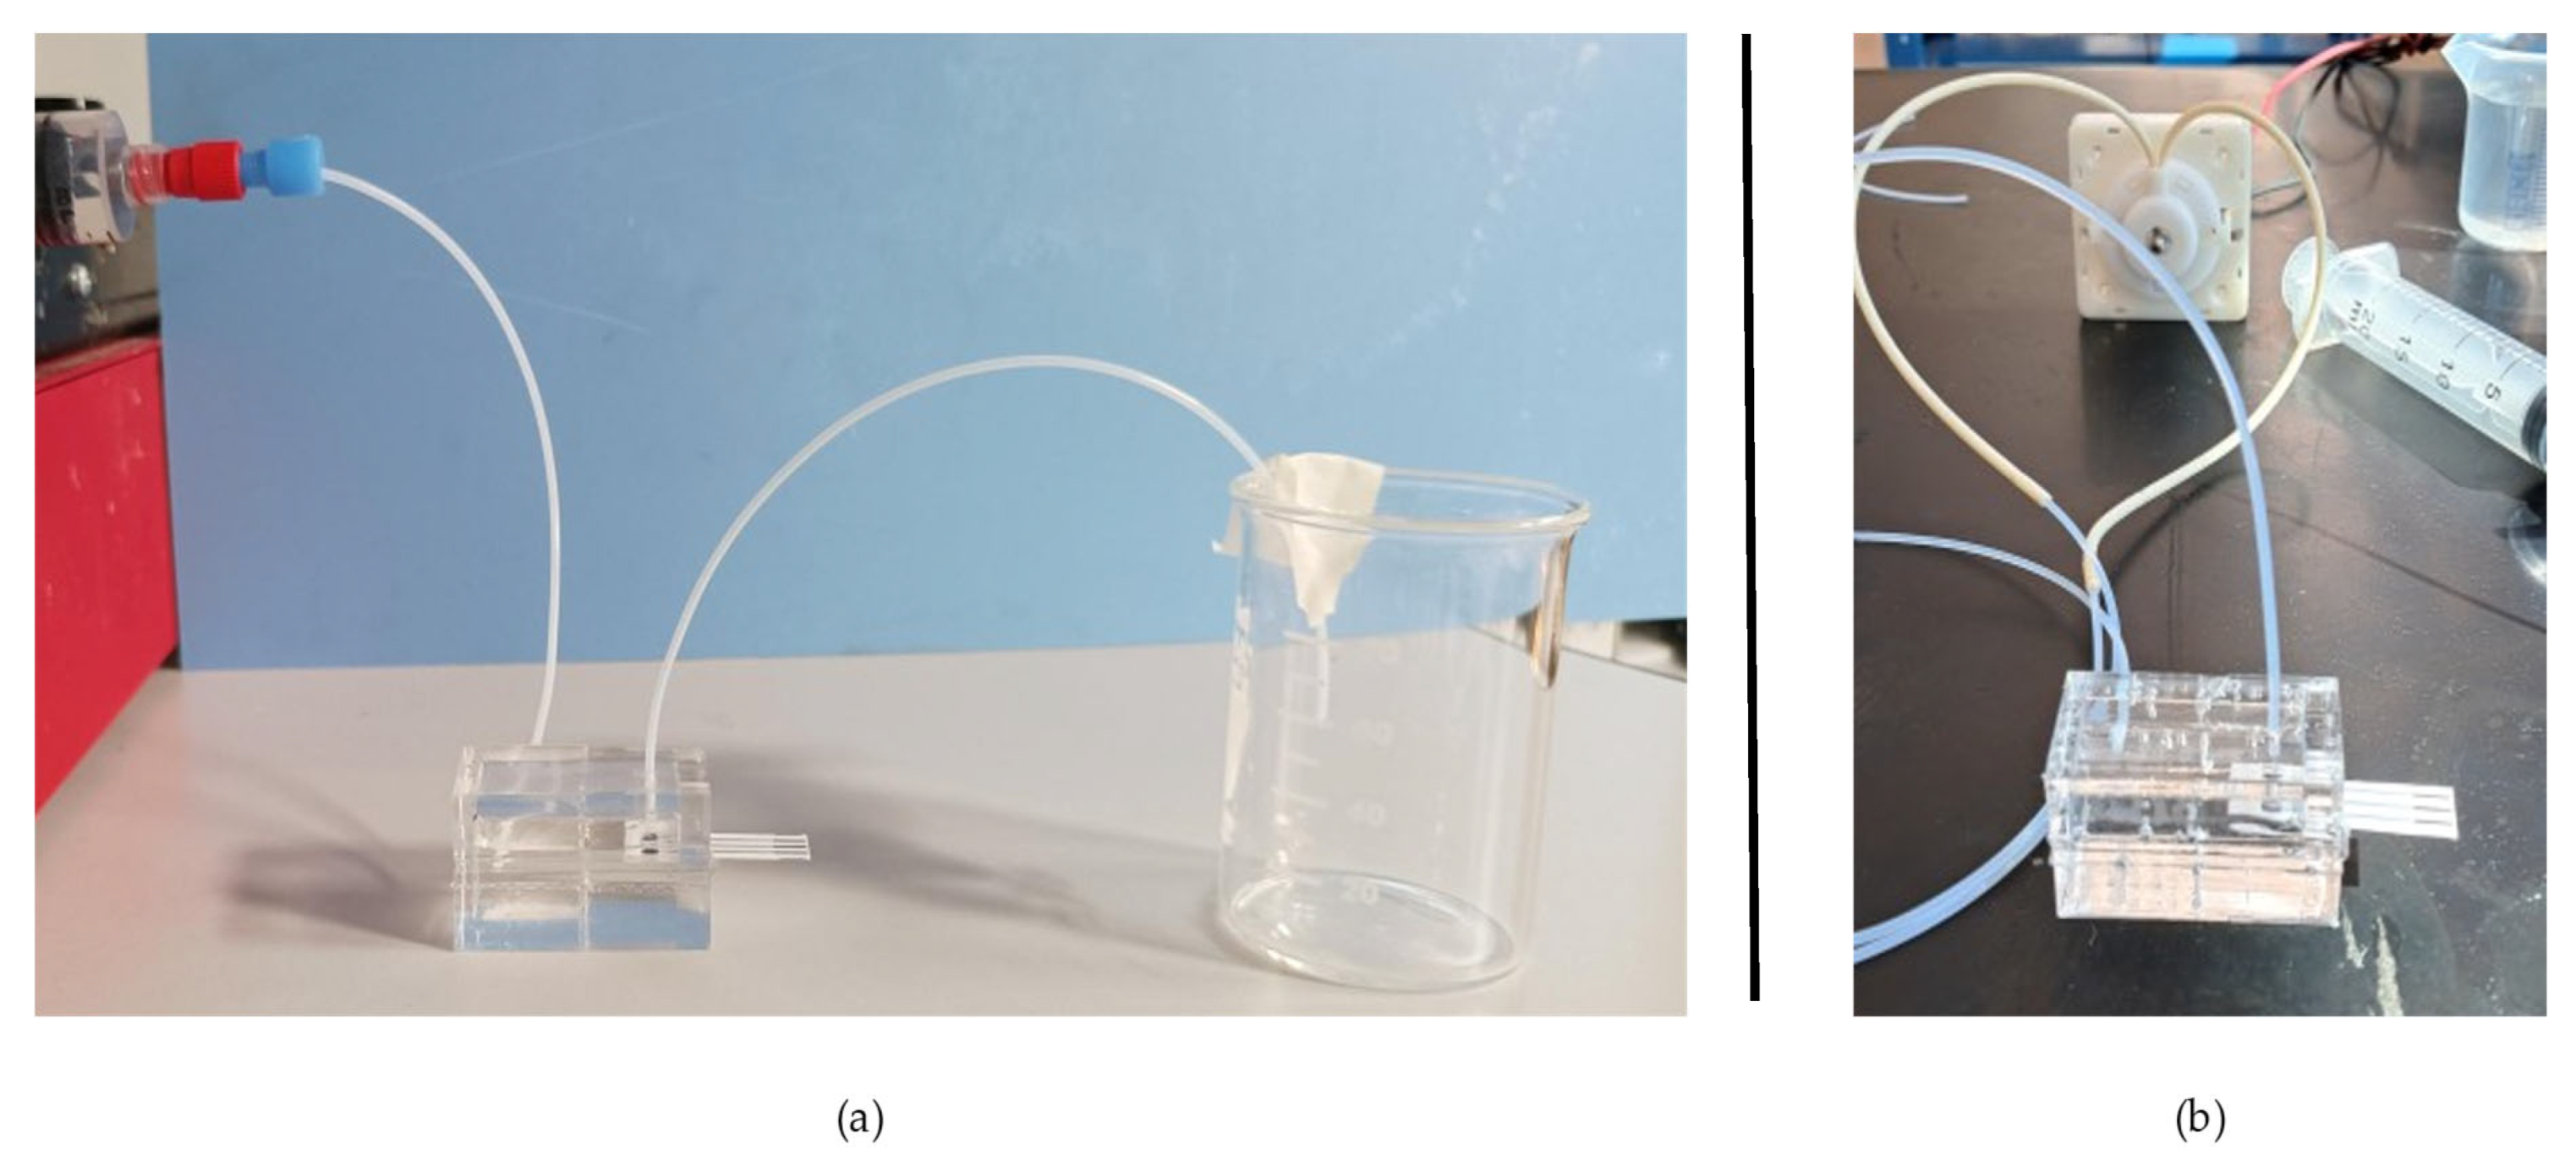
The assembled device was connected to the fluidic system through polytetrafluoroethylene (PTFE) 1/16″ ID (1/8″ OD) tubes. The flow detection cell was used for fluidic tests with two different pumps: a peristaltic pump (Fluid-o-Tech, TP16, Milan, Italy) for a simulated stirring effect and a syringe pump (NE-1200 Twelve channel programmable, Syringe Pump, KF Technology, Rome, Italy) to accurately fill the cell volume. The volume was filled using a 20 mL syringe, setting its inner diameter to 12 mm and with a 1 mL/min flow rate as the parameters. During this setup phase, the syringe pump was set to operate with an optimal inflow rate of 1 mL/min, while in the measuring phase, the voltage of the peristaltic pump was tuned to a range of 1 to 10 V.
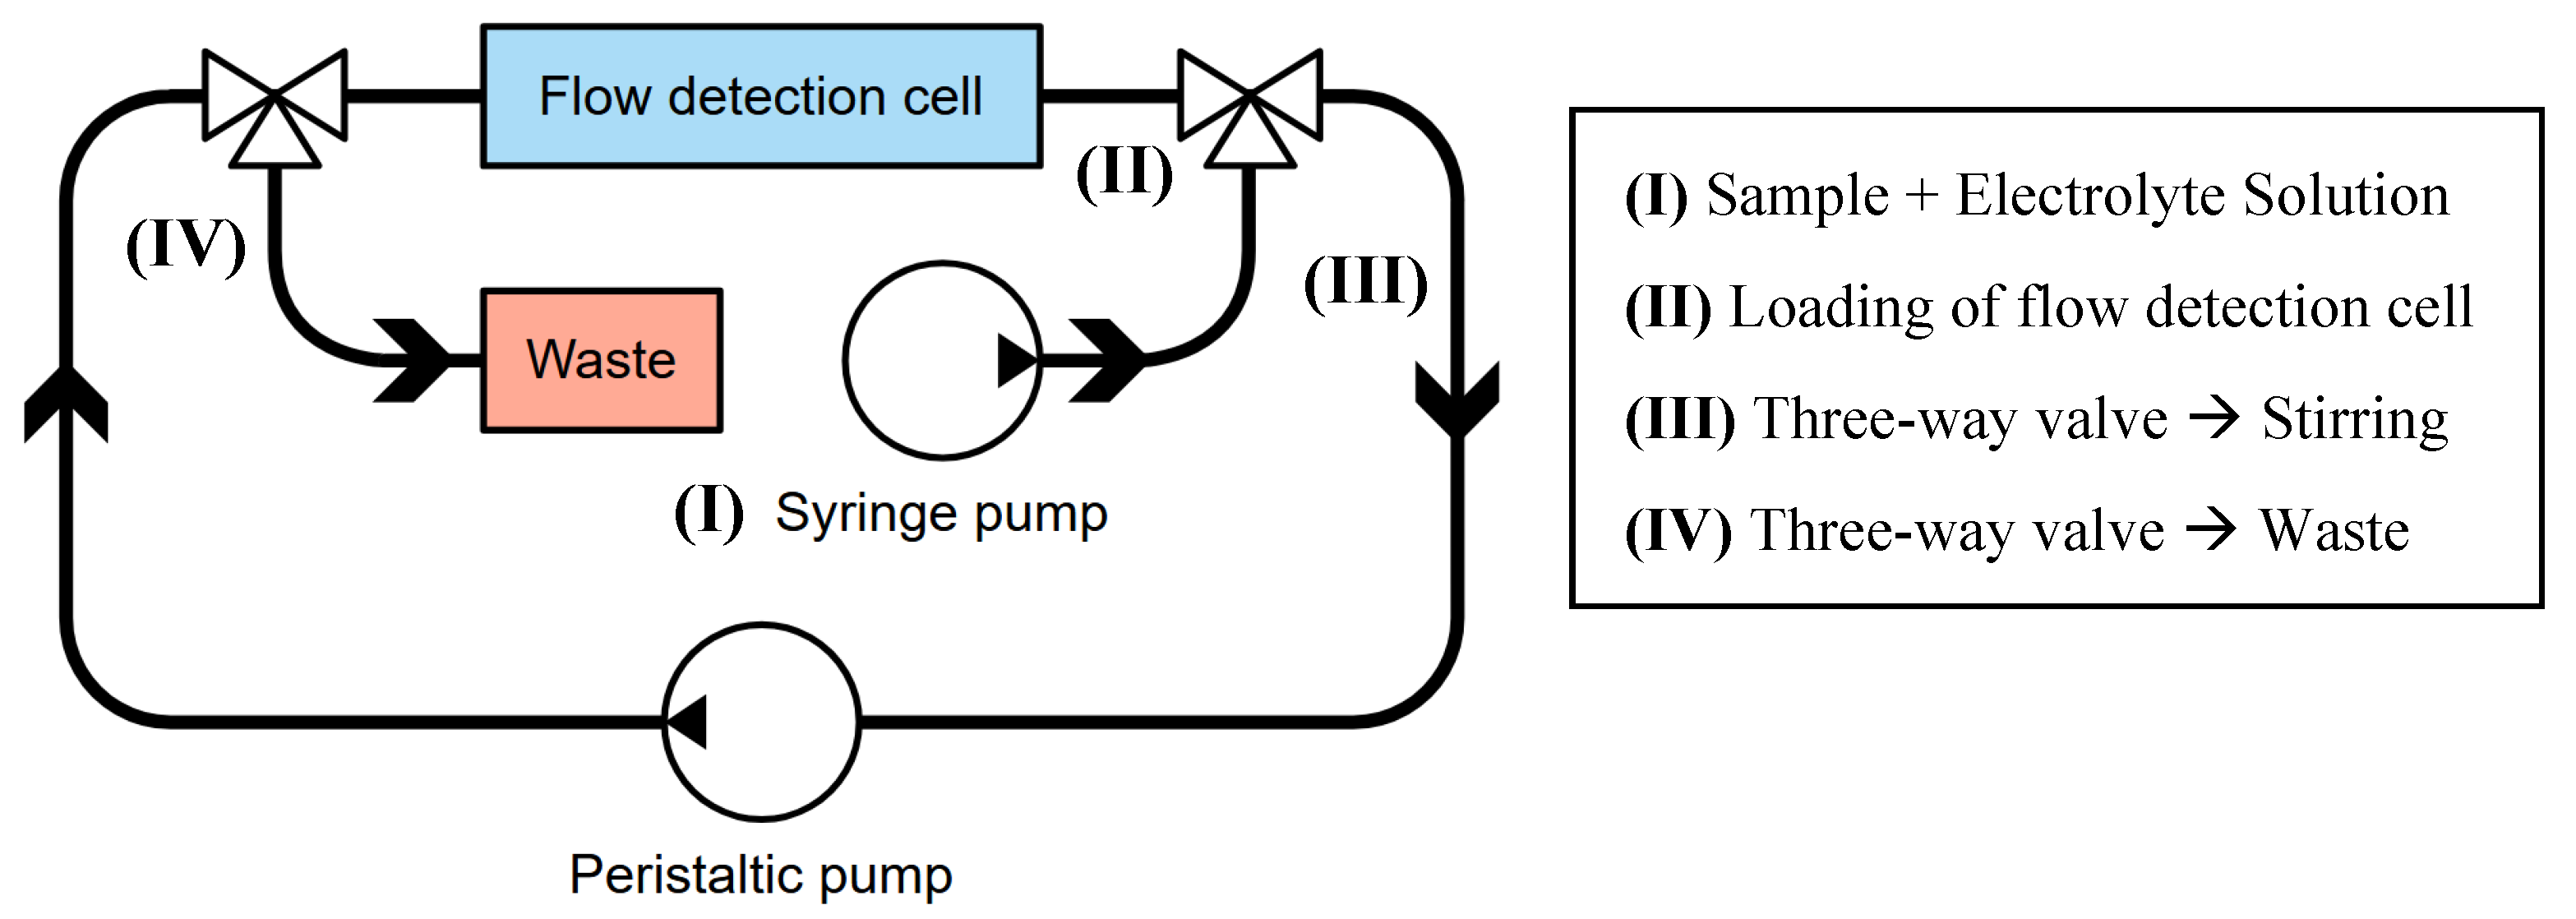
Finally, to automatize the hydraulic system, a three-way valve can be added, as presented in
Figure 4. The sample is initially loaded and directed to fill the flow detection cell, and the three-way valve likely directs the flow from the syringe pump (or a real-word sample) into the main circulatory loop, ensuring the sample reaches the detection cell (II). Once the sample is loaded, the valve is switched to engage the stirring phase (III). The peristaltic pump then actively recirculates the sample through the detection cell, effectively providing in situ agitation. This continuous flow and re-exposure to the detector enables the system to conduct multiple measurements or prolong detection times using a minimal sample volume, which is particularly beneficial for scarce or valuable samples. The second three-way valve is located before the flow detection cell and allows the waste container to be filled. Its function is clearly to divert the spent solution from the system into the waste reservoir. This is essential for proper disposal of chemicals and to prevent contamination of subsequent samples.
The PDMS flow detection cell was characterized through digital microscopy; in particular, DSX1000 from Olympus (Tokyo, Japan) was used for this work.
2.3. Chemical Detection
Different cadmium solutions with known nominal concentrations were prepared from a commercial 1000 µg/L metal standard stock solution (Sigma-Aldrich) specifically designed for ICP analysis and possessing a high degree of purity. To establish the calibration curve of the developing sensor, solutions within the analytical range of interest (0–20 µg/L) were prepared via dilution with Milli-Q ultrapure water and subsequently analysed using ASV through squarewave (SW) voltammetry conditions. Concurrently, the quality of the ASV voltammogram and the characteristics of the peaks were thoroughly examined. For the supporting electrolyte solution, 6 M of hydrochloric acid (HCl), prepared from 37% hydrochloric acid (Sigma-Aldrich), was employed. This selection was based on two primary considerations: the established efficacy of hydrochloric acid as a medium for the electrochemical analysis of heavy metals and its crucial role in maintaining a constant Chloride ion concentration, which is essential for stabilizing the potential of the screen-printed Ag pseudo-reference electrode. An aliquot was taken from the acidic stock solution to prepare a 20 mM HCl solution, which functioned as the electrode-conditioning solution. Then, the electrochemical analyses were performed by the addition of 10 µL of 6 M of HCl to each 10 mL sample containing the analyte. The resulting volume change was largely unnoticed until the end of the experiment. The recorded pH of the experimental running solution was set to ~3. Preliminary tests showed the importance of stirring, which was required to enhance the recorded results. A low revolution per minute (RPM) setting was deliberately chosen, as high-speed agitation was counterproductive. Firstly, it induced physical vibrations in the flexible electrode, leading to signal instability. Secondly, excessively vigorous stirring created turbulent conditions, which prevented the uniform distribution of the analyte and compromised the reproducibility of the results.
To ensure data robustness and accurately characterize signal dispersion, five replicate measurements were performed for each sensor at every concentration, and the curve presented was generated by an averaging of the five replicates. The validation tests were first performed in a benchtop setup to evaluate the behaviour of commercial SPEs, and then, the same repetition-based approach was performed on the flow detection cell equipped with an electrode.
All the experiments were carried out using PalmSens portable potentiostat (Palm Instrument BV, Houten, The Netherlands), and the results were investigated by the PSTrace 5 software. The experimental conditions were a conditioning potential of −0.12 V for 45 s, a deposition potential of −1.1 V for 120 s, an equilibration time of 10 s, an SW amplitude of 25 mV, a step of 5 mV, and a frequency of 25 Hz, implying a total of 175 s for each analysis. Five consecutive analyses were performed on the same sample, which means each nominal concentration sample analysis lasted 15 min.
4. Discussion
Based on the simulations, the chosen configuration demonstrates to be the best one for ensuring current chamber filling, through the syringe pump, and for generating the most suitable flow all over the detection cell by using a peristaltic pump. The set flow rate for analysis was determined by simulating the flow conditions and studying the velocity field on the working electrode. By selecting a flow rate of 10 mL/min, optimal mixing capabilities were observed in the region of interest, showing that this choice can ensure a better SPE response in a continuous analytic system. Moreover, by simulating the fluid flowing into the chamber, it was possible to predict the behaviour of the PDMS walls and of the electrode under stress, thus ensuring that the forces applied were sufficiently low so as not to break the bonds between the cell layers and in cases where the force was lower than the ultimate tensile strength of the material.
Polydimethylsiloxane (PDMS) was mechanically selected as the material for the flow detection cell design primarily due to its exceptional compatibility with the facile replacement of the SPEs not damaging the WE surface. This is a critical factor, as it guarantees the continued integrity of the polymeric film that encapsulates the mercury within the SPE system. In fact, the inherent flexibility and robust sealing properties of PDMS are key to its suitability. These characteristics enable the repeated insertion and removal of sensors without compromising the long-term reliability and consistent analytical performance of the detection system. Also, PDMS chemically exhibits good chemical resistance to hydrochloric acid (HCl), especially at dilute to moderate concentrations and room temperatures, making it a suitable material for applications involving such environments.
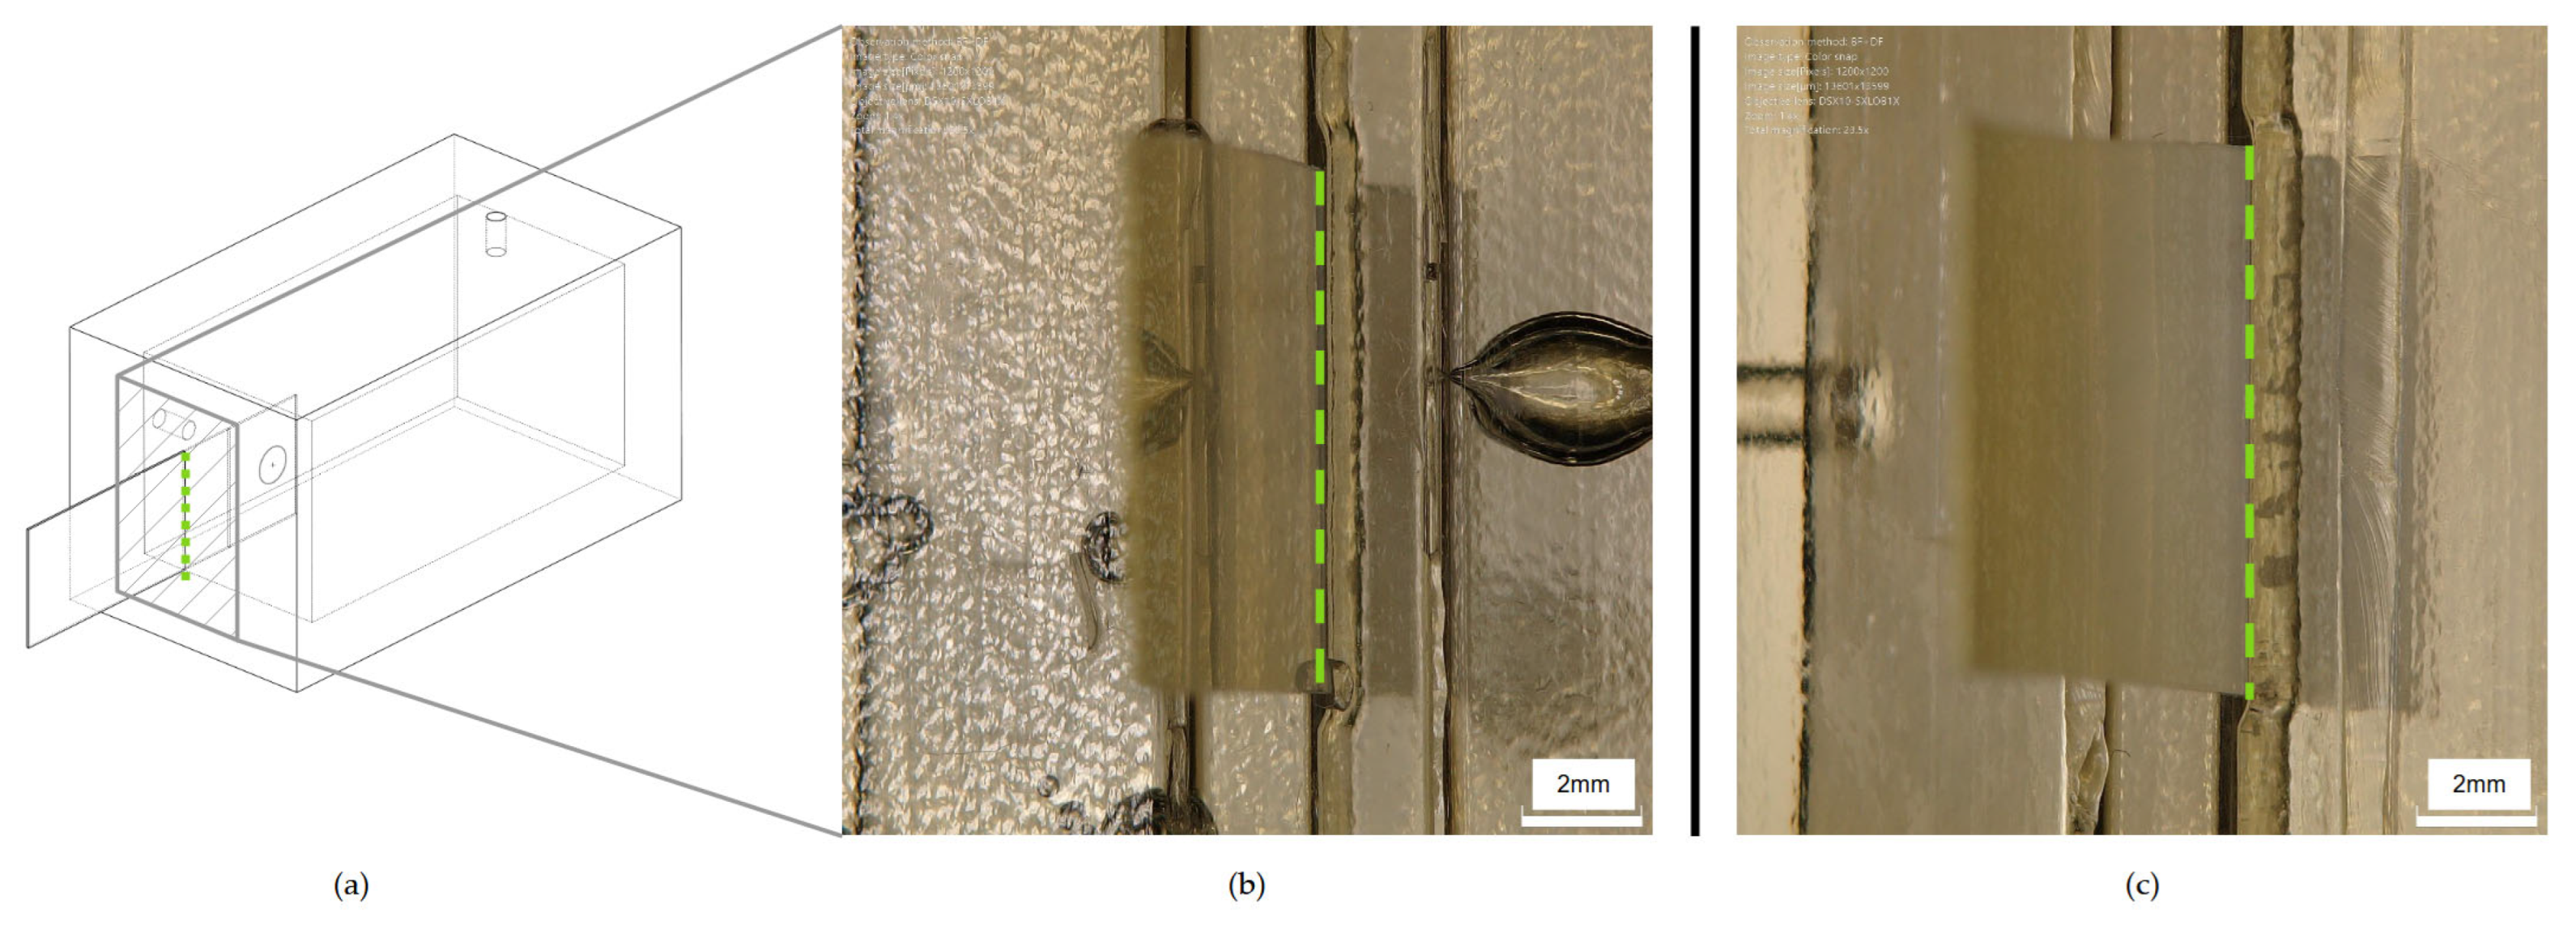
Two different PDMS bonding techniques were tested for fabricating the flow detection cell, plasma bonding and interlayer bonding. While the former ensures a reversible interaction between the PDMS layers, the latter shows an irreversible link between them. The rationale behind the selection of one of the two bonding techniques was which one showed a better sealing of the system. Looking at the flow detection cell geometry, the critical point was the sensor housing (
Figure 14), which could represent a leakage starting point for both.
In flowing water both with a syringe and peristaltic pump, no significant differences were observed in the two different samples, meaning that both sealing techniques could be selected based on the needs for the long-term maintenance and end-of-life destination of the flow detection cell.
The linearity factor stands as a crucial performance element for evaluating calibration curve quality. For the utilized SPEs, the stability of the analytical response was notably robust, exhibiting consistent performance over daily operational cycles and possibly retaining efficacy on consecutive days. The electrode enabled the acquisition of at least between 25–30 daily analyses.
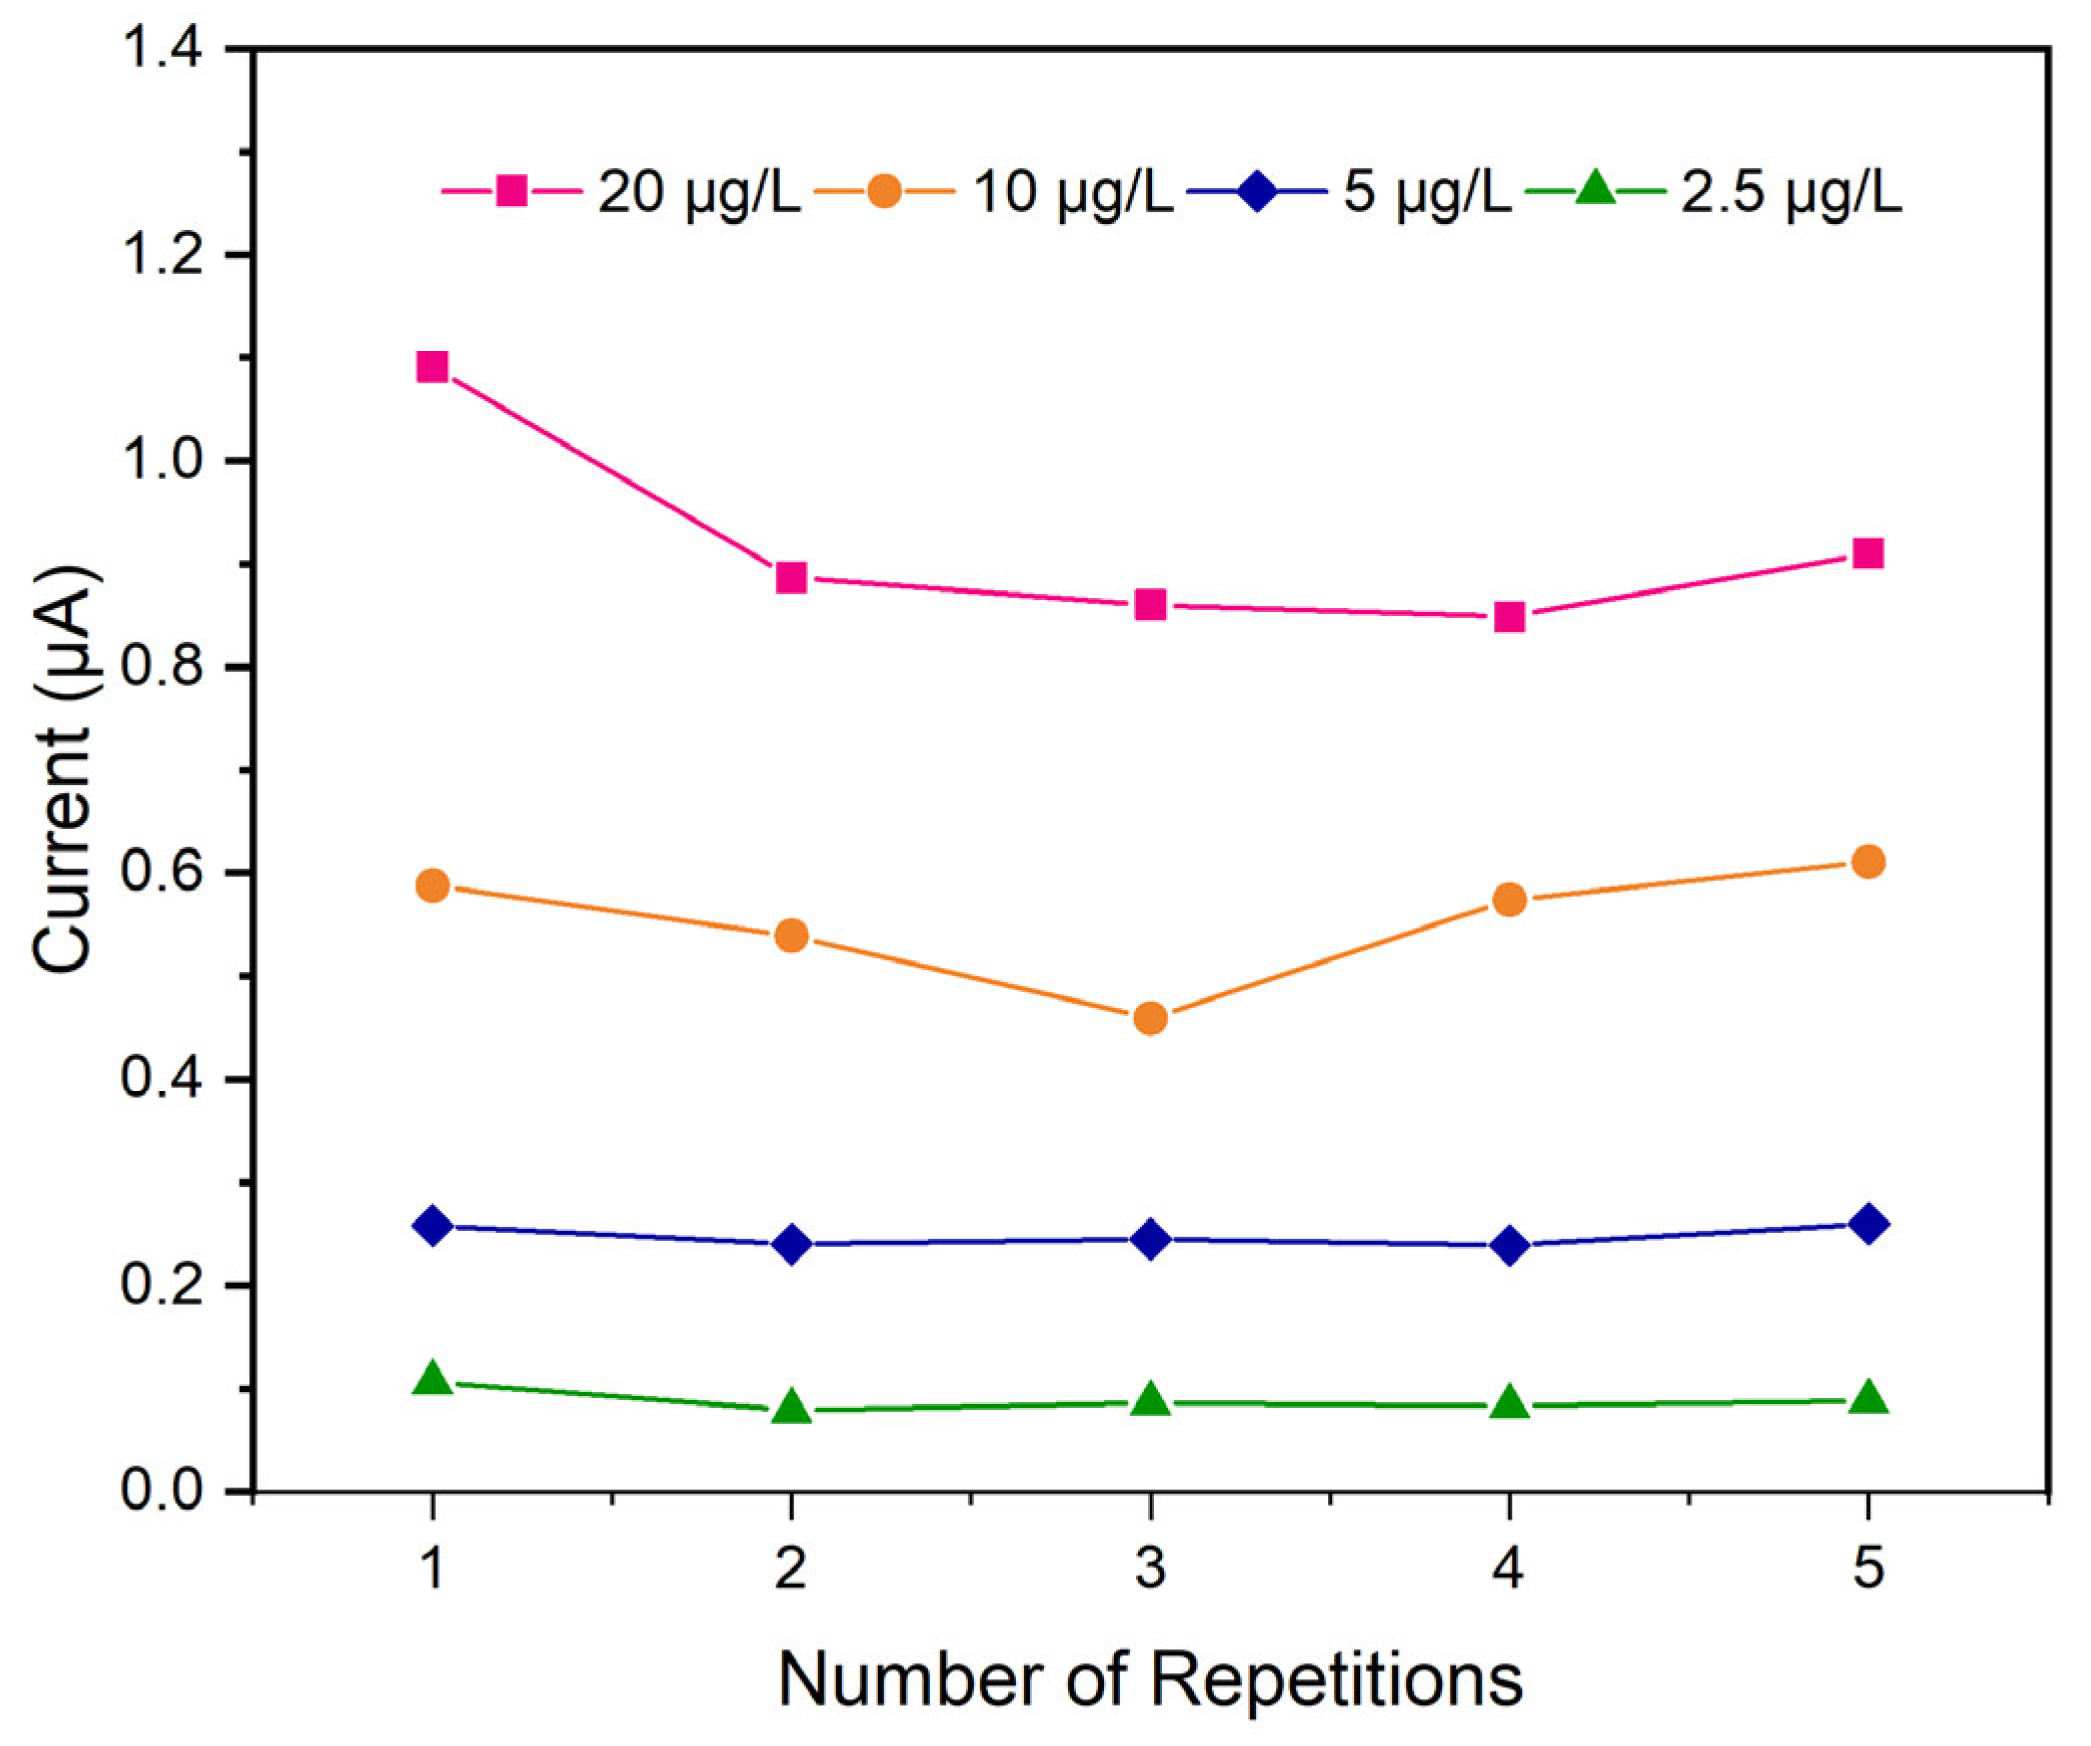
Figure 15 illustrates the impact of repeated measurements (in the range of 2.5–20 μg/L) on the sensitivity of the electrochemical sensor with respect to the current at the maximum peak using an analysis employing SPEs. Across the entirety of the experimental repetitions—from the initial to the final cycle within the five-repetition range for each concentration—a subtle yet consistent decrease in sensitivity was observed. The graph suggests a gradual decline in the electrode responsiveness over successive measurements under the established experimental conditions. The first repetition shows the highest overall current, indicating the highest initial sensitivity across all concentrations. From repetition 1 to repetition 4, there is a noticeable decrease in the overall current for all concentrations. This suggests a decline in the sensitivity or performance of the detection system with successive measurements. This could be due to various factors, such as electrode fouling, a depletion in reagents, or degradation of the sensing surface. However, the current values for repetition 5 show an unexpected increase. This unexpected surge in sensitivity after a period of decline can most likely be attributed to the saturation of the WE active surface area. As the electrode undergoes repeated exposure to the analyte, the available binding sites or reactive surfaces become increasingly occupied. Once a critical threshold of saturation is reached, the SPEs’ response mechanism may alter, leading to an artificially inflated signal, which manifests as the observed increase in the final measurements. This phenomenon highlights the importance of considering electrode surface dynamics and potential saturation effects when interpreting data from repetitive electrochemical measurements.
Overall sensor sensitivity remains stable, exhibiting only minor fluctuations, and this is also confirmed by the calculated standard deviation minor of 0.1% for each concentration repetition. Despite this minor starting reduction, the sensor maintains sufficient stability for routine daily field analyses.
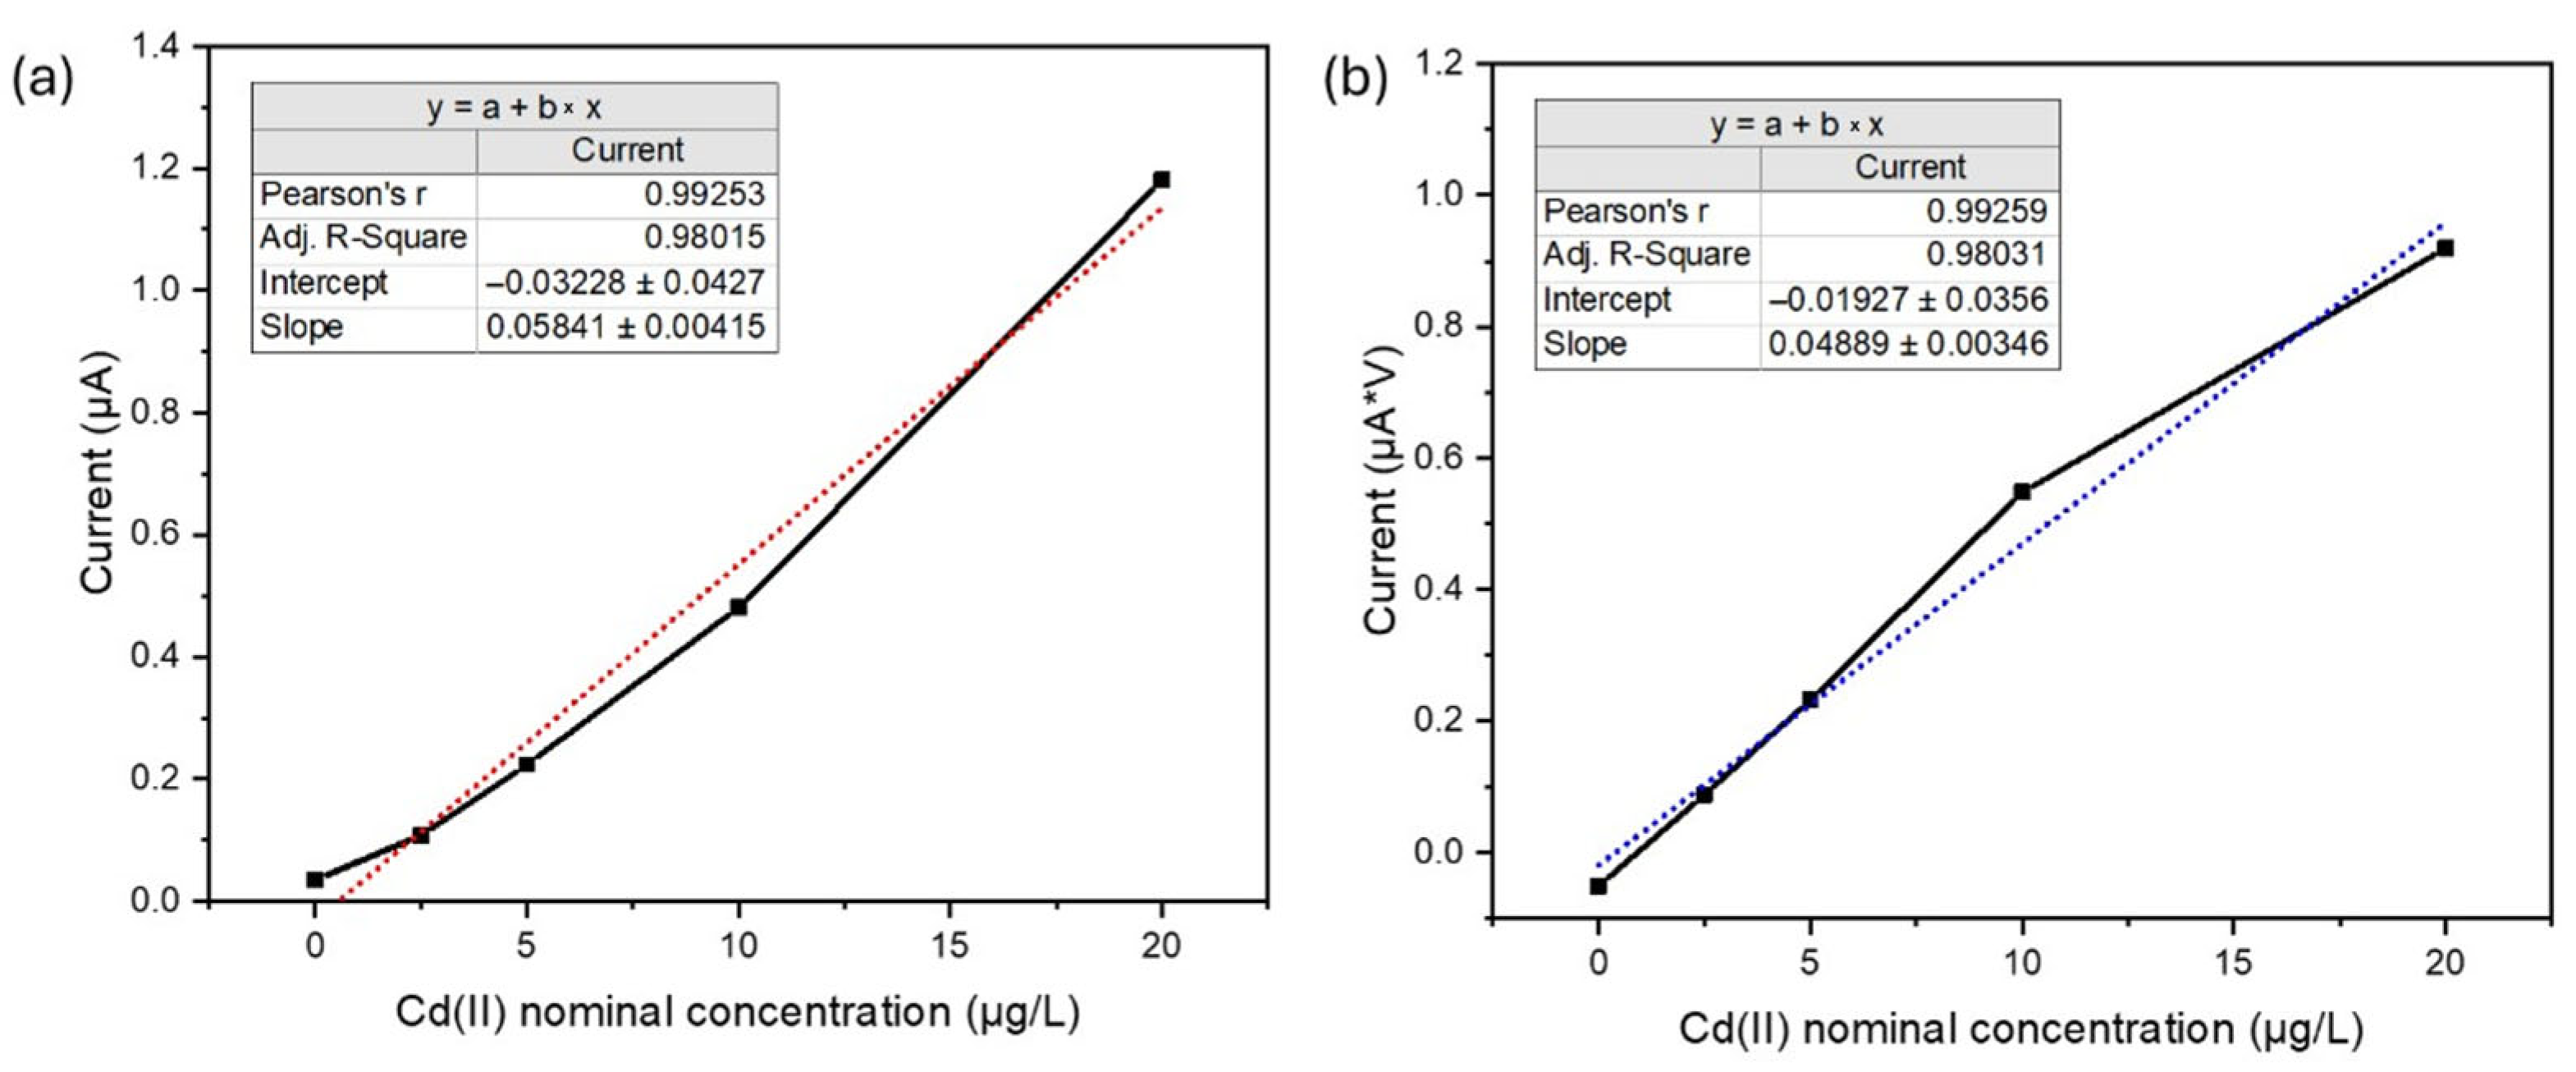
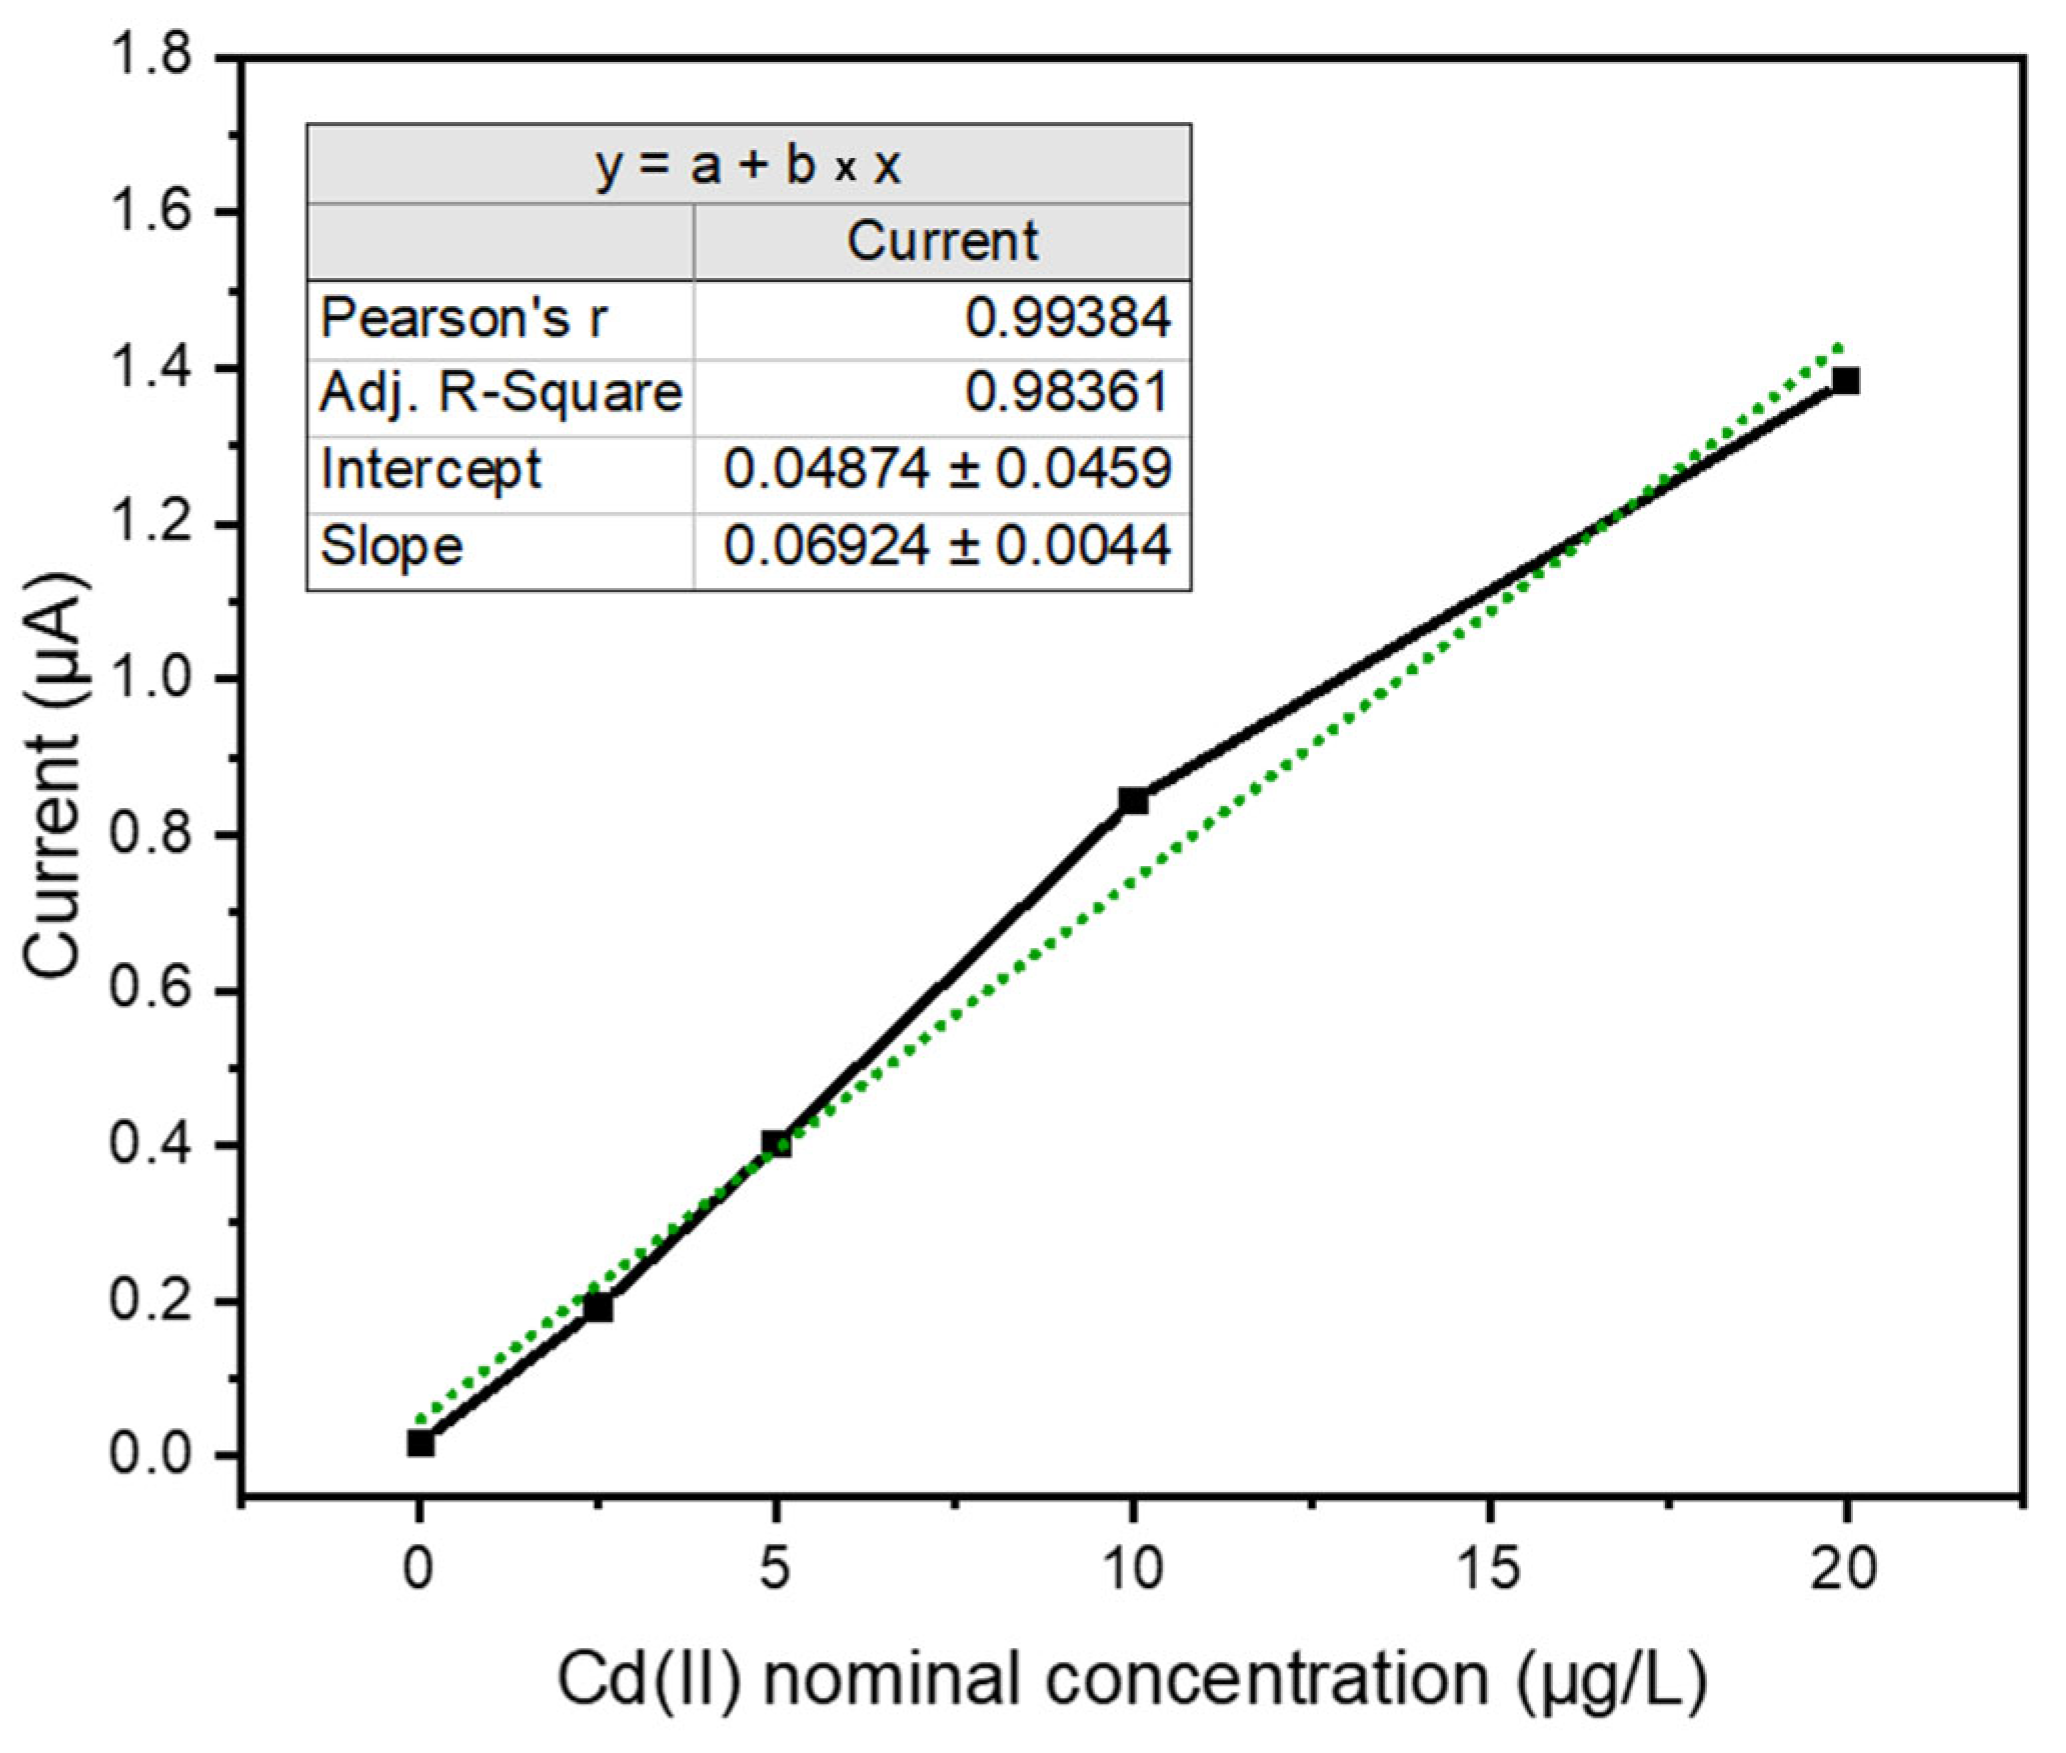
Furthermore, these recorded measurements were utilized for both the construction of the calibration curve and the subsequent analysis of the nominally contaminated laboratory sample. This long-term performance is rigorously monitored by evaluating the gradient of the calibration slopes (nA/ppb), which consistently approximates a value of 60. This observation is significant as it aligns closely with the established excellent performance reported for this electrode technology. Crucially, this consistent gradient value also serves to validate the chosen methodology for constructing the calibration curve, which relies on the maximum peak current recorded instead of the area.
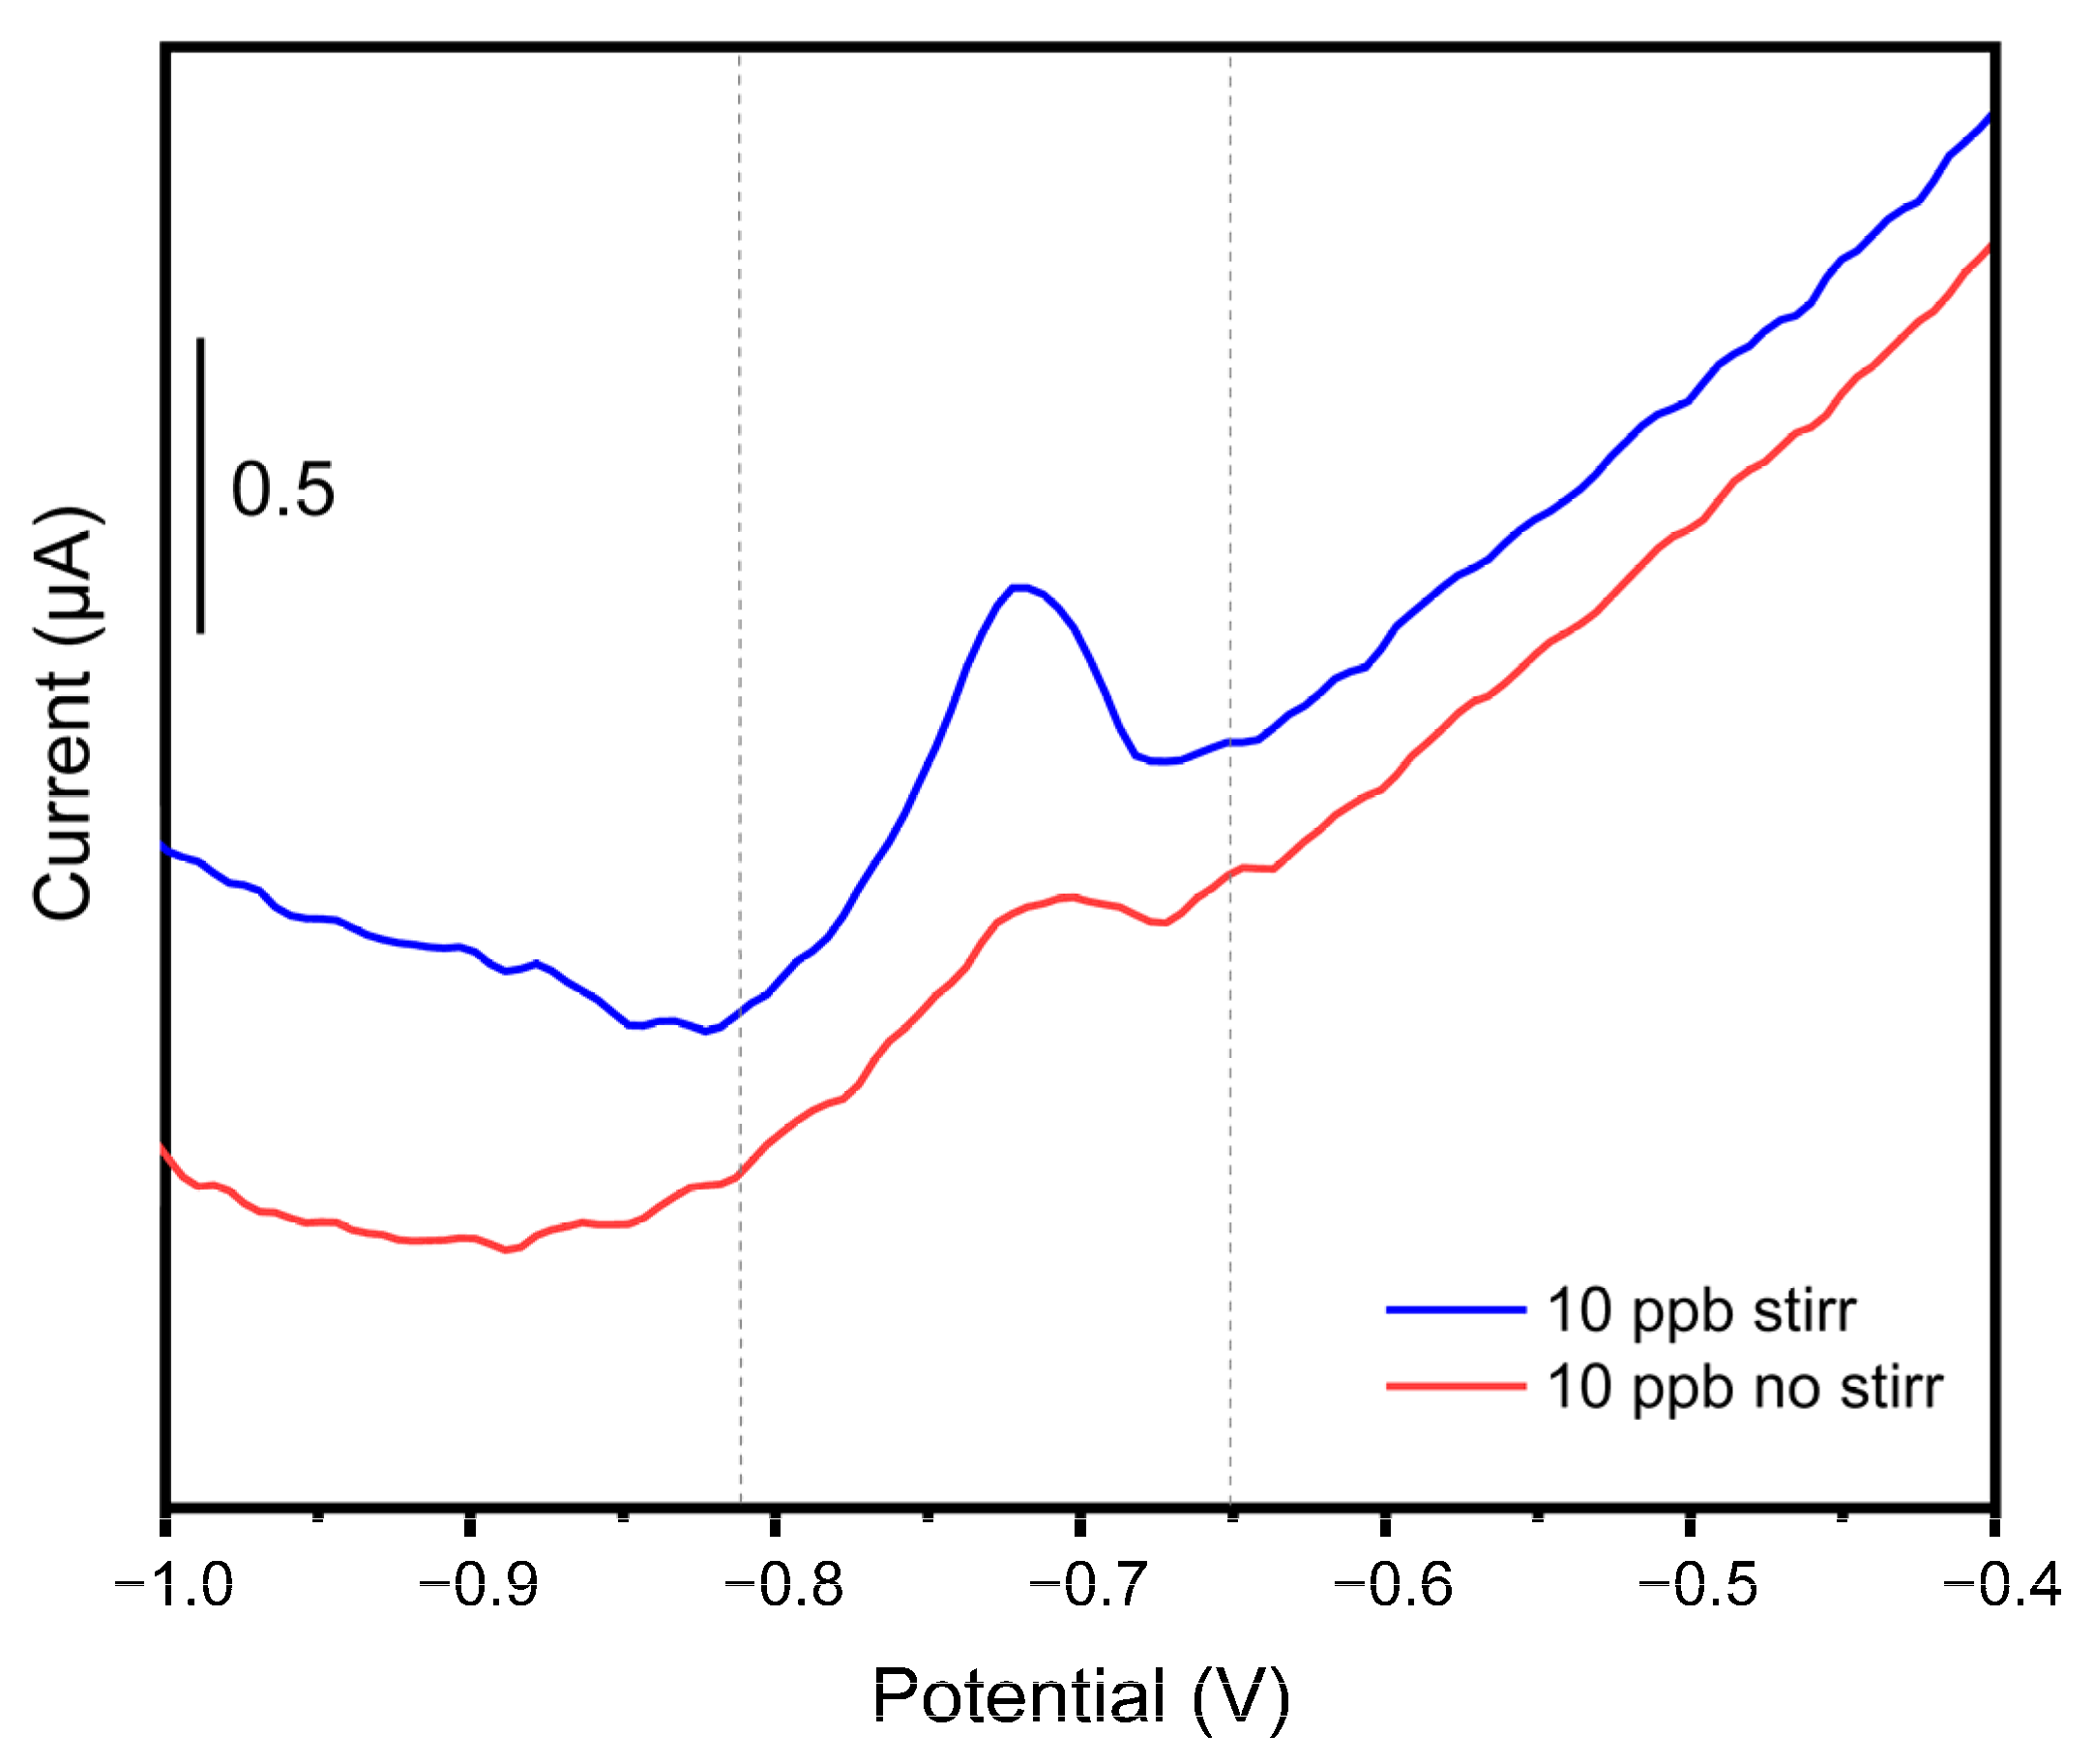
The voltammograms in
Figure 16. directly compare the electrochemical response at the same nominal cadmium concentration of 10 µg/L (ppb). This comparison highlights the crucial importance of integrating magnetic stirring during the analyte deposition phase within the measurement setup. Insufficient or absent stirring significantly impairs cadmium detection, resulting in a notable decrease in signal intensity and a loss of the characteristic peak shape. In fact, stirring serves to continuously transport fresh analyte species from the bulk solution to the electrode surface. Without it, a depletion zone forms around the electrode, where the concentration of the analyte is significantly lower than in the bulk. Stirring minimizes this depletion layer, ensuring a more efficient and rapid mass transport of cadmium ions to the WE area. This enhanced mass transport leads to a greater amount of analyte being deposited onto the electrode surface within a given pre-concentration time, directly translating to a higher and more well-defined stripping peak during the anodic scan. Consequently, the signal intensity is significantly improved, and the characteristic peak shape, indicative of efficient stripping, is maintained, leading to more accurate and reliable quantitative analysis.
For these reasons, the integration of a peristaltic pump, which ensures analyte recirculation directly over the detection area, is mandatory, especially for field analyses where signal intensity might already be mitigated by non-ideal external conditions.
5. Conclusions
Cadmium (Cd) stands out as one of the most hazardous heavy metals, posing significant threats to both environmental safety and human health. Its rapid bioaccumulation in plants leads to its subsequent rapid entry into the food chain, making its presence in agricultural ecosystems particularly concerning. Given this critical issue, especially in groundwater and freshwater sources adjacent to agricultural fields where fertilizers may contribute to cadmium release into the soil, the implementation of an in situ monitoring system is essential. Such a system would serve as a crucial early warning mechanism, significantly reducing the time required for analysis. This expedited data acquisition would enable competent authorities to intervene immediately, mitigating potential contamination and safeguarding public health.
Among the various analytical techniques available for the prototyping of in situ sensor systems, those based on electrochemistry have proven particularly effective. Specifically, stripping voltammetry, particularly anodic stripping voltammetry (ASV) in the screen-printed electrode (SPE) configuration, stands out as a highly efficacious approach.
The primary objective of this research was to adapt a commercial sensor and design a custom-built flow cell detection system. This integrated system aimed to enable the efficient analysis of cadmium within a single workday. The described additive manufacturing techniques enable rapid prototyping. Specifically, the incorporation of plasma bonding facilitates straightforward maintenance of the developed system. This is due to the easy bond removability with a gentle mechanical force, allowing for internal cleaning of the system without causing damage to the fabricated cell.
The described prototyping methodology and chemical analysis system offer significant cost-effectiveness when compared to conventional laboratory-based processes. Traditional laboratory analyses, beyond being a time-consuming endeavour, typically involves substantial acquisition costs for instrumentation and necessitates the employment of highly specialized personnel to perform the analyses. As detailed in
Table 3, the overall cost of our proposed system is primarily disaggregated into three key components: the initial instrumentation investment, the total analytical cost (calculated for approximately 25 analyses per day), and the device maintenance cost to eventually substitute the flow detection cell and SPEs. Crucially, even when factoring in the initial investment, the daily operational cost remains well below EUR 100 per day of analysis, highlighting its economic viability for routine deployment.
In situ monitoring sensors for field analysis also require meticulous preservation. This is particularly crucial because impurities from real-world solution samples can severely compromise the entire system. Such contaminants can damage the fluidic components and, even more critically, interfere with the analytical process by depositing on the working electrode area. This deposition can lead to inaccurate readings and reduce the sensor’s overall lifespan and reliability. Considering the system’s intended in situ application, it is also important to note that the sensor can be equipped with an integrated filter. This filter, developed by our research group in previous work, can again be fabricated via additive manufacturing, ensuring compatibility between the two systems [
47]. Its inclusion is crucial for preventing potential clogging from real water matrices, which could otherwise lead to blockages within the microfluidic system and introduce inaccuracies in signal readings.
Together with the evaluation of possible solutions for system preservation, the performance of the flow detection cell in a real environment would be analysed. For this, real contaminated water samples should be tested within the system, assessing not only the accuracy in the Cd(II) evaluation but also the interference of other heavy metal contaminants, due to the robustness of SPEs to surfactants and oils [
55].
As a final remark, it is important to highlight that the future development roadmap for the entire sensing platform includes a significant focus on system automation. This will be achieved through the integration of a customized electronic platform, aiming to enhance efficiency and reduce manual intervention in the analytical process.
Finally, this research successfully demonstrates the development of a cost-effective and efficient in situ monitoring flow detection cell for cadmium detection in environmentally sensitive agricultural settings.

