Article

Integrated Assessment of Groundwater Quality Using Water Quality Indices, Geospatial Analysis, and Neural Networks in a Rural Hungarian Settlement

1
Department of Data Science and Visualization, Faculty of Informatics, University of Debrecen, H-4028 Debrecen, Hungary
2
Department of Landscape Protection and Environmental Geography, University of Debrecen, H-4032 Debrecen, Hungary
*
Author to whom correspondence should be addressed.
Water 2025, 17(16), 2371; https://doi.org/10.3390/w17162371
Submission received: 14 July 2025 / Revised: 2 August 2025 / Accepted: 8 August 2025 / Published: 10 August 2025
(This article belongs to the Special Issue Urban Water Pollution Control: Theory and Technology)

Abstract

In the present study, the changes in the groundwater quality in a Hungarian settlement, Báránd, were examined, nine years after the construction of a sewerage network. The sewerage network in the study area was completed in 2014, with a household connection rate exceeding 97% in 2023. In the summer of 2023, water samples were taken from 37 dug groundwater wells. Changes in the water quality were assessed using three water quality indicators (the Water Quality Index (WQI), Contamination degree (Cd), and Canadian Council of Ministers of the Environment Water Quality Index (CCME WQI)) and geographic information (GIS), data visualization systems, and artificial intelligence (AI). During the evaluation of the quality of the groundwater, eight water chemical parameters were used (pH, EC, NH4+, NO2, NO3, PO43−, COD, Na+). Based on interpolated maps and water quality indices, it was established that while an increasing portion of the area exhibits adequate or good water quality compared to the pre-sewerage period, a deterioration has occurred relative to recent years. Even nine years after the sewerage network construction, elevated concentrations of inorganic nitrogen forms and organic matter persist, indicating the continued presence of accumulated pollutants, as confirmed by all three water quality indicators to varying degrees and spatial patterns. The interactive data visualization and cloud-based sharing of the data of the water quality geodatabase were made freely available with the help of Tableau Public. A Feed-Forward Neural Network (FFNN) was developed to predict the groundwater quality, estimating the water quality statuses of three water quality indicators based on water chemistry parameters. The results showed that the applied training algorithms and activation functions proved to be the most effective in the case of different network structures. The most accurate prediction of the WQI and CCME WQI indicators was provided by the Bayesian control algorithm (trainbr), which achieved the lowest mean-squared error (RMSEWQI = 0.1205, RMSECCME WQI = 0.1305) and the highest determination coefficient (R2WQI = 0.9916, R2CCME WQI = 0.9838). For the Cd index, the accuracy of the model was lower (RMSE = 0.1621, R2 = 0.9714), suggesting that this indicator is more difficult to predict. With regard to our study, it should be emphasized that data visualization is a particularly practical tool for the post-processing of spatial monitoring data, as it is suitable for displaying information in an intuitive, visual form, for discovering spatial patterns and relationships, and for performing real-time analyses. AI is expected to further increase visualization efficiency in the future, enabling the rapid processing of large amounts of data and spatial databases, as well as the identification of complex patterns.

1. Introduction

Deterioration in surface and groundwater quality is a global-scale issue, particularly in rural areas where urbanization and industrial activities exert significant pressure on water resources and their quality [1]. Besides industry and agriculture, domestic wastewater is one of the principal pollution sources in and around settlements, and its treatment continues to be insufficiently resolved [2,3,4,5,6,7]. In addition to continuously monitoring the deterioration in water quality caused by municipal wastewater, the mapping of pollution is a particularly important task, utilizing water quality indicators and modern GIS decision support systems [8]. International studies have shown that the construction of a sewerage network can have a significant impact on the water management of a settlement, as the lack of wastewater drainage and treatment can pose serious environmental and health risks [9]. The introduction of a sewerage system not only reduces the quantity of wastewater but also aims to improve the quality of surface and groundwater, which directly affects the quality of life of the local population and environmental sustainability [10].
The assessment of water quality based on scientific foundations was made possible by the water quality index introduced by Horton (1965), which has been modified several times over the past sixty years (Brown’s Index (Water Quality Index, WQI), US National Sanitation Foundation Water Quality Index (NSFWQI), Oregon and British Columbia indices (OWQI, BCWQI), and Canadian Council of Ministers of the Environment Water Quality Index (CCME WQI)), or by including and aggregating additional parameters (Liou index, Smith’s index, Overall Index of Pollution (OIP), Equity Index (EQ index)) [11,12,13,14,15,16,17,18,19,20]. Uddin et al. provided a detailed overview of a comparative investigation of the 21 most commonly used water quality indices, highlighting the number of parameters, the weight of factors, and their uncertainties during the selection of water quality indices [21]. Several international studies have concluded that the most important function of water quality indices is to ensure the generation and interpretation of information on the state of water quality by minimizing the data of a large number of input parameters [22,23,24,25]. Water quality information generated on the basis of index values, integrated into webGIS decision support systems and supported by interactive data visualization tools, provides additional assistance to decision-makers in monitoring changes, enabling them to take prompt or even immediate action [26]. Application of these technologies has become particularly important in areas where the effects of water pollution pose a serious threat to the drinking water supply and agricultural production [27].
The integration of artificial intelligence (AI) and GIS technologies has also led to significant advances in the processing, spatial visualization, and analysis of geodatabases that store water quality data [28]. Machine learning models such as random forests (RFs), artificial neural networks (ANNs), and support vector machines (SVMs) have proven to be extremely effective at predicting water quality data due to their ability to handle large amounts of heterogeneous data and detect spatial patterns by training input water quality parameters [29].
The relevance of our research is indicated by the fact that publications have been published on the deterioration in and contamination of water quality caused by wastewater in the urban environment in Hungary [30,31,32]. However, water quality studies based on monitoring data with the help of modern GIS data visualization tools and with the involvement of AI have not yet become the focus of international research.
Based on the above, the primary objective of the research is to determine whether the groundwater resource remains contaminated in the settlement of Báránd, located in the Great Hungarian Plain, nine years after the construction of the sewerage network, and to what extent this condition is reflected in various water quality indicators. Based on this, the following research objectives were defined:
  • Construction of a geodatabase involving 37 dug groundwater wells based on sampling and measurement data. Determination of water quality indices using the Water Quality Index (WQI), Contamination degree (Cd), and Canadian Council of the Ministers of the Environment Water Quality Index (CCME WQI).
  • Creation and training of a neural network based on water chemistry parameters for the estimation and performance evaluation of the groundwater quality.
  • Mapping, interactive data visualization, and cloud-based sharing of the settlement using three water quality indicators.

2. Materials and Methods

2.1. Study Area and Previous Research Results

Báránd is located in the eastern part of Hungary in Europe. The settlement is situated in the Nagy–Sárrét microregion, which is part of the Great Hungarian Plain (Figure 1). The population of Báránd was approximately 2500 in 2022 [33]. The flat plain’s altitude is generally between 85 and 89 m above sea level, with a relative relief of 0–3 m/km2. The direction of regional groundwater flow is from north to south. The groundwater level is close to the surface (1–5 m). According to the World Reference Base for Soil Resources (WRB), the prevailing Reference Soil Groups are Solonetz, Vertisols, Kastanozems, and Chernozems; in residential zones, anthropogenic alteration has produced Anthrosols and Technosols [34]. The study area is predominantly composed of Late Holocene and Late Pleistocene fluvial sediments, consisting mainly of clay and silt, with interbedded alluvial sand layers, while the prevailing soil texture is characterized by loam and clay loam. The region experiences an average annual precipitation of 520–540 mm and is characterized by a moderately warm and dry climate, classified as Cfb according to the Köppen climate classification system [35].
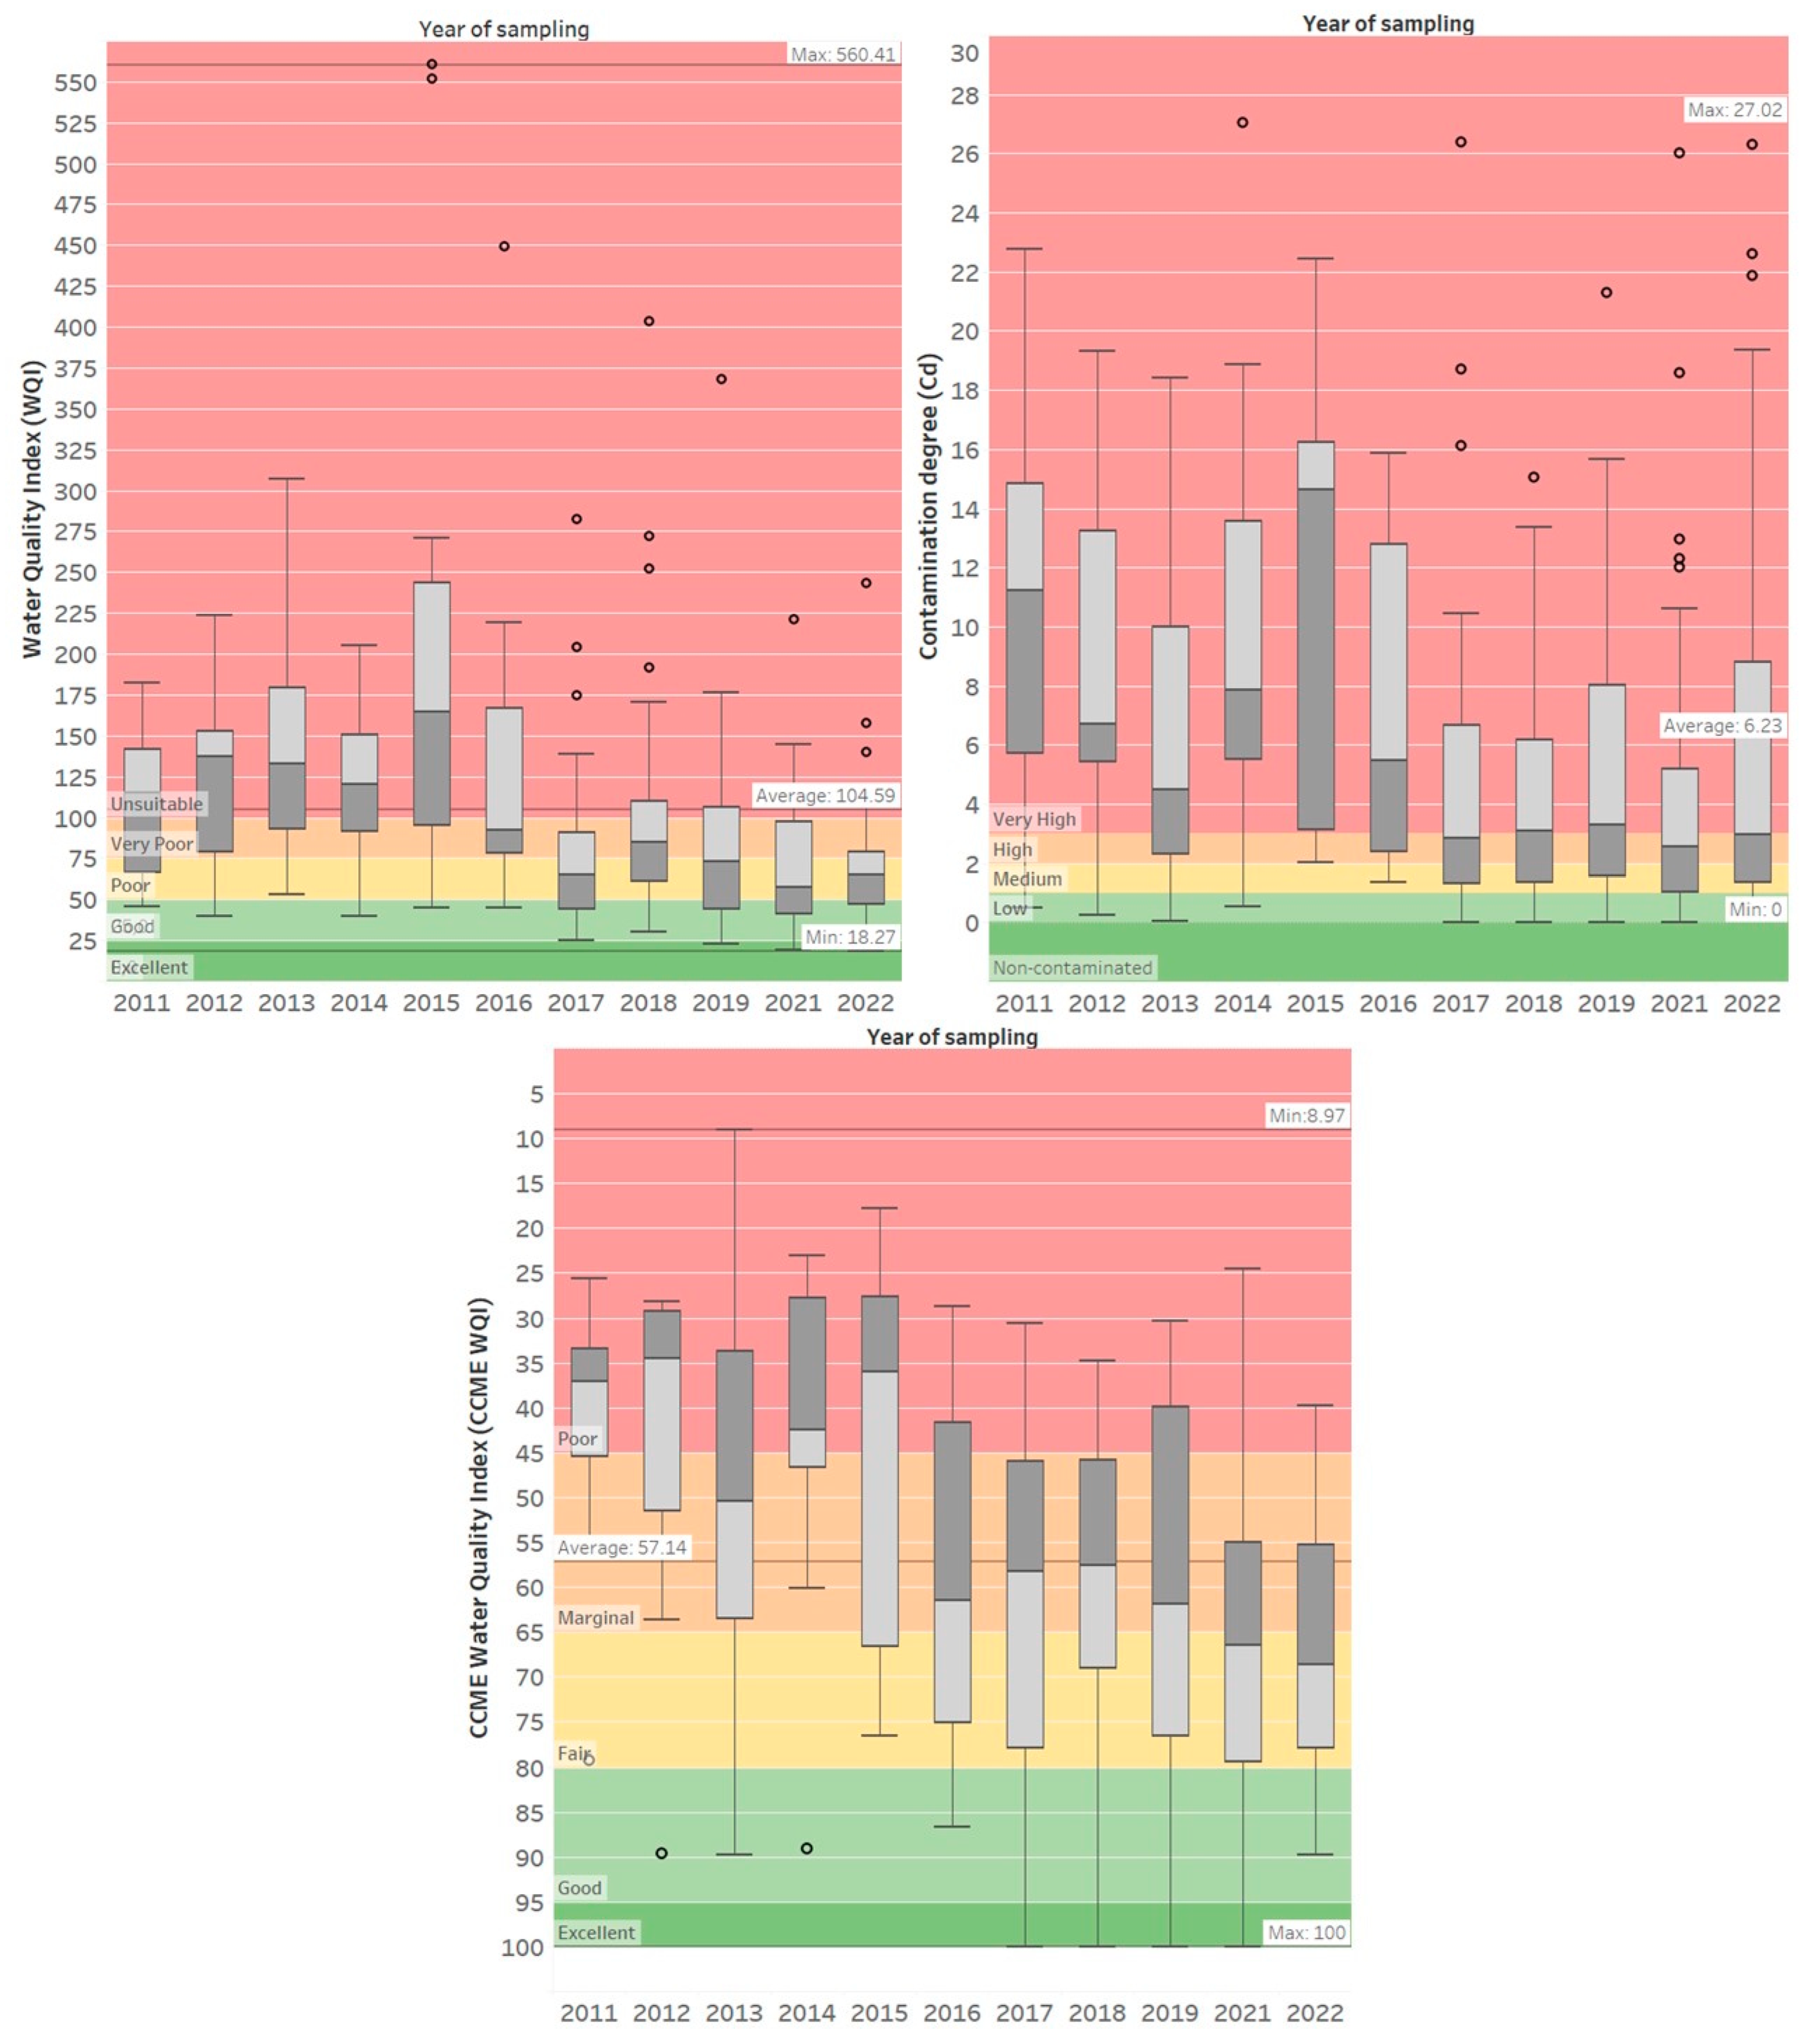
A decade-long assessment of the municipal groundwater quality was initiated in 2011 in Báránd, Hungary, where no settlement-scale comparison of pre- and post-sewerage conditions had previously been reported. This knowledge gap has been addressed through a sequential publication by Mester et al. and Balla et al. [10,35,36,37,38,39]. A spatial monitoring network of 5–6 m deep dug wells was established; its size was expanded from 14 wells in 2011 to 40 wells by 2022, although sampling was not permitted in 2020 owing to COVID-19 restrictions. Only wells with uninterrupted records were retained for analysis. During each sampling at the same time of year, characteristic wastewater parameters—electrical conductivity, pH, chemical oxygen demand, Na+, PO43−, NH4+, NO2, and NO3—were determined by the relevant Hungarian standards. Hydrochemical data and well coordinates were compiled into a georeferenced time-series database, enabling subsequent spatial–temporal mapping. The data show a high level of contamination of the municipality’s water resources [39]. In the period before the construction of the sewerage network, the population used to store domestic wastewater in uninsulated septic tanks, from which, according to calculations, nearly 50% of the wastewater could have leaked, causing significant pollution [35]. Significant positive changes in groundwater quality and groundwater levels have been detected in the period following the construction of a sewerage network, and further investigation of these changes is of paramount importance for monitoring the purification process (Figure 2).

2.2. Water Sampling and Analysis

In our research, 37 dug groundwater wells were investigated in the study area. Water samples were collected from each well’s upper 1 m water column. The pH and electrical conductivity (EC) values of the samples were measured with a WTW 315i meter; the collected water samples, ammonium (NH4+), nitrite (NO2), nitrate (NO3), and orthophosphate (PO43−) were determined by a spectrophotometer according to HS ISO 7150-1:1992, HS 448-18:2009, and HS 1484-13:2009. The chemical oxygen demand (COD) was determined using the KMnO4 method and sodium (Na+) with the PerkinElmer 3110 AAS instrument (Shelton, CT, USA). Water samples were analyzed according to HS 21464:1998 [40] after extraction of three times the well volume using a peristaltic pump and recorded [41,42,43].

2.3. Applied Water Quality Indices

Using the above-mentioned water chemistry parameters, three different water quality indices (Water Quality Index (WQI), Contamination degree (Cd), Canadian Council of the Ministers of the Environment Water Quality Index (CCME-WQI)) are used to assess water quality [12,19,44]. The calculation of these indices is included in Appendix A. Evaluation of the WQS, CCME WQS, and Cd statuses is shown in Table 1.

2.4. Artificial Neural Network

To evaluate the performances of the water quality indicators, a Feed-Forward Neural Network (FFNN) was created. The FFNN graph model is a controlled teach-in feed-forward neural network realizing a controlled training that contains three layers: an input layer (pH, EC, NH4+, NO2, NO3, PO43−, COD, Na+), a hidden layer, and an output layer (water quality status based on the WQI and CCME WQI; degree of contamination based on the Cd index). The front-coupled network means that the signal flows from left to right; i.e., the input of a given layer neuron will be the output of the layer neuron to its left; i.e., the graph theoretical representation of the network does not contain any loop [45,46] (Figure 3).
When training the models, in the first phase, the parameters of the functions used as transfer functions were set in a self-organizing way; then, in the second phase, the weight factors and distortions between the neurons in the hidden layer and the hidden and output layers were determined by an iteration process (N = 20).
When using neural networks, the sample set was randomly divided into three subsets (training set: 70%; test set: 15%; validation: 15%). The performances and generalization abilities of the models fundamentally depended on the definition of these sets [45].
The design and training of the neural networks and the performance evaluation of the models were implemented in a MATLAB R2020a environment using controlled training with a feed-forward architecture [47]. Hyperparameters were fine-tuned as follows:
  • Training algorithm: trainlm—Levenberg–Marquardt; trainscg—Scaled Conjugate Gradient; trainbr—Bayesian Regularization [48];
  • Number of neurons: 10-17-19-21-25;
  • Activation function: radbas, tribas, and tansig;
  • Initial learning rate: 0.01 (adaptive).
To evaluate the performances of the applied water quality models, two statistical indicators were used: the root-mean-square error (RMSE) and the determination coefficient (R2). The formulas for these statistical indicators are as follows:
RMSE   =   1 N   i = 1 N v i     y i 2 a = 1 ,
R 2 = i = 1 n v i v ¯ y i y ¯ 2 i = 1 n v i v ¯ 2 i = 1 n y i y ¯ 2 a = 1 ,
where n is the number of elements of the input samples; vi and yi express the i-th measured and estimated output data, and v ¯ and y ¯ express the average of these measured data [45].

2.5. GIS Process and Data Visualization

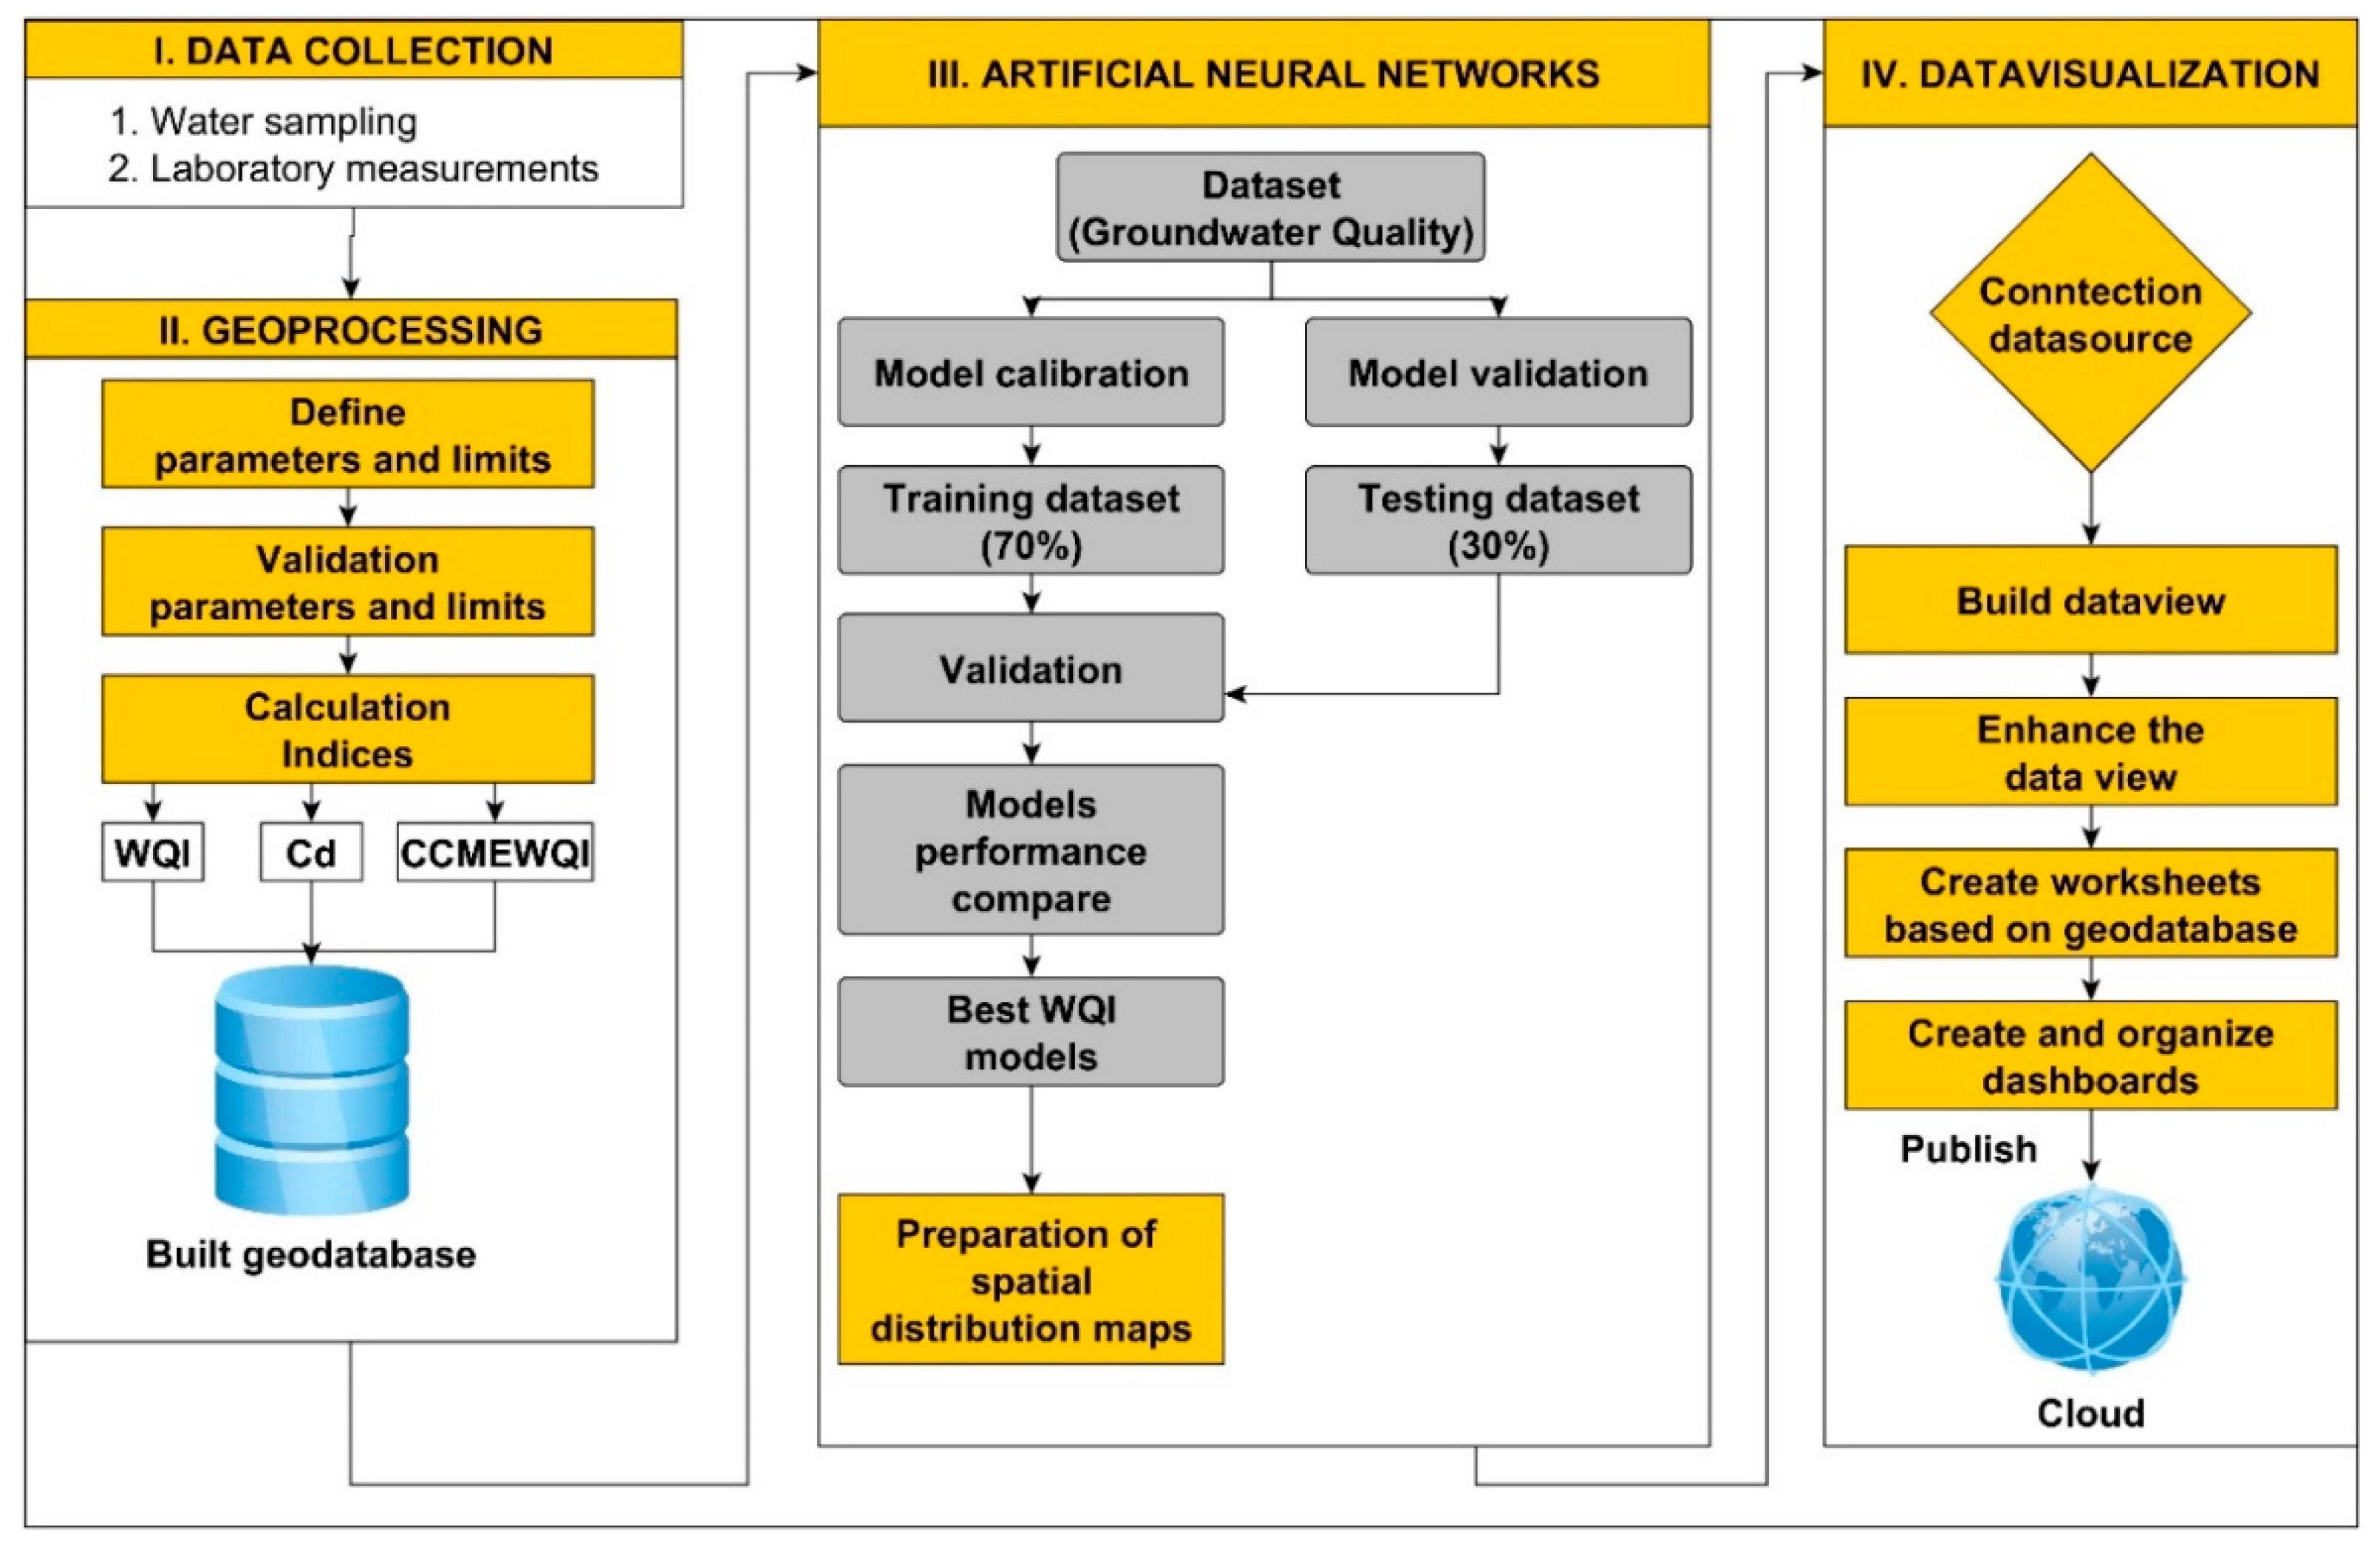
The mapping, evaluation, and cloud-based data visualization of the water quality status of the settlement was carried out based on four workflows (I. Data collection, II. Data processing, III. Establishment of an artificial neural network, IV. Data visualization) (Figure 4). During data collection, laboratory measurements of the water samples taken and the determination of the water quality indices were carried out using the webGIS (http://www.webgis.com/) tool [38]. Ordinary kriging was used to represent the spatial distribution of the water quality parameters because this geostatistical method minimizes estimation error through the variogram model while taking into account spatial autocorrelation. The method is considered particularly effective for heterogeneous datasets (e.g., nitrate, ammonium) since a uniform distribution of sampling points is not assumed, unlike with IDW. An exponential kernel was applied to calibrate the variogram model, using the parameter set that produced the smallest error (RMSE) [49].
The interactive data visualization of the created geodatabase was carried out on the graphical interface of the Tableau software 2024.3. In the data preparation phase, the geodatabase and defined dimensions and metrics were connected. In the second phase, views (diagrams, tables, tree maps, point maps), interactive filters, and dashboards were designed presenting the spatial evolution of the soil chemistry parameters and water quality data. In the last phase, a story was created by stitching together the completed dashboards, which was made freely available with the help of Tableau Public [50].

3. Results

3.1. Assessment of Water Chemistry Parameters

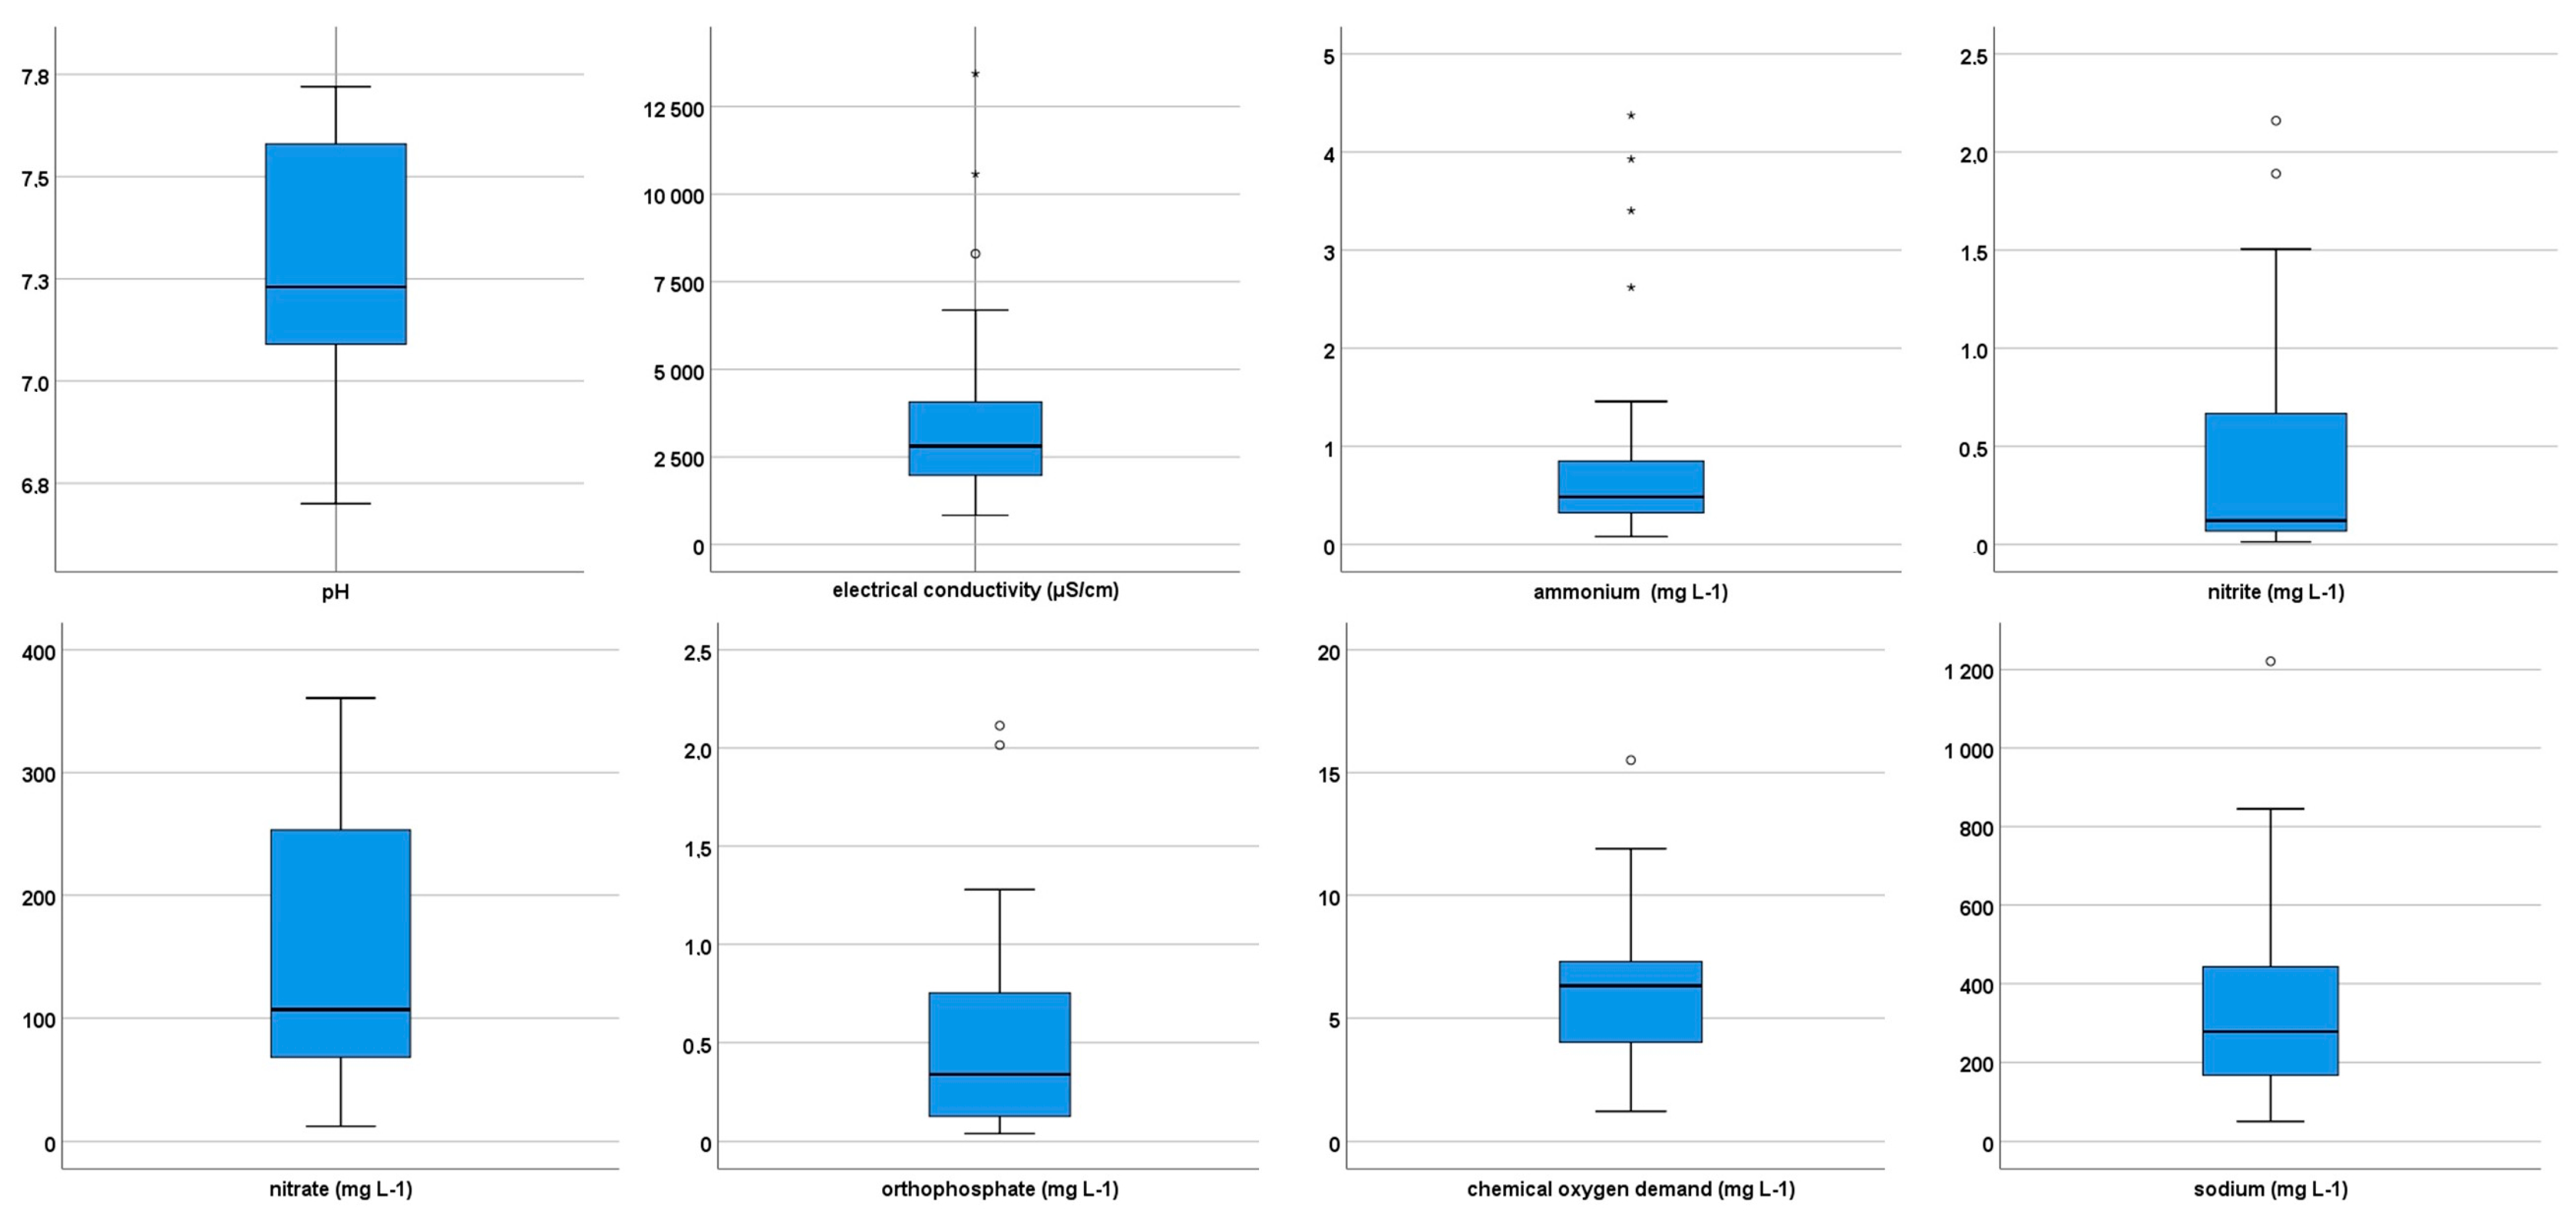
The descriptive statistics and distribution of the pollution limit values for the water chemical parameters necessary for calculating the water quality indices are provided in Table 2 and Figure 5. In 2023, nine years after the construction of the sewerage network, the average values exceeded the relevant limit values for five of the eight parameters examined (EC, NH4+, NO3, COD, Na+). The electrical conductivity (EC) of the water samples shows a very high standard deviation: the minimum value was 866 μS/cm, while the maximum value was 13,440 μS/cm. The increased organic matter content of the water samples (COD_max = 15.51 mg L−1) indicates that a significant amount of organic matter has accumulated in the soil and groundwater as a result of decades of wastewater discharge. Ammonium shows the decomposition of organic matter, thereby indicating fresh contamination. The upper quartile value was 0.86 mg L−1, indicating contamination, and the lower quartile value was 0.32 mg L−1, which is considered below the limit. In the case of nitrate, there are also significant differences between the values of the individual groundwater wells. Both the lower and upper quartile values exceed the contamination limit. While the lower quartile had a value of only 68.22 mg L−1, the upper quartile was more than five times the limit (264.37 mg L−1). In addition to soil factors, the typically high sodium content of the discharged wastewater also contributed to the high Na+ concentrations (Na+max = 451.5 mg L−1).
In order to explore the extent of the monotonic relationship between the examined parameters, correlation calculations were performed using the software SPSS 22. Since the data series of the examined parameters did not show a normal distribution, Spearman’s rank correlation was used. The positive and negative relationships between the examined parameters and the strength of the relationships are shown in Table 3. Among the examined parameters, a significant (p < 0.001) and moderately strong positive relationship was found between Na+ and EC (r = 0.604), NO3 and EC (r = 0.577), and Na+ and NO2 (r = 5.30). There is a significant (p < 0.001) moderately strong negative relationship between pH and NO3 (r = −0.507) and pH and EC (r = −0.445), which can be explained by the pH-lowering effect of acids formed during the decomposition of organic matter.
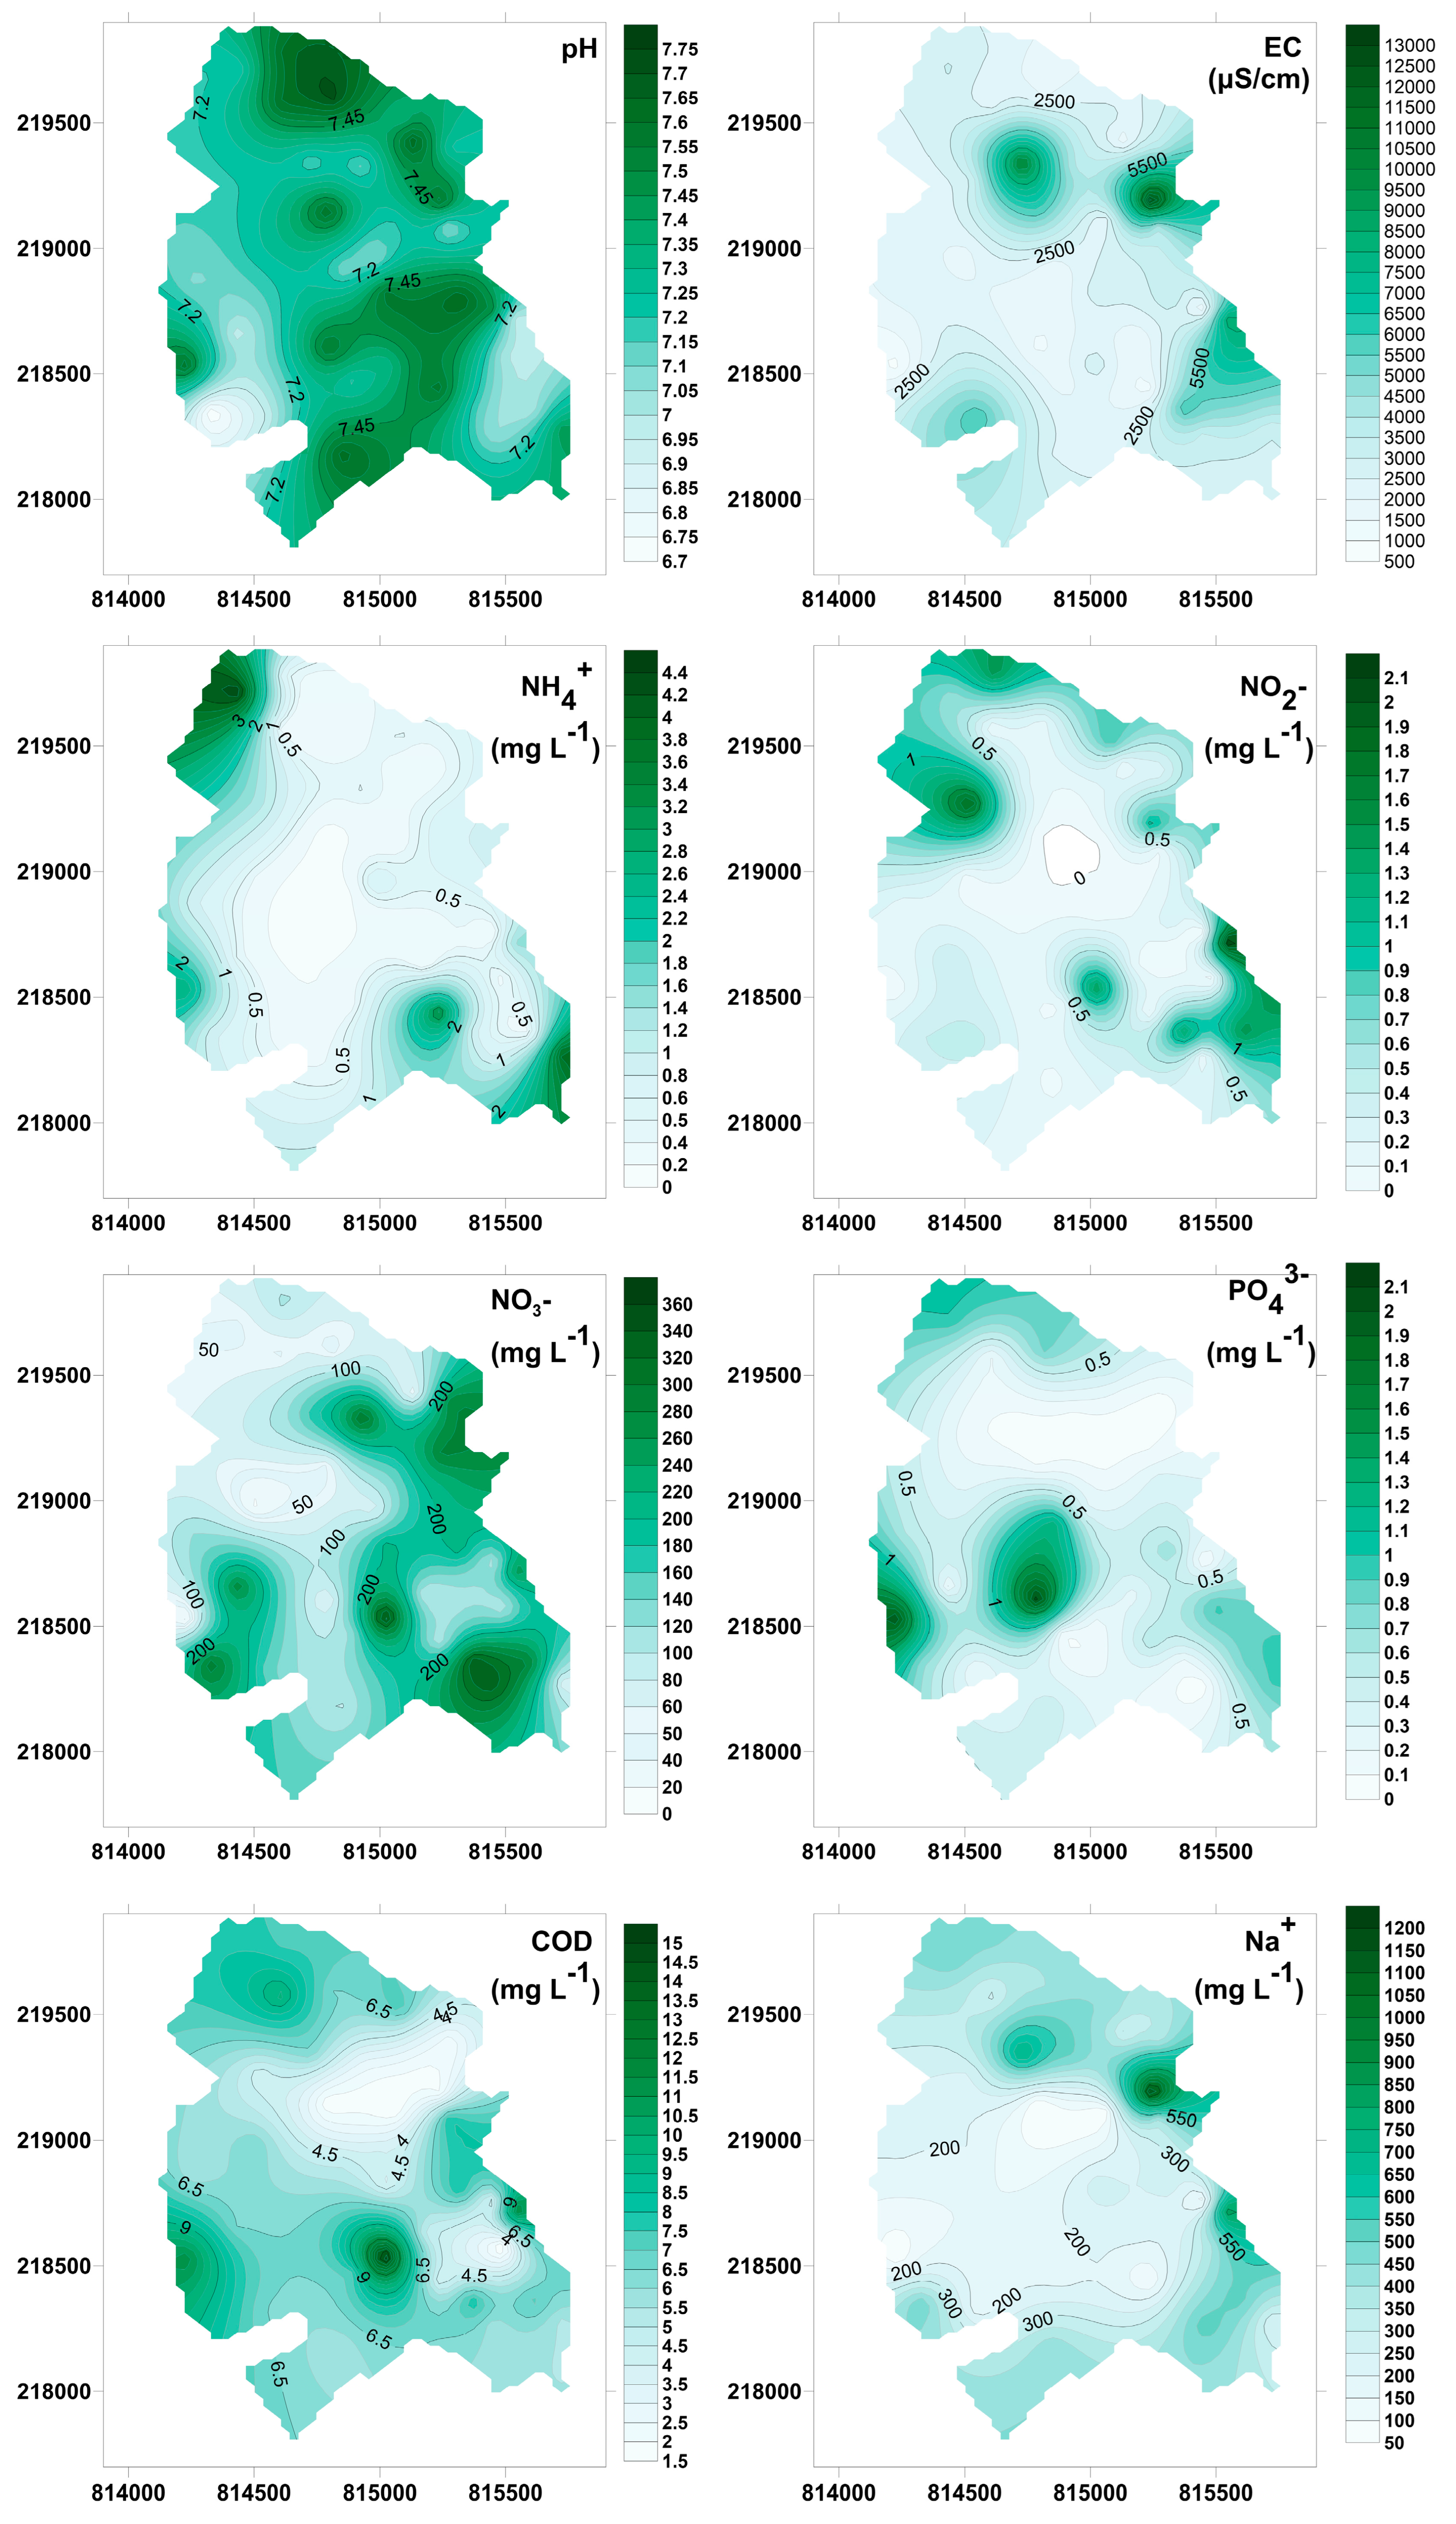
The spatial development of the examined water chemistry parameters in 2023 is shown in Figure 6. The spatial distribution of inorganic nitrogen forms exhibits a high degree of similarity, but the proportions of areas with concentrations exceeding the limit value are different. In the case of nitrite, concentrations below the limit value were measured in a significant part of the settlement; they were elevated only in the north-western and south-eastern parts of the settlement. Relatively low nitrite concentrations (in the majority of the settlement, <0.15 L−1) indicate that the nitrification process can occur. The concentration of ammonium occurs above the limit value in larger areas compared to nitrite (0.5 L−1), and although the northern, central, and southern parts of the settlement are less polluted, human influence can be detected in them as well. Typically, concentrations significantly exceeding the limit were measured in only a few wells in the western and eastern parts of the settlement. In the case of nitrate, the most unfavorable picture emerges; in most parts of the settlement, the concentration exceeds the limit value (>50 L−1), while only the inner areas and a narrow northern strip show lower pollution. In most parts of the settlement, concentrations above 200 L−1 are typical, while in smaller but significant areas, values above 350 L−1 are typical.
Changes in the electrical conductivity show a similar spatial pattern to the changes in inorganic pollutants, so lower values can be detected in the northern and central parts of the settlement, while values above 3500 μS/cm are measured in the western and eastern parts of the settlement.
The organic matter content is favorable, with concentrations below 4.5 L−1 in the majority of the settlement. The concentration of phosphate ions is below the limit value in the northern parts of the settlement, but in a larger band, it is still above 0.5 L−1, which is also a good indication of the earlier wastewater discharge and the effect of other local sources of pollution. The pH values ranged from neutral to slightly alkaline, with a range of 6.7 to 7.75. Higher pH values are typical in the northern and southern parts of the settlement. The sodium content exceeds the limit value in several parts of the settlement, which can be attributed to the high sodium content of the outflowing wastewater under natural soil conditions.

3.2. Spatial Distribution of Groundwater Quality Using Different Indices

In the cases of all three water quality indices used, the same water chemistry parameters were applied to describe the state of the water quality to determine the index values. The water samples were then ranked on a scale of 1 to 5 based on their quality, where 1 is the best and 5 is the worst water rating and degree of contamination. The classification of the groundwater wells and the number of wells belonging to each water rating category are illustrated in Figure 7. According to the Water Quality Index, 40.54% of the groundwater wells were classified into the worst (Unsuitable for any use) category. A further 35.13% of the groundwater wells were found to have poor water quality (Very poor, Poor). The water quality status was acceptable for only 18.92% of the samples (Good) and was Excellent for two wells.
According to the Cd index developed by Backman et al. to assess the degree of contamination, 64.86% of the examined groundwater wells were classified as Very High and High. Furthermore, 29.73% of the groundwater wells are considered moderately contaminated, and only 5.41% of the wells have a low degree of contamination (Low). The CCME WQI, which is an improved version of the traditional WQI, rated 67.57% of the groundwater wells as contaminated (Poor, Marginal), while the proportion of categories indicating already adequate water quality (Good, Fair) was 32.43%.
As a large number of samples were available, interpolated distribution maps of the water quality and pollution were prepared (Figure 8). According to the WQI, the water quality status in the northern and central parts of the settlement is generally characterized by “Good” and “Excellent” quality. These areas are usually smaller but show significantly better quality than the southern and western parts of the settlement, where the water quality falls into the category of “Very Poor” or “Unsuitable for any use”.
The Cd index, which indicates the degree of pollution, reveals that the level of pollution is the highest in the central and southern parts of the settlement. In the northern areas, more moderate pollution can be found, similar to the water quality categories according to the WQI. However, in the central part of the settlement, the degree of pollution is lower in some places, while the water quality indicates better-quality conditions in several places, which highlights that the combined application of different water quality indices can make the assessment more accurate.
The CCME WQI, with a pronounced north–south direction, outlines the appropriate water quality status in the settlement. The northern parts show a similar picture, but the number and extent of high-quality areas are smaller than those observed in the previous two indices. However, all three maps show a similar condition in the northern parts, which may indicate that this area does indeed have better water quality with lower pollution levels. One of the reasons for the regional difference is mainly due to the different weighting of the WQI, as a result of which the indices react more sensitively to changes in certain water chemical parameters (e.g., ammonium and phosphate values) than the Cd. The other factor is that the WQI is less sensitive to changes in nitrate values, which are given more weight in the Cd.

3.3. Performance Assessment of Water Quality Indicators Using Artificial Intelligence

By creating a Feed-Forward Neural Network (FFNN), the groundwater quality was predicted, which estimated the water quality statuses of three water quality indicators based on water chemistry parameters. The models consist of three layers: an input layer, which contains the tested water chemistry parameters (pH, EC, NH4+, NO2, NO3, PO43−, COD, Na+), a hidden layer, and an output layer, where the water quality indicators are predicted.
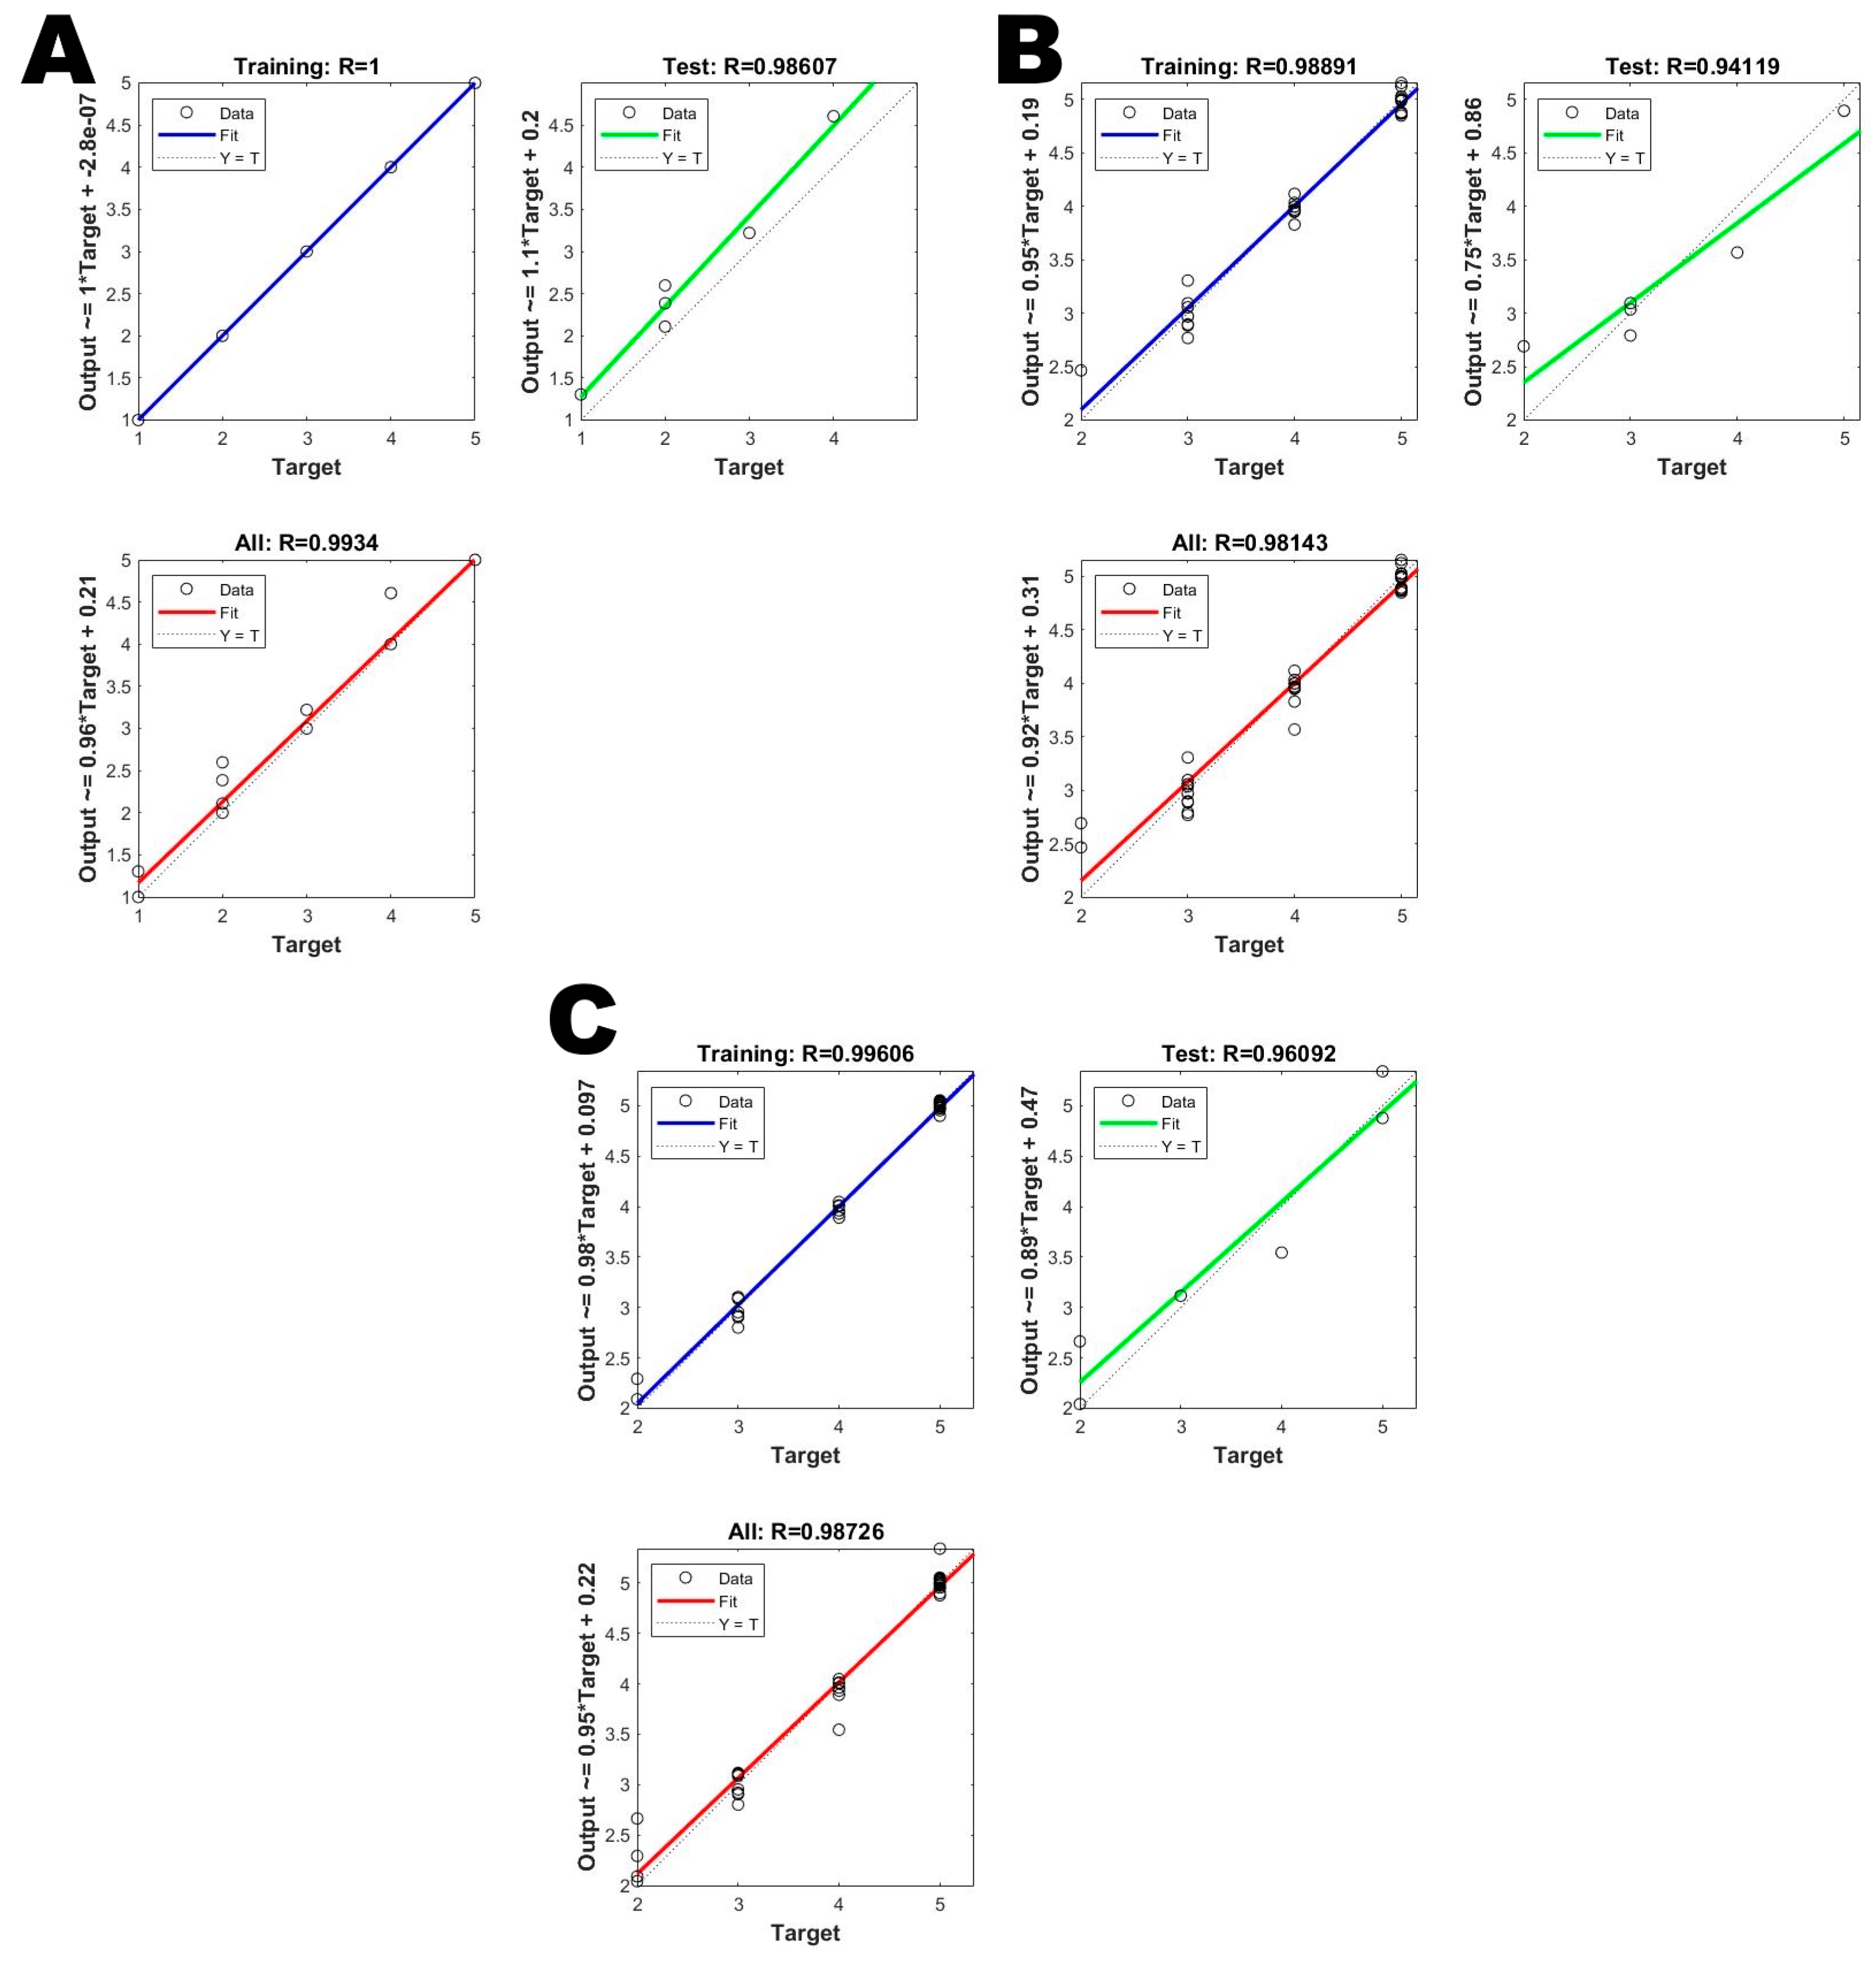
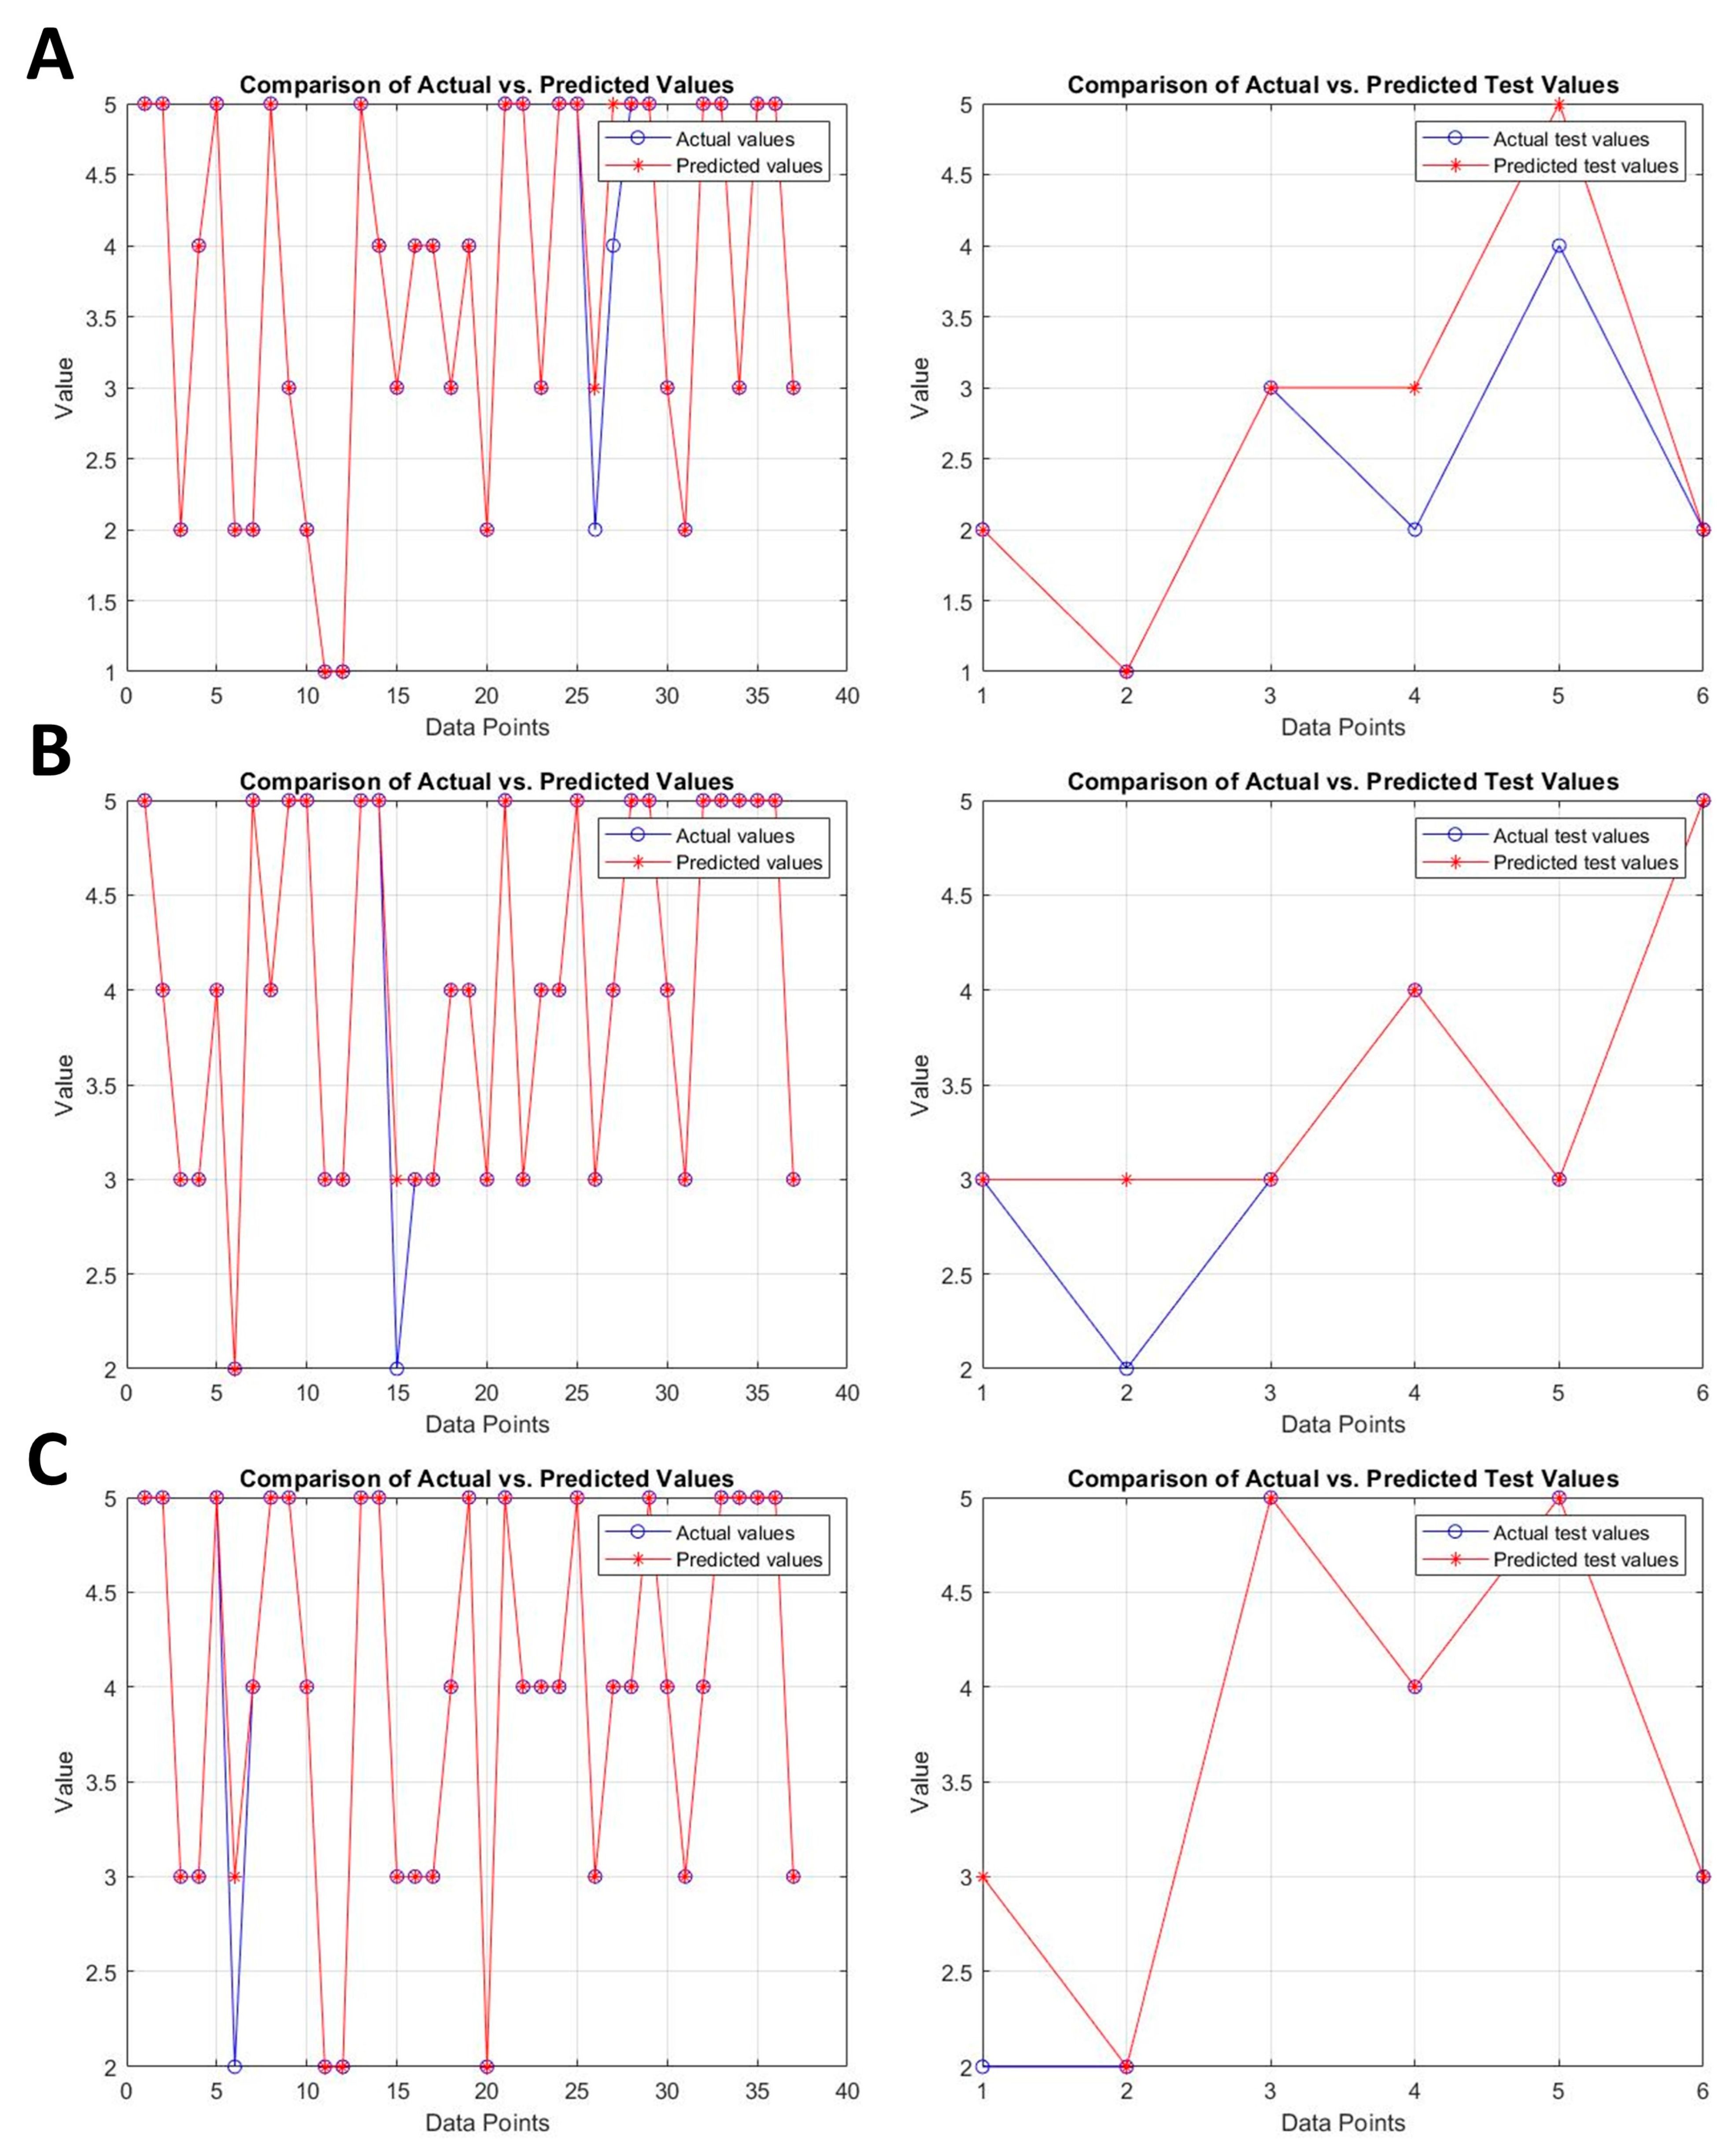
Figure 9 illustrates the linear regression results of the trained models based on the three water quality indicators (WQI, Cd, CCME WQI). The training, validation, and testing datasets for the WQI indicator are strongly correlated with estimated and real data, especially for the training set, where the best regression model is shown. For the Cd and CCME WQI, the data show some variance, indicating that the model is less accurate in these cases. The research also examined how accurately the real and estimated data match in the case of the training and testing datasets. Figure 10 shows that the performances of the models vary across different water quality indicators, indicating the complexity of the relationship between the water chemistry parameters and target variables. In the case of the WQI, the real and estimated values closely follow the ideal line, indicating the excellent fit and high predictive ability of the model, and that the neural network can effectively model this connection. However, significant variations can be observed in the Cd indicator, as the predicted values are scattered around the real values and do not follow the linear trend clearly. This suggests that the model is less efficient at estimating the Cd indicator. For the CCME WQI, the results show an intermediate position, as the fit is better than that for the Cd indicator; however, the standard deviation remains greater than that of the WQI. The reason for the differences is presumably due to the different weighting of the indices, resulting in a more sensitive reaction to changes in certain water chemical parameters (Figure 10).
The number of neurons used in the hidden layer affected the performances of the models (Table 4). The values of the WQI RMSE changed greatly with the increase in the number of neurons, ranging from 0.12 to 0.21. The lowest RMSE value was observed with 21 neurons (RMSE21 neuron = 0.1205), while in the case of a lower number of neurons, this value was slightly higher (RMSE17 neuron = 0.1668, RMSE19 neuron = 0.178). From this, it can be concluded that the number of neurons in this model did not drastically affect the error; however, using 21 neurons yielded the most accurate results. The R2 values range from 0.9726 to 0.9916, and for 21 neurons, the best fit here is also (0.9916), indicating high predictive ability.
The RMSE values of the Cd indicator vary between 0.1621 and 0.2106, and the smallest error was achieved by using 10 neurons (RMSE10 neuron = 0.1621). The R2 values range from 0.9518 to 0.9714, which means that the model has weaker predictive capabilities in this case and may not be the optimal choice for estimating the Cd index.
The CCME WQI RMSE values (0.1305 and 0.1562) are, on average, lower than the values of the previous two indicators, suggesting a lower level of error. The lowest RMSE value was achieved using 10 neurons (0.1305), and the R2 values varied between 0.9768 and 0.9838, so this indicator can be estimated more accurately than the Cd index, and the increase in the number of neurons in this configuration did not result in a significant improvement.
The effect of the different training algorithms (trainlm—Levenberg–Marquardt; trainscg—Scaled Conjugate Gradient; trainbr—Bayesian Regularization) on the model performance was examined [48] (Table 5). The aim of the training algorithms is to adjust the weights of the network so that the network produces the most accurate output values based on the input data. The training algorithms perform the “learning” of the network, i.e., optimization, during which the weights of the network establish the relationship between the input and output data. The best results were given by the trainbr algorithm based on Bayesian Regularization, especially for the WQI and CCME WQI indicators, where the lowest RMSE (RMSEtrainbr_WQI = 0.1205, RMSEtrainbr_CCME WQI = 0.1305) and highest R2 (R2WQI = 0.9916, R2CCME WQI = 0.9838) values were observed. This algorithm is highly effective at avoiding overfitting and stabilizing predictive models [51].
The activation functions used in the network also affected the performances of the models (Table 6). Activation functions determine how much a given neuron is activated in response to input signals. They help the network to exhibit nonlinear behavior, which allows the neural network to recognize and model more complex patterns. In the case of all three water quality indicators, the best performance was achieved by using the “tansig” activation function. The “radbas” activation function generally provided better results than the “tribas” function, which resulted in the weakest performance for all three indicators.
With regard to the neural network created, it should be emphasized that the optimization of the number of neurons and the selection of the appropriate training algorithms and activation functions is essential to maximize the efficiency of predictive models. Regarding our study, it can be stated that the training algorithms and activation functions applied to the different water quality indicators proved to be the best in the case of different network structures.

3.4. Interactive Data Visualization of Spatial Water Quality Data

Interactive visualizations enable us to examine raw data from various perspectives and discover deeper connections. As part of this, the geodatabase created based on the 2023 measurement and calculation results was used to illustrate the water chemistry parameters and water quality data.
Based on the connected data source, five dashboards and eighteen views were created, and interactive elements were set up, which are as follows:
  • The sample area dashboard provides a point map showing the location of the sample area in the interface of a Google basemap. By pointing to the monitoring wells, the pop-up bubble help (tooltip) displays the ID and coordinates of the monitoring wells. The view was also connected to distribution maps that depicted the groundwater level and relief conditions of the sample area.
  • The data source dashboard displays the attribute data of the connected geodatabase in tabular format.
  • The parameters and limits in metered groundwater wells dashboard plots water chemistry parameters on bar charts with a reference line per groundwater well that indicates the contamination limit for each water chemistry parameter.
  • Dashboards showing the status of the water quality and degree of pollution can display five different views simultaneously:
    a.
    A point map showing the water quality status of groundwater wells;
    b.
    A summary table of the number of water quality/pollution categories;
    c.
    A donut chart of the % distribution of the categories;
    d.
    A tree map of the proportions of the categories;
    e.
    A bar chart showing the index values for each well.
  • The spatial distribution dashboard presents distribution maps of water chemistry parameters and water quality indices edited by Kriging interpolation.
In all cases, the stylization was performed using the map color code corresponding to the given water quality status/degree of pollution. To explore spatial patterns, selection-based interactive filters and highlights were defined. Performing these actions results in automatic updates of views, which can be reverted to the original views by double-clicking. Since data visualization is not only about the graphical representation of data, the aim was to provide users with the opportunity to present the data in narrative form and freely access it; therefore, a story was created using interactive dashboards, which was shared on Tableau’s cloud-based platform [50] (Figure 11).

4. Discussion

Our research revealed that, nine years after the construction of the sewerage network, significant anthropogenic effects persist in the quality of the groundwater. Similar trends have been observed in other rural areas, where the water quality has only gradually improved due to the persistence of pollutants [52,53]. Furthermore, the high concentrations of nitrates and ammonium in groundwater can be explained primarily by the communal and agricultural loads of the previous decades [54,55], which is particularly worrying since the accumulation of nitrate in drinking water carries significant health risks [56,57]. Previous studies by Balla et al. and Mester et al. found that the groundwater quality improved in the sample area in the years following the construction of the sewer network [37,58]. Still, the 2023 measurement results showed a deterioration in the water quality compared to previous years in the average values of two water quality indicators. This may be primarily due to the decline in the groundwater levels caused by the lack of precipitation in recent years. As the sewerage system in the settlement is not yet complete, leaks from individual drainage systems and storage tanks may continue to pollute the groundwater; so, taking these effects into account, long-term monitoring of groundwater purification processes is still necessary. The differences in the water quality indices used in this study are well reflected in the varying sensitivities of the individual indicators. Gazzaz et al. (2012) and Pesce and Wunderlin (2000) found that due to the different weighting systems of different indices, the assessment of the water quality in the same sample can vary significantly [59,60]. WQI models based on fuzzy logic can provide an alternative to increase consistency between indices, particularly in systems where complex pollution patterns can be observed [61,62]. The high predictive performance achieved in FFNN-based modeling is consistent with previous research that has demonstrated the effectiveness of machine learning models in water quality estimation [63,64]. The use of Bayesian Regularization is particularly beneficial because it can reduce biases resulting from overfitting [65]. Optimization of the activation functions and neuron count also plays a crucial role in enhancing the model performance, as highlighted in several studies [66,67]. However, the small sample size and the fact that the mean EC, NH4+, and NO3 concentrations exceed regulatory thresholds can bias neural-network training by overweighting these dominant variables and reducing the contribution of the remaining hydrochemical predictors. Consequently, the current performance metrics (e.g., MAE, RMSE, R2) are unlikely to be reliable indicators of true model skill. Because sample scarcity is a major limitation, further validation with data from subsequent years is essential. Future work should improve the spatial prediction accuracy by expanding the dataset, incorporating temporal series, applying guided selection or spatially blocked cross-validation for training–test splits, and using spatial optimization techniques. The geostatistical-based (kriging) mapping of water chemistry parameters and calculated water quality indices has made it possible to explore water quality patterns in detail, which is essential for the planning of targeted water management measures. Similar mapping strategies were proposed by Khan et al. (2023) and Ali and Ahmad (2020) for the detection of pollution hotspots [68,69]. The processing of spatial water quality monitoring data using data visualization tools contributes to the clarity of the results and provides a valuable tool for decision-makers. This may be especially important in the age of digitalization of environmental management [70].
Overall, this study confirms the justification for the joint application of artificial intelligence, GIS, and interactive data visualization in environmental monitoring, especially in the case of complex systems where the temporal and spatial heterogeneity of pollution processes is significant. Future research should also integrate hydrogeological modeling and multi-criteria decision support systems to obtain a more comprehensive picture of the state of groundwater and the possibilities for its sustainable use [71].

5. Conclusions

In our study, the changes in the groundwater quality were examined 9 years after the construction of the sewerage network, involving 37 dug groundwater wells in a Hungarian settlement. Our results indicate that the construction of the sewerage network alone is not sufficient for the short-term regeneration of groundwater, particularly in areas where anthropogenic loads persist for decades. The slow improvement in the groundwater quality and the persistently high values of the ammonium, nitrate, and organic matter concentrations indicate that the mobilization of deposited pollutants and the natural self-purification processes are time-consuming and spatially differentiated. Even though all three water quality indices show adequate or good water quality in an increasing area in the settlement, their comparative analysis highlighted the differences in their sensitivities, the consideration of which is essential for the basis of water management decisions. Predictive models based on artificial intelligence, especially neural networks with Bayesian training algorithms and optimized activation functions, have been proven to be an effective tool in predicting the state of water quality. The most accurate prediction of the WQI and CCME WQI indicators was provided by the Bayesian control algorithm (trainbr), which achieved the lowest mean-squared error (RMSEWQI = 0.1205, RMSECCME WQI = 0.1305) and the highest determination coefficient (R2WQI = 0.9916, R2CCME WQI = 0.9838). For the Cd index, the accuracy of the model was lower (RMSE = 0.1621, R2 = 0.9714), suggesting that this indicator is more difficult to predict. In addition, geostatistical and interactive data visualization methods significantly facilitate the exploration of spatial patterns and the identification and cognitive interpretation of pollution hotspots.
The limitations of the research determine the transformation of water quality monitoring systems into predictive-based decision support systems. Furthermore, the development of deep learning models and hybrid predictive architectures may also be justified in order to enhance the spatial–temporal prediction capabilities of artificial intelligence.

Author Contributions

Conceptualization, D.B., L.T., A.H., E.K., M.Z. and T.M.; methodology, D.B., L.T., A.H., M.Z. and T.M.; software, D.B., L.T., E.K., M.Z. and T.M.; validation, D.B., E.K., T.M. and A.H.; formal analysis, D.B.; investigation, D.B., L.T., E.K., M.Z. and T.M.; data curation, D.B. and T.M.; writing—original draft preparation, D.B., L.T., A.H., E.K., M.Z. and T.M.; writing—review and editing, D.B.; visualization, D.B., M.Z. and L.T.; supervision, D.B. and T.M. All authors have read and agreed to the published version of the manuscript.

Funding

This study was supported by the University of Debrecen Scientific Research Bridging Fund (DETKA).

Data Availability Statement

The data presented in this study are available upon request from the corresponding author.

Conflicts of Interest

The authors declare no conflicts of interest.

Abbreviations

The following abbreviations are used in this manuscript:
AIArtificial Intelligence
ANNArtificial Neural Network
BCWQIBritish Columbia Water Quality Index
CCME WQICanadian Council of Ministers of the Environment Water Quality Index
CdContamination Degree
CODChemical Oxygen Demand
CORINE CLCCoordination of Information on the Environment Land Cover
ECElectrical Conductivity
EQEquity Index
FFNNFeed-Forward Neural Network
GISGeographic Information System
Na+Sodium
NH4+Ammonium
NO2Nitrite
NO3Nitrate
NSFWQUS National Sanitation Foundation Water Quality Index
OIPOverall Index of Pollution
OWQIOregon Water Quality Index
PO43−Orthophosphate
R2Determination Coefficient
RFRandom Forest
RMSERoot-Mean-Square Error
SVMSupport Vector Machine
WQIWater Quality Index
WRBWorld Reference Base For Soil Resources

Appendix A

Eight parameters (pH, EC, NH4+, NO2, NO3, PO43−, COD, Na+) were used to calculate the Water Quality Index (WQI), Canadian Council of Ministers of the Environment Water Quality Index (CCME WQI), and Contamination degree (Cd).

Appendix A.1. Water Quality Index (WQI)

Calculation of the WQI was carried out following the “weighted arithmetic index method” using the following equation [12]:
WQI = Q n W n / W n
where Qn is the quality rating of the nth water quality parameter, and Wn is the unit weight of the nth water quality parameter. The quality rating (Qn) is calculated using the following equation:
Q n = 100 V n V i / V s V i
where Vn is the actual amount of the nth parameter present, Vi is the ideal value of the parameter [Vi = 0, except for pH (Vi = 7)], and Vs is the standard permissible value for the nth water quality parameter. The unit weight (Wn) is calculated using the following formula:
W n = k / V s
where k is the constant of proportionality and is calculated using the following equation:
k = 1 / 1 / V s = 1 ,   2 , , n

Appendix A.2. CCME Water Quality Index (CCME WQI)

This is a rating system developed by the Canadian Council of Ministers of the Environment in 2001 [19]. The ranking system is based on a combination of three factors:
F1: The number of parameters tested that exceed the contamination limit (Scope).
F 1 = number   of   failed   parameters total   number   of   parameters × 100
F2: The percentage of failed tests (Frequency).
F 2 = Number   of   failed   tests total   number   of   tests × 100
F3: The amount by which the failed test values do not meet their objectives (Amplitude). Factor 3 can be calculated in three steps:
excursion i = failed   test   value i Objective j 1
nse = i = 1 n excursion i 0.01 nse + 0.01  
F 3 = nse 0.1 nse + 0.01  
After calculating all three factors, the WQI can be determined by the following equation:
CCME   WQI = 100 F 1 2   + F 2 2 + F 3 2 1.732  
The factor value of 1.732 is introduced to a scale index ranging from 0 to 100, where 0 is the “worst” and 100 is the “best” WQI value.

Appendix A.3. Contamination Degree (Cd)

The calculation of the contamination degree (Cd) is made separately for each sample of water analyzed as a sum of the contamination factors of individual components exceeding the upper permissible value. Hence, the contamination index summarizes the combined effects of several quality parameters considered harmful to household water.
The scheme for the calculation of the Cd is the following [44]:
C d = i = 1 n   C fi
where
C fi = C Ai C Ni 1
Cfi is the contamination factor for the i-th component;
CAi is the analytical value of the i-th component;
CNi is the upper permissible concentration of the i-th component (N denotes the “normative” value).
The elements and ionic species with analytical values below the upper permissible concentration values are not taken into consideration.

References

  1. Kerényi, A.; McIntosh, R.W. Sustainable Development in Changing Complex Earth Systems; Sustainable Development Goals Series; Springer International Publishing: Cham, Swizerland, 2020; ISBN 978-3-030-21644-3. [Google Scholar]
  2. Keraita, B.; Drechsel, P.; Amoah, P. Influence of Urban Wastewater on Stream Water Quality and Agriculture in and around Kumasi, Ghana. Environ. Urban. 2003, 15, 171–178. [Google Scholar] [CrossRef]
  3. Rutkowski, T.; Raschid-Sally, L.; Buechler, S. Wastewater Irrigation in the Developing World—Two Case Studies from the Kathmandu Valley in Nepal. Agric. Water Manag. 2007, 88, 83–91. [Google Scholar] [CrossRef]
  4. Aulakh, M.S.; Khurana, M.P.S.; Singh, D. Water Pollution Related to Agricultural, Industrial, and Urban Activities, and Its Effects on the Food Chain: Case Studies from Punjab. J. New Seeds 2009, 10, 112–137. [Google Scholar] [CrossRef]
  5. Tytła, M. Assessment of Heavy Metal Pollution and Potential Ecological Risk in Sewage Sludge from Municipal Wastewater Treatment Plant Located in the Most Industrialized Region in Poland—Case Study. Int. J. Environ. Res. Public Health 2019, 16, 2430. [Google Scholar] [CrossRef]
  6. Livia, S.; María, M.-S.; Marco, B.; Marco, R. Assessment of Wastewater Reuse Potential for Irrigation in Rural Semi-Arid Areas: The Case Study of Punitaqui, Chile. Clean. Techn Env. Policy 2020, 22, 1325–1338. [Google Scholar] [CrossRef]
  7. Bano, H.; Rather, R.A.; Malik, S.; Bhat, M.A.; Khan, A.H.; Américo-Pinheiro, J.H.P.; Mir, I.A. Effect of Seasonal Variation on Pollution Load of Water of Hokersar Wetland: A Case Study of Queen Wetland of Kashmir, J&K, India. Water Air Soil. Pollut. 2022, 233, 518. [Google Scholar] [CrossRef]
  8. Zolfaghary, P.; Zakerinia, M.; Kazemi, H. A Model for the Use of Urban Treated Wastewater in Agriculture Using Multiple Criteria Decision Making (MCDM) and Geographic Information System (GIS). Agric. Water Manag. 2021, 243, 106490. [Google Scholar] [CrossRef]
  9. Bugajski, P.M.; Kurek, K.; Mlyński, D.; Operacz, A. Designed and Real Hydraulic Load of Household Wastewater Treatment Plants. J. Water Land. Dev. 2019, 40, 155–160. [Google Scholar] [CrossRef]
  10. Mester, T.; Szabó, G.; Bessenyei, É.; Karancsi, G.; Barkóczi, N.; Balla, D. The Effects of Uninsulated Sewage Tanks on Groundwater. A Case Study in an Eastern Hungarian Settlement. J. Water Land. Dev. 2017, 33, 123–129. [Google Scholar] [CrossRef]
  11. Horton, R.K. An Index Number System for Rating Water Quality. J. Wat Pollut. Contr Fed. 1965, 37, 292–315. [Google Scholar]
  12. Brown, R.M.; McClelland, N.I.; Deininger, R.A.; Tozer, R.G. A Water Quality Index-Do We Dare? Water Sew. Work. 1970, 117, 1–5. [Google Scholar]
  13. Dunnette, D.A. A Geographically Variable Water Quality Index Used in Oregon. J. Water Pollut. Control Fed. 1979, 51, 53–61. [Google Scholar]
  14. Dinius, S.H. Design of an Index of Water Quality1. JAWRA J. Am. Water Resour. Assoc. 1987, 23, 833–843. [Google Scholar] [CrossRef]
  15. Smith, D.G. A Better Water Quality Indexing System for Rivers and Streams. Water Res. 1990, 24, 1237–1244. [Google Scholar] [CrossRef]
  16. Cude, C.G. Oregon Water Quality Index a Tool for Evaluating Water Quality Management Effectiveness 1. JAWRA J. Am. Water Resour. Assoc. 2001, 37, 125–137. [Google Scholar] [CrossRef]
  17. Sargaonkar, A.; Deshpande, V. Development of an Overall Index of Pollution for Surface Water Based on a General Classification Scheme in Indian Context. Env. Monit. Assess. 2003, 89, 43–67. [Google Scholar] [CrossRef]
  18. Liou, S.-M.; Lo, S.-L.; Wang, S.-H. A Generalized Water Quality Index for Taiwan. Env. Monit. Assess. 2004, 96, 35–52. [Google Scholar] [CrossRef]
  19. Lumb, A.; Halliwell, D.; Sharma, T. Application of CCME Water Quality Index to Monitor Water Quality: A Case Study of the Mackenzie River Basin, Canada. Env. Monit. Assess. 2006, 113, 411–429. [Google Scholar] [CrossRef]
  20. Luh, J.; Baum, R.; Bartram, J. Equity in Water and Sanitation: Developing an Index to Measure Progressive Realization of the Human Right. Int. J. Hyg. Environ. Health 2013, 216, 662–671. [Google Scholar] [CrossRef]
  21. Uddin, M.G.; Nash, S.; Olbert, A.I. A Review of Water Quality Index Models and Their Use for Assessing Surface Water Quality. Ecol. Indic. 2021, 122, 107218. [Google Scholar] [CrossRef]
  22. Simsek, C.; Gunduz, O. IWQ Index: A GIS-Integrated Technique to Assess Irrigation Water Quality. Env. Monit. Assess. 2007, 128, 277–300. [Google Scholar] [CrossRef] [PubMed]
  23. Şener, Ş.; Şener, E.; Davraz, A. Evaluation of Water Quality Using Water Quality Index (WQI) Method and GIS in Aksu River (SW-Turkey). Sci. Total Environ. 2017, 584–585, 131–144. [Google Scholar] [CrossRef] [PubMed]
  24. Jha, M.K.; Shekhar, A.; Jenifer, M.A. Assessing Groundwater Quality for Drinking Water Supply Using Hybrid Fuzzy-GIS-Based Water Quality Index. Water Res. 2020, 179, 115867. [Google Scholar] [CrossRef] [PubMed]
  25. Dandge, K.P.; Patil, S.S. Spatial Distribution of Ground Water Quality Index Using Remote Sensing and GIS Techniques. Appl. Water Sci. 2021, 12, 7. [Google Scholar] [CrossRef]
  26. Saravani, M.J.; Saadatpour, M.; Shahvaran, A.R. A Web GIS Based Integrated Water Resources Assessment Tool for Javeh Reservoir. Expert. Syst. Appl. 2024, 252, 124198. [Google Scholar] [CrossRef]
  27. Habeeb, R.; Gupta, Y.; Chinwan, H.; Barker, E. Assessing Demographic and Water Sensitivities Arising Due to Urban Water Insecurity in Haldwani, Uttarakhand (India): A GIS-Based Spatial Analysis. J. Geovis Spat. Anal. 2019, 3, 8. [Google Scholar] [CrossRef]
  28. Taşan, S. Estimation of Groundwater Quality Using an Integration of Water Quality Index, Artificial Intelligence Methods and GIS: Case Study, Central Mediterranean Region of Turkey. Appl. Water Sci. 2022, 13, 15. [Google Scholar] [CrossRef]
  29. Mustafa, H.M.; Mustapha, A.; Hayder, G.; Salisu, A. Applications of IoT and Artificial Intelligence in Water Quality Monitoring and Prediction: A Review. In Proceedings of the 2021 6th International Conference on Inventive Computation Technologies (ICICT), Coimbatore, India, 20–22 January 2021; pp. 968–975. [Google Scholar]
  30. Prohászka, V.; Tormáné Kovács, E.; Grósz, J.; Waltner, I. Az Ásott Kutak Vízminősége Két Ökofaluban: Visnyeszéplakon És Gyűrűfűn. Tájökológiai Lapok 2022, 20, 41–58. [Google Scholar] [CrossRef]
  31. Vadas, A.; Ferenczi, L. Small Urban Waters and Environmental Pressure before Industrialization: The Case of Hungary. J. Hist. Geogr. 2023, 82, 98–109. [Google Scholar] [CrossRef]
  32. Kirschner, A.K.T.; Schachner-Groehs, I.; Kavka, G.; Hoedl, E.; Kovacs, A.; Farnleitner, A.H. Long-Term Impact of Basin-Wide Wastewater Management on Faecal Pollution Levels along the Entire Danube River. Env. Sci. Pollut. Res. 2024, 31, 45697–45710. [Google Scholar] [CrossRef]
  33. HCSO Hungarian Central Statistical Office. Available online: https://www.ksh.hu/?lang=en (accessed on 29 August 2024).
  34. Michéli, E.; Fuchs, M.; Hegymegi, P.; Stefanovits, P. Classification of the Major Soils of Hungary and Their Correlation with the World Reference Base for Soil Resources (WRB). Agrokémia és Talajt. 2006, 55, 19–28. [Google Scholar] [CrossRef]
  35. Balla, D.; Kiss, E.; Zichar, M.; Mester, T. Evaluation of Groundwater Quality in the Rural Environment Using Geostatistical Analysis and WebGIS Methods in a Hungarian Settlement, Báránd. Environ. Sci. Pollut. Res. 2023, 31, 57177–57195. [Google Scholar] [CrossRef] [PubMed]
  36. Mester, T.; Balla, D.; Karancsi, G.; Bessenyei, É.; Szabó, G. Eects of Nitrogen Loading from Domestic Wastewater on Groundwater Quality. Water SA 2019, 45, 349–358. [Google Scholar] [CrossRef]
  37. Mester, T.; Szabó, G.; Balla, D. Assessment of Shallow Groundwater Purification Processes after the Construction of a Municipal Sewerage Network. Water 2021, 13, 1946. [Google Scholar] [CrossRef]
  38. Balla, D.; Zichar, M.; Kiss, E.; Szabó, G.; Mester, T. Possibilities for Assessment and Geovisualization of Spatial and Temporal Water Quality Data Using a WebGIS Application. ISPRS Int. J. Geo-Inf. 2022, 11, 108. [Google Scholar] [CrossRef]
  39. Mester, T.; Balla, D.; Szabó, G. Assessment of Groundwater Quality Changes in the Rural Environment of the Hungarian Great Plain Based on Selected Water Quality Indicators. Water Air Soil. Pollut. 2020, 231, 536. [Google Scholar] [CrossRef]
  40. MSZ 21464; Hungarian Standards Board: 1998. Sampling from Groundwater, 1998. Available online: https://ugyintezes.mszt.hu/webaruhaz/szabvany-adatok?standard=95049 (accessed on 13 July 2025).
  41. HS 448-18; Hungarian Standard Water Quality. Part 18: Drinking Water Analysis. Determination of Orthophosphate and Total Phosphorus Using Spectrophotometric Method. Hungarian Standards Institution (MSZT): Budapest, Hungary, 2009.
  42. HS 1484-13; Hungarian Standard Water Quality. Part 12: Determination of Nitrate and Nitrite. Content by Spectrophotometric Method. Hungarian Standards Institution (MSZT): Budapest, Hungary, 2009.
  43. HS ISO 7150-1; Hungarian Standard Water Quality. Determination of Ammonium. Part 1: Manual Spectrophotometric Method. Hungarian Standards Institution (MSZT): Budapest, Hungary, 1992.
  44. Backman, B.; Bodiš, D.; Lahermo, P.; Rapant, S.; Tarvainen, T. Application of a Groundwater Contamination Index in Finland and Slovakia. Environ. Geol. 1998, 36, 55–64. [Google Scholar] [CrossRef]
  45. Csábrági, A.; Molnár, S.; Tanos, P.; Kovács, J.; Szabó, I.; Molnár, M. Neurális Hálózatok Alkalmazása Hazai Vízminőségi Vizsgálatok Során. Mezőgazdasági Tech. 2019, 60, 2–5. [Google Scholar]
  46. Alrowais, R.; Abdel Daiem, M.M.; Li, R.; Maklad, M.A.; Helmi, A.M.; Nasef, B.M.; Said, N. Groundwater Quality Assessment for Drinking and Irrigation Purposes at Al-Jouf Area in KSA Using Artificial Neural Network, GIS, and Multivariate Statistical Techniques. Water 2023, 15, 2982. [Google Scholar] [CrossRef]
  47. The MathWorks Inc. MathWorks—Maker of MATLAB and Simulink; The MathWorks Inc.: Natick, MA, USA, 2024. [Google Scholar]
  48. Hagan, M.T.; Menhaj, M.B. Training Feedforward Networks with the Marquardt Algorithm. IEEE Trans. Neural Netw. 1994, 5, 989–993. [Google Scholar] [CrossRef]
  49. Golden Software LLC. Surfer® [Computer software]. Golden Software LLC: Golden, CO, USA. Available online: https://www.goldensoftware.com/products/surfer (accessed on 7 August 2025).
  50. Tableau, P. Báránd Water_Quality. 2023. Available online: https://public.tableau.com/app/profile/d.niel.balla/viz/BrndWater_Quality2023/BrndWaterQuality (accessed on 4 July 2025).
  51. Zhang, Z. Artificial Neural Network. In Multivariate Time Series Analysis in Climate and Environmental Research; Zhang, Z., Ed.; Springer International Publishing: Cham, Swizerland, 2018; pp. 1–35. ISBN 978-3-319-67340-0. [Google Scholar]
  52. Trowsdale, S.A.; Lerner, D.N. A Modelling Approach to Determine the Origin of Urban Ground Water. J. Contam. Hydrol. 2007, 91, 171–183. [Google Scholar] [CrossRef]
  53. Stuart, M.; Lapworth, D.; Crane, E.; Hart, A. Review of Risk from Potential Emerging Contaminants in UK Groundwater. Sci. Total Environ. 2012, 416, 1–21. [Google Scholar] [CrossRef]
  54. Scanlon, B.R.; Jolly, I.; Sophocleous, M.; Zhang, L. Global Impacts of Conversions from Natural to Agricultural Ecosystems on Water Resources: Quantity versus Quality. Water Resour. Res. 2007, 43, W03437. [Google Scholar] [CrossRef]
  55. Debrewer, L.M.; Ator, S.W.; Denver, J.M. Temporal Trends in Nitrate and Selected Pesticides in Mid-Atlantic Ground Water. J. Environ. Qual. 2008, 37, S296–S308. [Google Scholar] [CrossRef]
  56. Ward, M.H.; deKok, T.M.; Levallois, P.; Brender, J.; Gulis, G.; Nolan, B.T.; VanDerslice, J. Workgroup Report: Drinking-Water Nitrate and Health—Recent Findings and Research Needs. Environ. Health Perspect. 2005, 113, 1607–1614. [Google Scholar] [CrossRef] [PubMed]
  57. WHO 2017, 2017 Guidelines for Drinking-Water Quality, 4th Edition, Incorporating the 1st Addendum. Available online: https://www.who.int/publications/i/item/9789241549950 (accessed on 4 July 2025).
  58. Balla, D.; Kiss, E.; Zichar, M.; Mester, T. Ásott talajvízkutak vízminőségének tér- és időbeli változásainak értékelése egy alföldi településen a CCME WQI vízminőségi mutató alkalmazásával. TÁJÖKOLÓGIAI LAPOK|J. Landsc. Ecol. 2024, 22, 3–24. [Google Scholar] [CrossRef]
  59. Pesce, S.F.; Wunderlin, D.A. Use of Water Quality Indices to Verify the Impact of Córdoba City (Argentina) on Suquía River. Water Res. 2000, 34, 2915–2926. [Google Scholar] [CrossRef]
  60. Gazzaz, N.M.; Yusoff, M.K.; Aris, A.Z.; Juahir, H.; Ramli, M.F. Artificial Neural Network Modeling of the Water Quality Index for Kinta River (Malaysia) Using Water Quality Variables as Predictors. Mar. Pollut. Bull. 2012, 64, 2409–2420. [Google Scholar] [CrossRef] [PubMed]
  61. Zandbergen, P.A.; Hall, K.J. Analysis of the British Columbia Water Quality Index for Watershed Managers: A Case Study of Two Small Watersheds. Water Qual. Res. J. 1998, 33, 519–550. [Google Scholar] [CrossRef]
  62. Tyagi, S.; Sharma, B.; Singh, P.; Dobhal, R. Water Quality Assessment in Terms of Water Quality Index. Am. J. Water Resour. 2013, 1, 34–38. [Google Scholar] [CrossRef]
  63. Ghasemlounia, R.; Gharehbaghi, A.; Ahmadi, F.; Saadatnejadgharahassanlou, H. Developing a Novel Framework for Forecasting Groundwater Level Fluctuations Using Bi-Directional Long Short-Term Memory (BiLSTM) Deep Neural Network. Comput. Electron. Agric. 2021, 191, 106568. [Google Scholar] [CrossRef]
  64. Alnuwaiser, M.A.; Javed, M.F.; Khan, M.I.; Ahmed, M.W.; Galal, A.M. Support Vector Regression and ANN Approach for Predicting the Ground Water Quality. J. Indian. Chem. Soc. 2022, 99, 100538. [Google Scholar] [CrossRef]
  65. Bishop, C.M.; Nasrabadi, N.M. Pattern Recognition and Machine Learning; Springer: Berlin/Heidelberg, Germany, 2006; Volume 4. [Google Scholar]
  66. Wang, L.-P.; Ochoa-Rodríguez, S.; Van Assel, J.; Pina, R.D.; Pessemier, M.; Kroll, S.; Willems, P.; Onof, C. Enhancement of Radar Rainfall Estimates for Urban Hydrology through Optical Flow Temporal Interpolation and Bayesian Gauge-Based Adjustment. J. Hydrol. 2015, 531, 408–426. [Google Scholar] [CrossRef]
  67. Ibrahim, A.; Ismail, A.; Juahir, H.; Iliyasu, A.B.; Wailare, B.T.; Mukhtar, M.; Aminu, H. Water Quality Modelling Using Principal Component Analysis and Artificial Neural Network. Mar. Pollut. Bull. 2023, 187, 114493. [Google Scholar] [CrossRef]
  68. Khan, M.; Almazah, M.M.A.; Eilahi, A.; Niaz, R.; Al-Rezami, A.Y.; Zaman, B. Spatial Interpolation of Water Quality Index Based on Ordinary Kriging and Universal Kriging. Geomat. Nat. Hazards Risk 2023, 14, 2190853. [Google Scholar] [CrossRef]
  69. Ali, S.A.; Ahmad, A. Analysing Water-Borne Diseases Susceptibility in Kolkata Municipal Corporation Using WQI and GIS Based Kriging Interpolation. GeoJournal 2020, 85, 1151–1174. [Google Scholar] [CrossRef]
  70. Xu, H.; Gao, Q.; Yuan, B. Analysis and Identification of Pollution Sources of Comprehensive River Water Quality: Evidence from Two River Basins in China. Ecol. Indic. 2022, 135, 108561. [Google Scholar] [CrossRef]
  71. Loucks, D.P.; Van Beek, E. Water Resource Systems Planning and Management; Springer International Publishing: Cham, Swizerland, 2017; ISBN 978-3-319-44232-7. [Google Scholar]
Figure 1. Location of study area with monitoring wells.
Water 17 02371 g001
Figure 2. Water quality index values between 2011 and 2022.
Water 17 02371 g002
Figure 3. Structure of the feed-forward neural network.
Water 17 02371 g003
Figure 4. Flowchart for mapping and predicting the suitability of groundwater for drinking water supply using GIS, FFNN, and data visualization.
Water 17 02371 g004
Figure 5. Distribution of studied water chemistry parameters in 2023.
Water 17 02371 g005
Figure 6. Spatial distribution of the studied water chemistry parameters.
Water 17 02371 g006
Figure 7. Radar charts of water quality indices.
Water 17 02371 g007
Figure 8. Spatial distribution of water quality status according to the indices in 2023.
Water 17 02371 g008
Figure 9. The estimated linear regression relationships for training, validation, testing, and overall per model for the FFNN model: (A) WQI; (B) Cd; (C) CCME WQI.
Water 17 02371 g009
Figure 10. For each model, FFNN predictions for the test set of experimental data samples for the (A) WQI, (B) Cd, and (C) CCME WQI.
Water 17 02371 g010
Figure 11. Interactive data visualization view.
Water 17 02371 g011
Table 1. WQI range, WQS status, CCME WQI range, CCME WQS status, Cd range, Cd status, and possible use of the water sample.
WQIWater Quality Status (WQS)CCME WQICCME Water Quality Status (WQS)CdCd
Status
Possible Use
0–25Excellent water quality95–100Excellent0ExcellentDrinking, irrigation, and industrial
26–50Good water
quality
80–94Good<1LowIrrigation and industrial
51–75Poor water
quality
65–79Fair3–1MediumIrrigation and industrial
76–100Very poor water quality45–64Marginal3–6HighIrrigation
Above 100Unsuitable
for any use
0–44Poor>6Very HighProper treatment
required before use
Table 2. Descriptive statistics of water chemistry parameters.
ParameterLimitMeanSDMin.Max.Lower QUpper Q
pH6.5–8.57.310.276.77.727.097.58
EC (μS/cm)250036252659.4283313,44019154075
NH4+ (mg L−1)0.50.861.030.084.370.320.86
NO2 (mg L−1)0.50.460.610.012.160.070.8
NO3 (mg L−1)50154.3104.6112.46360.868.22264.37
PO43− (mg L−1)0.50.50.50.042.110.120.77
COD (mg L−1)4.56.123.031.2315.514.027.71
Na+ (mg L−1)200335.2237.651.21221166451.5
Table 3. Spearman correlation matrix of the hydrochemical parameters.
Groundwater Quality Index
ParameterpHECNH4+NO2NO3PO43−CODNa+
pH1
EC−0.445 **1
NH4+−0.240.271
NO2 −0.130.445 **0.492 **1
NO3 −0.507 **0.577 **0.240.342 *1
PO43− 0.08−0.230.150.06−0.369 *1
COD−0.080.010.392 *0.475 **0.060.363 *1
Na+ −0.160.604 **0.270.530 **0.373 *−0.010.201
Notes: ** Correlation is significant at the 0.01 level (2-tailed). * Correlation is significant at the 0.05 level (2-tailed).
Table 4. Effect of the number of neurons used in the hidden layer of each WQI model.
ModelMeasureNumber of Neurons
1017192125
WQIRMSE0.21790.16680.1780.12050.1933
R20.97260.98390.98170.99160.9784
CdRMSE0.16210.19440.21060.20210.2033
R20.97140.95890.95180.95560.955
CCME WQIRMSE0.13050.14980.15620.13770.1367
R20.98380.97870.97680.9820.9823
Table 5. Effect of the training algorithm used in each WQI model.
ModelMeasureTrainlmTrainscgTrainbr
WQIRMSE0.53970.52220.1205
R20.83190.84260.9916
CdRMSE0.32610.27480.1621
R20.88430.91780.9714
CCME WQIRMSE0.28010.38310.1305
R20.92550.86060.9838
Table 6. Effect of the hidden layer’s activation function in each WQI model.
ModelMeasureRadbasTribasTansig
WQIRMSE0.27260.40610.1205
R20.95710.90480.9916
CdRMSE0.19540.24020.1621
R20.95840.93720.9714
CCME WQIRMSE0.21690.33830.1305
R20.95530.89140.9838
Disclaimer/Publisher’s Note: The statements, opinions and data contained in all publications are solely those of the individual author(s) and contributor(s) and not of MDPI and/or the editor(s). MDPI and/or the editor(s) disclaim responsibility for any injury to people or property resulting from any ideas, methods, instructions or products referred to in the content.