Article

Effect of Anisotropy on Saline Groundwater Pumping Efficiency for Seawater Intrusion Control

1
No. 8 Institute of Geology and Mineral Resources Exploration of Shandong Province, Rizhao 276826, China
2
Qingdao Key Laboratory of Groundwater Resources Protection and Rehabilitation, Qingdao 266100, China
3
Rizhao Coastal Soil and Water Observation and Research Station, Rizhao 276826, China
4
Key Laboratory of Geological Safety of Coastal Urban Underground Space, Ministry of Natural Resources, Qingdao Geo-Engineering Surveying Institute, Qingdao 266101, China
*
Authors to whom correspondence should be addressed.
Water 2025, 17(16), 2359; https://doi.org/10.3390/w17162359
Submission received: 6 July 2025 / Revised: 4 August 2025 / Accepted: 6 August 2025 / Published: 8 August 2025

Abstract

Hydraulic conductivity anisotropy critically controls seawater intrusion management in coastal aquifers, and yet its impact on negative hydraulic barriers remains poorly understood. Using three-dimensional density-dependent modeling, this study reveals how varying ratios between horizontal and vertical conductivity influence barrier effectiveness. The results show that systems where vertical conductivity dominates enhance horizontal flow, but retain more residual salt, while horizontally dominated systems initially accelerate saltwater wedge retreat, but subsequently cause interface destabilization and inland reinvasion. Pumping rate and well depth interact significantly with these anisotropy effects, with higher pumping rates reducing anisotropy-dependent variations and deeper wells activating density-driven convection processes. Optimal barrier design requires careful consideration of competing objectives, as conditions favoring interface stability differ from those maximizing salt removal. These findings establish design principles for hydraulic barriers in anisotropic coastal aquifers, providing critical insights for managing seawater intrusion in increasingly stressed groundwater systems.

1. Introduction

Coastal regions are among the most densely populated areas globally [1], and the increasing water demands for daily life, as well as industrial and agricultural activities, have led to the extensive extraction of groundwater from coastal aquifers [2,3]. However, over-extraction disrupts the original groundwater dynamics, causing a decline in freshwater levels. Concurrently, anthropogenic emissions of greenhouse gases, such as carbon dioxide, have induced global warming, resulting in the melting of polar ice caps. It is projected that, by 2100, sea levels will rise by 0.09–0.80 m, further disturbing the balance between saline and freshwater bodies and exacerbating the global geological disaster of seawater intrusion [4]. This phenomenon not only contaminates coastal freshwater resources, but also severely degrades groundwater quality [5]. Currently, seawater intrusion has been reported in dozens of countries and regions, including Japan [2], Israel [6], the United States [7], South Korea [8], and China [9].
Over the past decades, various measures have been developed to mitigate seawater intrusion [10]. These include reducing groundwater extraction through water-saving irrigation [11], relocating wells further inland [12], extending the coastline through land reclamation [13], constructing impermeable underground barriers using materials like concrete, grouting, and bentonite [14], and artificially or naturally recharging coastal aquifers with external freshwater sources such as surface water or atmospheric precipitation [15]. A negative hydraulic barrier is a method that involves saline groundwater pumping [16,17]. For clarification, a negative hydraulic barrier refers to a specific type of hydraulic barrier created by pumping saline groundwater to generate a hydraulic gradient that repels saltwater, while hydraulic barrier is a more general term for various methods using hydraulic pressure to control saltwater movement, and saline groundwater pumping is the process of extracting saline groundwater, which can be used to create a negative hydraulic barrier or for other purposes like desalination. The extracted saline groundwater can be directly discharged into the sea, used for industrial purposes (e.g., cooling and irrigating certain crops), or serve as a source for desalination plants. Compared to seawater, the extracted saline groundwater offers significant advantages as a desalination source due to its lower pollution levels, which reduces the amount of chemicals needed in the pretreatment process. The low pollution level of saline groundwater is attributed to its natural filtration through the aquifer’s porous media and its low organic carbon and dissolved oxygen content [18]. Additionally, the stable temperature of saline groundwater throughout the year, different from seawater, provides a higher quality raw material for desalination plants [19]. Therefore, extracting saline groundwater not only helps in combating seawater intrusion, but also provides a high-quality raw material for desalination plants.
Mahesha, based on the assumption of a sharp interface between saltwater and freshwater, investigated the factors affecting the performance of saline groundwater pumping in preventing seawater intrusion [20]. It was found that reducing the well spacing and increasing the pumping rate can effectively enhance the performance of the hydraulic barrier. When the hydraulic barrier is located far from the marine boundary or above the transition zone, the quality of the extracted saline groundwater is better. However, this is associated with a reduction and loss of some upstream discharged freshwater, which is a drawback of this measure. To address this issue, Pool and Carrera proposed a double hydraulic barrier system, which involves pumping in both the saline and freshwater zones [21]. They found that the pumping rate is affected by the location of the pumping wells, so the barrier location must be carefully chosen to prevent saline water from bypassing the saline zone wells and contaminating the freshwater extraction wells. Gao et al. investigated the effects of the pumping rate, different distances from the coastline, and inland freshwater extraction on the distribution of saline and freshwater and the submarine groundwater discharge (SGD) [16]. The results show that extracting saline groundwater widens the saltwater–freshwater transition zone, and, with increasing pumping rates, the aquifer desalination effect is more significant, the SGD volume decreases, and the distance of the pumping wells from the coastline does not affect the SGD volume. Although the effectiveness of saline groundwater pumping in preventing seawater intrusion has been extensively studied, the impact of aquifer properties, especially the anisotropy of hydraulic conductivity, on its effectiveness is still unclear.
In actual coastal aquifers, the anisotropy of hydraulic conductivity has become an important parameter for environmental geologists to study seawater intrusion [22]. Field surveys and numerical simulations have proven that changes in the anisotropy of hydraulic conductivity significantly affect the movement of the seawater intrusion. Abarca et al. showed that changes in the ratio of horizontal to vertical hydraulic conductivity alter the position of the seawater wedge toe, causing the saline–freshwater transition zone to intrude inland [23]. However, Michael et al. demonstrated that, compared to a constant horizontal hydraulic conductivity, a lower vertical hydraulic conductivity results in a wider nearshore SGD zone and saline–freshwater transition zone [24]. The impact of the hydraulic barrier on the dynamics of the saltwater–freshwater transition zone in coastal unconfined aquifers under anisotropic conditions, especially its efficiency in preventing seawater intrusion, is still poorly understood.
Therefore, this study aims to explore the impact of the anisotropy of hydraulic conductivity on the efficiency of saline groundwater pumping in preventing seawater intrusion. Based on numerical simulations, this study addresses the following three key questions: (1) the desalination mechanism of saline groundwater in anisotropic aquifers; (2) the actual efficiency of saline groundwater pumping in preventing seawater intrusion under different anisotropic conditions; and (3) the optimization of the operation parameters of the saline groundwater pumping wells in anisotropic aquifers.

2. Methods

2.1. Conceptual Model

In this study, we rely solely on numerical simulation results and did not conduct physical experiments. This decision was primarily due to the challenges associated with precisely controlling the constant head boundary conditions in the aquifer, especially when conducting pumping experiments in a sand tank. Minor variations in these boundary conditions can significantly impact experimental outcomes, thereby compromising the repeatability of the results. Additionally, considering the complexity of real coastal aquifers, including the anisotropy and heterogeneity of hydraulic conductivity, as well as tidal and seasonal variations, laboratory simulations become extremely difficult and cannot fully replicate real-world conditions. We chose to study the problem using numerical modeling, conducted additional sensitivity analyses on key parameters (see Supplementary Materials), and referenced previous studies [16,21] to ensure that our model settings were consistent with existing knowledge.
A three-dimensional coastal unconfined aquifer model was developed to investigate the impact of hydraulic conductivity anisotropy on the efficiency of saline groundwater pumping in preventing seawater intrusion. The model was designed to simulate the shape and position of the saltwater–freshwater mixing zone under steady-state conditions without pumping wells, and to evaluate the potential effects of extracting saline groundwater below the freshwater–saltwater interface in the coastal aquifer. The primary objective was to dynamically simulate the evolution of the saltwater–freshwater mixing zone under various pumping scenarios with different pumping rates and the position of the screening related to the bottom of the aquifer, while specifically addressing the influence of anisotropy.
The model boundary conditions were defined to reflect realistic hydrological settings. The seawater boundary is represented by an equivalent freshwater head, which is calculated using the following equation:
h f w = h s w + α ( h s w z )
where hfw is the equivalent freshwater head; hsw is the seawater head; α is the density ratio; and z is the elevation relative to the sea level. The seawater head is set at 28.5 m, while the inland freshwater head is established at 29.5 m. The density ratio a is defined as
α = ( ρ s w ρ f w ρ f w )
where ρ sw is the seawater density (1.025 g/cm3) and ρ fw is the freshwater density (1.000 g/cm3).
The salinity at the seawater boundary was set at 35,000 mg/L total dissolved solids. The top boundary east of the coastline was assigned a freshwater recharge rate of 200 mm/year, representing rainfall replenishment (with an annual rainfall of approximately 600 mm and a recharge rate of 1/3). The bottom boundary of the model was impermeable. Other initial parameters are described in Table 1. These parameters were selected based on previous studies [16,25,26,27] to ensure that our model settings are consistent with existing knowledge and are representative of many coastal aquifers worldwide that possess similar hydraulic properties.
In terms of model construction, the FEFLOW code was utilized, which solves the coupled variable-density flow and solute transport equations using the finite element method. The three-dimensional model consists of 13 vertical layers, with overall dimensions of 400 m in length, 60 m in width, and 60 m in height (see Figure 1). Notably, the model incorporates homogeneous but anisotropic hydraulic properties to explore the influence of anisotropy on seawater intrusion prevention. Despite the fact that the seawater intrusion process is highly sensitive to preferential flow pathways and heterogeneity in porous media, the model was appropriately simplified during its design to minimize numerical errors and ensure reasonable computational time.

2.2. Numerical Simulation and Implementation

In this study, the linear matrix equations were solved using the preconditioned conjugate gradient (PCG) iterative solver with a tolerance of 1 × 10⁻⁸. Nonlinear problems were addressed using the Newton iteration method. The model domain was discretized into 210,000 triangular elements. The mesh size and dispersivity were selected to ensure numerical stability, in accordance with the Péclet number (Pe) criterion [28]:
P e = v Δ L D + α L v = 1.0 < 4
where Δ L [L] represents the grid size, α L [L] is the longitudinal dispersivity, v [LT−1] is the Darcy velocity, and D [L2T−1] is the molecular diffusion coefficient.
For the site-scale model, an adaptive time step with an increase factor of 1.05 was employed. The entire simulation period for the seawater retreat process was set at 14,300 days and was divided into two stages: seawater intrusion (Stage 1) and seawater retreat (Stage 2). The simulation time for the initial seawater intrusion (Stage 1) was 7000 days, after which a steady state was achieved. The subsequent seawater retreat (Stage 2) lasted for 7300 days, corresponding to 20 years of simulation time. It is important to note that, while the model is transient, the steady state achieved at the end of Stage 1 serves as the initial condition for Stage 2. This distinction is crucial for understanding the dynamics of the system. Based on the commonly used negative hydraulic barrier design and hydrological conditions, the porosity was set at 0.4. Additionally, the aquifer’s hydraulic gradient was 4‰, the horizontal hydraulic conductivity was 1 × 10⁻⁴ m/s, and the longitudinal dispersivity was 1 m. The hydraulic conductivity anisotropy (rk) is described by the ratio of vertical to horizontal hydraulic conductivity [22]:
r k = K z K x
In this study, the horizontal hydraulic conductivities Kx and Ky were kept constant (Kx = Ky = 2.5 × 10⁻⁴ m/s), while the vertical hydraulic conductivity Kz was varied, resulting in rk values ranging from 0.6 to 4. It should be noted that, for an isotropic aquifer, the value of rk is 1. This range was selected based on numerical modeling studies by Zheng et al. [22] that systematically examined rk values from 0.01 to 8 to represent potential anisotropy conditions in coastal aquifers. Our more focused range (0.6–4) captures the transition zone, where anisotropy most significantly influences seawater–freshwater interface dynamics, encompassing (1) moderately stratified systems (rk < 1) typical of layered sedimentary aquifers, (2) isotropic conditions (rk = 1), and (3) scenarios with enhanced vertical flow (rk > 1) that may occur in fractured or disturbed formations. On this basis, the corresponding parameters were adjusted to investigate the effectiveness of the negative hydraulic barriers in preventing seawater intrusion under different conditions.
A systematic series of simulations were conducted to investigate the dynamics of the saltwater–freshwater transition zone resulting from saline groundwater extraction. In the reference case, five pumping wells oriented parallel to the coastline were introduced at a depth of 50 m, located 0 m from the coastline. The wells were spaced 10 m apart and each was equipped with a 10 m long filter, with an extraction rate of 3 m3/d. This rate was determined through a combination of field data analysis and numerical simulations tailored to the specific hydrogeological conditions of the coastal aquifer in this study. Specifically, the rate was chosen to balance the need for effective seawater intrusion mitigation with the sustainability of groundwater resources, considering factors such as the aquifer’s hydraulic conductivity, porosity, and the spatial distribution of the wells. For each simulation, eight scenarios with different ratios of hydraulic conductivity anisotropy were tested. All parameters used in this study are listed in Table 1.

2.3. Data Analysis

To comprehensively evaluate the dynamics of the saltwater wedge and the effectiveness of saline groundwater pumping in preventing seawater intrusion, this study employs a suite of data analysis methods. These methods include the quantification of key metrics, temporal and spatial evolution analyses, and a sensitivity analysis of critical parameters.

2.3.1. Quantitative Metrics

To evaluate the desalination effectiveness of saline groundwater following the construction of pumping wells, two metrics were introduced: the reduction rate of the saltwater wedge in the inland aquifer behind the pumping wells (L*) and the total salt removal rate (M*). The length of the residual saline wedge is defined as the distance from the toe of the saltwater wedge to the wells, with the toe position determined by the 0.5 salinity isopleth (18 g/L). A volumetric box was established beneath the terrestrial side of the aquifer as the computational domain (see Figure 1), with dimensions of 400 m in length, 10 m in width, and 60 m in depth. The metrics L* and M* within the volumetric box were compared across different scenarios. The single-well pumping concept evaluated in the computational domain of this study represents an area subjected to the influence of pumping.
L * = L t L 0
where L0 is the initial length of the saltwater wedge in the aquifer at the time of installation of the pumping wells (at time 0) and Lt denotes the length of the residual saltwater wedge at time t after the installation of the pumping wells. For the saltwater pumping wells at a fixed location, L0 is a constant value, whereas for wells at different locations, L0 varies. Additionally, if the residual saltwater further intrudes into the freshwater aquifer after the installation of the wells, the value of L* exceeds 1 according to Equation (5). Conversely, when the residual saltwater retreats toward the seaward boundary, L* is less than 1. A higher value of L* indicates the poorer performance of the pumping wells in removing residual saltwater, while a lower value signifies better performance. Furthermore, M* is expressed in dimensionless form as
M * = M t M 0
where M0 is the initial total mass of residual salt trapped in the inland freshwater aquifer behind the pumping wells. Mt is the total salt mass in the aquifer at time t after the installation of the pumping wells. For the saltwater pumping wells at a fixed location, M0 is constant, whereas for wells at different locations, M0 varies. In the investigated cases, the value of Mt is always less than M0, resulting in M* values that are consistently less than 1. A higher value of M* indicates the poorer performance of the pumping wells in removing residual saltwater, while a lower value signifies better performance.

2.3.2. Temporal and Spatial Evolution Analysis

In addition to quantitative metrics, the temporal and spatial evolution of the saltwater wedge was analyzed to understand the dynamic behavior of the wedge under different conditions. This analysis involved tracking the changes in the saltwater wedge over time and space, revealing how the wedge responds to pumping and the influence of hydraulic anisotropy. The results show that the saltwater wedge exhibits different retreat patterns depending on the anisotropy ratio and pumping rate, with higher anisotropy ratios leading to more complex wedge dynamics.

2.3.3. Sensitivity Analysis of Critical Parameters

To further explore the factors influencing the effectiveness of saline groundwater pumping, a sensitivity analysis was conducted on critical parameters such as hydraulic conductivity anisotropy (rk), pumping rate (Q), and the position of the screening related to the bottom of the aquifer (Hw). The analysis revealed that these parameters significantly affect L* and M*. For instance, higher rk generally lead to faster wedge retreat, but may also increase saltwater re-invasion due to enhanced vertical mixing. Similarly, higher Q can accelerate salt removal, but may also induce greater residual saltwater due to increased vertical flow. Hw also plays a crucial role, with deeper wells promoting more effective salt removal through density-driven convection processes.

3. Results and Discussion

3.1. Influence of Anisotropy on Flow and Salinity Distribution

Figure 2 illustrates the spatiotemporal evolution of salinity distribution under negative hydraulic barrier operation at t = 0, 5, 10, and 20 years for isotropic (rk = 1, Figure 2a) and anisotropic (rk = 0.6, Figure 2b) aquifer conditions. The cross-sections shown pass through the pumping well location, and observed salinity values should be interpreted with consideration of their proximity to the well—the desalination effect decreases radially with distance from the extraction point. In the isotropic scenario (Figure 2a), seawater intrusion forms a stable saline wedge along the aquifer base proximal to the coastline. The residual saltwater exhibits an initial length of 206.3 m landward of the steady-state intrusion front. A transitional zone (5–25 m height) with variable width develops between saline and freshwater bodies, positioned entirely above the pumping well. Notably, the cross-section reveals maximum desalination effects near the well, with diminishing influence beyond this zone. This configuration demonstrates that, under isotropic conditions, saline wedge morphology is governed by seawater intrusion dynamics: the density contrast induces wedge-shaped stratification at the aquifer base, while transition zone dimensions reflect mixing intensities between saline and fresh groundwater.
After 5 years of operation with a pumping rate of 3 m3/d, the negative hydraulic barrier significantly reduces and narrows the high-concentration transition zone, causing it to shift seaward, leaving only a low-concentration saltwater wedge 75 m in length within the aquifer. The cross-sectional view highlights the radial nature of desalination, showing strongest effects directly below the well (where the hydraulic gradient is steepest) and weaker effects at the margins of the capture zone. This change reveals the hydraulic action mechanism of the negative hydraulic barrier: by lowering the water table, it alters the hydraulic gradient of the saltwater wedge, thereby affecting the direction and velocity of saline groundwater migration and promoting the seaward retreat of the saltwater wedge. The low-salinity transition zone below the pumping well markedly expands and reaches its maximum extent, while the one above the well contracts and is almost entirely removed. This disparity indicates that the hydraulic action of the pumping well has a significant local impact on the shape and distribution of the saltwater wedge, especially in the vicinity of the well, where changes in the hydraulic gradient lead to alterations in the migration path and distribution range of saline groundwater. This spatial pattern confirms that the well’s influence on salinity distribution decreases with vertical and horizontal distance from the extraction point. After 10 years of natural desalination, the high-concentration residual saline water is completely flushed out of the aquifer, and the area of the low-salinity transition zone is substantially reduced. This process illustrates the role of natural desalination mechanisms: the natural flow and dilution of groundwater further reduce the salinity of the saltwater wedge, gradually decreasing its area until a dynamic equilibrium is reached. The cross-section demonstrates that complete desalination occurs first near the well, with more distant areas requiring longer timescales for freshwater flushing. After 20 years, the saltwater wedge above the pumping well remains virtually unchanged, while the low-salinity transition zone below the well also recedes, but with relatively minor changes. This final configuration shows persistent salinity gradients radiating from the well location, emphasizing the localized nature of the desalination effects. This suggests that, in the long-term natural desalination process, the shape of the saltwater wedge gradually stabilizes, while the hydraulic action of the pumping well helps to maintain this stable state to some extent.
In Figure 2b, initially, the pumping well is located closer to the transition zone, resulting in a saltwater wedge 85.1 m in length being trapped behind the well. Compared to the isotropic case, the transition zone between seawater and freshwater is narrower and more unevenly distributed. This phenomenon reflects the morphological characteristics of the saltwater wedge under anisotropic conditions: due to the differences in hydraulic conductivity in different directions, the shape and width of the saltwater wedge undergo significant changes, leading to more complex migration pathways for saline groundwater. After 5 years of operation with a pumping rate of 3 m3/d, the high-concentration transition zone is largely removed and narrowed, shifting seaward. Compared to the isotropic case, during the seawater retreat process, high-concentration saline groundwater begins to enter the aquifer under the traction of the pumping well. This change reveals the dynamic variation mechanism of the saltwater wedge under anisotropic conditions: due to differences in hydraulic conductivity, saline groundwater more easily enters the aquifer under the traction of the pumping well, thereby accelerating the retreat and desalination process of the saltwater. The low-salinity transition zone below the pumping well significantly expands and reaches its maximum extent, while the one above the well contracts and is almost entirely removed. This disparity indicates that, under anisotropic conditions, the hydraulic action of the pumping well has an even more significant local impact on the shape and distribution of the saltwater wedge, especially in the vicinity of the well, where changes in the hydraulic gradient lead to greater alterations in the migration path and distribution range of saline groundwater. After 10 years of natural desalination, seawater intrusion reaches a dynamic equilibrium. Compared to the isotropic case, the aquifer reaches a stable state more rapidly, and the area of the low-salinity transition zone is substantially reduced. This process further illustrates the role of natural desalination mechanisms under anisotropic conditions: the natural flow and dilution of groundwater are more efficient under anisotropic conditions, leading to a faster reduction in the salinity of the saltwater and thereby accelerating the stabilization process of the saltwater wedge. After 20 years, the saltwater wedge remains virtually unchanged. Compared to the isotropic case, the transition zone under anisotropic conditions at equilibrium is narrower, which is attributed to the smaller width of the low-salinity transition zone. This result suggests that, under anisotropic conditions, the shape and distribution of the saltwater wedge are more stable, with a narrower low-salinity transition zone, likely due to the differences in hydraulic conductivity causing more concentrated migration pathways for saline groundwater, thereby reducing the width of the transition zone.
To further elucidate the differences in salt migration rates between horizontal-flow-dominant and vertical-convection-dominant systems, we conducted additional analyses. In low-anisotropy (rk < 1) systems, the horizontal flow dominance restricts vertical mixing, leading to slower salt migration rates in the vertical direction. For example, under rk = 0.6 conditions, the vertical salt migration rate is approximately 0.02 m/year, while the horizontal salt migration rate is about 0.1 m/year. This slower vertical migration results in higher residual salt concentrations in the aquifer over time, as salt is retained along the horizontal flow paths. Conversely, in high-anisotropy (rk > 1) systems, the enhanced vertical convection significantly increases the vertical salt migration rate to around 0.2 m/year, which is much faster than the horizontal migration rate. This rapid vertical migration initially leads to faster desalination by quickly removing salt from the upper layers of the aquifer. However, it also destabilizes the freshwater–saltwater interface, causing saltwater re-invasion and reducing the overall desalination efficiency. Specifically, the initial rapid desalination phase lasts for about 5 years, after which the re-invasion of saltwater begins due to the destabilized interface.
Our findings are consistent with the results reported by Gao et al. [16], who observed that negative hydraulic barriers are effective in reducing high-salinity water in isotropic aquifers. Gao et al. demonstrated that negative hydraulic barriers significantly reduce the area of high-salinity water and promotes the seaward retreat of the saltwater wedge [16]. Our study extends this understanding by demonstrating that anisotropic conditions significantly influence the dynamics of the saltwater wedge and the efficiency of desalination processes. Specifically, we found that, under anisotropic conditions, the saltwater wedge reaches a stable state more rapidly, and the low-salinity transition zone is narrower compared to isotropic conditions. This suggests that anisotropy enhances the natural desalination mechanisms, leading to a faster stabilization of the saltwater wedge.
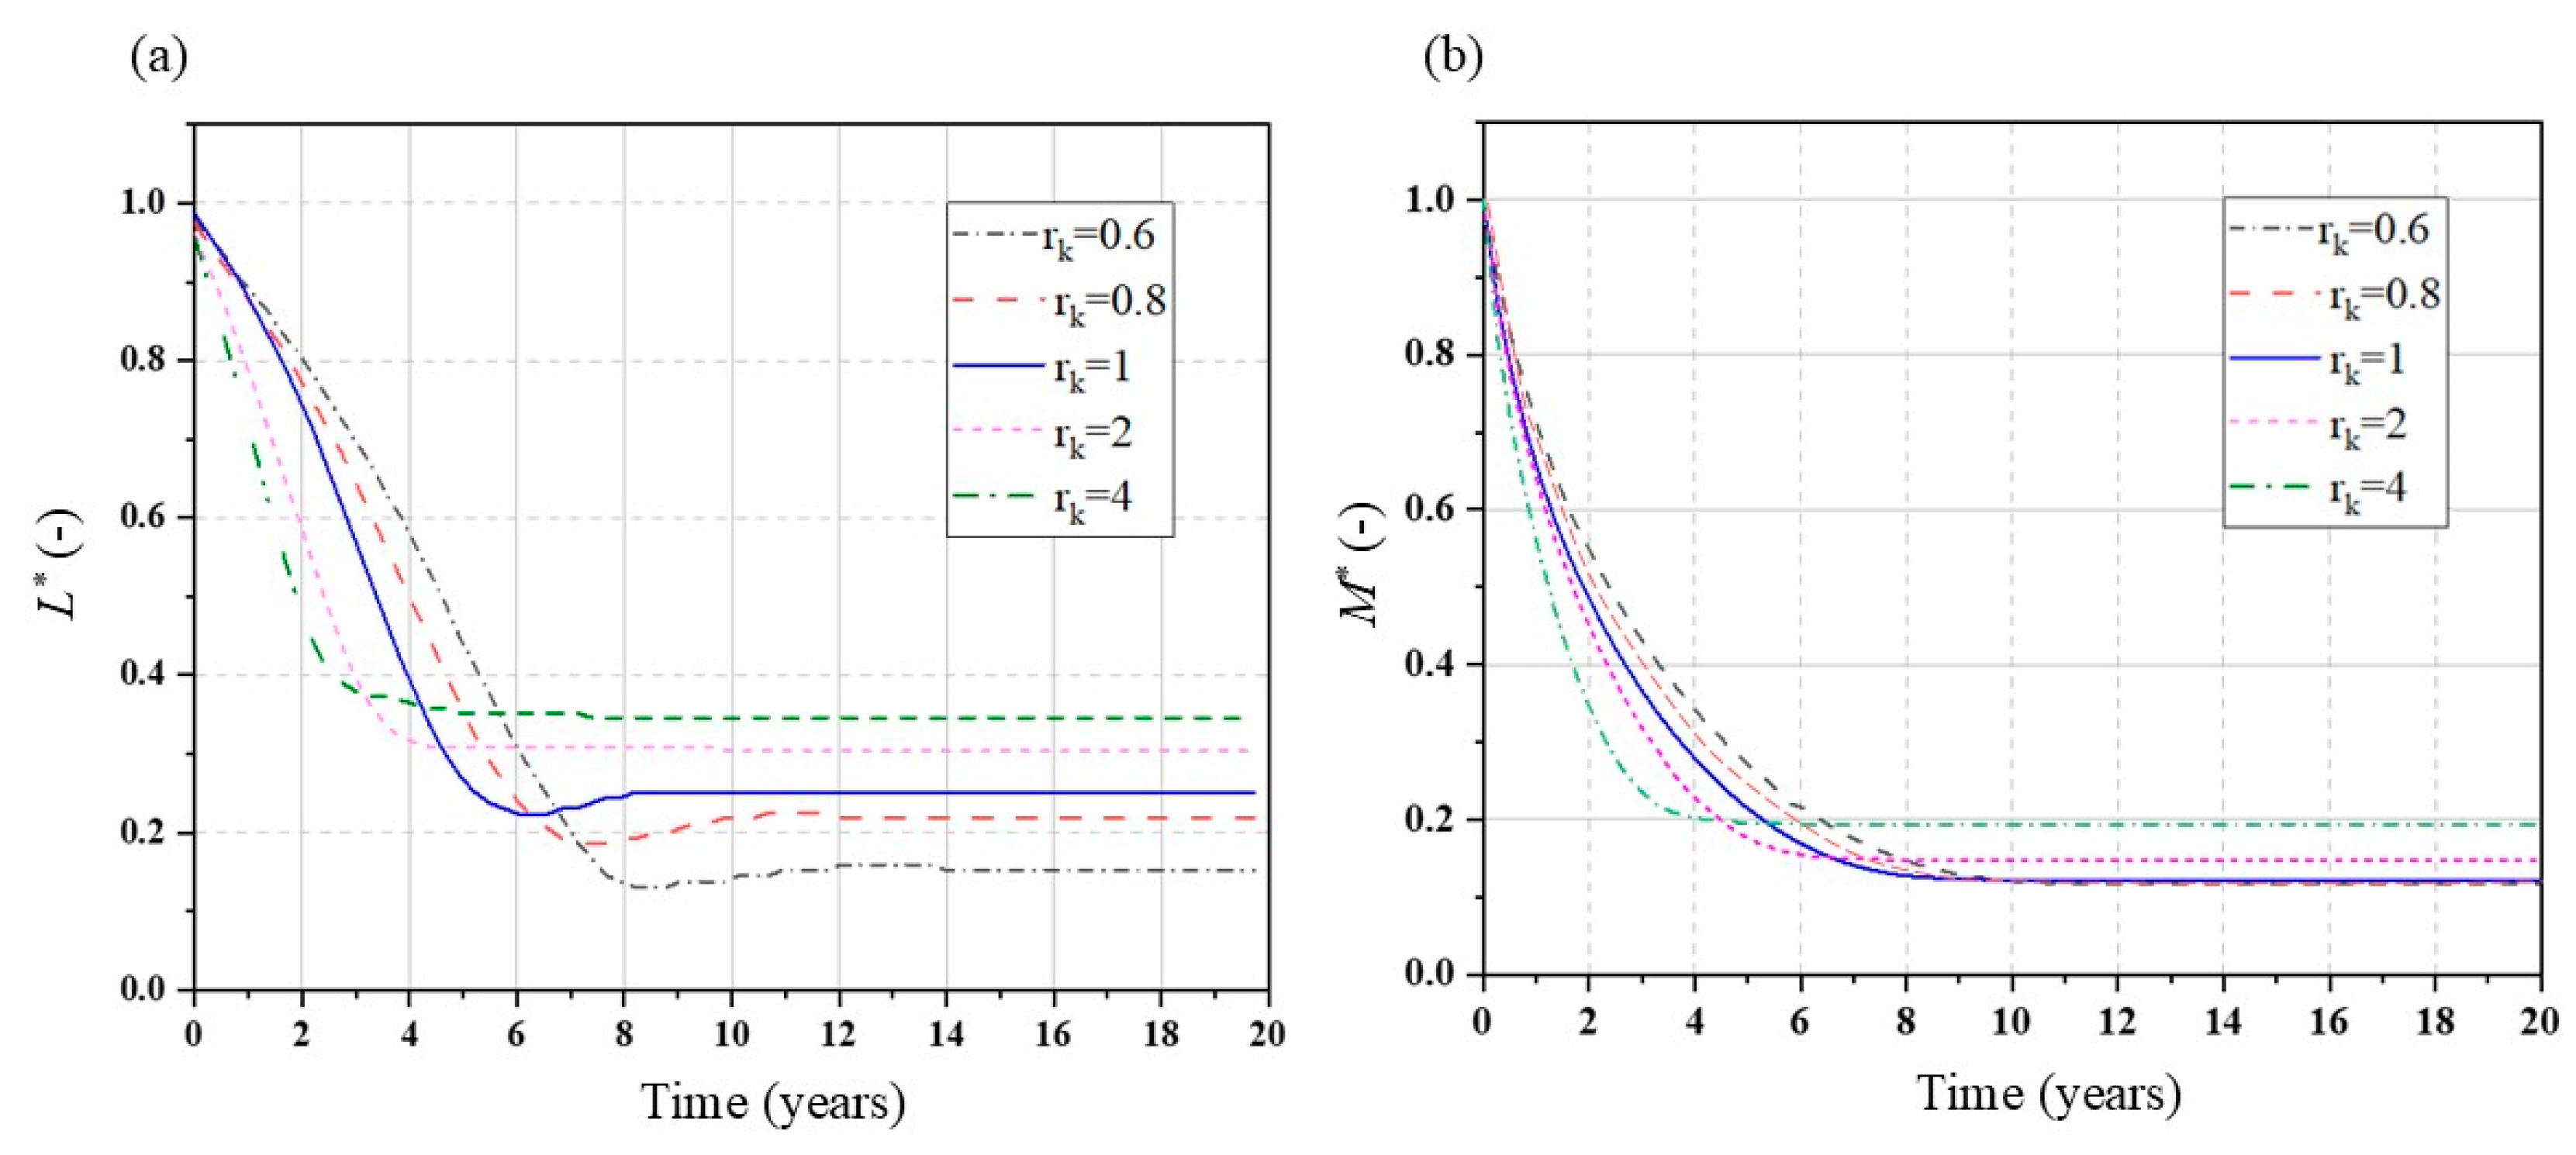
To quantify the impact of hydraulic anisotropy on removal effectiveness, Figure 3a shows how L* evolves over time under different rk. Initially, L* is set to 1. After the pumping wells are operational, for rk = 1, 0.8, 0.6, L* gradually decreases to minima of 0.21, 0.18, the 0.15 at 6, 7, the 8 years, respectively, then rebounds during an adjustment phase before stabilizing at 0.23, 0.21, the 0.17. This indicates that, in isotropic (rk = 1) and low-anisotropy ratios (rk < 1) aquifers, residual saltwater rapidly retreats seaward. The adjustment phase arises as the system rebalances its hydrodynamics and salinity distribution under constrained vertical transport. For rk = 2, 4, L* drops to minima of 0.38 and 0.35 at 3 and 4 years, respectively, and then stabilizes directly. In high-anisotropy ratio (rk > 1) aquifers, enhanced vertical hydraulic conductivity promotes vertical flow and mixing, enabling the rapid vertical dissipation of the saline wedge and eliminating the need for an adjustment phase. Results show that higher rk shortens the time to reach stabilization, but increases L*, implying lower effectiveness of the negative hydraulic barrier. The increased vertical hydraulic conductivity in high-rk aquifers allows for saltwater to migrate vertically more easily, reducing the barrier’s ability to contain saltwater vertically and thus increasing L* and lowering the barrier’s effectiveness.
To further quantify the impact of anisotropy on removal effectiveness, Figure 3b illustrates the temporal evolution of M* under different rk. M* is initialized at 1 for all cases. After the pumping wells commence operation, M* exhibits a monotonic decrease to stable values without undergoing an adjustment phase. Specifically, for rk values of 0.6, 0.8, 1, 2, and 4, M* reaches its minimum at 10, 9.1, 8.2, 6.3, and 4.1 years, respectively. In systems with higher rk values, the time required to reach stabilization is shorter. This is attributed to the enhanced vertical hydraulic conductivity, which accelerates vertical flow and promotes more efficient salt removal from the aquifer. However, higher rk values also lead to larger M* values, indicating the reduced effectiveness of the negative hydraulic barrier. This is because increased vertical flow pathways allow for greater interaction between saline and fresh water, potentially leading to more residual salt remaining in the aquifer. Conversely, in low-rk conditions (rk < 1), the vertical hydraulic conductivity is relatively low, which restricts vertical salt transport and results in smaller changes in the steady-state salt mass within the aquifer. Thus, the stable M* values remain relatively constant across different low-rk scenarios. This suggests that, in low-anisotropy settings, the negative hydraulic barrier is more effective in containing saltwater, as the system’s salt mass stabilizes at a lower level without significant fluctuations.

3.2. Effects of Pumping Rate on Anisotropy-Barrier Interactions

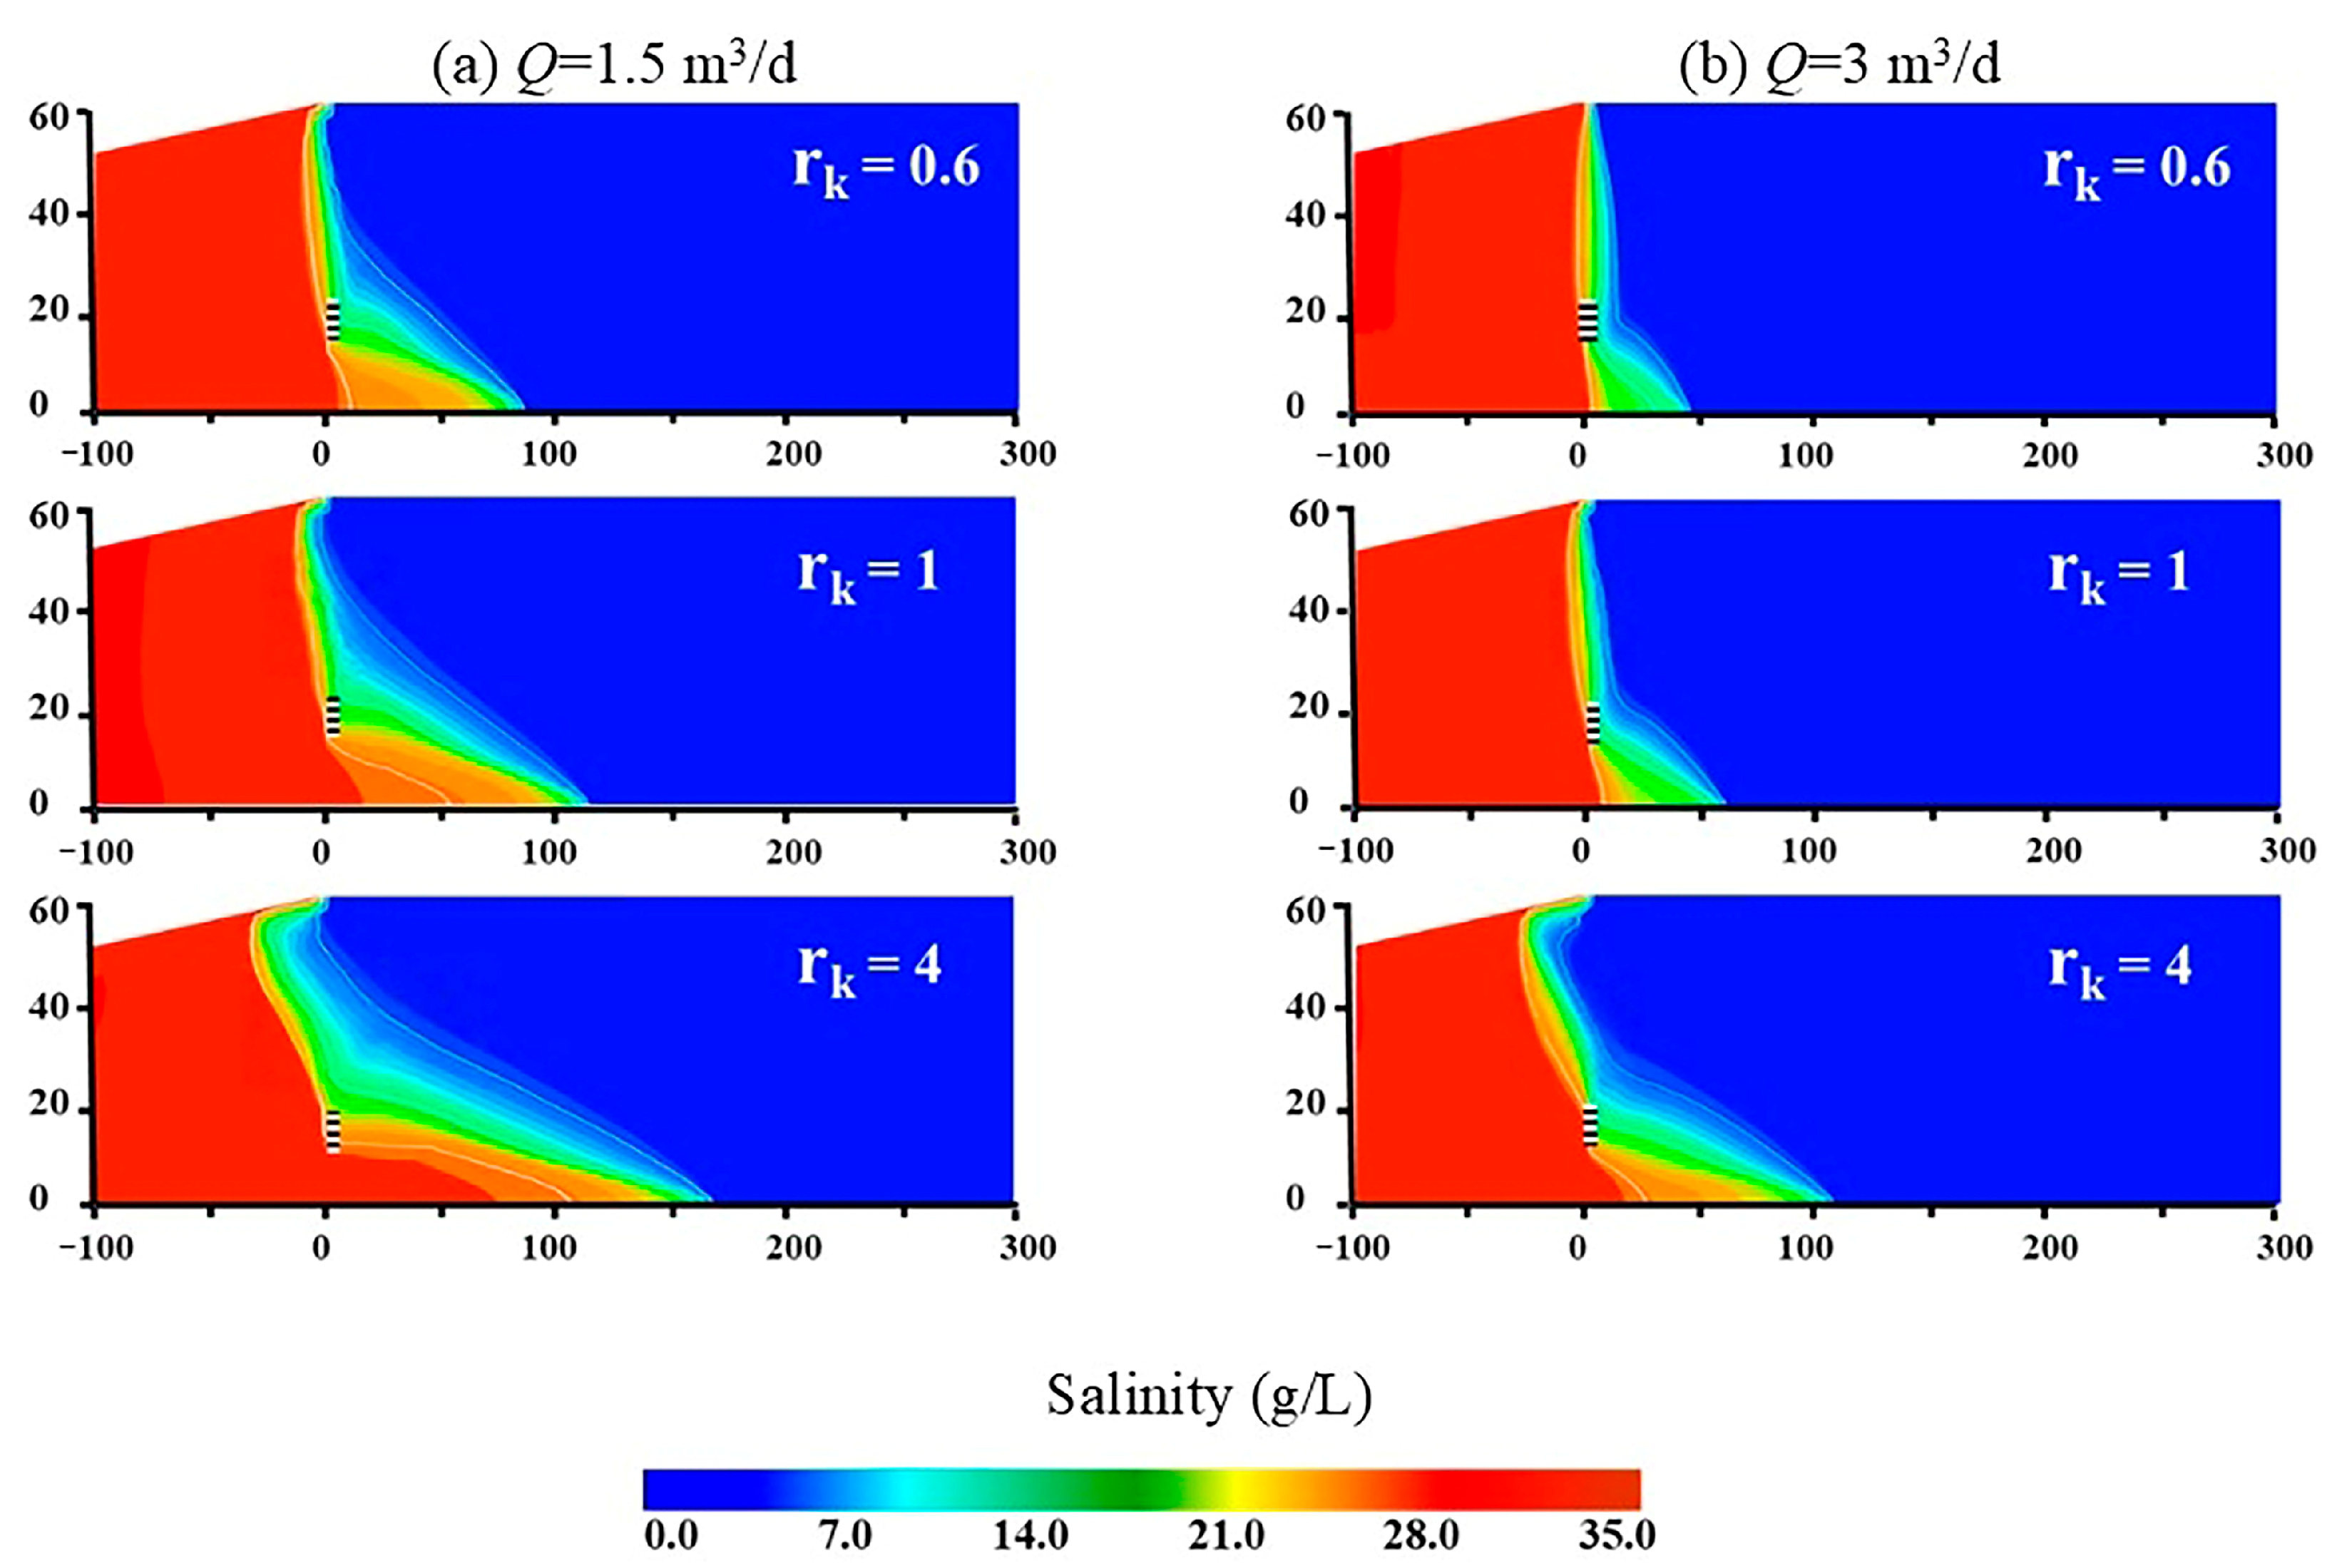
The regulatory effect of rk on saltwater migration persists despite pumping rate (Q) variations. Figure 4 elucidates rk’s mechanistic control on steady-state water–salt equilibrium in residual saltwater wedges under different Q. At Q = 1.5 m3/d, hydraulic conductivity anisotropy differentially governs flow paths with restricted vertical flow at rk = 0.6 while enhanced vertical flow occurs at rk = 4. This resulted in post-pumping steady-state wedge lengths of 80.9 m (rk = 0.6), 107.4 m (rk = 1), and 156.8 m (rk = 4). The observed divergence arises because low rk (<1) corresponds to reduced Kz, which suppresses vertical solute exchange and promotes horizontal salt retention, whereas high rk (>1) elevates Kz, enhancing vertical mixing and dissipation.
When Q increased to 3 m3/d, salt displacement efficiency improved systemically due to enhanced hydrodynamic forcing, substantially reducing residual salt mass across all rk. This confirms that Q modulates wedge recession by altering displacement pressure gradients. Notably, low-rk aquifers (rk < 1) exhibit greater Q-sensitivity, whereas elevated Q enhances horizontal advection, but cannot overcome Kz limitations, resulting in incomplete salt removal. For high-rk conditions (rk > 1), persistent brine results from density-driven stacking, since high Kz facilitates vertical mixing, but cannot fully purge deep salinity reservoirs under horizontal-dominated displacement.
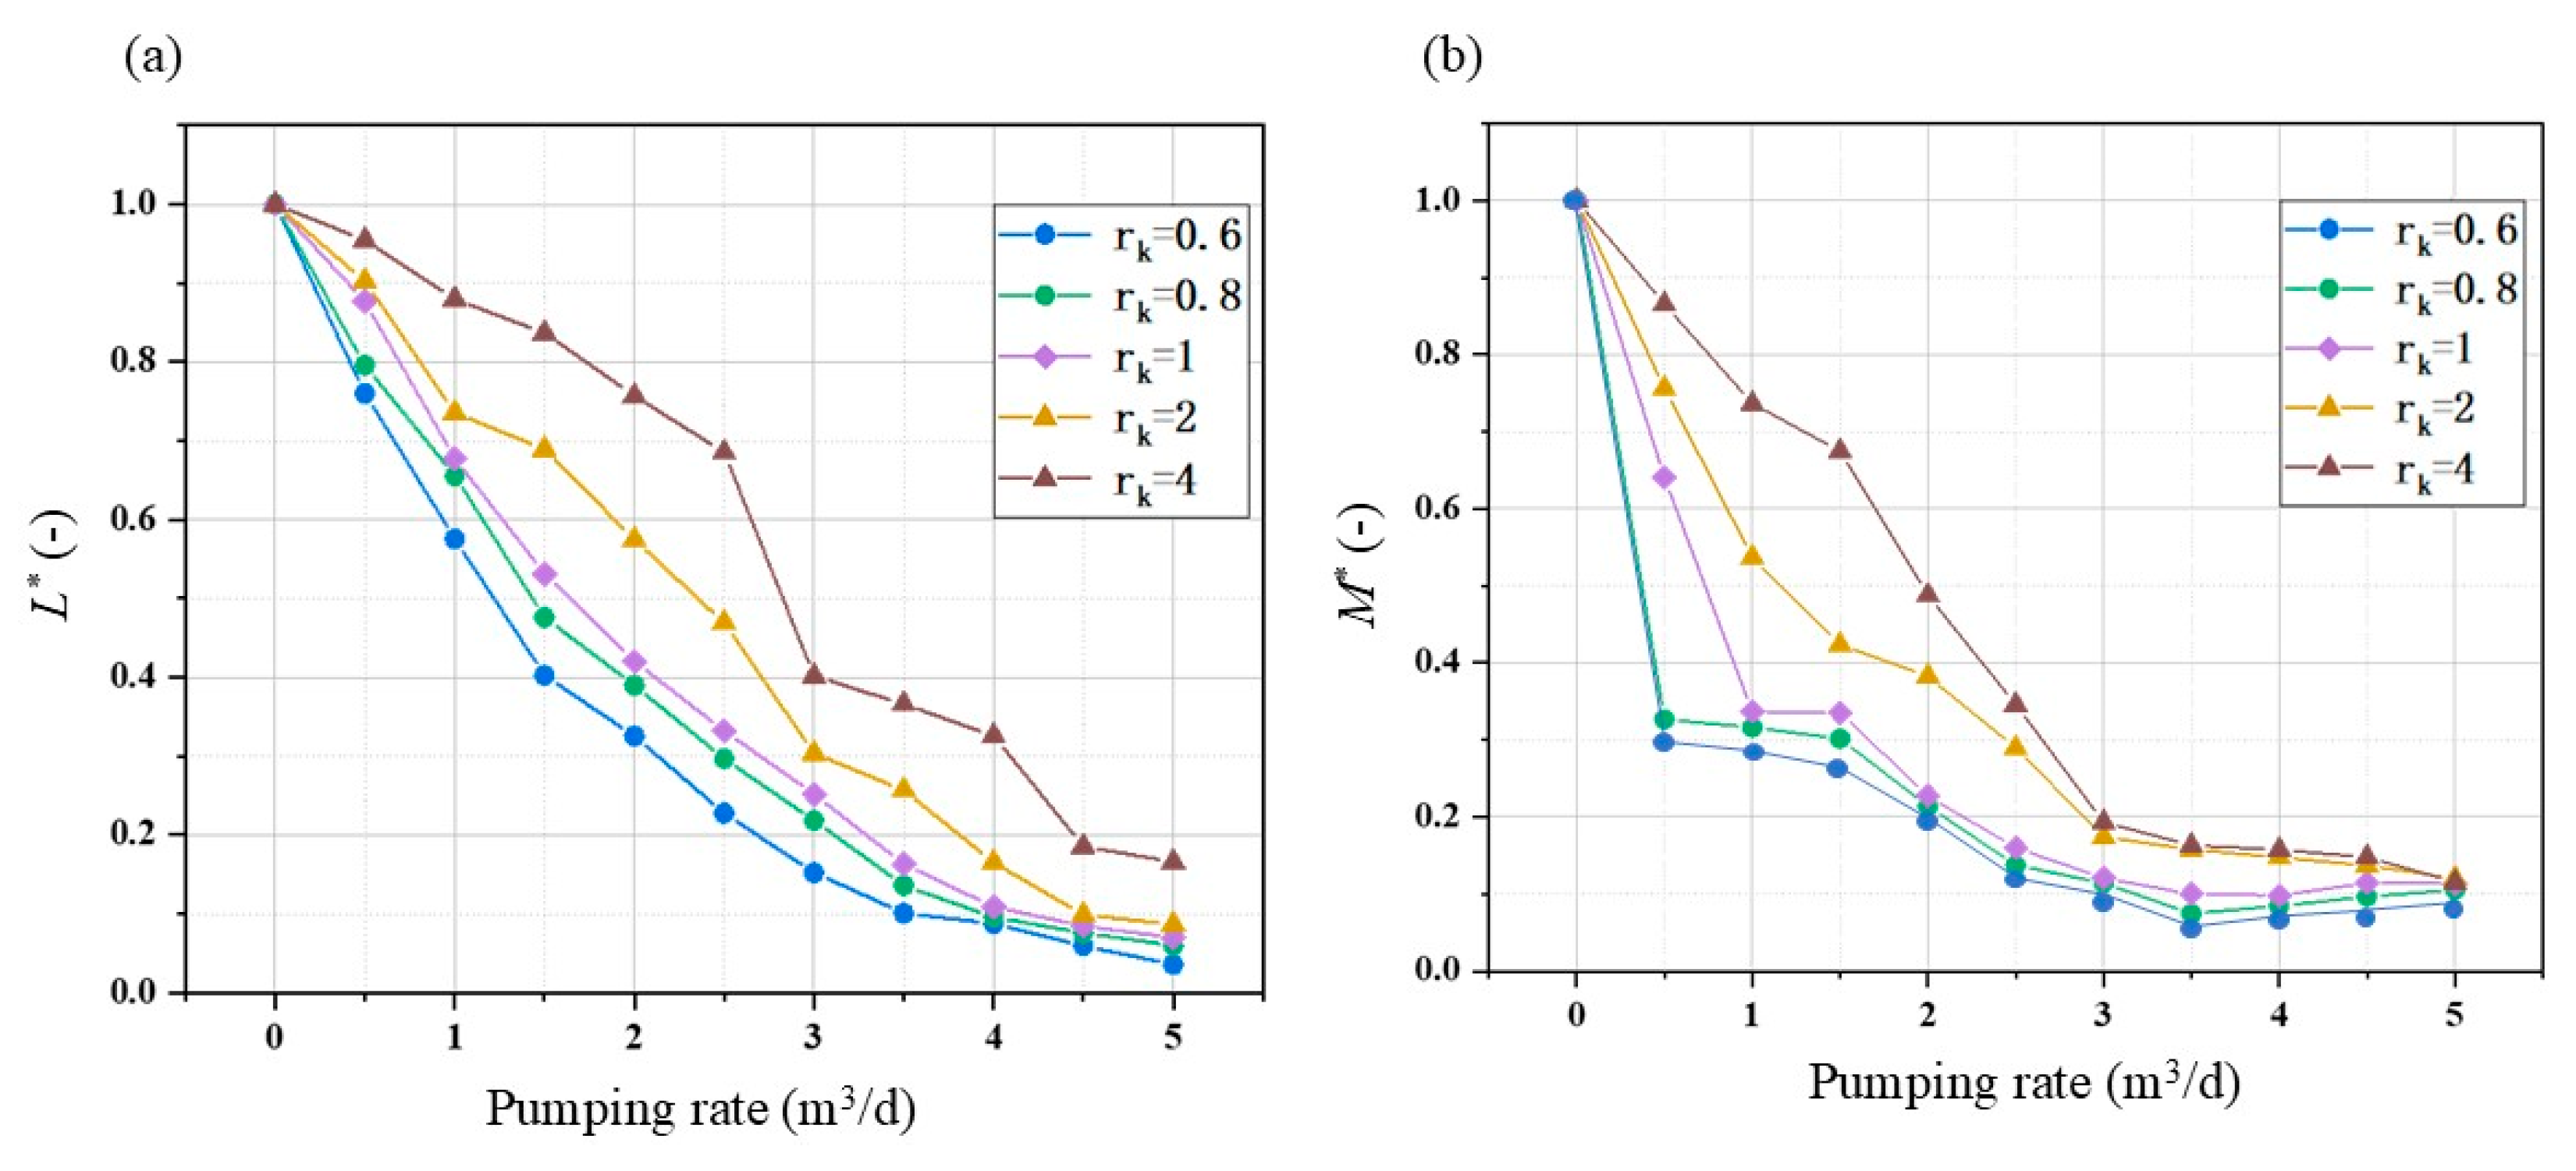
Figure 5a demonstrates that, when rk exceeds 0.6, the L* value increases significantly with rising rk under identical pumping rates. The underlying mechanism is that higher rk values (indicating enhanced vertical hydraulic conductivity) accelerate the seaward retreat of the saltwater wedge, but simultaneously reduce density stability at the freshwater-saltwater interface, inducing shear-generated interfacial vortices. Consequently, retreated saltwater preferentially re-invades inland aquifers through vertical high-hydraulic conductivity pathways. Quantitative analysis confirms that L* monotonically increases with rk across all pumping rates, as thickened interfacial mixing zones subject residual salts to complex coupled diffusion–convection processes, substantially elevating migration resistance and impairing removal efficiency. Representative observations include the following: at low pumping rates (Q = 2 m3/d), L* = 0.75 for rk = 4 significantly exceeds L* = 0.3 for rk = 0.6; at high rates (Q = 5 m3/d), L* converges near 0.1 for all rk values. This indicates that intensive pumping temporarily displaces bulk saltwater, yet density gradients from interfacial instability drive secondary convection currents, sustaining the high migration activity of residual salts while markedly increasing operational costs.
Figure 5b illustrates variations in M* with pumping rates across anisotropic conditions. When rk > 0.6, the geometric configuration of the saltwater wedge exerts dominant control on the negative hydraulic barrier’s efficacy. Fundamentally, enhanced vertical hydraulic conductivity suppresses vertical salt diffusion, promoting lateral salt retention. Thus, M* values under identical pumping rates consistently exceed those at rk = 0.6. Critically, M* exhibits monotonic increase with rising rk at any pumping rate due to intensified density stratification hindering vertical mixing. At low pumping rates (Q < 3 m3/d), M* under high-rk conditions substantially surpasses low-rk scenarios. When Q > 3 m3/d, M* values converge across anisotropy ratios: strong hydraulic gradients effectively remove mobile salts, but density-inverted encapsulated brine pockets in high-rk aquifers limit overall desalination efficiency, accompanied by significantly elevated economic costs.

3.3. Sensitivities of Pumping Height to Anisotropy–Barrier Interactions

The influence of hydraulic conductivity anisotropy on the negative hydraulic barrier persists, despite alterations in the position of the screening related to the bottom of the aquifer (Hw). Fundamentally, the screen section elevation directly governs the development of vertical displacement flow fields, while rk modulates solute transport pathways by adjusting the vertical/horizontal hydraulic conductivity capacity ratio. Figure 6 illustrates the dynamic saltwater–freshwater equilibrium under a constant pumping rate of 3 m3/d at different pumping depths. When Hw = 0 m (screen positioned 0–10 m above aquifer base), residual saltwater wedge length exhibits nonlinear variation with increasing rk under steady-state conditions, decreasing to 10.9 m at rk = 0.6, 11.4 m at rk = 1, and markedly increasing to 46.8 m at rk = 4. This phenomenon arises from enhanced density-driven convection at lower pumping depths: proximity to high-density saltwater accumulation zones enables vertically oriented pumping flows to effectively disrupt saline stratification structures. Compared to Hw = 10 m (screen at 10–20 m above base), the Hw = 0 m configuration removes more residual saltwater across varying rk values, confirming that lowered screen elevation enhances vertical hydraulic capture efficiency, particularly under high rk conditions (elevated vertical hydraulic conductivity), where density differentials more fully activate convective scavenging mechanisms. Notably, at Hw = 0 m, residual wedge lengths for low anisotropy ratios (rk = 0.6) and isotropic conditions (rk = 1) are essentially equivalent (10.9 m vs. 11.4 m); this occurs because strong vertical gradients generated by basal pumping supersede hydraulic conductivity anisotropy effects, becoming the dominant control on solute transport. Conversely, at Hw = 10 m, the residual length under low anisotropy (19.3 m) is substantially less than under isotropy (34.8 m), indicating that horizontal hydraulic conductivity’s dominance (low rk) at elevated screen positions expands the capture zone radii, compensating for diminished vertical displacement capacity. Collectively, these findings demonstrate that, during deep pumping, anisotropy effects on barrier efficacy are masked by vigorous convective processes, whereas, during shallow pumping, low rk significantly improves clearance efficiency by optimizing horizontal flow field architecture.
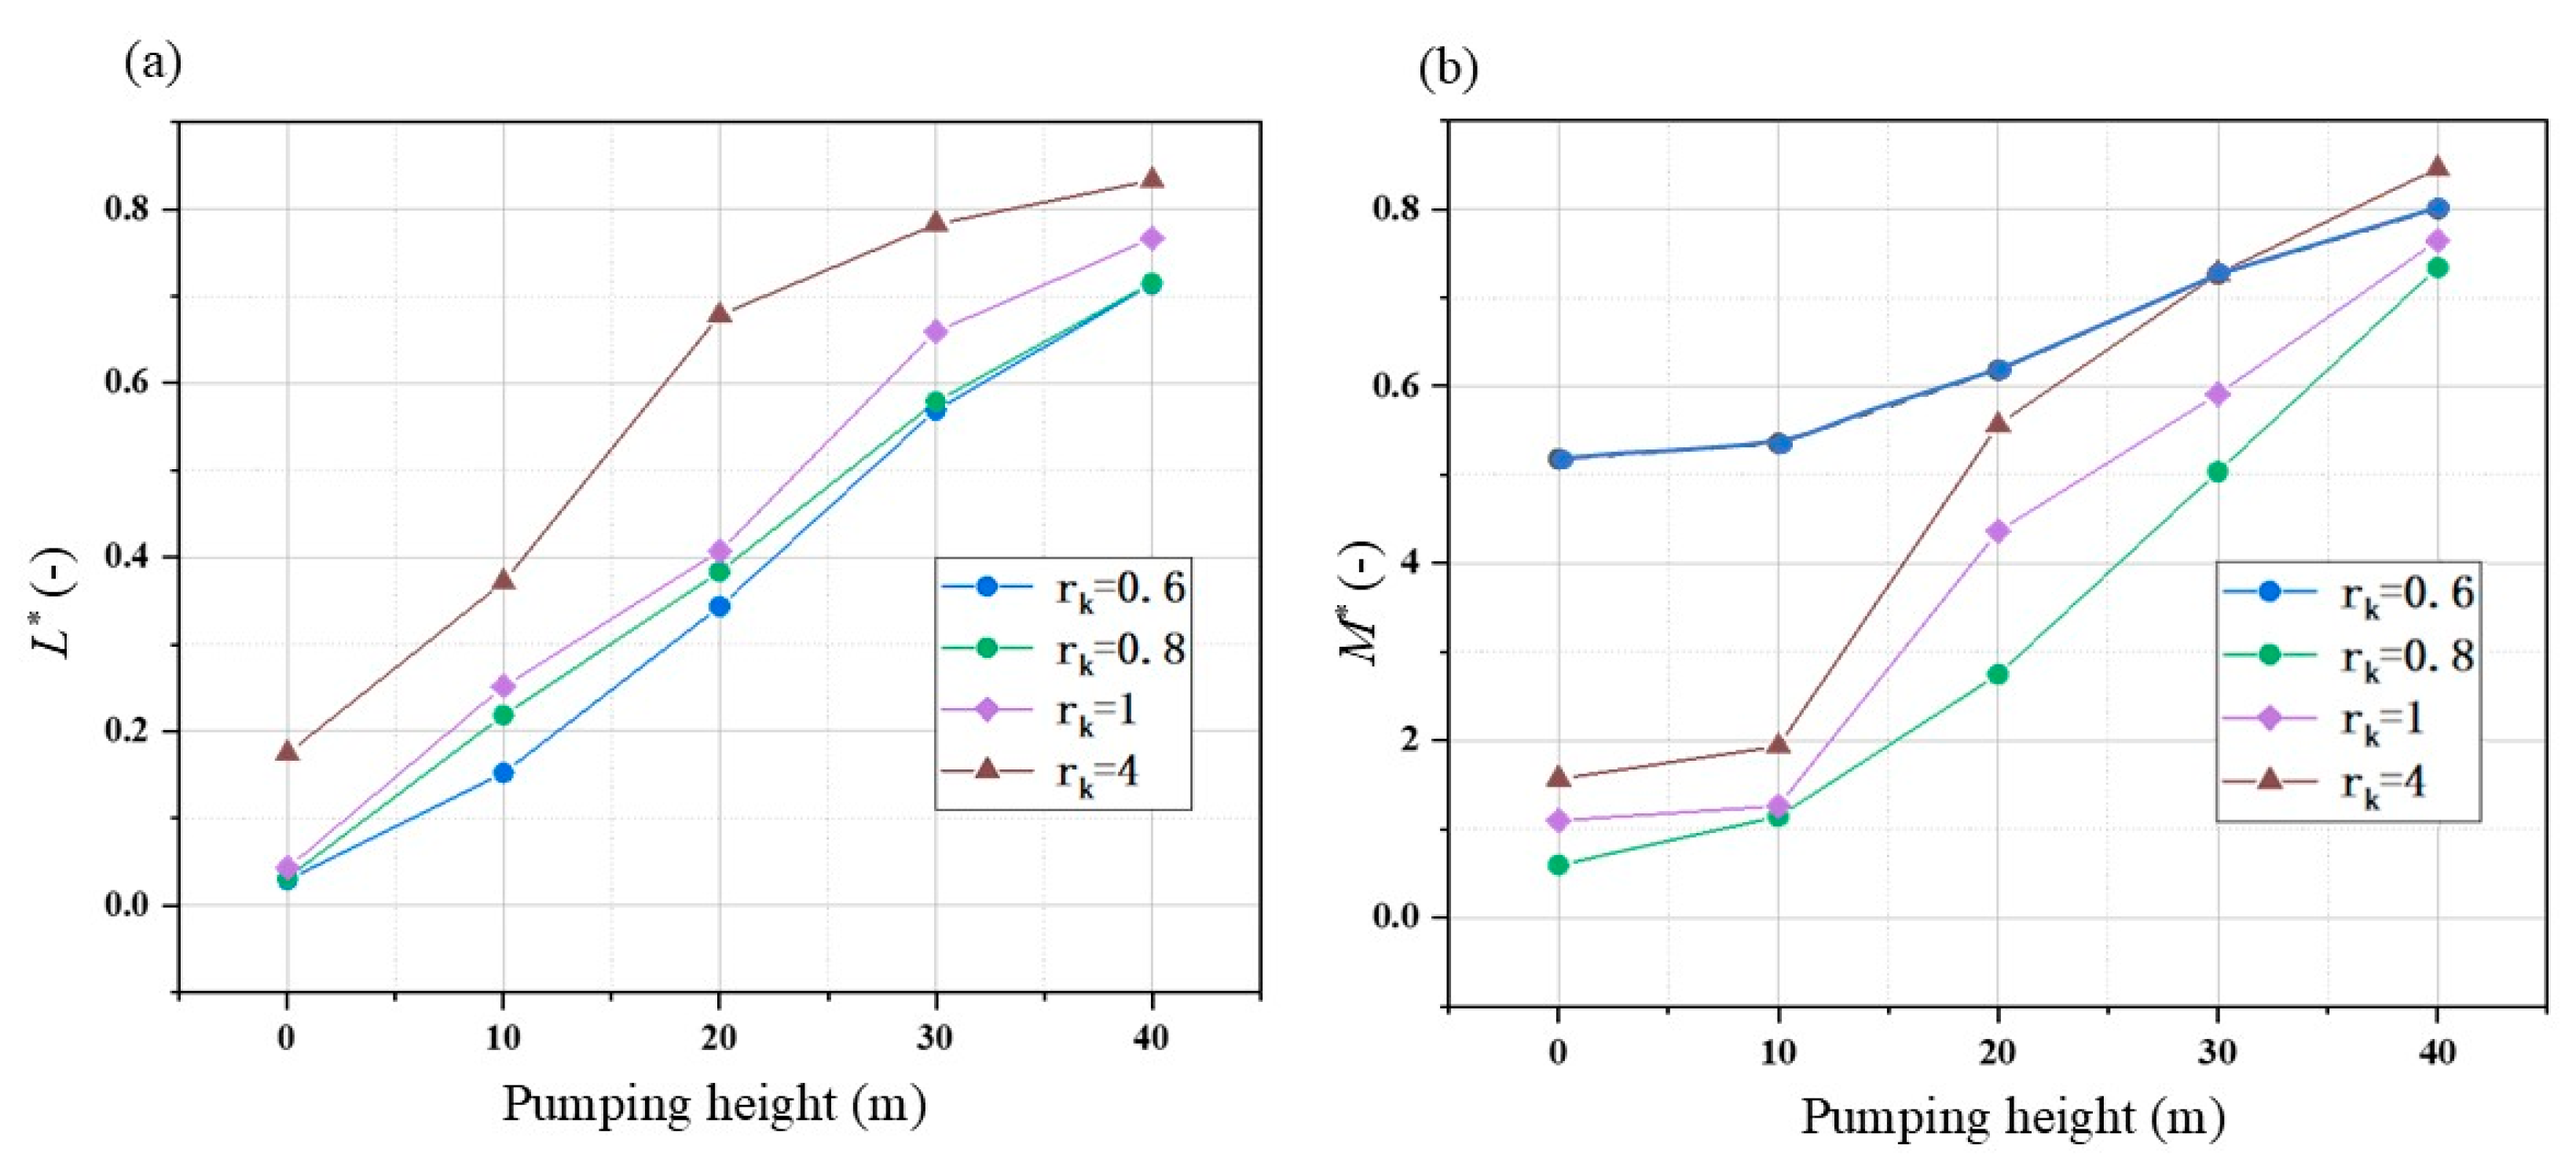
Figure 7a delineates L* variations, with the position of the screening related to the bottom of the aquifer (Hw) across anisotropy ratios (rk). For rk > 0.6, L* values exceed those at rk = 0.6 under identical elevations, attributed to enhanced vertical hydraulic conductivity accelerating saltwater retreat while inducing interfacial instability, which exacerbates residual salt retention. L* monotonically increases with rising rk at all positions, reflecting diminished displacement efficiency under dominant vertical flow regimes. Notably, at Hw = 40 m (the freshwater–saltwater transition zone), density–viscosity coupling triggers nonlinear transport responses, eliminating L* convergence with increasing rk. Simulations confirm that rk = 0.6 consistently yields minimal L* values, demonstrating an optimal balance between vertical displacement capacity and interfacial stability.
Figure 7b elucidates M* responses to well elevation. As Hw increases, attenuated gravitational segregation suppresses density-driven convection, elevating M* across all rk. M* for rk < 0.8 exceeds rk = 0.8 cases, fundamentally arising from horizontal hydraulic conductivity dominance expanding lateral solute migration domains. At Hw < 20 m, intense convective environments markedly amplify salt retention under low rk, elevating M* above other configurations, whereas, at Hw > 20 m, vertically dominated transport weakens medium anisotropy effects, driving M* convergence. Conversely, at rk = 0.6, elevated M* stems from inefficient salt removal: insufficient vertical hydraulic conductivity impedes the mobilization of deep saline reserves, sustaining high residual salt mass (Mt), while limited horizontal flow fails to effectively displace dispersed salts in the aquifer. This phenomenon is particularly pronounced in the Hw < 20 m zone, where high-density brine lenses formed under strong-density gradients persist due to inadequate vertical driving forces, significantly increasing Mt (thereby elevating M*).

4. Conclusions

Our findings establish that hydraulic conductivity anisotropy fundamentally dictates negative hydraulic barrier efficacy, with key implications:
(1)
Anisotropy dictates salt removal pathways. Low-anisotropy-ratio conditions enhance horizontal flow dominance, but suppress vertical mixing, promoting residual salt retention through constrained solute exchange. High anisotropy accelerates vertical convection, enabling rapid initial wedge retreat, yet simultaneously destabilizes interfacial hydrodynamics, triggering secondary flows that drive inland saltwater reinvasion.
(2)
Pumping parameters modulate anisotropy–barrier synergy. Elevated pumping rates homogenize system responses by overwhelming hydraulic conductivity contrasts, while well depth governs process dominance: deeper installations activate density-driven convection that masks anisotropy effects, whereas shallower positions leverage horizontal hydraulic conductivity to optimize freshwater capture.
(3)
Engineering optimization requires objective-specific designs. Minimizing residual wedge geometry favors balanced anisotropy with deeper well screens to harness convective scavenging. Maximizing total salt removal necessitates low anisotropy ratios with moderate pumping to enhance lateral displacement. Aggressive pumping clears mobile salts, but fails to purge deep brine reservoirs, incurring disproportionate energy penalties.
(4)
Anisotropy-imposed transport thresholds preclude universal optimization. Interfacial stability requires moderate anisotropy, whereas salt mobilization demands extreme hydraulic conductivity ratios, making simultaneous minimization of L* and M* unachievable.
Supplementary Analysis on Pumping Well Layout
The layout of the pumping wells—specifically their positions, spacing, and geometric configuration (e.g., linear versus arc-shaped arrays)—plays a significant role in influencing the observed anisotropy effects on barrier performance. In our study, the pumping wells were arranged in a linear configuration parallel to the coastline, with each well spaced 10 m apart. This arrangement was chosen to maximize the coverage of the saltwater wedge and to ensure efficient extraction of saline groundwater. However, alternative configurations, such as arc-shaped arrays, could potentially enhance the barrier’s effectiveness by better aligning with the natural curvature of the saltwater wedge. Our results indicate that the position and spacing of the wells significantly affect the desalination efficiency. For instance, wells placed closer to the transition zone can more effectively capture high-concentration saline water, but may also lead to increased re-invasion of saltwater if the pumping rate is too high. Conversely, wells positioned further inland can reduce the risk of saltwater re-invasion, but may require higher pumping rates to achieve the same level of desalination. Therefore, an optimal well layout should balance these factors to maximize the overall effectiveness of the negative hydraulic barrier.
Practical Implications
Our study provides critical insights for designing and managing negative hydraulic barriers in anisotropic coastal aquifers. By understanding the impact of hydraulic conductivity anisotropy on barrier performance, practitioners can optimize well placement and pumping strategies to enhance the effectiveness of seawater intrusion prevention. Specifically, our findings suggest that balanced anisotropy and deeper well screens are preferable for minimizing residual saltwater intrusion, while low anisotropy ratios and moderate pumping rates are more effective for maximizing salt removal. These guidelines can help coastal communities develop sustainable groundwater management plans and mitigate the adverse effects of seawater intrusion.
Limitations
While our study offers valuable insights, it is important to recognize its limitations. The model used in this study is based on simplified homogeneous conditions without tidal or seasonal forcing, which may not fully capture the complexity of real-world coastal aquifers. In particular, natural aquifers often contain heterogeneities, such as fractures, lenses, or layered structures, that may significantly alter flow dynamics and solute transport. These features could either amplify or counteract the effects of anisotropy, suggesting that our homogeneous model represents a simplified end-member case. Additionally, the sensitivity analyses conducted focus on a limited set of parameters, and further research is needed to explore the interactions between multiple factors. Future work should incorporate more detailed field data and consider the effects of climate change and sea-level rise on coastal groundwater dynamics.
Economic Feasibility and Long-Term Operation and Maintenance
Economic feasibility and long-term operation and maintenance are critical considerations for the practical implementation of negative hydraulic barriers. The cost of installing and operating such systems can be substantial, particularly in regions with limited resources. Our study highlights the importance of optimizing pumping rates and well depths to balance the effectiveness of salt removal with energy consumption and operational costs. Future research should focus on developing cost-effective strategies that integrate advanced data analytics and machine learning techniques to improve the efficiency and sustainability of these systems. Insights from recent studies on the application of machine learning in materials science [29] suggest that similar approaches could be employed to optimize the design and operation of negative hydraulic barriers, thereby enhancing their economic viability and long-term performance.
These mechanistic insights derive from simplified homogeneous models without tidal/seasonal forcing, yet provide critical design guidelines for anisotropic coastal aquifers.

Supplementary Materials

The following supporting information can be downloaded at: https://www.mdpi.com/article/10.3390/w17162359/s1, Figure S1: Radar diagrams showing the sensitivity of indicators to parameters: (a) the reduction rate of the saltwater wedge in the inland aquifer behind the pumping wells (L*) and (b) the total salt removal rate (M*) with respect to hydraulic conductivity (Kx), longitudinal dispersivity (αL), transverse dispersivity (αT), and porosity (n).; Table S1: Parameter settings for sensitivity analysis: baseline values and ±10% variation ranges for hydraulic conductivity (Kx), longitudinal dispersivity (αL), transverse dispersivity (αT), and porosity (n) used to evaluate their influence on the reduction rate of the saltwater wedge in the inland aquifer behind the pumping wells (L*) and (b) the total salt removal rate (M*) in the coastal aquifer model. References [30,31] are citied in the Supplementary Materials.

Author Contributions

Conceptualization, J.D. and P.Y.; Methodology, Y.L., H.A., J.D., R.K. and P.Y.; Formal analysis, Y.L., B.Y. and R.K.; Investigation, Y.L., B.Y., C.Y. and W.X.; Resources, J.D.; Writing—original draft, Y.L.; Writing—review & editing, B.Y., H.A., C.Y., J.D., R.K., W.X. and P.Y.; Supervision, H.A. All authors have read and agreed to the published version of the manuscript.

Funding

This work was supported by the Postdoctoral Fellowship Program of CPSF under Grant Number GZC20250290, the Natural Science Foundation of Shandong Province (No. ZR202111290402), Qingdao Key Laboratory of Groundwater Resources Protection and Rehabilitation (No. DXSKF2024Y01), and the Fundamental Research Funds for the Central Universities (No. 202513031).

Data Availability Statement

The data that support the findings of this study are available from the corresponding author upon reasonable request.

Conflicts of Interest

The authors declare that they have no known competing financial interests or personal relationships that could have appeared to influence the work reported in this paper.

References

  1. Barragán, J.M.; De Andrés, M. Analysis and trends of the world’s coastal cities and agglomerations. Ocean Coast. Manag. 2015, 114, 11–20. [Google Scholar] [CrossRef]
  2. Perumal, M.; Sekar, S.; Carvalho, P.C. Global investigations of seawater intrusion (SWI) in coastal groundwaters in the last two decades (2000–2020): A bibliometric analysis. Sustainability 2024, 16, 1266. [Google Scholar] [CrossRef]
  3. Yu, P.; Liu, H.; Wang, Z.; Fu, J.; Zhang, H.; Wang, J.; Yang, Q. Development of Urban Underground Space in Coastal Cities in China: A Review. Deep Undergr. Sci. Eng. 2023, 2, 148–172. [Google Scholar] [CrossRef]
  4. Watson, T.A.; Werner, A.D.; Simmons, C.T. Transience of seawater intrusion in response to sea level rise. Water Resour. Res. 2010, 46, W12533. [Google Scholar] [CrossRef]
  5. Cao, T.; Han, D.; Song, X. Past, present, and future of global seawater intrusion research: A bibliometric analysis. J. Hydrol. 2021, 603, 126844. [Google Scholar] [CrossRef]
  6. Silverman, J.; Strauch-Gozali, S.; Asfur, M. The Influence of fresh submarine groundwater discharge on seawater acidification along the northern Mediterranean coast of Israel. J. Geophys. Res. Ocean. 2024, 129, e2024JC021010. [Google Scholar] [CrossRef]
  7. Panthi, J.; Pradhanang, S.M.; Nolte, A.; Boving, T.B. Saltwater intrusion into coastal aquifers in the contiguous United States—A systematic review of investigation approaches and monitoring networks. Sci. Total Environ. 2022, 836, 155641. [Google Scholar] [CrossRef]
  8. Jeen, S.W.; Kang, J.; Jung, H.; Lee, J. Review of seawater intrusion in western coastal regions of South Korea. Water 2021, 13, 761. [Google Scholar] [CrossRef]
  9. Zhang, Z.; Yi, L. Research methods for seawater intrusion in China and recommendations for novel radium-radon technologies. Mar. Environ. Res. 2024, 198, 106530. [Google Scholar] [CrossRef] [PubMed]
  10. Stein, S.; Shalev, E.; Sivan, O.; Yechieli, Y. Challenges and approaches for management of seawater intrusion in coastal aquifers. Hydrogeol. J. 2023, 31, 19–22. [Google Scholar] [CrossRef]
  11. Abd-Elaty, I.; Ramadan, E.M.; Elbagory, I.A.; Nosair, A.M.; Kuriqi, A.; Garrote, L.; Ahmed, A.A. Optimizing Irrigation Systems for Water Efficiency and Groundwater Sustainability in the Coastal Nile Delta. Agric. Water Manag. 2024, 304, 109064. [Google Scholar] [CrossRef]
  12. Cantelon, J.A.; Guimond, J.A.; Robinson, C.E.; Michael, H.A.; Kurylyk, B.L. Vertical saltwater intrusion in coastal aquifers driven by episodic flooding: A review. Water Resour. Res. 2022, 58, e2022WR032614. [Google Scholar] [CrossRef]
  13. Zhan, L.; Xin, P.; Chen, J. Subsurface salinity distribution and evolution in low-permeability coastal areas after land reclamation: Field investigation. J. Hydrol. 2022, 612, 128250. [Google Scholar] [CrossRef]
  14. Gao, S.; Zheng, T.; Zheng, X.; Walther, M. Influence of layered heterogeneity on nitrate enrichment induced by cut-off walls in coastal aquifers. J. Hydrol. 2022, 609, 127722. [Google Scholar] [CrossRef]
  15. Luyun Jr, R.; Momii, K.; Nakagawa, K. Effects of recharge wells and flow barriers on seawater intrusion. Groundwater 2011, 49, 239–249. [Google Scholar] [CrossRef]
  16. Gao, S.; Zheng, T.; Wang, X.; Zheng, X.; Qin, C.; Liang, X.; Lu, C. Submarine groundwater discharge and its components in response to negative hydraulic barriers. J. Hydrol. 2024, 631, 130744. [Google Scholar] [CrossRef]
  17. Gao, S.; Zheng, T.; Luo, J.; Zheng, X.; Fang, Y.; Walther, M. Joint assessment of the behavior of nitrate and saltwater intrusion within negative hydraulic barrier setups. Water Resour. Res. 2025, 61, e2024WR039047. [Google Scholar] [CrossRef]
  18. Stein, S.; Sivan, O.; Yechieli, Y.; Kasher, R.; Nir, O. An advantage for desalination of coastal saline groundwater over seawater in view of boron removal requirements. Environ. Sci. Water Res. Technol. 2021, 7, 2241–2254. [Google Scholar] [CrossRef]
  19. Sola, F.; Vallejos, A.; Lopez-Geta, J.A.; Pulido-Bosch, A. The role of aquifer media in improving the quality of seawater feed to desalination plants. Water Resour. Manag. 2013, 27, 1377–1392. [Google Scholar] [CrossRef]
  20. Mahesha, A. Control of seawater intrusion through injection-extraction well system. J. Irrig. Drain. Eng. 1996, 122, 314–317. [Google Scholar] [CrossRef]
  21. Pool, M.; Carrera, J. Dynamics of negative hydraulic barriers to prevent seawater intrusion. Hydrogeol. J. 2010, 18, 95–105. [Google Scholar] [CrossRef]
  22. Zheng, T.; Yuan, F.; Gao, S.; Zheng, X.; Liu, T.; Luo, J. The impact of hydraulic conductivity anisotropy on the effectiveness of subsurface dam. J. Hydrol. 2023, 626, 130360. [Google Scholar] [CrossRef]
  23. Abarca, E.; Carrera, J.; Sánchez-Vila, X.; Dentz, M. Anisotropic dispersive Henry problem. Adv. Water Resour. 2007, 30, 913–926. [Google Scholar] [CrossRef]
  24. Michael, H.A.; Russoniello, C.J.; Byron, L.A. Global assessment of vulnerability to sea-level rise in topography-limited and recharge-limited coastal groundwater systems. Water Resour. Res. 2013, 49, 2228–2240. [Google Scholar] [CrossRef]
  25. Fang, Y.; Qian, J.; Zheng, T.; Wang, H.; Zheng, X.; Walther, M. Submarine groundwater discharge in response to the construction of subsurface physical barriers in coastal aquifers. J. Hydrol. 2023, 617, 129010. [Google Scholar] [CrossRef]
  26. Stein, S.; Yechieli, Y.; Shalev, E.; Kasher, R.; Sivan, O. The effect of pumping saline groundwater for desalination on the fresh-saline water interface dynamics. Water Res. 2019, 156, 46–57. [Google Scholar] [CrossRef] [PubMed]
  27. Wu, H.; Lu, C. Seasonal fluctuations in the groundwater level accelerate the removal of residual saltwater upstream of subsurface dams. J. Hydrol. 2023, 625, 130026. [Google Scholar] [CrossRef]
  28. Voss, C.I.; Souza, W.R. Variable density flow and solute transport simulation of regional aquifers containing a narrow freshwater-saltwater transition zone. Water Resour. Res. 1987, 23, 1851–1866. [Google Scholar] [CrossRef]
  29. Wang, H.; Cao, H.; Yang, L. Machine learning-driven multidomain nanomaterial design: From bibliometric analysis to applications. ACS Appl. Nano Mater. 2024, 7, 26579–26600. [Google Scholar] [CrossRef]
  30. Zeng, X.; Dong, J.; Wang, D.; Wu, J.; Zhu, X.; Xu, S.; Zheng, X.; Xin, J. Identifying key factors of the seawater intrusion model of Dagu river basin, Jiaozhou Bay. Environ. Res. 2018, 165, 425–430. [Google Scholar] [CrossRef]
  31. Filippis GDe Giudici, M.; Margiotta, S. Conceptualization and characterization of a coastal multi-layered aquifer system in the Taranto Gulf (Southern Italy). Environ. Earth Sci. 2016, 75, 686. [Google Scholar] [CrossRef]
Figure 1. Schematic diagram of a three-dimensional site-scale conceptual model of a coastal aquifer. The left side represents the seaward boundary, while the right side corresponds to the inland freshwater boundary. The base of the model is defined by the impermeable confining layer. The blue cylinders denote the pumping wells. The yellow rectangular area indicates the computational domain, which extends to the base of the aquifer.
Water 17 02359 g001
Figure 2. Salinity distribution within the aquifer after 0, 5, 10, and 20 years of operation of the negative hydraulic barrier comprising pumping wells with a pumping rate of 3 m3/d under isotropic (a) and anisotropic (b) conditions.
Water 17 02359 g002
Figure 3. Temporal evolution of (a) the reduction rate of the saltwater wedge in the inland aquifer behind the pumping wells (L*) and (b) the total salt removal rate (M*) under saline groundwater pumping conditions across varying anisotropy ratios (rk).
Water 17 02359 g003
Figure 4. Salinity distribution in aquifers with varying anisotropy ratios (rk = 0.6, 1, and 4) under saline groundwater pumping conditions, with all pumping wells screened at 10 m depth and pumping rates of (a) 1.5 m3/d and (b) 3 m3/d.
Water 17 02359 g004
Figure 5. (a) The reduction rate of the saltwater wedge in the inland aquifer behind the pumping wells (L*), and (b) the total salt removal rate (M*) versus pumping rates under saline groundwater pumping conditions across varying anisotropy ratios (rk).
Water 17 02359 g005
Figure 6. Salinity distribution in aquifers with varying anisotropy ratios (rk = 0.6, 1, and 4) under saline groundwater pumping conditions, with the position of the screening related to the bottom of the aquifer of (a) Hw = 0 m and (b) Hw = 10 m at a constant pumping rate of 3 m3/d. The time points shown are t = 20 years into Stage 2.
Water 17 02359 g006
Figure 7. (a) The reduction rate of the saltwater wedge in the inland aquifer behind the pumping wells (L*), and (b) the total salt removal rate (M*) versus pumping heights under saline groundwater pumping conditions across varying anisotropy ratios (rk).
Water 17 02359 g007
Table 1. Numerical simulation parameters adapted from Fang et al., 2023 [25] (a); Stein et al., 2019 [26] (b); Gao et al., 2024 [16] (c); and Wu and Lu, 2023 [27] (d).
ParametersSymbolValuesUnits
Aquifer heightH60m
Aquifer widthL400m
Aquifer Depthz60m
Porosityn0.4 a[-]
Hydraulic gradientdh/dL4.0 a[‰]
Freshwater concentrationcf0 b[g/L]
Seawater concentrationcs35 b[g/L]
Freshwater densityρf1000 c[kg/m3]
Seawater densityρs1025 c[kg/m3]
Longitudinal dispersivityαL1.00 d[m]
Transverse dispersivityαT0.1 × αL d[m]
Pumping rateQ3[m3/d]
The position of the screening related to the bottom of the aquiferHw10m
Disclaimer/Publisher’s Note: The statements, opinions and data contained in all publications are solely those of the individual author(s) and contributor(s) and not of MDPI and/or the editor(s). MDPI and/or the editor(s) disclaim responsibility for any injury to people or property resulting from any ideas, methods, instructions or products referred to in the content.