Article

Assessing Hydropower Impacts on Flood and Drought Hazards in the Lancang–Mekong River Using CNN-LSTM Machine Learning

1
China Renewable Energy Engineering Institute, Beijing 100120, China
2
Ecosystem Study Commission for International Rivers, China Society for Hydropower Engineering, Beijing 100120, China
3
College of Water Science, Beijing Normal University, Beijing 100875, China
*
Author to whom correspondence should be addressed.
These authors contributed equally to this work.
Water 2025, 17(15), 2352; https://doi.org/10.3390/w17152352
Submission received: 24 June 2025 / Revised: 23 July 2025 / Accepted: 6 August 2025 / Published: 7 August 2025
(This article belongs to the Section Water and Climate Change)

Abstract

The efficient and rational development of hydropower in the Lancang–Mekong River Basin can promote green energy transition, reduce carbon emissions, prevent and mitigate flood and drought disasters, and ensure the sustainable development of the entire basin. In this study, based on publicly available hydrometeorological observation data and satellite remote sensing monitoring data from 2001 to 2020, a machine learning model of the Lancang–Mekong Basin was developed to reconstruct the basin’s hydrological processes, and identify the occurrence patterns and influencing mechanisms of water-related hazards. The results show that, against the background of climate change, the Lancang–Mekong Basin is affected by the increasing frequency and intensity of extreme precipitation events. In particular, Rx1day, Rx5day, R10mm, and R95p (extreme precipitation indicators determined by the World Meteorological Organization’s Expert Group on Climate Change Monitoring and Extreme Climate Events) in the northwestern part of the Mekong River Basin show upward trends, with the average maximum daily rainfall increasing by 1.8 mm/year and the total extreme precipitation increasing by 18 mm/year on average. The risks of flood and drought disasters will continue to rise. The flood peak period is mainly concentrated in August and September, with the annual maximum flood peak ranging from 5600 to 8500 m3/s. The Stung Treng Station exhibits longer drought duration, greater severity, and higher peak intensity than the Chiang Saen and Pakse Stations. At the Pakse Station, climate change and hydropower development have altered the non-drought proportion by −12.50% and +15.90%, respectively. For the Chiang Saen Station, the fragmentation degree of the drought index time series under the baseline, naturalized, and hydropower development scenarios is 0.901, 1.16, and 0.775, respectively. These results indicate that hydropower development has effectively reduced the frequency of rapid drought–flood transitions within the basin, thereby alleviating pressure on drought management efforts. The regulatory role of the cascade reservoirs in the Lancang River can mitigate risks posed by climate change, weaken adverse effects, reduce flood peak flows, alleviate hydrological droughts in the dry season, and decrease flash drought–flood transitions in the basin. The research findings can enable basin managers to proactively address climate change, develop science-based technical pathways for hydropower dispatch, and formulate adaptive disaster prevention and mitigation strategies.

1. Introduction

In recent years, against the background of global climate change, remarkable changes have taken place regarding the meteorological and hydrological elements of the Lancang–Mekong River Basin [1]. Temperatures continue to rise, with anomalous variability in precipitation patterns. The frequency and intensity of extreme precipitation events exhibit increasing trends [2], substantially amplifying drought risks. These developments pose formidable challenges to water resource management, agricultural irrigation, and ecosystem stability. The accelerated melting of glaciers in the upstream mountainous areas [3], combined with rising sea levels and changing rainfall patterns in the Mekong River Delta region downstream, means that flood disasters have become more frequent and severe [4,5], posing a huge threat to local agricultural production, the safety of residents’ lives and property, and urban infrastructure [6]. Hydropower development, as an important renewable energy source, not only helps reduce carbon emissions but also regulates downstream runoff through reservoir operation to mitigate flood and drought risks. For example, Ishankha W C A et al. [7] used a machine learning model to evaluate the regulatory effect of cascade dams on downstream runoff. The results showed that hydropower dispatch significantly alters the propagation path of droughts, reducing the duration of downstream droughts by 20%, and the contribution rate of reservoir operations to drought characteristics was 23–28%. Cheng H et al. [8] conducted a simulation study on reservoir operation using a hydrological model to evaluate the regulatory capacity of the Three Gorges Reservoir. The results showed that the Three Gorges Reservoir effectively alleviates downstream drought issues by increasing discharge during the dry season, but its regulatory capacity decreases under long-term drought scenarios. Yun X et al. [9] combined a variable infiltration capacity hydrological model with a reservoir operation module to quantify the impacts of climate change and reservoir operations on floods and hydropower generation. The results showed that adaptive reservoir operation can reduce flood intensity by 5.6% to 6.4% and decrease flood frequency by 17.1% to 18.9%, but it may lead to a 9.8% to 14.4% reduction in basin-wide hydropower generation. However, traditional hydrological models, which rely on historical climate data and simplified process parameterization, have limitations in accurately predicting future hydrological runoff under significant warming scenarios. In contrast, machine learning models can learn from large data sequences and capture temporal dependencies [10]. Most existing machine learning studies focus on a single basin, lacking cross-basin comparisons and inadequate characterization of the dynamic response mechanisms of reservoir operation rules. Existing studies only discuss the impact of hydropower development on droughts or floods in isolation, lacking research on the linkage between flood and drought hazards.
The Lancang–Mekong River Basin, as a key link connecting China and Southeast Asian countries, plays a vital role in regional water resource security, ecological balance, and socioeconomic development [11]. Hydropower development in this basin not only provides clean energy for various countries and strongly promotes the progress of related industries, but also plays a positive role in addressing the global green energy transition and reducing carbon emissions [12]. Scientific and rational development of hydropower resources in the Lancang–Mekong River Basin can effectively regulate the spatial–temporal distribution of water resources, demonstrating significant effects in reducing flood peak flows [13], alleviating dry-season droughts [14], and decreasing abrupt drought–flood transitions [15], thus carrying far-reaching significance for the sustainable development of the entire basin [16]. However, the international community has always had controversies over the environmental impacts brought by hydropower development in this basin, and the potential impacts on downstream hydrological regimes and ecosystems have become a focal issue of great concern in regional water resource management and international cooperation [17]. Against this backdrop, deeply exploring the impact mechanisms of hydropower development in the Lancang River on the flood and drought hazards in the Mekong River, evaluating its role in hazard prevention and mitigation, and then formulating scientific and effective response strategies have become an urgent priority [18]. Therefore, this study, based on publicly available hydrometeorological observation data and satellite remote sensing monitoring data, constructs a Convolutional Neural Network–Long Short-Term Memory (CNN-LSTM) model that reconstructs the basin’s hydrological processes, and comprehensively reveals the impact of hydropower development in the Lancang River on flood and drought disasters in the downstream Mekong River. This study aims to provide scientific guidance for accurately evaluating the comprehensive benefits of hydropower development in the Lancang River, proactively addressing climate change, scientifically formulating hydropower dispatch technical routes and disaster prevention and mitigation strategies, promoting water resource cooperation among countries in the Lancang–Mekong River Basin, and ensuring the ecological security and sustainable development of the entire basin.

2. Study Area

The Lancang–Mekong River Basin spans latitudes of 21°30′ N to 32°40′ N and longitudes of 94° E to 101°50′ E. The Lancang–Mekong River is an important transboundary river originating from the Tanggula Mountains in Qinghai Province, China. It flows through Myanmar, Laos, Thailand, Cambodia, and Vietnam, eventually emptying into the South China Sea near Ho Chi Minh City, Vietnam. The basin features significant topographic variations, with elevations ranging from 6292 m in the northwest to 0 m in the southeast. Climatically the Lancang–Mekong Basin is strongly influenced by the Indian summer monsoon, the East Asian monsoon, tropical cyclones, and the El Niño–Southern Oscillation (ENSO) [17]. The diverse climate types and geographical environments result in distinct latitudinal and vertical zonation of vegetation, including alpine vegetation, meadows, shrubs, coniferous forests, mixed coniferous and broadleaf forests, broadleaf forests, cultivated vegetation, and swamps. Precipitation and temperature generally increase from north to south. The source region (southern Qinghai) experiences a high-altitude cold climate, which is characterized by low temperatures and low precipitation, with an average annual temperature of −3 to 3 °C, a warmest month average temperature of 6 to 12 °C, and annual precipitation of 400 to 800 mm. Hydrologically, the Lancang–Mekong River has a total length of 4880 km and a drainage area of 810,000 km2. The total drop of the main stream is approximately 5060 m, with an average gradient of 1.04%. The average annual runoff at the river mouth is 475 billion m3, with most of the water coming from rainy season precipitation. The basin is rich in water resources, but they are unevenly distributed. Due to the strong data reliability, complete wet–dry variation cycles, and the good representativeness of Chiang Saen Station, Pakse Station, and Stung Treng Station, these three hydrological stations were selected for the research in this study. Located in Thailand, Chiang Saen Station is the first flow control station outside China’s border, with a control area of 189,800 km2. The flow process of this station can represent the variation of water discharge from China, providing valuable original data for runoff analysis before and after reservoir construction. As representative control stations on the main stream of the Lancang–Mekong River, the Pakse and Stung Treng Stations have control areas of 545,000 km2 and 635,000 km2, respectively. Because they have long data sequences and are located at the junctions of sub-basins, they can effectively reflect the impact of upstream reservoir operations on the runoff in the middle and lower reaches of the basin. An overview of the study basin is shown in Figure 1.

3. Materials and Methods

3.1. Data Sources

Extensive multi-source data were collected to ensure comprehensiveness and accuracy. Meteorological data were primarily obtained from the CRU dataset (1982–2020, 0.5°, monthly scale) of the UK Atmospheric Science Data Centre (https://crudata.uea.ac.uk/cru/data/hrg, accessed on 5 April 2025) and the CPC dataset (1979–2020, 0.5°, daily scale) of NOAA (https://psl.noaa.gov/data/gridded/data.cpc.globaltemp.html, accessed on 5 April 2025), covering key elements such as precipitation and temperature, and providing a basis for analyzing the climatic characteristics and trends of the basin. Hydrological data were obtained from the Mekong River Commission (https://www.mrcmekong.org, accessed on 5 April 2025), including the daily runoff data from the Yunjinghong, Chiang Saen, Pakse, and Stung Treng Stations from 1982 to 2020, which reflect the hydrological conditions of different regions in the basin. Evapotranspiration data were selected from the GLEAM dataset (1982–2020, 0.25°, monthly scale) (https://www.gleam.eu, accessed on 5 April 2025) and were used to study the water cycle processes. Additionally, land use data were obtained from the long-term dynamic land cover data product (GLASS-GLC, 1982–2015, 500 m, annual scale) (https://essd.copernicus.org/articles/12/1217/2020, accessed on 5 April 2025), topographic data were derived from SRTM DEM data (90 m resolution), soil data were obtained from the GLEAM soil moisture dataset (1982–2020, 0.25°, monthly scale) (https://www.gleam.eu, accessed on 5 April 2025), and vegetation data were selected from the GIMMS-3g NDVI dataset (1982–2020, 1/12°, 15-day scale) (https://daac.ornl.gov, accessed on 5 April 2025). These data collectively describe the natural geographical characteristics of the basin from different perspectives, forming the foundational dataset for the study area and providing rich information for subsequent analyses.
Extreme precipitation indices were selected from the Expert Team on Climate Change Detection and Indices (ETCCDI) [19] of the World Meteorological Organization. These indices are characterized by clear calculation concepts, strong universality, weak extremeness, low noise, and strong significance, and they can comprehensively describe the intensity, frequency, and duration of extreme temperature and precipitation events. Based on the characteristics of the basin, four indices were selected, as shown in Table 1, and they were used to describe different types of extreme precipitation: maximum 1-day precipitation (Rx1day), maximum 5-day precipitation (Rx5day), heavy rain days (R10mm), and very wet day precipitation (R95p).

3.2. Research Methods

3.2.1. Trend Analysis

The Mann–Kendall test [20] and Theil–Sen median method [21] were used to analyze the long-term trends of the precipitation elements. The Mann–Kendall trend test is a non-parametric test method that does not rely on specific data distributions and is less affected by extreme values and missing data. It constructs a time series of elements, calculates the statistic S, the variance of S, and the Z value to determine the trend of the series. If Z > 0, the series has an upward trend; if Z < 0, it has a downward trend. When |Z| > 1.96, the trend is significant at the p < 0.05 confidence level; when |Z| > 2.38, the trend is significant at the p < 0.01 confidence level. The Theil–Sen median method is a robust non-parametric method for calculating the rate of trend change, with high computational efficiency and insensitivity to measurement errors and outliers. It calculates the slope to reflect the trend of the data, as in Equation (1):
β = M e d i a n x j x i j i , j >   i
where x j and x i are data values at times (j > i), respectively, and where Median denotes the median value. A slope > 0 indicates an upward trend, while a slope < 0 indicates a downward trend. The absolute value of the slope represents the rate of trend change.

3.2.2. Mutation Analysis

The Mann–Kendall (M-K) mutation test [22] is used to detect mutation points in runoff time series data. This method is suitable for identifying discontinuous changes, such as abrupt shifts in runoff from one average value to another, which reflect the discontinuity of climate change. The trend analysis of the standard value Z is the same as the M-K trend test. When the absolute value of Z is greater than or equal to 1.96, the time series passes the significance test at the 95% confidence level. The slope is used to measure the magnitude of the trend, where a slope greater than 0 indicates an upward trend (and vice versa).
The Double Mass Curve Method [23] is a statistical method used to analyze the relationship between precipitation and hydrological elements (such as runoff, evaporation, soil moisture, etc.). This method constructs a double mass curve to visually display the changing relationship between two variables, helping researchers identify potential trends, outliers, and their mutual influences. This method is widely applied in water resource management, climate change research, and hydrological model calibration. The basic principle of the Double Mass Curve Method is to plot the cumulative values of two related variables on the same coordinate system. It is intuitive, easy to understand and interpret, capable of identifying outliers and trend changes in data, and it does not require complex mathematical models, making it widely applicable. The steps of the Double Mass Curve Method are as follows.
(1)
Data Preparation: Collect time series data for two variables. In this study, the variables were precipitation and the corresponding runoff.
(2)
Cumulative Calculation: Perform cumulative calculations for both variables to obtain cumulative value series. If precipitation is denoted as (P) and corresponding runoff as (Q), calculate the cumulative values of (P) and (Q).
(3)
Plotting the Curve: Plot the double mass curve with the cumulative precipitation on the x-axis and the cumulative runoff on the y-axis.
(4)
Curve Analysis: By observing the shape and slope changes in the double mass curve, the relationship between the two variables can be analyzed. If the curve shows a linear relationship, it indicates a stable proportional relationship between precipitation and runoff. If the curve shows significant deviations, it may suggest the influence of external factors, such as land use changes or climate change.

3.2.3. Runoff Simulation Based on Machine Learning Models

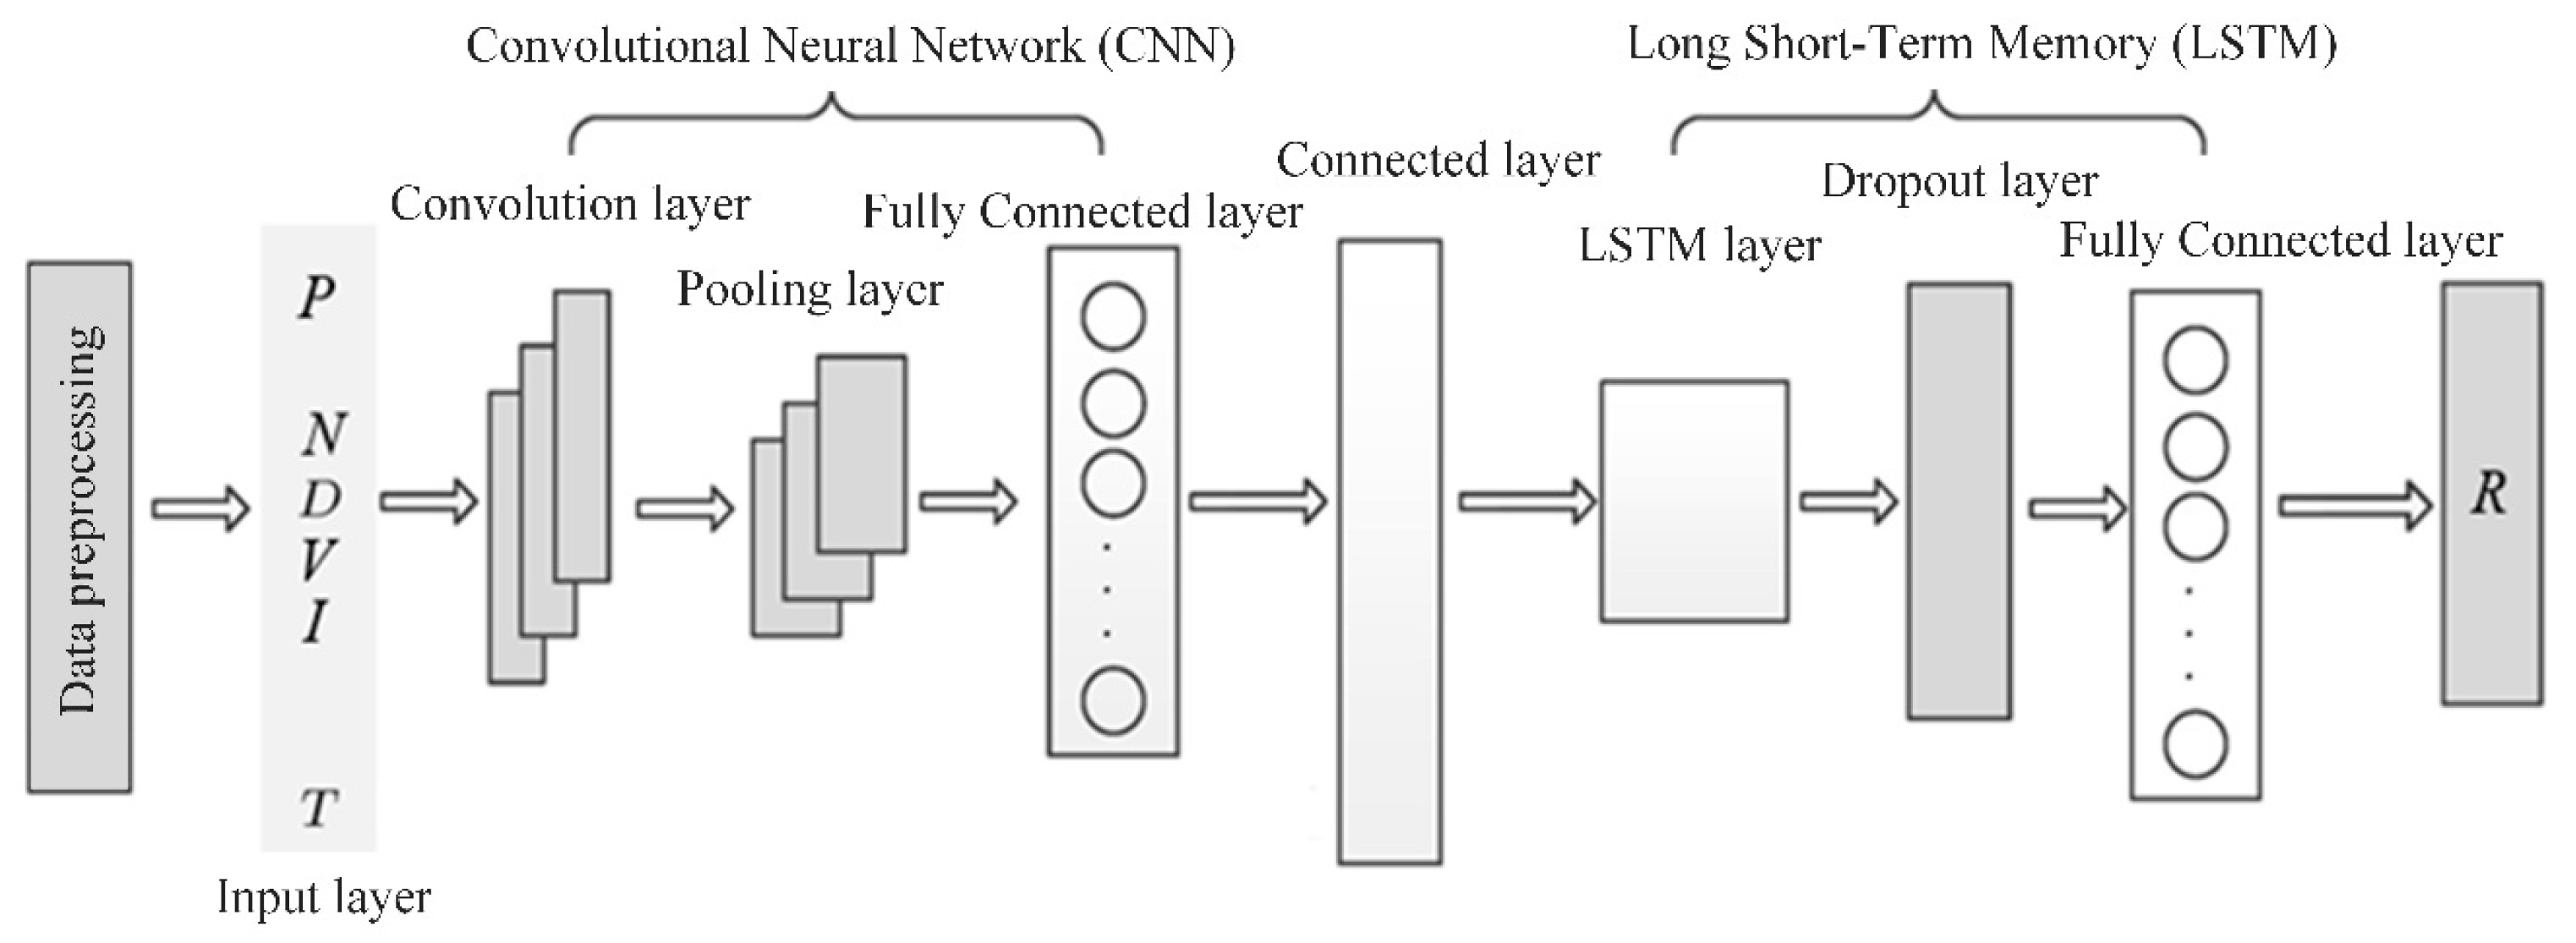
MATLAB R2024a was used to build a Convolutional Recurrent Neural Network (CNN-LSTM) model [24] to simulate and reconstruct the runoff; temperature, precipitation, and NDVI were used as inputs, and the runoff from three hydrological stations—Chiang Saen, Pakse, and Stung Treng—was analyzed as output. The research method diagram is shown in Figure 2. The model parameters were optimized using a Genetic Algorithm (GA) [25], which involves steps such as population initialization, fitness evaluation, selection, crossover, mutation, and population updating. By adjusting hyperparameters such as the number of convolutional kernels and learning rate, the model’s performance was significantly enhanced. The CNN component excels in feature extraction, while the LSTM component is adept at handling time series data. Together, they effectively captured the complex nonlinear relationships and long-term dependencies in the data. When setting parameters, the key hyperparameters influencing neural network simulation accuracy include training epochs, forget rate, kernel size, pooling size, learning rate, number of convolutional kernels, and hidden layer neurons. To address the computational inefficiency of manual trial-and-error optimization, this study employs a genetic algorithm (GA) for hyperparameter tuning. Fixed hyperparameters comprise the forget rate, convolutional kernel size, and pooling size. The optimized hyperparameters and their search ranges are as follows: (i) the learning rate was set within the range of 0.001 to 0.01; (ii) the number of convolution kernels ranged from 12 to 64; and (iii) the number of n hidden layer neurons was set between 5 and 60. The objective function minimizes the Root Mean Square Error (RMSE), with crossover and mutation probabilities set at 0.4 and 0.1, respectively. In the model design, the physical processes of runoff generation and concentration are fully considered, integrating distributed runoff generation and concentration processes. The impact of vegetation changes on runoff is also taken into account, with NDVI and temperature selected as input variables. A distributed input design was adopted, based on the HydroBASINS dataset, with hydrological stations serving as control sections [26], and the watershed was divided into eight sub-watersheds with modeling at different outlet sections to capture the spatial heterogeneity of the runoff concentration. To further quantitatively evaluate the model’s performance, three metrics are used: the correlation coefficient (R2), the Nash–Sutcliffe efficiency coefficient (NS), and the relative bias (PBIAS). The calculation methods for these metrics are as follows:
R 2 = i = 1 n Q o , i Q o ¯ Q s , i Q s ¯ 2 i = 1 n Q o , i Q o ¯ 2 i = 1 n Q s , i Q s ¯ 2
N S = 1 i = 1 n ( Q o , i Q s , i ) 2 i = 1 n ( Q o , i Q o ¯ ) 2
P B I A S = i = 1 n ( Q o , i Q s , i ) i = 1 n Q o , i × 100

3.2.4. Flood and Drought Disaster Identification

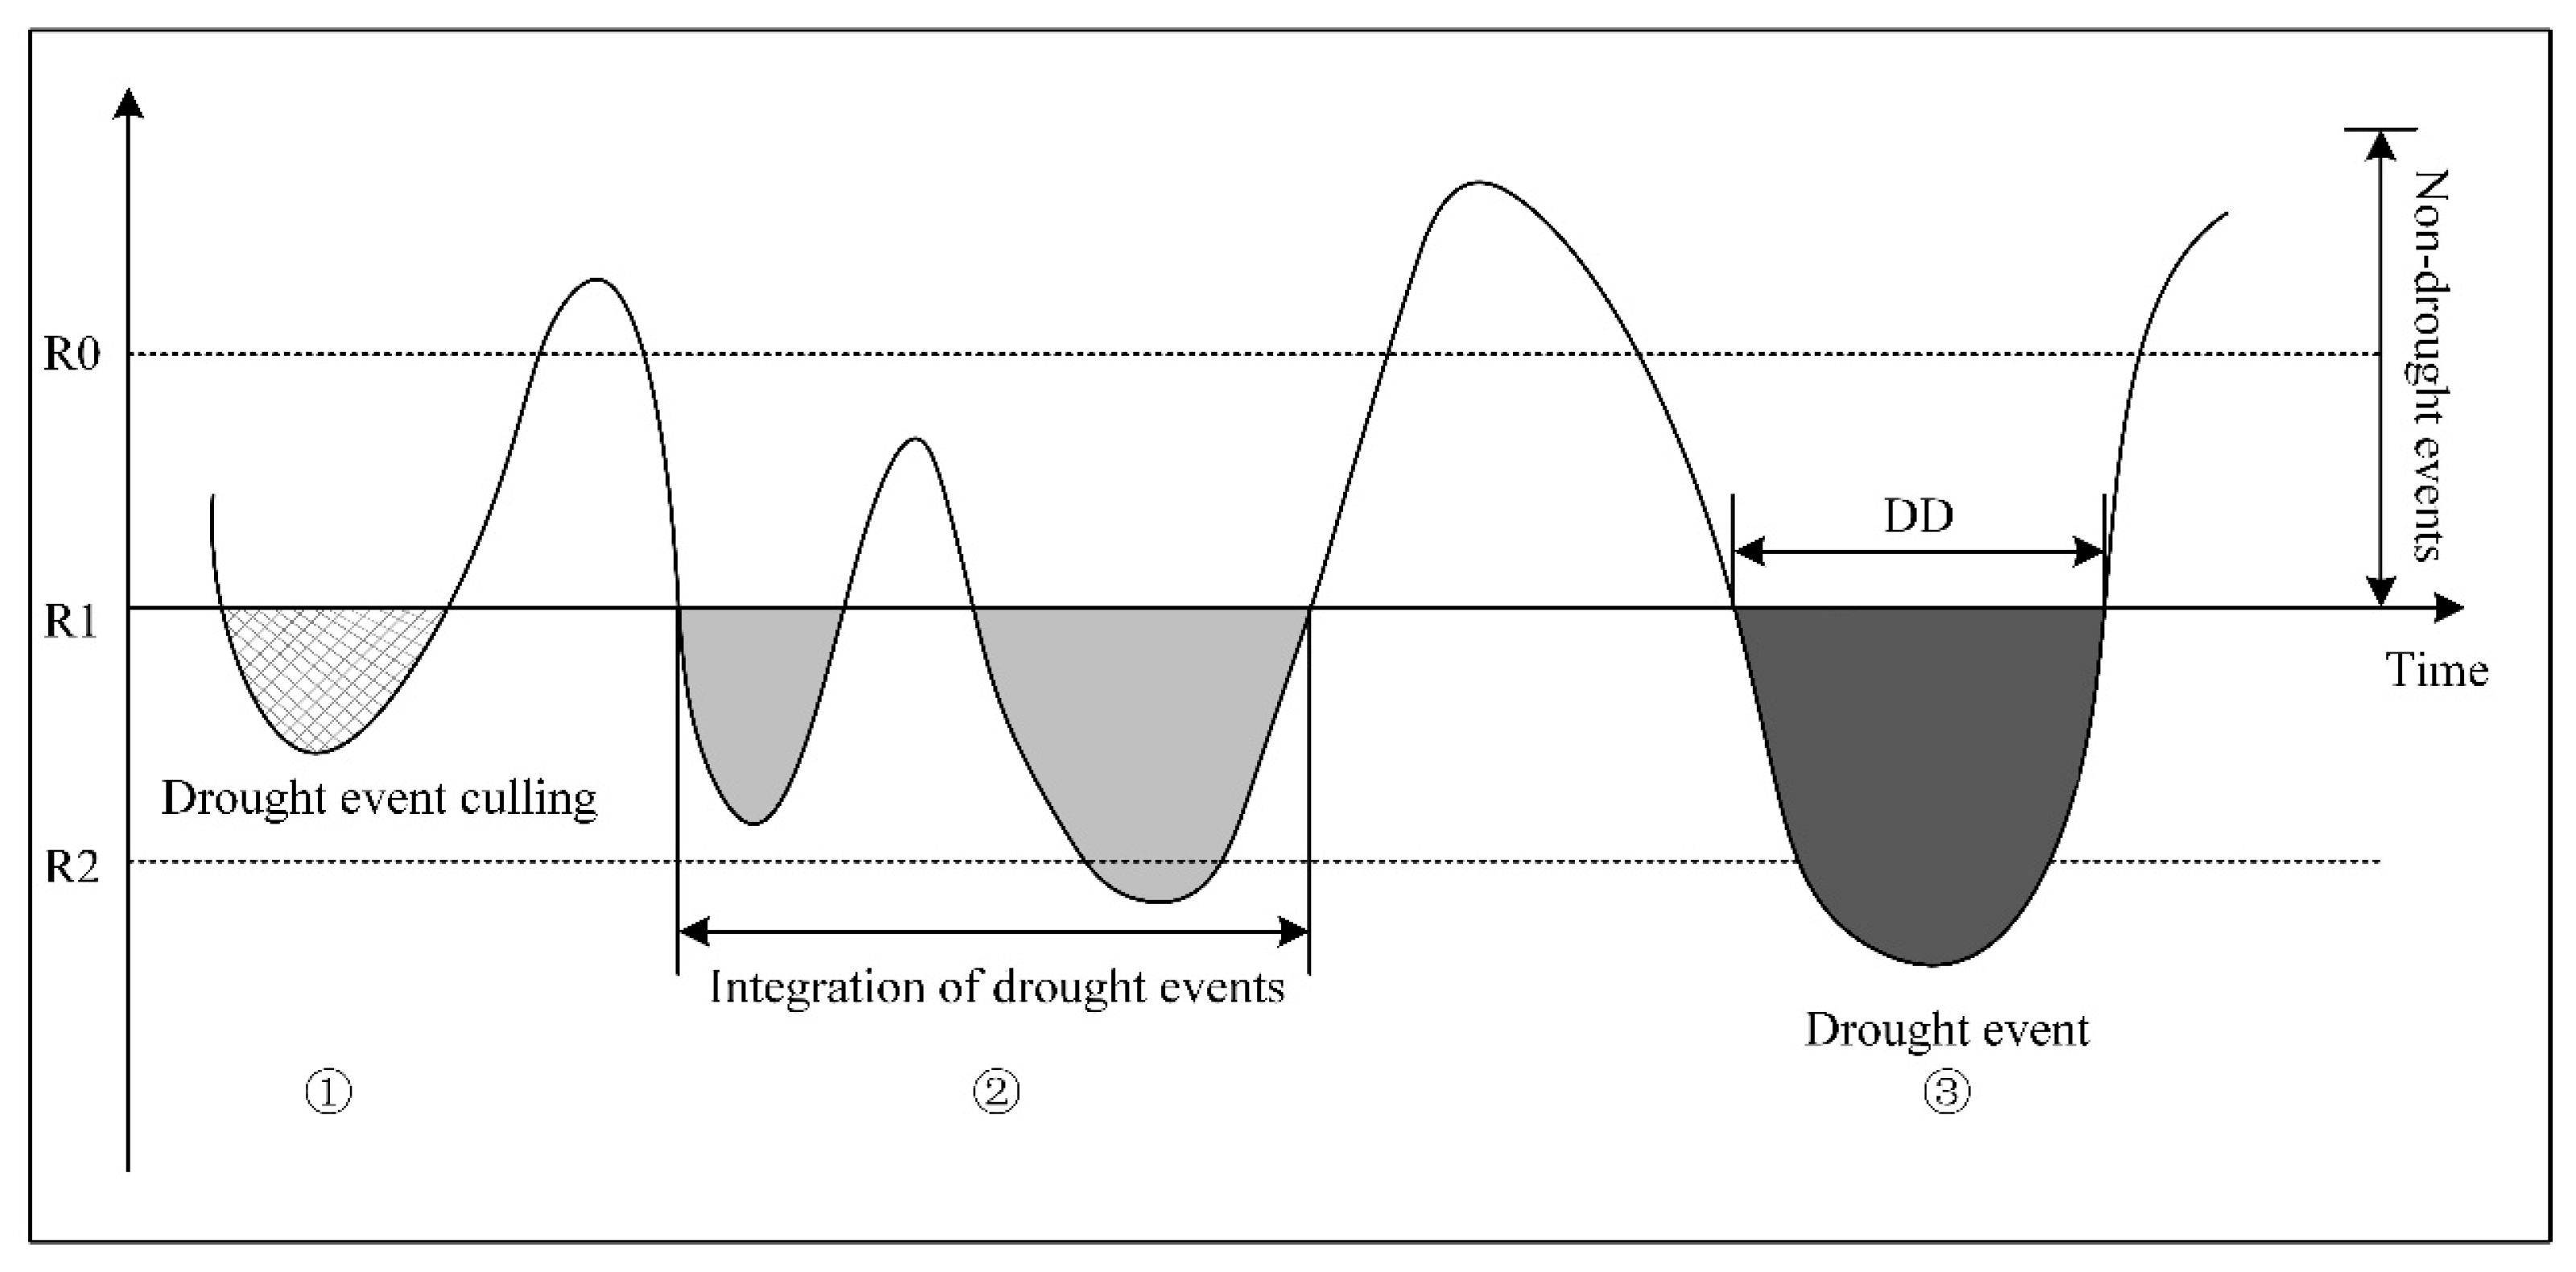
The Annual Maximum Series (AMS) method [27] was employed to identify flood disasters. This method, based on probability theory, selects the largest single event from annual rainfall or runoff records as the analysis sample. Drought events are identified using Run Theory [28] based on drought indices. When the drought index series is less than the threshold R1, it marks the beginning of a drought event; as the run progresses, when the drought index series exceeds R1, the drought event ends. Considering the characteristics of the multi-type drought evaluation carried out in this study, for ease of comparative analysis, the drought event threshold R1 was set to −0.5 for standardized indices, and to 0 for non-standardized drought indices as per relevant requirements. In practical applications, Run Theory may identify drought events with short durations and mild severity, or it could fragment a severe drought event into multiple milder ones due to short intervals, potentially underestimating the actual severity of drought events. Given the long occurrence and evolution time of drought events, the identified droughts were fused and filtered when using Run Theory for event recognition. A schematic diagram of the Run Theory is shown in Figure 3, and the specific process for identifying drought events is as follows: ① if a drought event lasts only one month and its drought index value is greater than R2, then this mild drought event is excluded; ② if the time interval between two adjacent drought events is less than one month and the drought index value of the intervening month is less than R0, then the two events are merged into one; and ③ when the drought index value is less than R1, a drought event is identified, with DD denoting the drought duration.
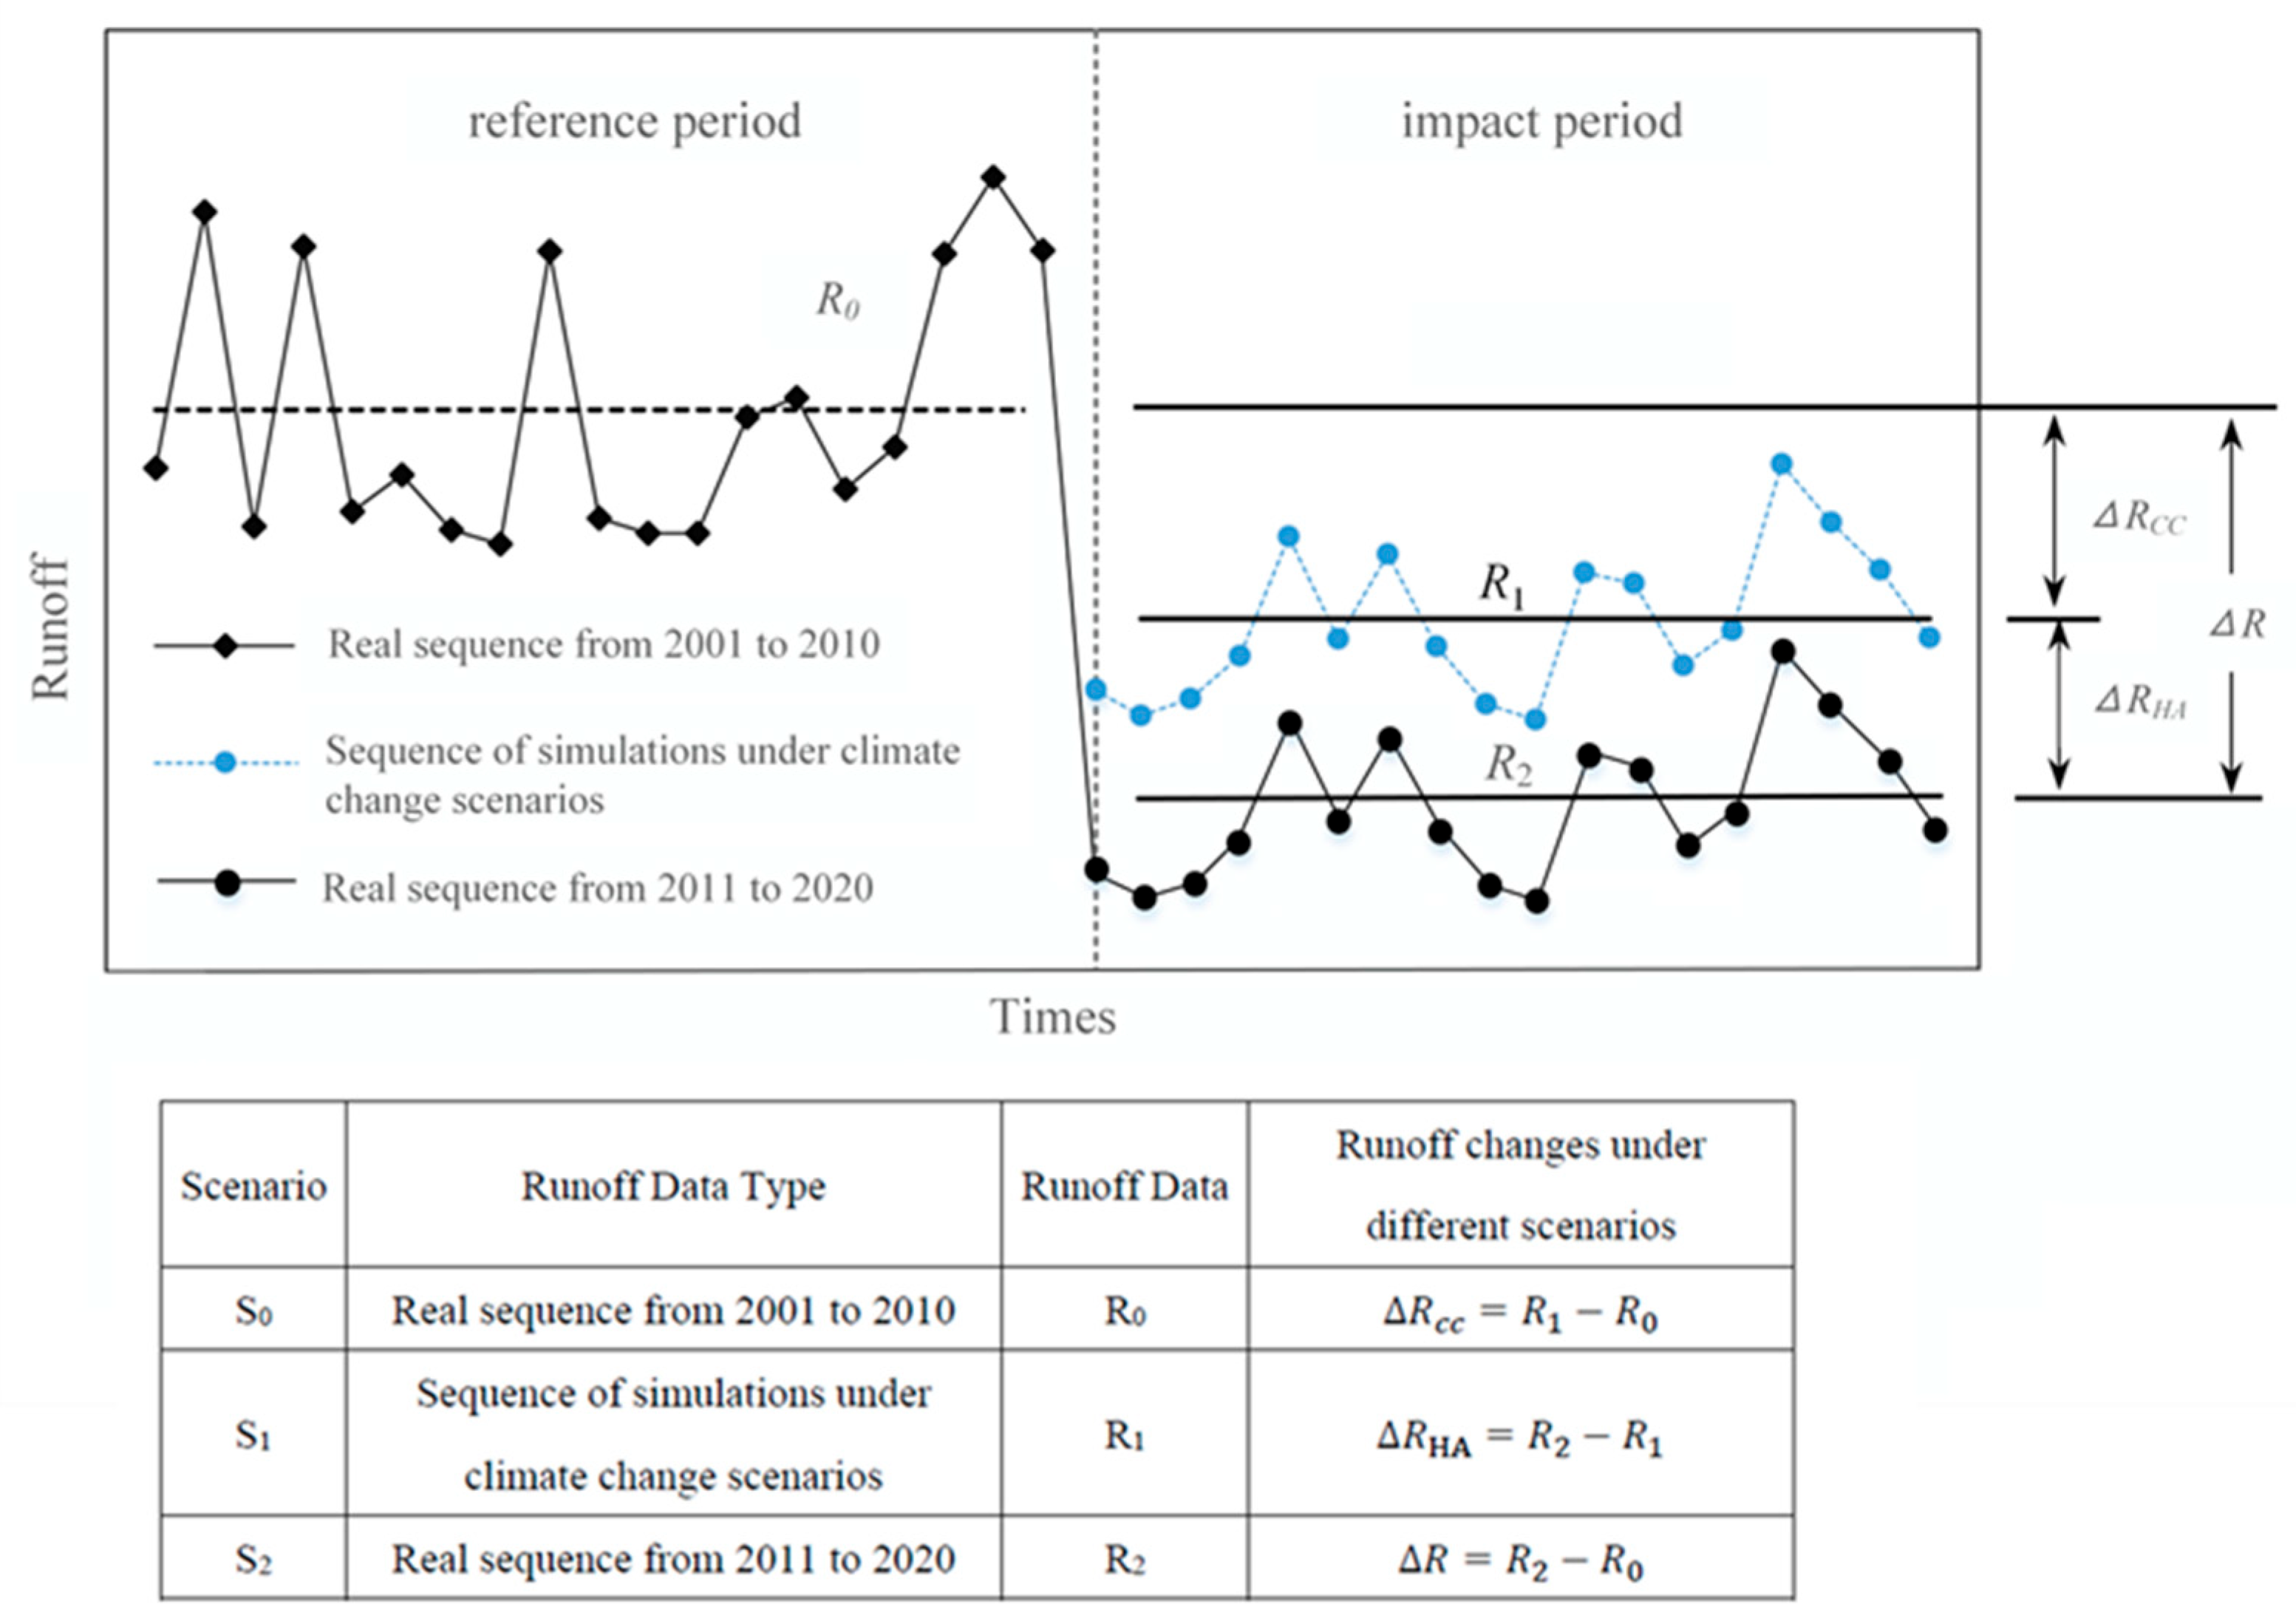
The Environmental Variable Separation Method [29] was used to investigate the impact of hydropower development on flood and drought disasters. Generally, hydrological element series (especially runoff series) are divided into the “natural phase” and “human activity impact phase” based on statistically identified change points, and they are then referred to as the “baseline period” and “impact period” [30]. In this study, 2001–2010 was defined as the baseline period and 2011–2020 as the impact period, using a calibrated CNN-LSTM model to simulate the runoff influenced solely by climate change. By setting different scenarios, hydrological element series under each scenario were calculated, quantitatively separating the impacts of climate change and human activities on the hydrological processes of the basin, and identifying the main driving factors. The designed scenarios are shown in Table 2.
The scene setting for the Variable Separation Method used in this study is shown in Figure 4. The contribution rates of each factor to changes in the basin runoff were calculated, and the runoff change caused by climate change (CC), denoted as R c c , is expressed as follows:
R c c = R 1 R 0
The total runoff change in the impact period, denoted as R , and the runoff change caused by other human activities (HA), denoted as R H A , are calculated as follows:
R = R 2 R 0
R H A = R 2 R 1
where R0, R1, and R2 represent the runoff under scenarios S0, S1, and S2, respectively.

4. Results

4.1. Runoff Restoration Simulation Results

This study selected monthly runoff data from 1982 to 2001 as the training set and data from 2002 to 2010 as the test set. Using areal precipitation, average temperature, and NDVI as independent variables, runoff training was conducted at the Chiang Saen, Pakse, and Stung Treng Stations, with simulation results shown in Figure 5 and Figure 6. The training results show a high regression correlation with observed results (above 0.93), with slopes close to 1, thus meeting the simulation accuracy requirements.
Three metrics—the correlation coefficient (R2), the Nash–Sutcliffe efficiency coefficient (NS), and relative bias (PBIAS)—were used to further quantitatively evaluate the modeling effectiveness. The simulation calculation parameters are shown in Table 3. The calibration period R2 and NS exceeded 0.84, with the R2 and NS at Pakse and Stung Treng Stations exceeding 0.9, thus indicating good calibration results. The validation period R2 and NS exceeded 0.75, passing the test.
Sensitivity analysis of the CNN-LSTM model is shown in Figure 7. Sensitivity analysis across the three Mekong stations reveals spatially varying hydrological responses: at upstream Chiang Saen, runoff exhibits strong precipitation dependence (slope = 1.25, ±30% precipitation causes ±28% runoff change) with moderate negative temperature sensitivity (−8.5% runoff at +30% temperature), while NDVI impact remains negligible (±<3%). Midstream Pakse shows intensified precipitation sensitivity (slope = 1.40, −34% runoff at −30% precipitation) and slightly enhanced NDVI influence (−5% at −30% NDVI), though temperature response mirrors that at the upstream station (−9% at +30% temperature). Downstream Stung Treng displays peak precipitation sensitivity (slope = 1.45, ~36% runoff shift at ±30% precipitation) and a reversed temperature effect (+7% runoff at +30% temperature, likely due to monsoon-driven evapotranspiration saturation), while NDVI maintains minimal control (±4%). These patterns converge with the hydrological mechanisms within the basin established by Wang S et al. [31], while model validation through rigorous testing confirms the framework’s robustness.

4.2. Analysis of Extreme Precipitation Trends

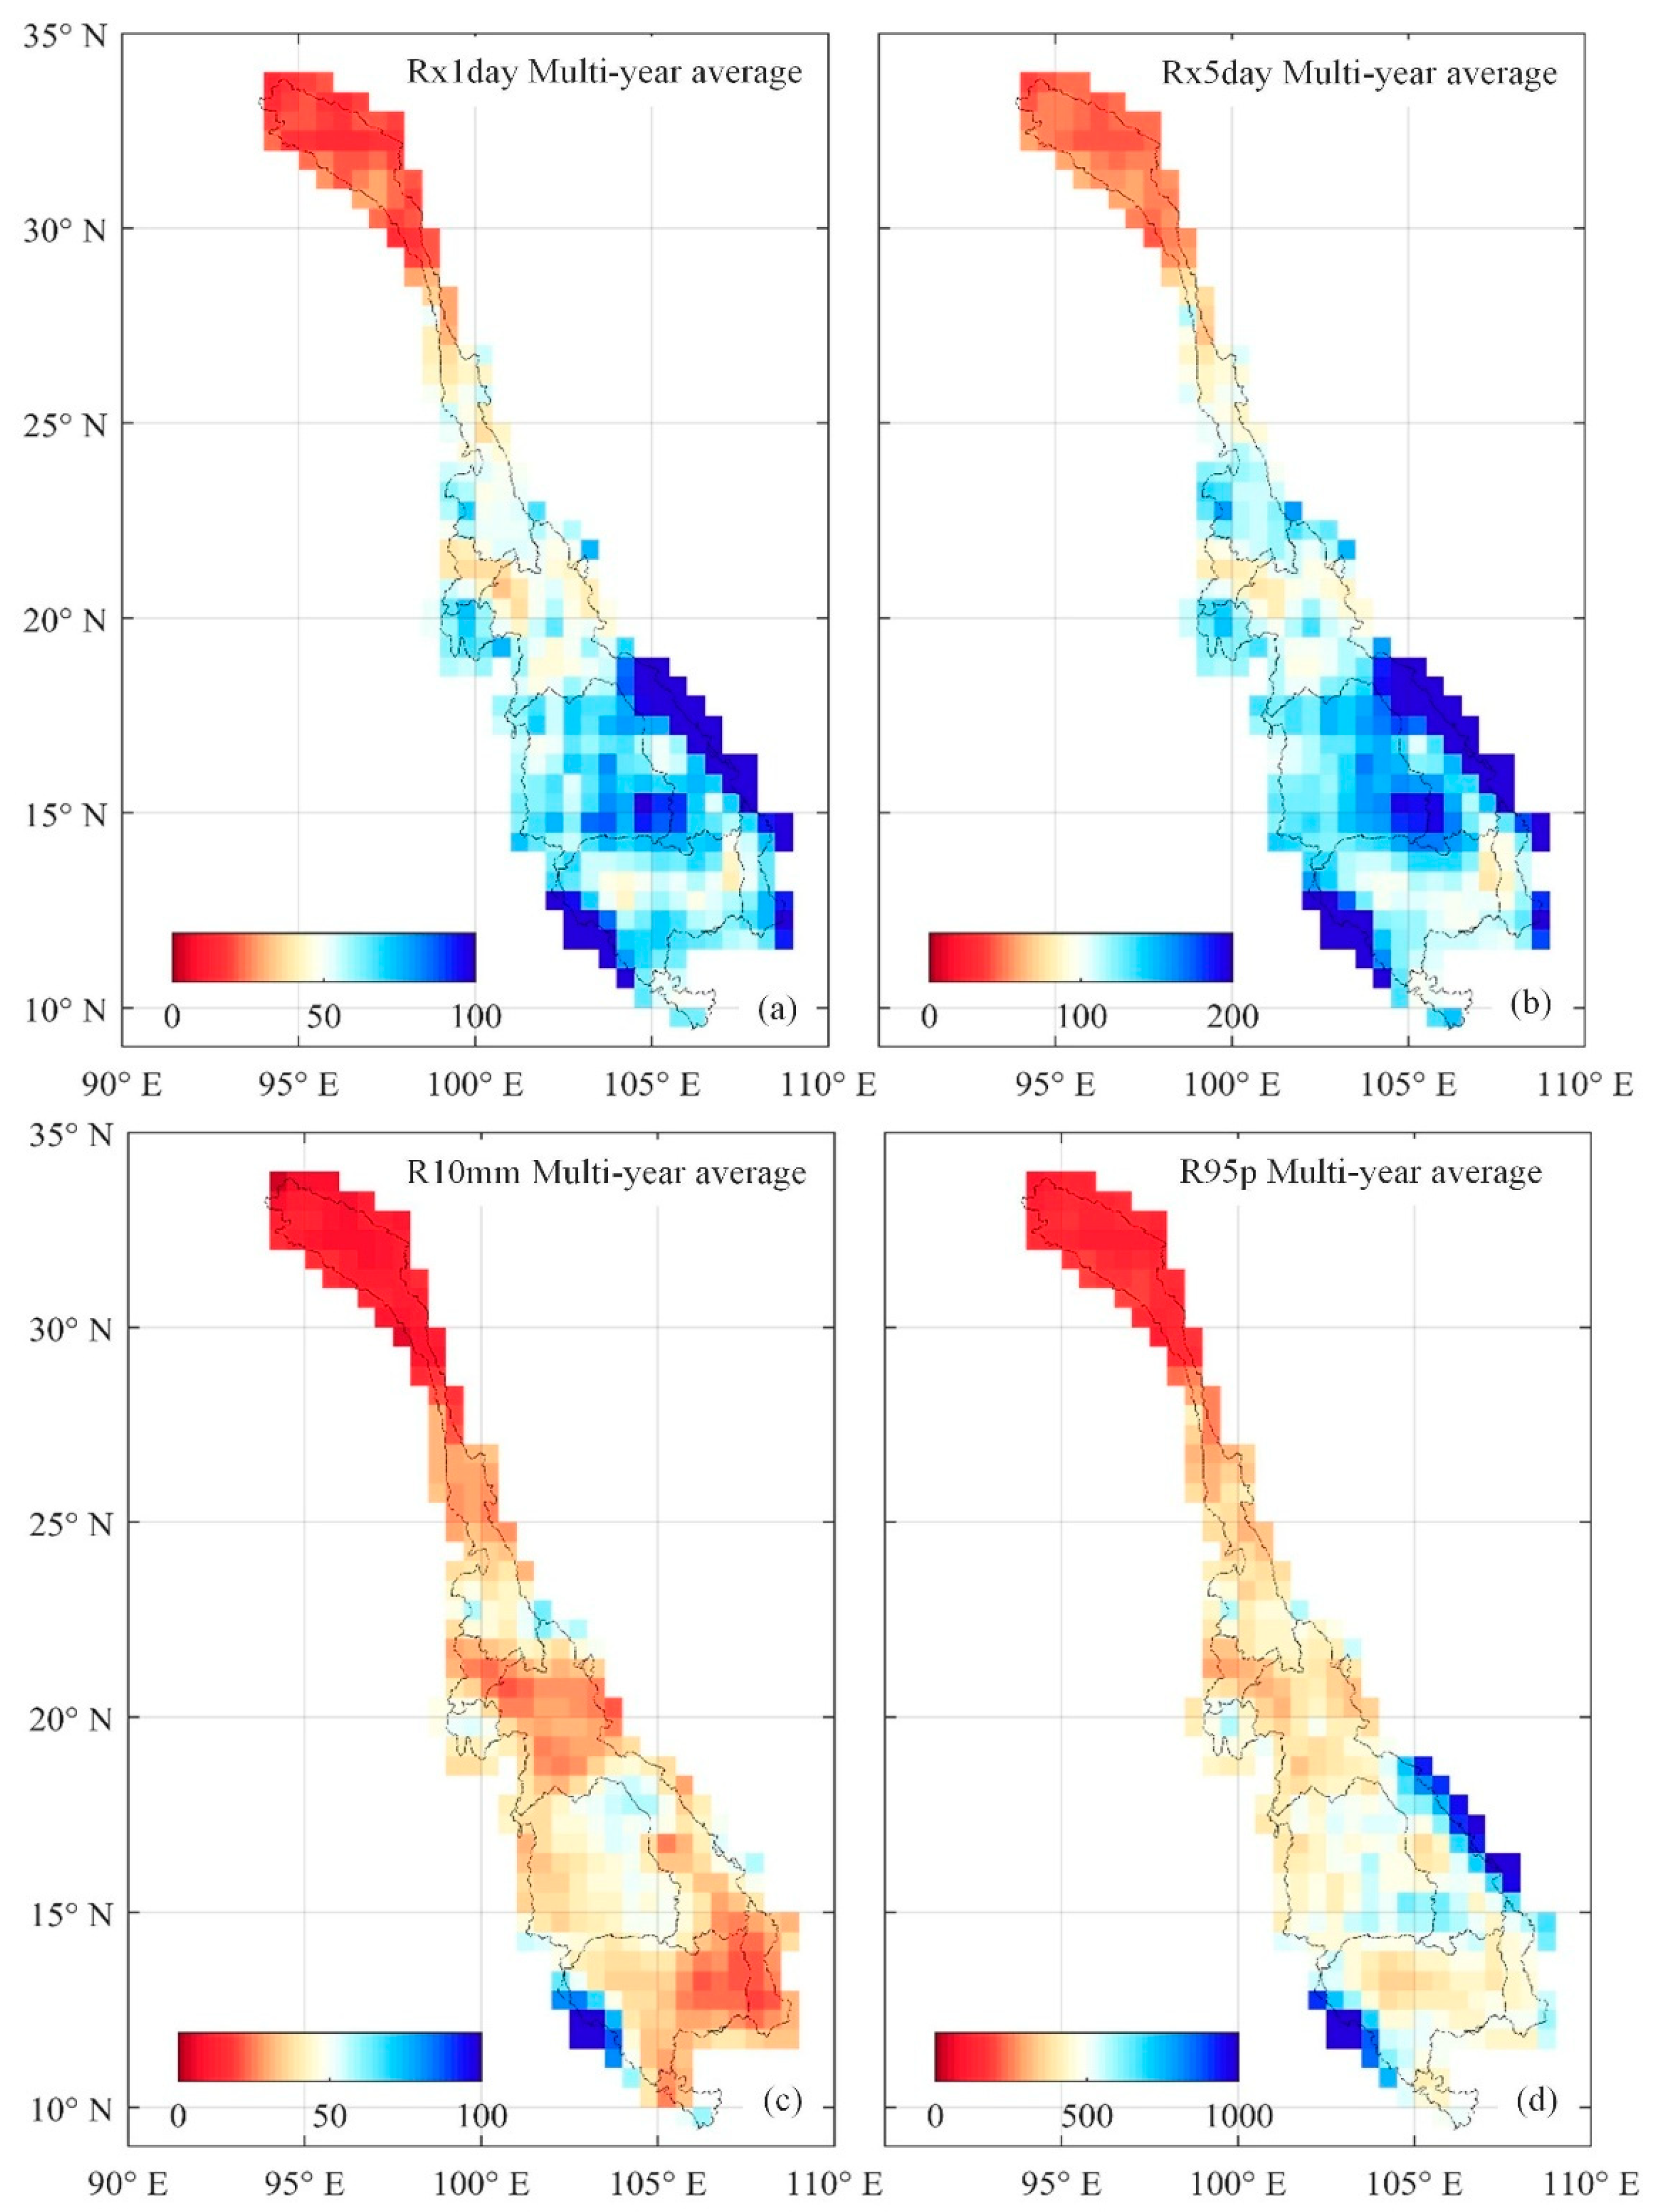
The spatial distribution of the multi-year average values of extreme precipitation indices is shown in Figure 8. Overall, the risk of extreme precipitation increases from upstream to downstream, similar to the spatial distribution of precipitation. The topography of the lower Lancang–Mekong River region differs significantly from the upstream areas. The downstream region is predominantly flat and low-lying, and it is prone to waterlogging and flooding, while the upstream region is characterized by mountains and hills, with more complex terrain. This topographical difference makes the downstream region more susceptible to heavy precipitation, leading to extreme precipitation events. Additionally, the downstream region has a more humid climate with more pronounced monsoon influences, resulting in concentrated rainfall during the rainy season, which increases the risk of extreme precipitation.
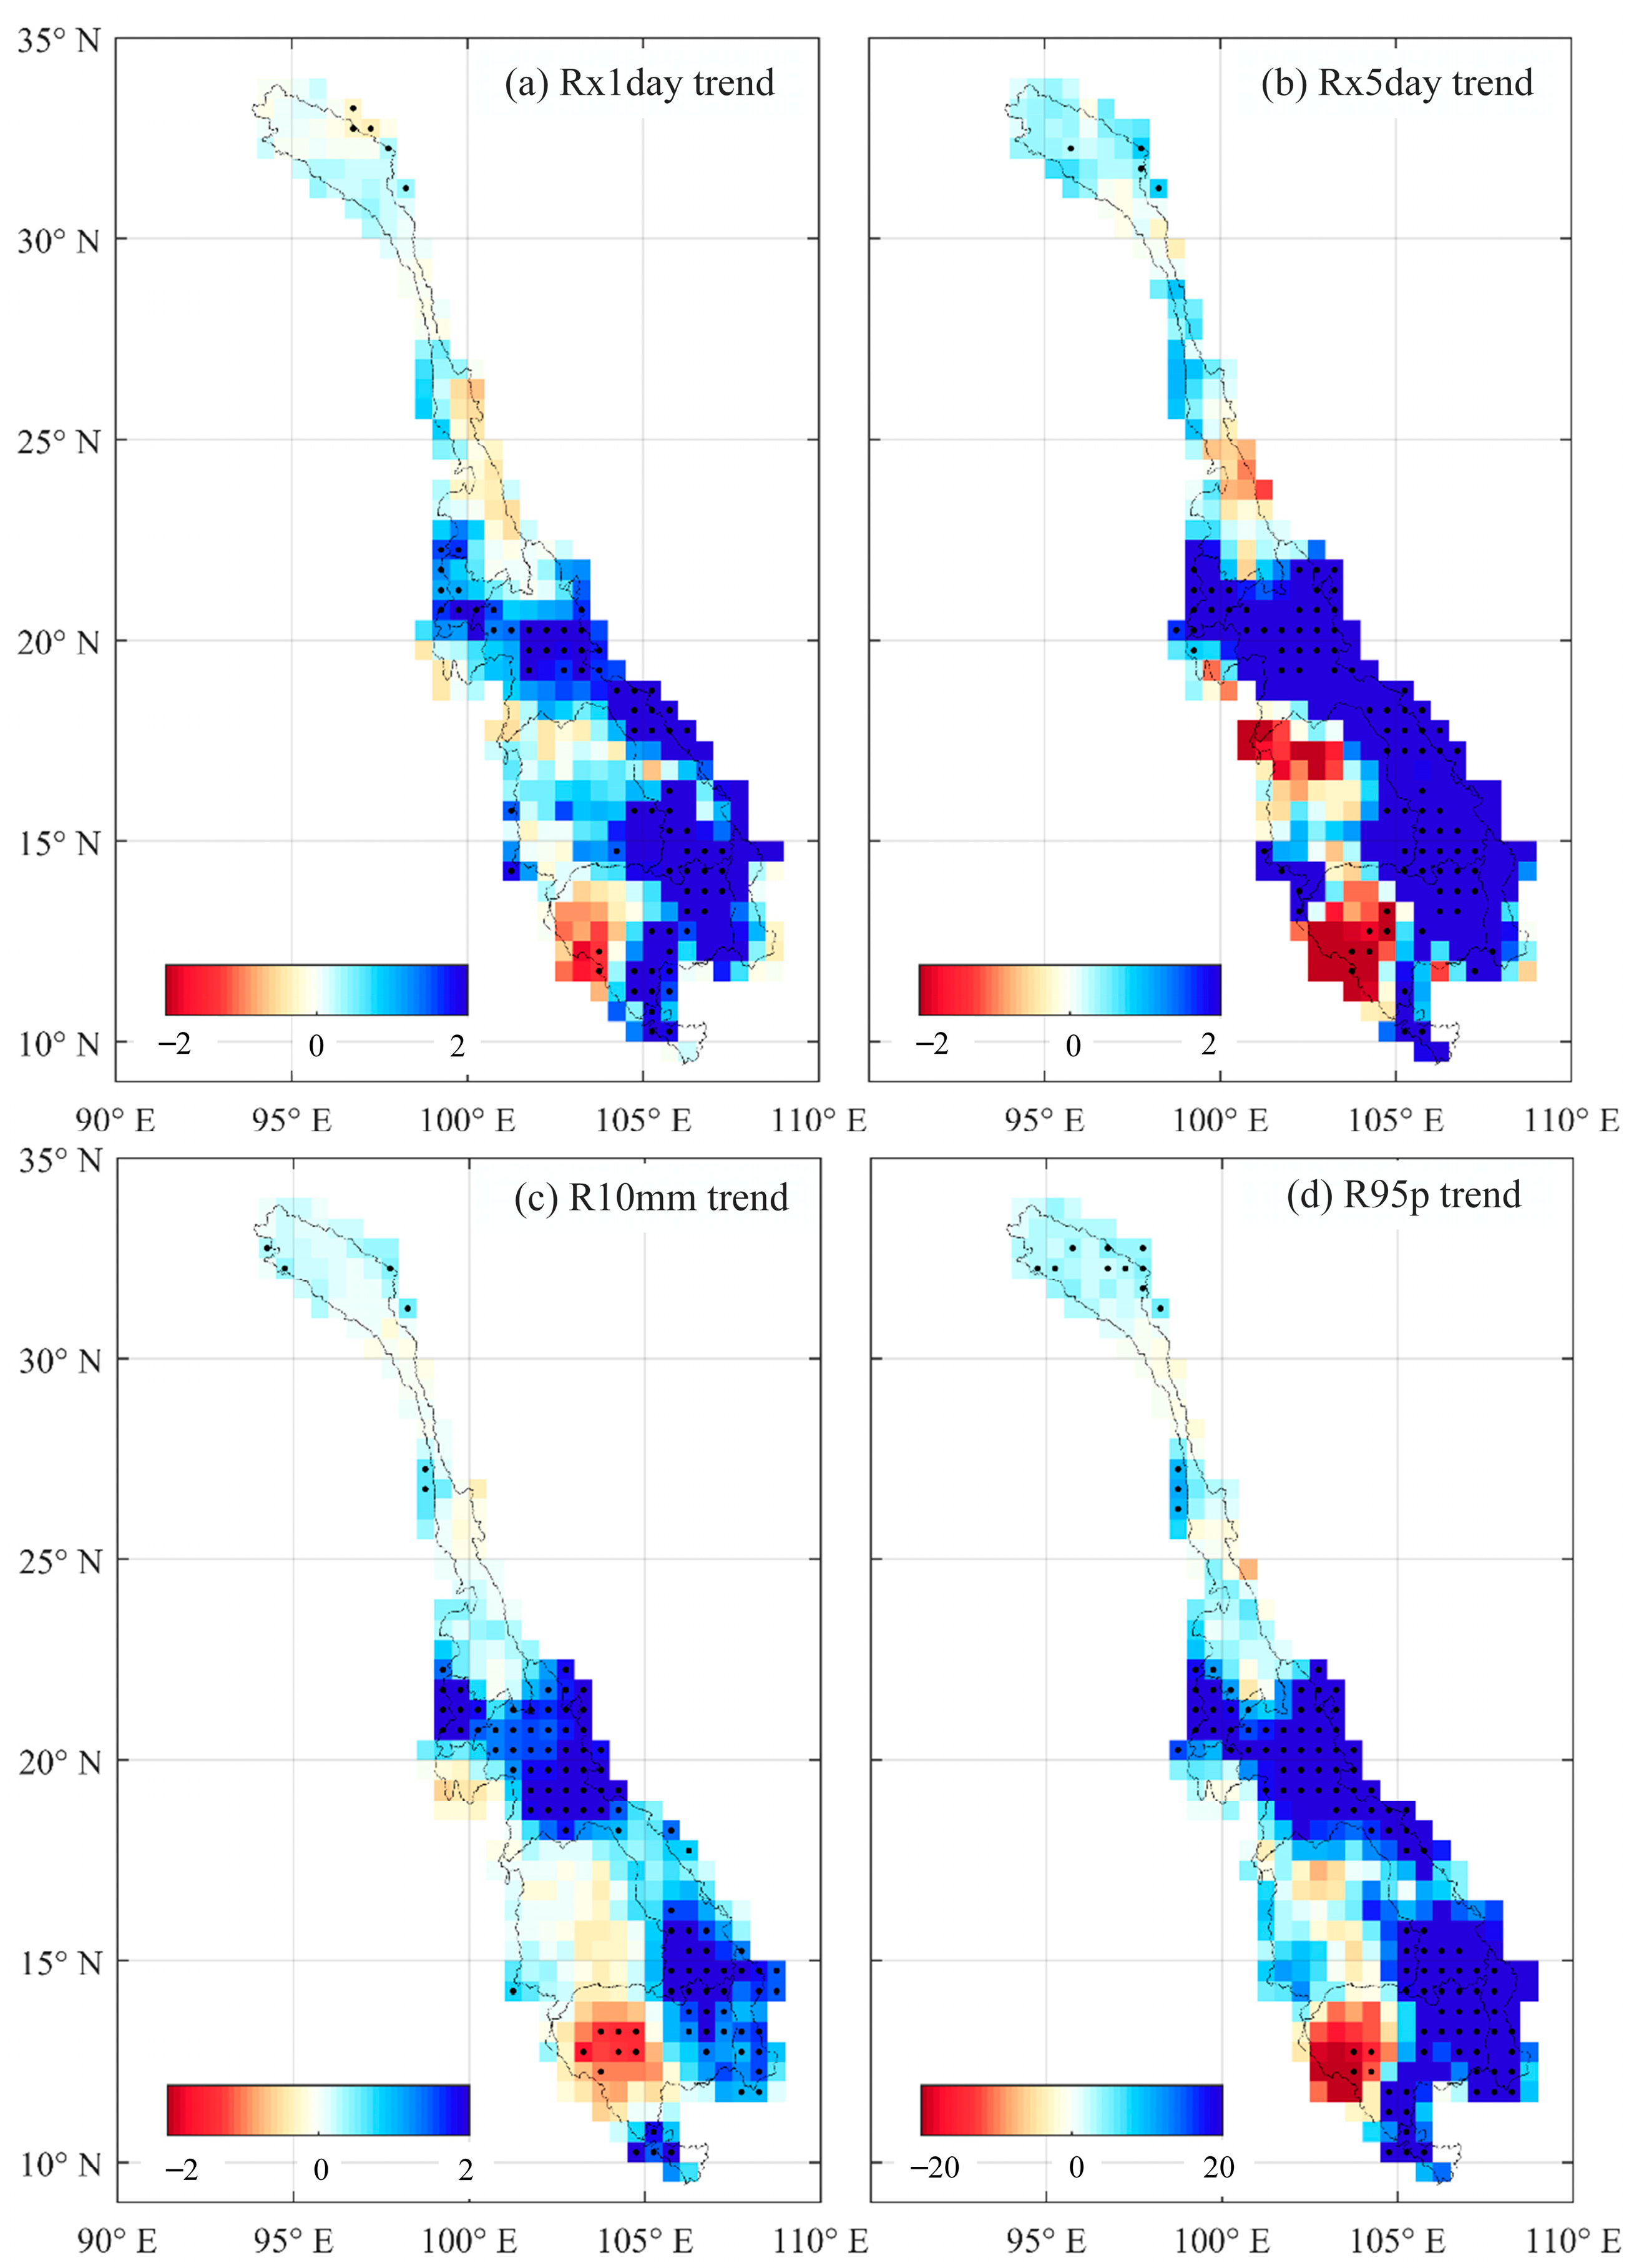
The distribution of changes in the extreme precipitation indices showed an increase in extreme precipitation downstream. The trend of extreme precipitation in the Lancang–Mekong River Basin, calculated grid by grid, is shown in Figure 9. In the Mekong River Basin, the extreme rainfall in the southwest showed a slowing trend, but most grids in the northwest showed an increasing trend in Rx1day, Rx5day, R10mm, and R95p, with the average maximum one-day rainfall increasing by 1.8 mm/a and the total extreme precipitation increasing by 18 mm/a.
Related studies indicate that one of the main reasons for the intensification of extreme precipitation in the lower Mekong River region is global climate change [32,33]. As greenhouse gas concentrations increase, rising temperatures lead to higher atmospheric water vapor content, directly affecting precipitation patterns. Climate change has significantly increased the frequency and intensity of extreme weather events, particularly in tropical and subtropical regions. The climatic characteristics of the lower Mekong River make it more susceptible to these changes, leading to an increase in extreme precipitation events. The monsoon system is a major driver of precipitation in the Mekong River Basin. Recent changes in monsoon patterns have caused fluctuations in precipitation distribution and intensity, increasing the frequency of extreme precipitation events. The intensity and duration of monsoons are influenced by global climate change, leading to concentrated rainfall in short periods, thereby resulting in extreme precipitation phenomena. These changes not only affect the timing of precipitation but also increase the probability of extreme weather events, further exacerbating the trend of extreme precipitation in the lower Mekong River.

4.3. Characteristics of Flood and Drought Hazards

In terms of flood evolution characteristics, the annual maximum 1-day flood volume is an important indicator for measuring flood intensity, which is of great significance for flood control planning and water resource management. This study evaluated the annual maximum 1-day flood volumes at Chiang Saen Station, Pakse Station, and Stung Treng Station. The maximum daily flood discharge statistics for the selected hydrological stations in the Lancang–Mekong River Basin are shown in Table 4. The results show that the flood peaks are mainly concentrated in August and September, with the annual maximum flood peak ranging from 5600 to 8500 m3/s and the median being approximately 6600 m3/s. The flood peak flows at each station showed a decreasing trend during 2001–2020. Spatially, the maximum 1-day runoff depth at Chiang Saen Station fluctuated between 1.84 mm and 13.4 mm, with the highest values in 2006 and 2008 being 13.4 mm and 6.58 mm, respectively. The maximum 1-day runoff depth at Pakse Station fluctuated between 3.55 mm and 6.95 mm, with the highest values in 2001 and 2019 being 6.71 mm and 6.95 mm, respectively. The maximum 1-day runoff depth at Stung Treng Station fluctuated between 5.14 mm and 8.40 mm, showing smaller variability. The highest and lowest values occurred in 2001 and 2005, with the maximum 1-day runoff depths being 8.40 mm and 4.54 mm, respectively.
In terms of drought evolution characteristics, this study used Run Theory to identify 18, 16, and 16 hydrological drought events at the Chiang Saen, Pakse, and Stung Treng Stations, respectively. Drought events at each station differed in terms of duration, severity, and peaks, reflecting regional disparities in drought vulnerability. The drought characteristics of the selected hydrological stations in the Lancang–Mekong River Basin are shown in Table 5. The results show that Stung Treng Station had the longest average duration of approximately 7.56 months, followed by Chiang Saen at 6.56 months and Pakse at 5.56 months. It also had the highest average severity of about 7.07, far exceeding Chiang Saen’s 4.48 and Pakse’s 4.16. The average peak at Stung Treng (1.36) was slightly higher than those of Chiang Saen (1.22) and Pakse (1.05). The station’s higher values in terms of duration, severity, and peaks indicate more severe drought challenges compared to the other two stations. The most severe drought at Chiang Saen occurred from March 2005 to April 2006, followed by the droughts from November 2006 to May 2008 and July 2013 to November 2014. Pakse’s most severe drought was the 10th event, recorded during August 2011 to August 2012, which lasted 13 months with a severity of 10.90. The eighth event at Stung Treng, from May 2009 to July 2012, was the most severe, enduring for 39 months with a severity of 35.22.

5. Discussion

5.1. Contribution of Hydropower Development to Flood Control

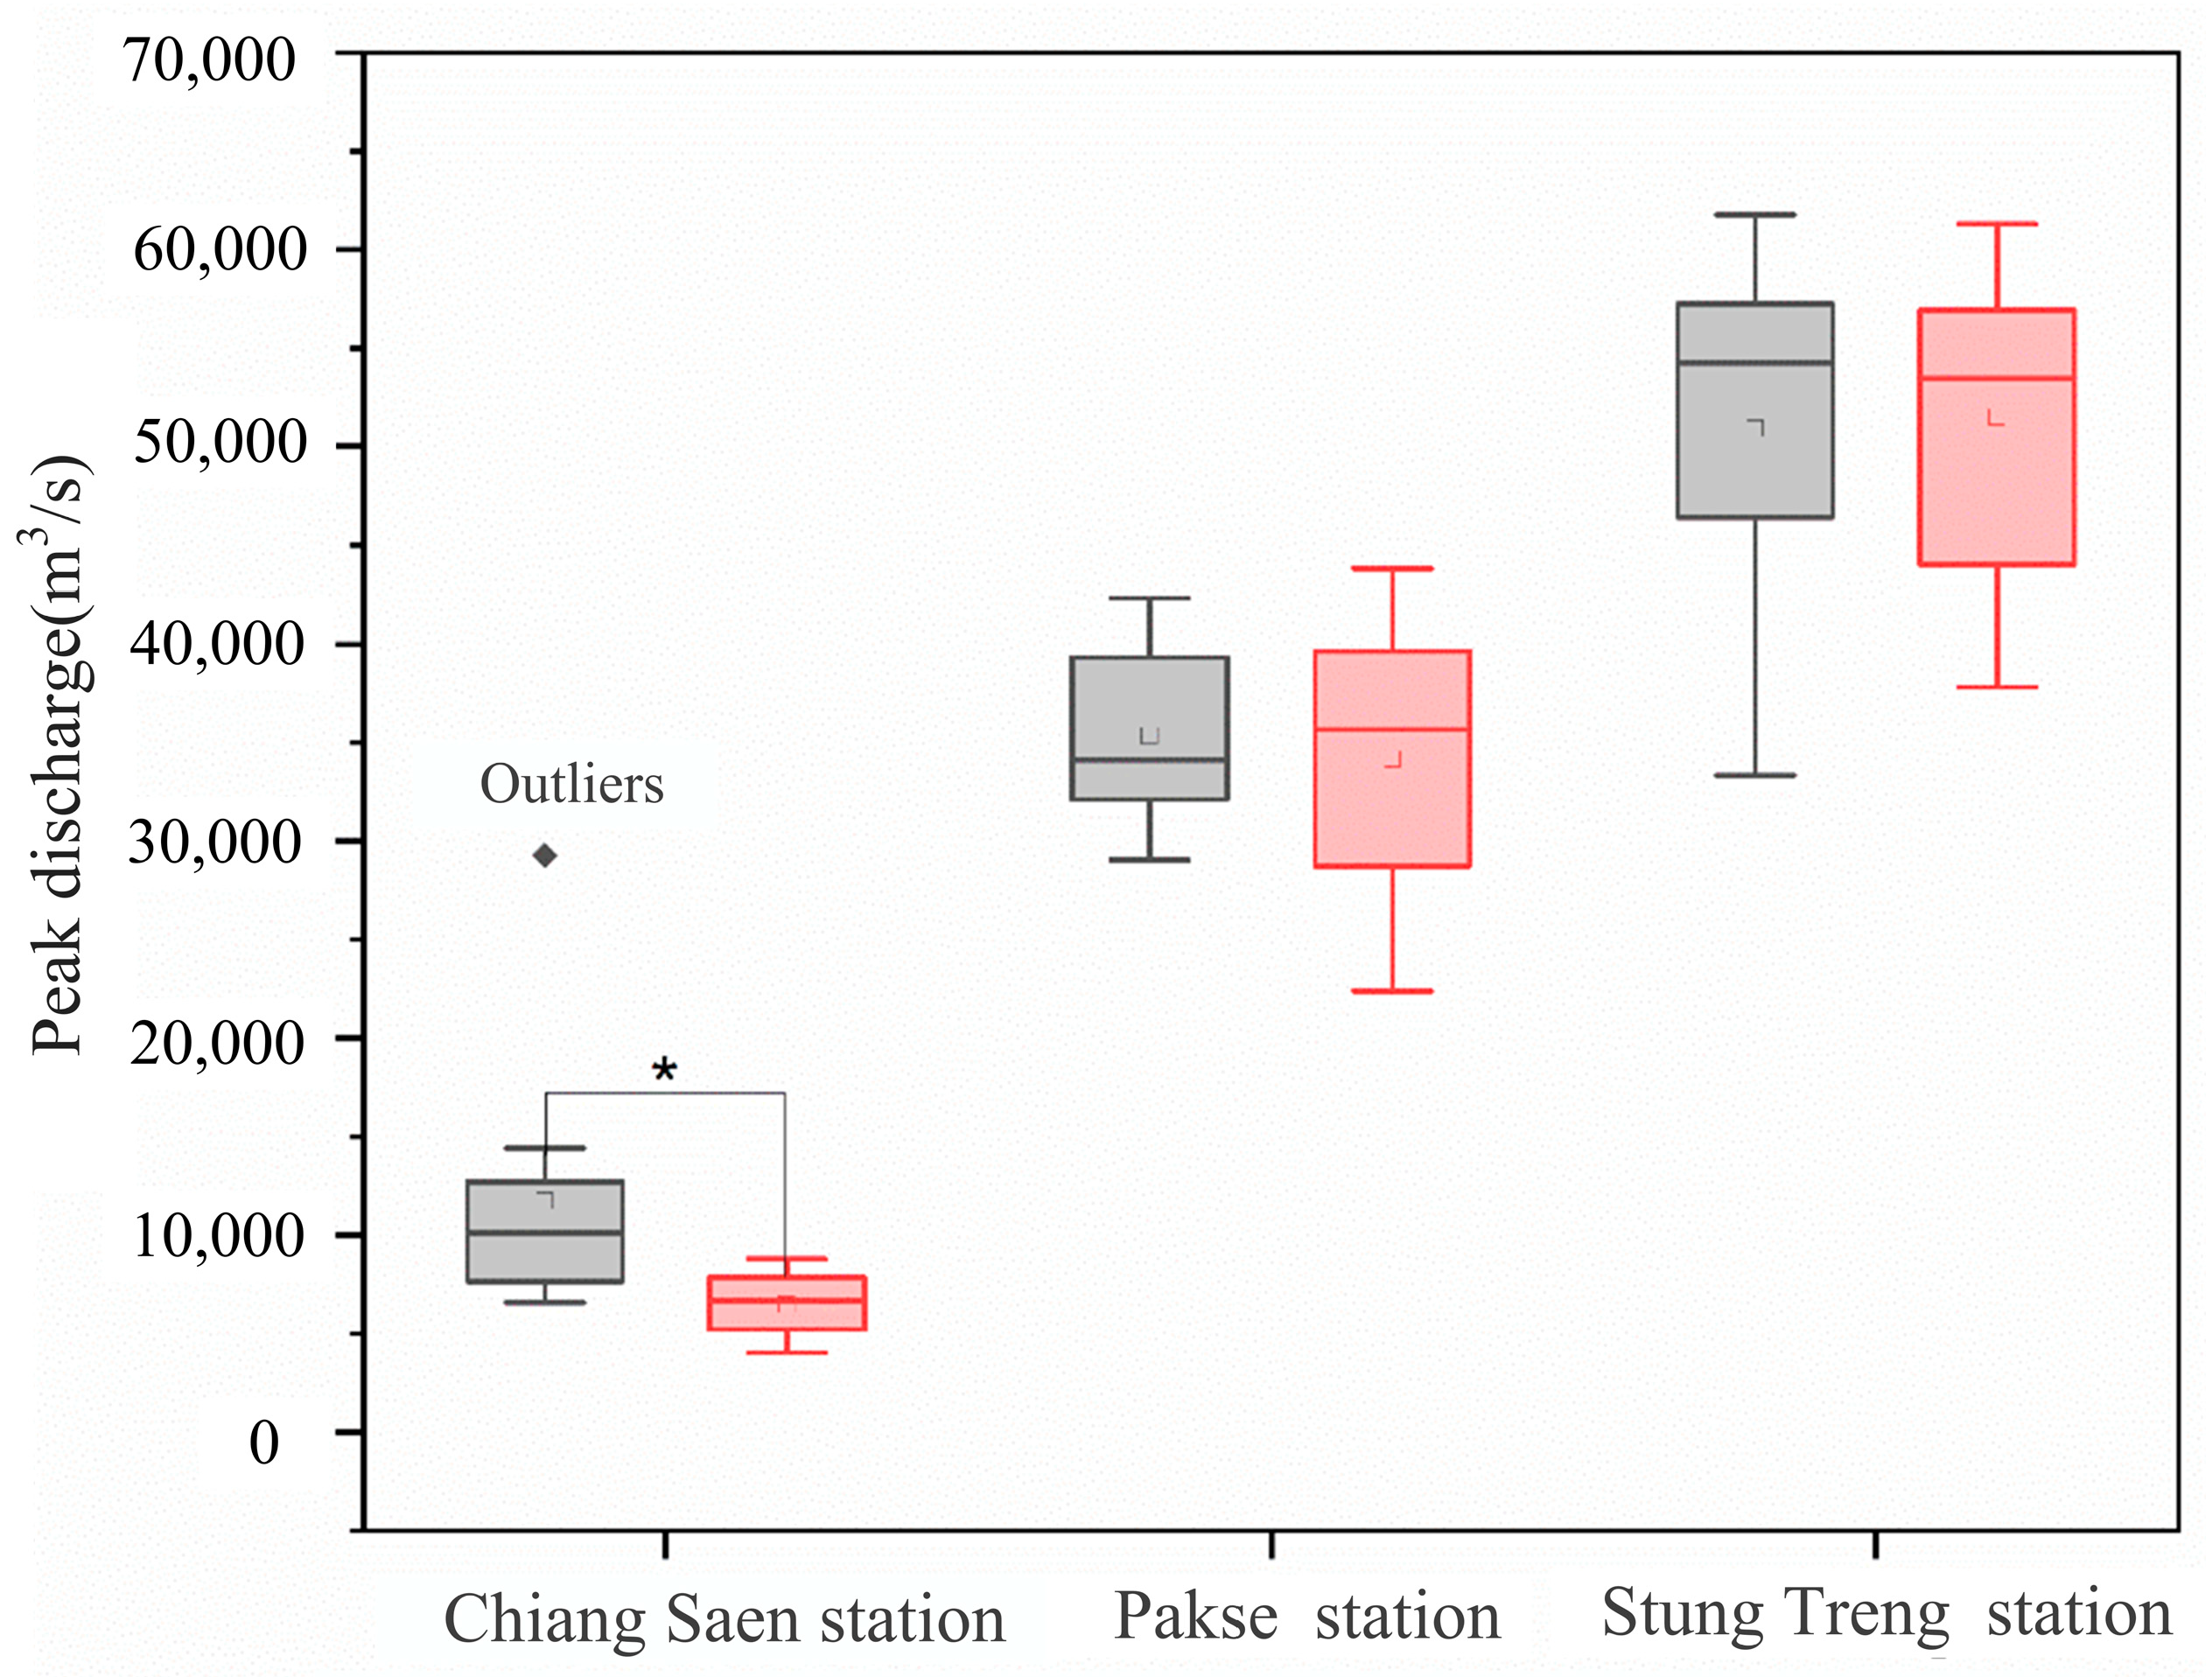
The annual maximum one-day flood volume at the three hydrological stations was statistically analyzed before (2001–2010) and after (2011–2020) operation of the controlling cascade hydropower projects began, as shown in Figure 10. The figure indicates that after operation of the controlling cascade hydropower projects began, the flood peak timing at the Chiang Saen, Pakse, and Stung Treng Stations generally advanced, mainly concentrating in July and August. This demonstrates the significant role of reservoir operation in regulating the temporal distribution of floods. After 2011, the maximum one-day runoff depth at all three stations decreased, with the most significant reduction found at Chiang Saen Station. This indicates that reservoir operation can effectively reduce flood peak flow and mitigate the impact of floods downstream. After 2011, the flood duration at all three stations shortened, which helps prevent the water crises caused by prolonged droughts and enhances water resource management capabilities within the basin.

5.2. Contribution of Hydropower Development to Drought Mitigation

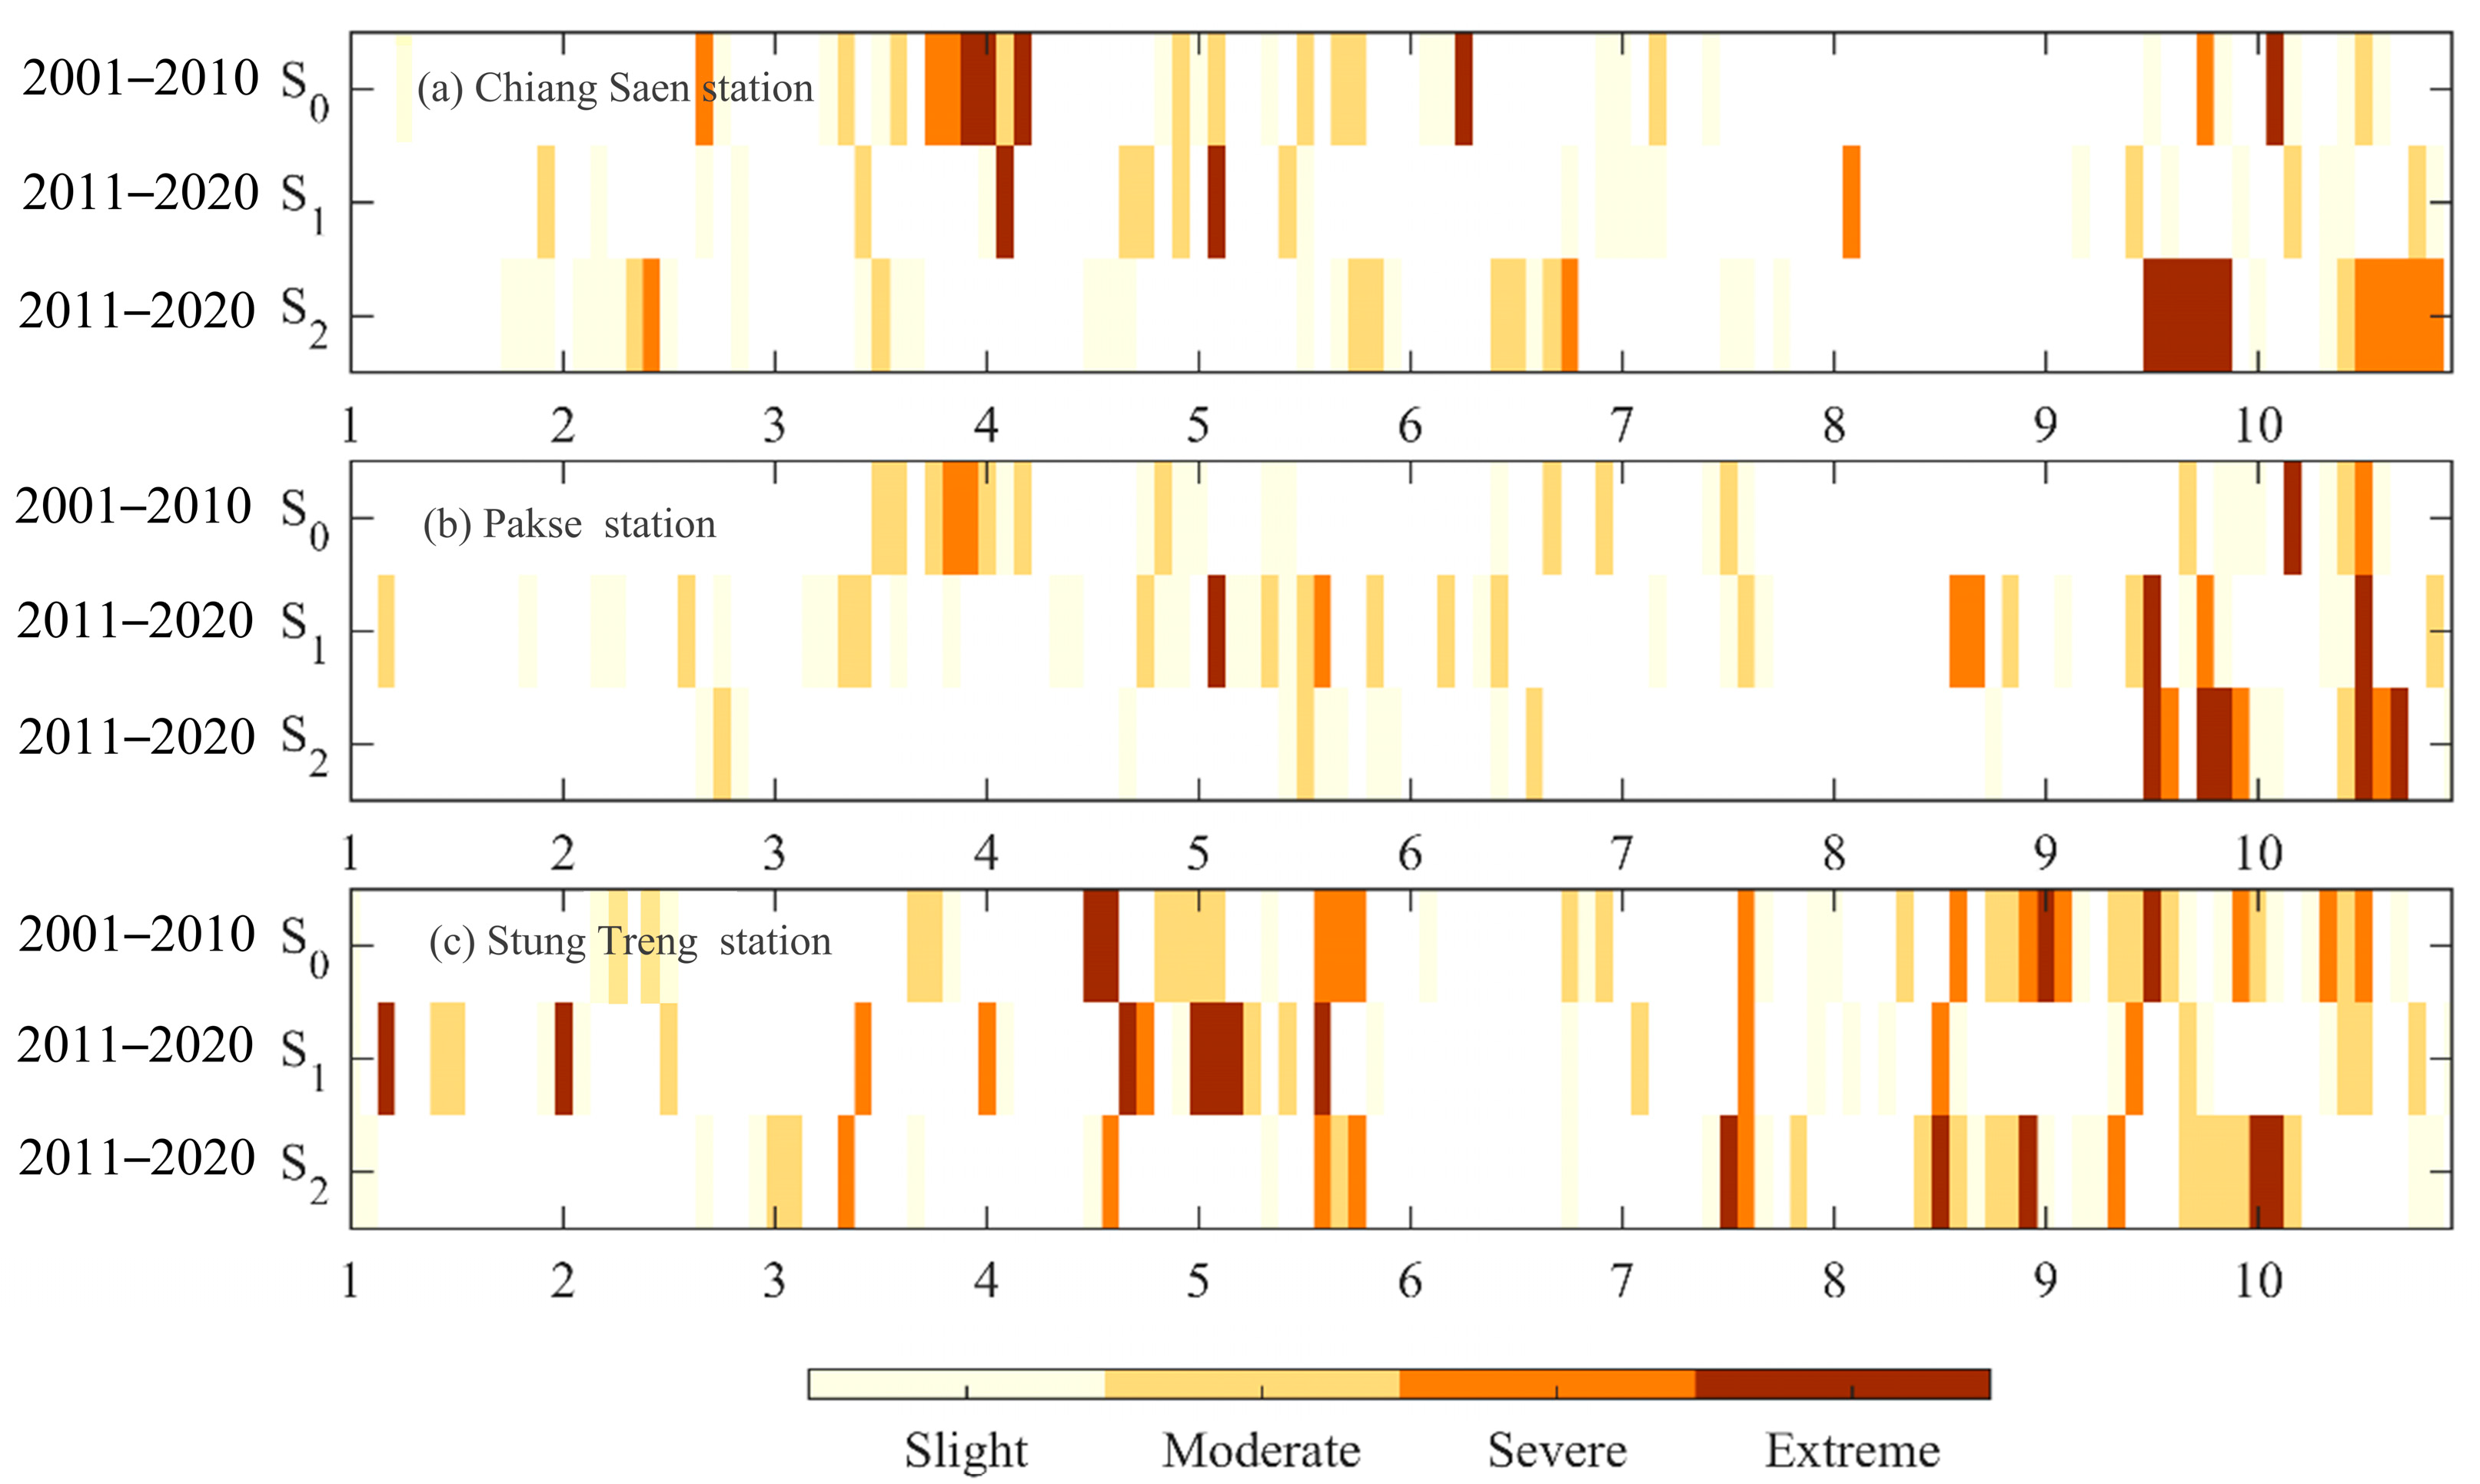
Figure 11 shows that hydropower development has had a positive effect on alleviating hydrological droughts during the dry season, although the reduction in wet-season runoff has resulted in a statistically significant decrease in hydrological drought index values. From upstream to downstream, the negative impact of hydropower development on droughts gradually diminishes. For Chiang Saen Station, climate change would reduce the proportion of severe droughts by 1.7%, but hydropower development offsets the mitigating effect of climate change on droughts, keeping the proportion of severe droughts unchanged. For Pakse Station, climate change and hydropower development change the proportion of no drought by −12.50% and 15.90%, respectively, indicating that hydropower development helps alleviate droughts. Although hydropower development increases the proportion of extreme drought events at Pakse Station by 3.4%, mild, moderate, and severe droughts show a decreasing trend. For Stung Treng Station, both hydropower development and climate change increase the proportion of no drought by 6.70%, while moderate and severe droughts decrease by 4.2% and 3.3%, respectively.

5.3. Contribution of Hydropower Development to Regulating Drought–Flood Transitions

Under climate change, the drought index time series in the basin becomes more fragmented, and drought–flood transitions occur more frequently. This study used the reciprocal of the standard deviation to measure the fragmentation of the drought–flood transitions and found that the fragmentation levels of the drought index time series at Chiang Saen Station under the baseline, restored, and hydropower development scenarios were 0.901, 1.16, and 0.775, respectively. Hydropower development effectively reduces the frequency of drought–flood transitions, lowering the difficulty of drought resistance in the basin.
The development of hydrological droughts at Pakse Station has been similar to that at Chiang Saen Station, but the regulatory effect of upstream hydropower development on drought–flood transitions has weakened. The fragmentation levels of the drought index time series at Pakse Station under the baseline, restored, and hydropower development scenarios were 0.987, 0.905, and 0.860, respectively. Hydropower development has also improved the frequency of drought–flood transitions in the basin, but the effect is weaker compared to Chiang Saen Station. At the most downstream station considered, Stung Treng Station, the fragmentation levels of the drought index time series under the baseline, restored, and hydropower development scenarios were 0.975, 0.944, and 0.980, respectively.
Compared to the baseline period, climate change from 2011 to 2020 has intensified dry–wet variations. Changes in precipitation patterns due to climate change have led to variations in precipitation duration, intra-annual distribution, and total precipitation, ultimately increasing the frequency of dry–wet transitions. Reservoirs have a significant “merging” effect on hydrological droughts, as they can store water resources during wet periods and release them during dry periods, balancing the spatial and temporal distribution of water resources and reducing extreme drought and flood events. By regulating reservoir outflow, downstream river water levels can be controlled, reducing flood risks and providing a stable water source during droughts. Reservoir storage can also promote groundwater recharge, helping to maintain regional hydrological balance and reduce the groundwater level declines caused by droughts.

5.4. Model Limitation

The operation of hydropower plants on the Lancang River exerts significant ecological and socioeconomic impacts on the Mekong River Basin downstream [34]. China’s cascade reservoirs play a crucial role in providing essential dry-season water replenishment, which can help boost agricultural irrigation and ensure shipping safety downstream. The MRC estimates that Laos will receive 70 percent of the export revenues (USD 2.6 billion per year) generated by the mainstream dams once all of them are operational [35].
In the present study, several limitations associated with the model and the under-lying data should be acknowledged. The CNN-LSTM model, despite its demonstrated effectiveness in runoff simulation, has inherent drawbacks. Li D et al. [36] point out that most existing studies on LSTM hydrological modeling almost use the basin-wide spatially averaged meteorological data as model input, without fully representing the spatial characteristics of the input, and the CNN output in the CNN-LSTM model has an unclear physical concept, which limits the model’s performance in depicting complex hydrological processes. Kwon Y et al. [37] point out that the operation of dams and weirs has a significant impact on streamflow, and including dam/weir operation data can improve the prediction accuracy of the LSTM model for streamflow. This indicates that the CNN-LSTM model may struggle to accurately capture the nonlinear and time-varying impacts of reservoir operation on runoff, as the model may not fully consider the specific operation modes and their complex impacts on the hydrological regime.
The purpose of this study is to investigate the changes in floods and droughts before and after the construction of reservoirs. Therefore, this study uses data with relatively coarse spatial and temporal resolutions, which may limit the simulation accuracy of local hydrological processes in the Lancang–Mekong River Basin and the ability to capture short-term extreme events. In the context of the Lancang–Mekong River Basin, the impacts of human activities are complex and diverse, extending well beyond the scope of reservoir hydropower operations. However, in this study, we have grouped all anthropogenic factors under the umbrella of large-scale human activities related to hydropower development. This approach has certain limitations. This can be refined in future model construction and parameter settings to increase the precision and accuracy of the model.
The CNN-LSTM model also has potential uncertainties in drought–flood transition indicators, because that the differences in existing definitions and methodologies for flash droughts, as well as the choice of different data sources, contribute to significant uncertainties in global drought characteristics and their drivers [38].

6. Conclusions

In this study, the impact mechanisms of hydropower development in the Lancang River on flood and drought hazards in the Mekong River Basin were systematically analyzed by constructing machine learning models and integrating multi-source hydrological and meteorological data. The results show that the Lancang River cascade reservoirs play an important role in addressing the extreme hydrological events caused by climate change, particularly in terms of flood control, drought mitigation, and the regulation of drought–flood transitions. The main conclusions are as follows:
1.
Increased Frequency and Spatial Distribution of Extreme Precipitation Events
In the context of global climate change, the risk of extreme precipitation shows an increasing trend pattern from the upstream to the downstream, as the low-lying terrain and humid climate in the downstream areas make them more vulnerable to extreme precipitation, leading to a significant increase in flood risks. The frequency and intensity of extreme precipitation events in the Mekong River Basin are on the rise. While extreme rainfall in the southwestern direction of the basin shows a decreasing trend, most grid points in the northwestern part have seen upward trends in Rx1day, Rx5day, R10mm, and R95p, with the average maximum daily rainfall increasing by 1.8 mm per year and the total extreme precipitation increasing by an average of 18 mm per year.
2.
Contribution of Hydropower Development to Flood Control
The cascade reservoirs on the Lancang River have effectively reduced flood peak flows and mitigated flood risks in downstream areas by regulating runoff, with their operations significantly altering the flood characteristics of the basin. Reservoir scheduling has advanced the timing of flood peaks, reduced peak flow volumes, and shortened flood durations, effectively relieving flood pressure in downstream regions. Especially since the full commissioning of the cascade reservoirs in 2011, the flood peak flows at downstream hydrological stations have significantly decreased, demonstrating the critical role of reservoirs in flood control and disaster mitigation.
3.
Mitigating Effect of Hydropower Development on Droughts
Hydropower development has shown positive effects in alleviating hydrological droughts during the dry season. Through reservoir scheduling, the Lancang River cascade reservoirs release stored water resources during dry periods, maintaining the river’s base flow and reducing the severity of droughts. Although the drought mitigation effect is more pronounced in upstream areas, hydropower development overall positively contributes to water resource management across the basin.
4.
Regulatory Role in Drought–Flood Transitions
The Lancang River cascade reservoirs reduce the frequency and intensity of drought–flood transition events by regulating runoff. The storage and release mechanisms of reservoirs balance the spatial and temporal distribution of water resources, reducing the alternation of extreme drought and flood events and enhancing the basin’s drought resistance.
5.
Combined Impact of Climate Change and Human Activities
By separating the impacts of climate change and human activities on runoff changes, this study indicated that climate change exacerbates the occurrence of extreme hydrological events, while hydropower development mitigates some of these adverse effects. This indicates that future water resource management needs to comprehensively consider natural and anthropogenic factors and develop more adaptive management strategies.
Although this study achieved certain results, there are still some limitations. This study acknowledges limitations in the CNN-LSTM model’s capacity to capture spatial heterogeneity and physical hydrological processes, particularly the nonlinear impacts of reservoir operations, while coarse spatiotemporal data constraints hinder precise simulation of local extremes. Future research should develop physics-informed hybrid models integrating explicit dam operation rules to resolve structural weaknesses, concurrently incorporating high-resolution remote sensing to disentangle multifaceted anthropogenic drivers beyond hydropower.
In conclusion, hydropower development in the Lancang River plays a crucial role in addressing climate change and reducing potential impacts of flood and drought hazards. These findings can inform the formulation of transboundary water resource allocation policies, and also provide a scientific basis for optimizing the dry-season operation strategies of hydropower stations. Through scientific water resource management and regional cooperation, the Lancang–Mekong River Basin can maintain resilience in the face of climate change challenges, ensure sustainable use of water resources, and promote sustainable development across the basin.

Author Contributions

Conceptualization, M.Z. and B.C.; methodology, software, validation, formal analysis, investigation, data curation, and writing—original draft preparation, M.Z., B.C. and H.G.; writing—review and editing, and supervision, M.Z., B.C., H.G., J.Z., H.C., W.W., Y.W., J.C., X.Y. and X.Z. All authors have read and agreed to the published version of the manuscript.

Funding

This research received no external funding.

Data Availability Statement

All the data used in this study are available upon request.

Conflicts of Interest

The authors declare no conflicts of interest.

Abbreviations

The following abbreviations are used in this manuscript:
CNN-LSTMConvolutional Neural Network–Long Short-Term Memory
GAGenetic Algorithm

References

  1. Chen, D.; Liu, J.; Tang, Q. Water Resources in the Lancang-Mekong River Basin: Impact of Climate Change and Human Interventions; Springer Nature: Berlin/Heidelberg, Germany, 2024. [Google Scholar]
  2. Penny, J.; Khadka, D.; Babel, M.; Alves, P.; Djordjević, S.; Chen, A.S.; Loc, H.H. Integrated assessment of flood and drought hazards for current and future climate in a tributary of the Mekong river basin. J. Water Clim. Change 2023, 14, 4424–4443. [Google Scholar] [CrossRef]
  3. Räsänen, T.A.; Koponen, J.; Lauri, H.; Kummu, M. Downstream hydrological impacts of hydropower development in the Upper Mekong Basin. Water Resour. Manag. 2012, 26, 3495–3513. [Google Scholar] [CrossRef]
  4. Lu, X.X.; Li, S.; Kummu, M.; Padawangi, R.; Wang, J.J. Observed changes in the water flow at Chiang Saen in the lower Mekong: Impacts of Chinese dams? Quat. Int. 2014, 336, 145–157. [Google Scholar] [CrossRef]
  5. Mohammed, I.N.; Bolten, J.D.; Srinivasan, R.; Lakshmi, V. Satellite observations and modeling to understand the Lower Mekong River Basin streamflow variability. J. Hydrol. 2018, 564, 559–573. [Google Scholar] [CrossRef]
  6. Nesbitt, H.; Johnston, R.; Solieng, M. Mekong River water: Will river flows meet future agriculture needs in the Lower Mekong Basin? Water Agric. 2004, 116, 86–104. [Google Scholar]
  7. Ishankha, W.C.A.; Shrestha, S.; Van Binh, D.; Kantoush, S.A. Comprehensive assessment of cascading dams-induced hydrological alterations in the Lancang-Mekong river using machine learning technique. J. Environ. Manag. 2024, 371, 123082. [Google Scholar] [CrossRef]
  8. Cheng, H.; Wang, T.; Yang, D. Quantifying the regulation capacity of the Three Gorges Reservoir on extreme hydrological events and its impact on flow regime in a changing climate. Water Resour. Res. 2024, 60, e2023WR036329. [Google Scholar] [CrossRef]
  9. Yun, X.; Tang, Q.; Sun, S.; Wang, J. Reducing climate change induced flood at the cost of hydropower in the Lancang-Mekong River Basin. Geophys. Res. Lett. 2021, 48, e2021GL094243. [Google Scholar] [CrossRef]
  10. Martel, J.L.; Brissette, F.; Arsenault, R.; Turcotte, R.; Castañeda-Gonzalez, M.; Armstrong, W.; Mailhot, E.; Pelletier-Dumont, J.; Rondeau-Genesse, G.; Caron, L.-P. Assessing the adequacy of traditional hydrological models for climate change impact studies: A case for long-short-term memory (LSTM) neural networks. EGUsphere 2024, 2024, 1–44. [Google Scholar] [CrossRef]
  11. Hoang, L.P.; van Vliet, M.T.H.; Kummu, M.; Lauri, H.; Koponen, J.; Supit, I.; Leemans, R.; Kabat, P.; Ludwig, F. The Mekong’s future flows under multiple drivers: How climate change, hydropower developments and irrigation expansions drive hydrological changes. Sci. Total Environ. 2019, 649, 601–609. [Google Scholar] [CrossRef]
  12. Yu, Y.; Bo, Y.; Castelletti, A.; Dumas, P.; Gao, J.; Cai, X.; Liu, J.; Kahil, T.; Wada, Y.; Hu, S.; et al. Transboundary cooperation in infrastructure operation generates economic and environmental co-benefits in the Lancang-Mekong River Basin. Nat. Water 2024, 2, 589–601. [Google Scholar] [CrossRef]
  13. Yun, X.; Tang, Q.; Wang, J.; Liu, X.; Zhang, Y.; Lu, H.; Wang, Y.; Zhang, L.; Chen, D. Impacts of climate change and reservoir operation on streamflow and flood characteristics in the Lancang-Mekong River Basin. J. Hydrol. 2020, 590, 125472. [Google Scholar] [CrossRef]
  14. Hoanh, C.T.; Jirayoot, K.; Lacombe, G.; Srinetr, V. Impacts of Climate Change and Development on Mekong Flow Regimes; First assessment-2009; International Water Management Institute: Colombo, Sri Lanka, 2010. [Google Scholar]
  15. Hecht, J.S.; Lacombe, G.; Arias, M.E.; Dang, T.D.; Piman, T. Hydropower dams of the Mekong River Basin: A review of their hydrological impacts. J. Hydrol. 2019, 568, 285–300. [Google Scholar] [CrossRef]
  16. Gupta, A.; Hock, L.; Huang, X.; Chen, P. Evaluation of part of the Mekong River using satellite imagery. Geomorphology 2002, 44, 221–239. [Google Scholar] [CrossRef]
  17. Liu, J.; Chen, D.; Mao, G.; Irannezhad, M.; Pokhrel, Y. Past and future changes in climate and water resources in the lancang–mekong River Basin: Current understanding and future research directions. Engineering 2022, 13, 144–152. [Google Scholar] [CrossRef]
  18. Piman, T.; Cochrane, T.A.; Arias, M.E.; Green, A.; Dat, N.D. Assessment of flow changes from hydropower development and operations in Sekong, Sesan, and Srepok rivers of the Mekong basin. J. Water Resour. Plan. Manag. 2013, 139, 723–732. [Google Scholar] [CrossRef]
  19. Nalbantis, I.; Koutsoyiannis, D. A parametric rule for planning and management of multiple-reservoir systems. Water Resour. Res. 1997, 33, 2165–2177. [Google Scholar] [CrossRef]
  20. Ahmed, K.; Shahid, S.; Chung, E.-S.; Ismail, T.; Wang, X. Spatial distribution of secular trends in annual and seasonal precipitation over Pakistan. Clim. Res. 2017, 74, 95–107. [Google Scholar] [CrossRef]
  21. Tabari, H.; Talaee, P.H. Temporal variability of precipitation over Iran: 1966–2005. J. Hydrol. 2011, 396, 313–320. [Google Scholar] [CrossRef]
  22. Mann, H.B. Nonparametric tests against trend. Econometrica 1945, 13, 245–259. [Google Scholar] [CrossRef]
  23. Liu, Y.; Wang, F.; Lin, Y.; Cao, L.; Zhang, S.; Ge, W.; Han, J.; Chen, H.; Shi, S. Assessing the contributions of human activities to runoff and sediment transport change: A method for break point identification in double mass curves based on model fitting. J. Hydrol. Reg. Stud. 2023, 50, 101589. [Google Scholar] [CrossRef]
  24. Kratzert, F.; Klotz, D.; Shalev, G.; Klambauer, G.; Hochreiter, S.; Nearing, G. Towards learning universal, regional, and local hydrological behaviors via machine learning applied to large-sample datasets. Hydrol. Earth Syst. Sci. 2019, 23, 5089–5110. [Google Scholar] [CrossRef]
  25. Shoorkand, H.D.; Nourelfath, M.; Hajji, A. A hybrid CNN-LSTM model for joint optimization of production and imperfect predictive maintenance planning. Reliab. Eng. Syst. Saf. 2024, 241, 109707. [Google Scholar] [CrossRef]
  26. Zhao, Q.; Zhang, X.; Li, C.; Xu, Y.; Fei, J.; Hao, F.; Song, R. Diverse vegetation response to meteorological drought from propagation perspective using event matching method. J. Hydrol. 2025, 653, 132776. [Google Scholar] [CrossRef]
  27. Hall, J.; Arheimer, B.; Borga, M.; Brázdil, R.; Claps, P.; Kiss, A.; Kjeldsen, T.R.; Kriaučiūnienė, J.; Kundzewicz, Z.W.; Lang, M.; et al. Understanding flood regime changes in Europe: A state-of-the-art assessment. Hydrol. Earth Syst. Sci. 2014, 18, 2735–2772. [Google Scholar] [CrossRef]
  28. Ma, Q.; Li, Y.; Liu, F.; Feng, H.; Biswas, A.; Zhang, Q. SPEI and multi-threshold run theory based drought analysis using multi-source products in China. J. Hydrol. 2023, 616, 128737. [Google Scholar] [CrossRef]
  29. Van Loon, A.F.; Laaha, G. Hydrological drought severity explained by climate and catchment characteristics. J. Hydrol. 2015, 526, 3–14. [Google Scholar] [CrossRef]
  30. Du, Y.; Bao, A.; Zhang, T.; Ding, W. Quantifying the impacts of climate change and human activities on seasonal runoff in the Yongding River basin. Ecol. Indic. 2023, 154, 110839. [Google Scholar] [CrossRef]
  31. Wang, S.; Chen, F.; Hu, M.; Chen, Y.; Cao, H.; Yue, W.; Zhao, X. Past, present and future changes in the annual streamflow of the Lancang-Mekong River and their driving mechanisms. Sci. Total Environ. 2024, 947, 174707. [Google Scholar] [CrossRef]
  32. Gudmundsson, L.; Boulange, J.; Do, H.X.; Gosling, S.N.; Grillakis, M.G.; Koutroulis, A.G.; Leonard, M.; Liu, J.; Schmied, H.M.; Papadimitriou, L.; et al. Globally observed trends in mean and extreme river flow attributed to climate change. Science 2021, 371, 1159–1162. [Google Scholar] [CrossRef]
  33. Yun, X.; Song, J.; Wang, J.; Bao, H. Modelling to assess the suitability of hydrological-hydrodynamic model under the hydropower development impact in the Lancang-Mekong river basin. J. Hydrol. 2024, 637, 131393. [Google Scholar] [CrossRef]
  34. Yu, Y.; Zhao, J.; Li, D.; Wang, Z. Effects of hydrologic conditions and reservoir operation on transboundary cooperation in the Lancang–Mekong River Basin. J. Water Resour. Plan. Manag. 2019, 145, 04019020. [Google Scholar] [CrossRef]
  35. Carew-Reid, J. The Mekong: Strategic environmental assessment of mainstream hydropower development in an international river basin. In Routledge Handbook of the Environment in Southeast Asia; Routledge: London, UK, 2016; pp. 352–373. [Google Scholar]
  36. Li, D.; Marshall, L.; Liang, Z.; Sharma, A.; Zhou, Y. Bayesian LSTM with stochastic variational inference for estimating model uncertainty in process-based hydrological models. Water Resour. Res. 2021, 57, e2021WR029772. [Google Scholar] [CrossRef]
  37. Kwon, Y.; Cha, Y.K.; Park, Y.; Lee, S. Assessing the impacts of dam/weir operation on streamflow predictions using LSTM across South Korea. Sci. Rep. 2023, 13, 9296. [Google Scholar] [CrossRef]
  38. Mukherjee, S.; Mishra, A.K. Global flash drought analysis: Uncertainties from indicators and datasets. Earth’s Future 2022, 10, e2022EF002660. [Google Scholar] [CrossRef]
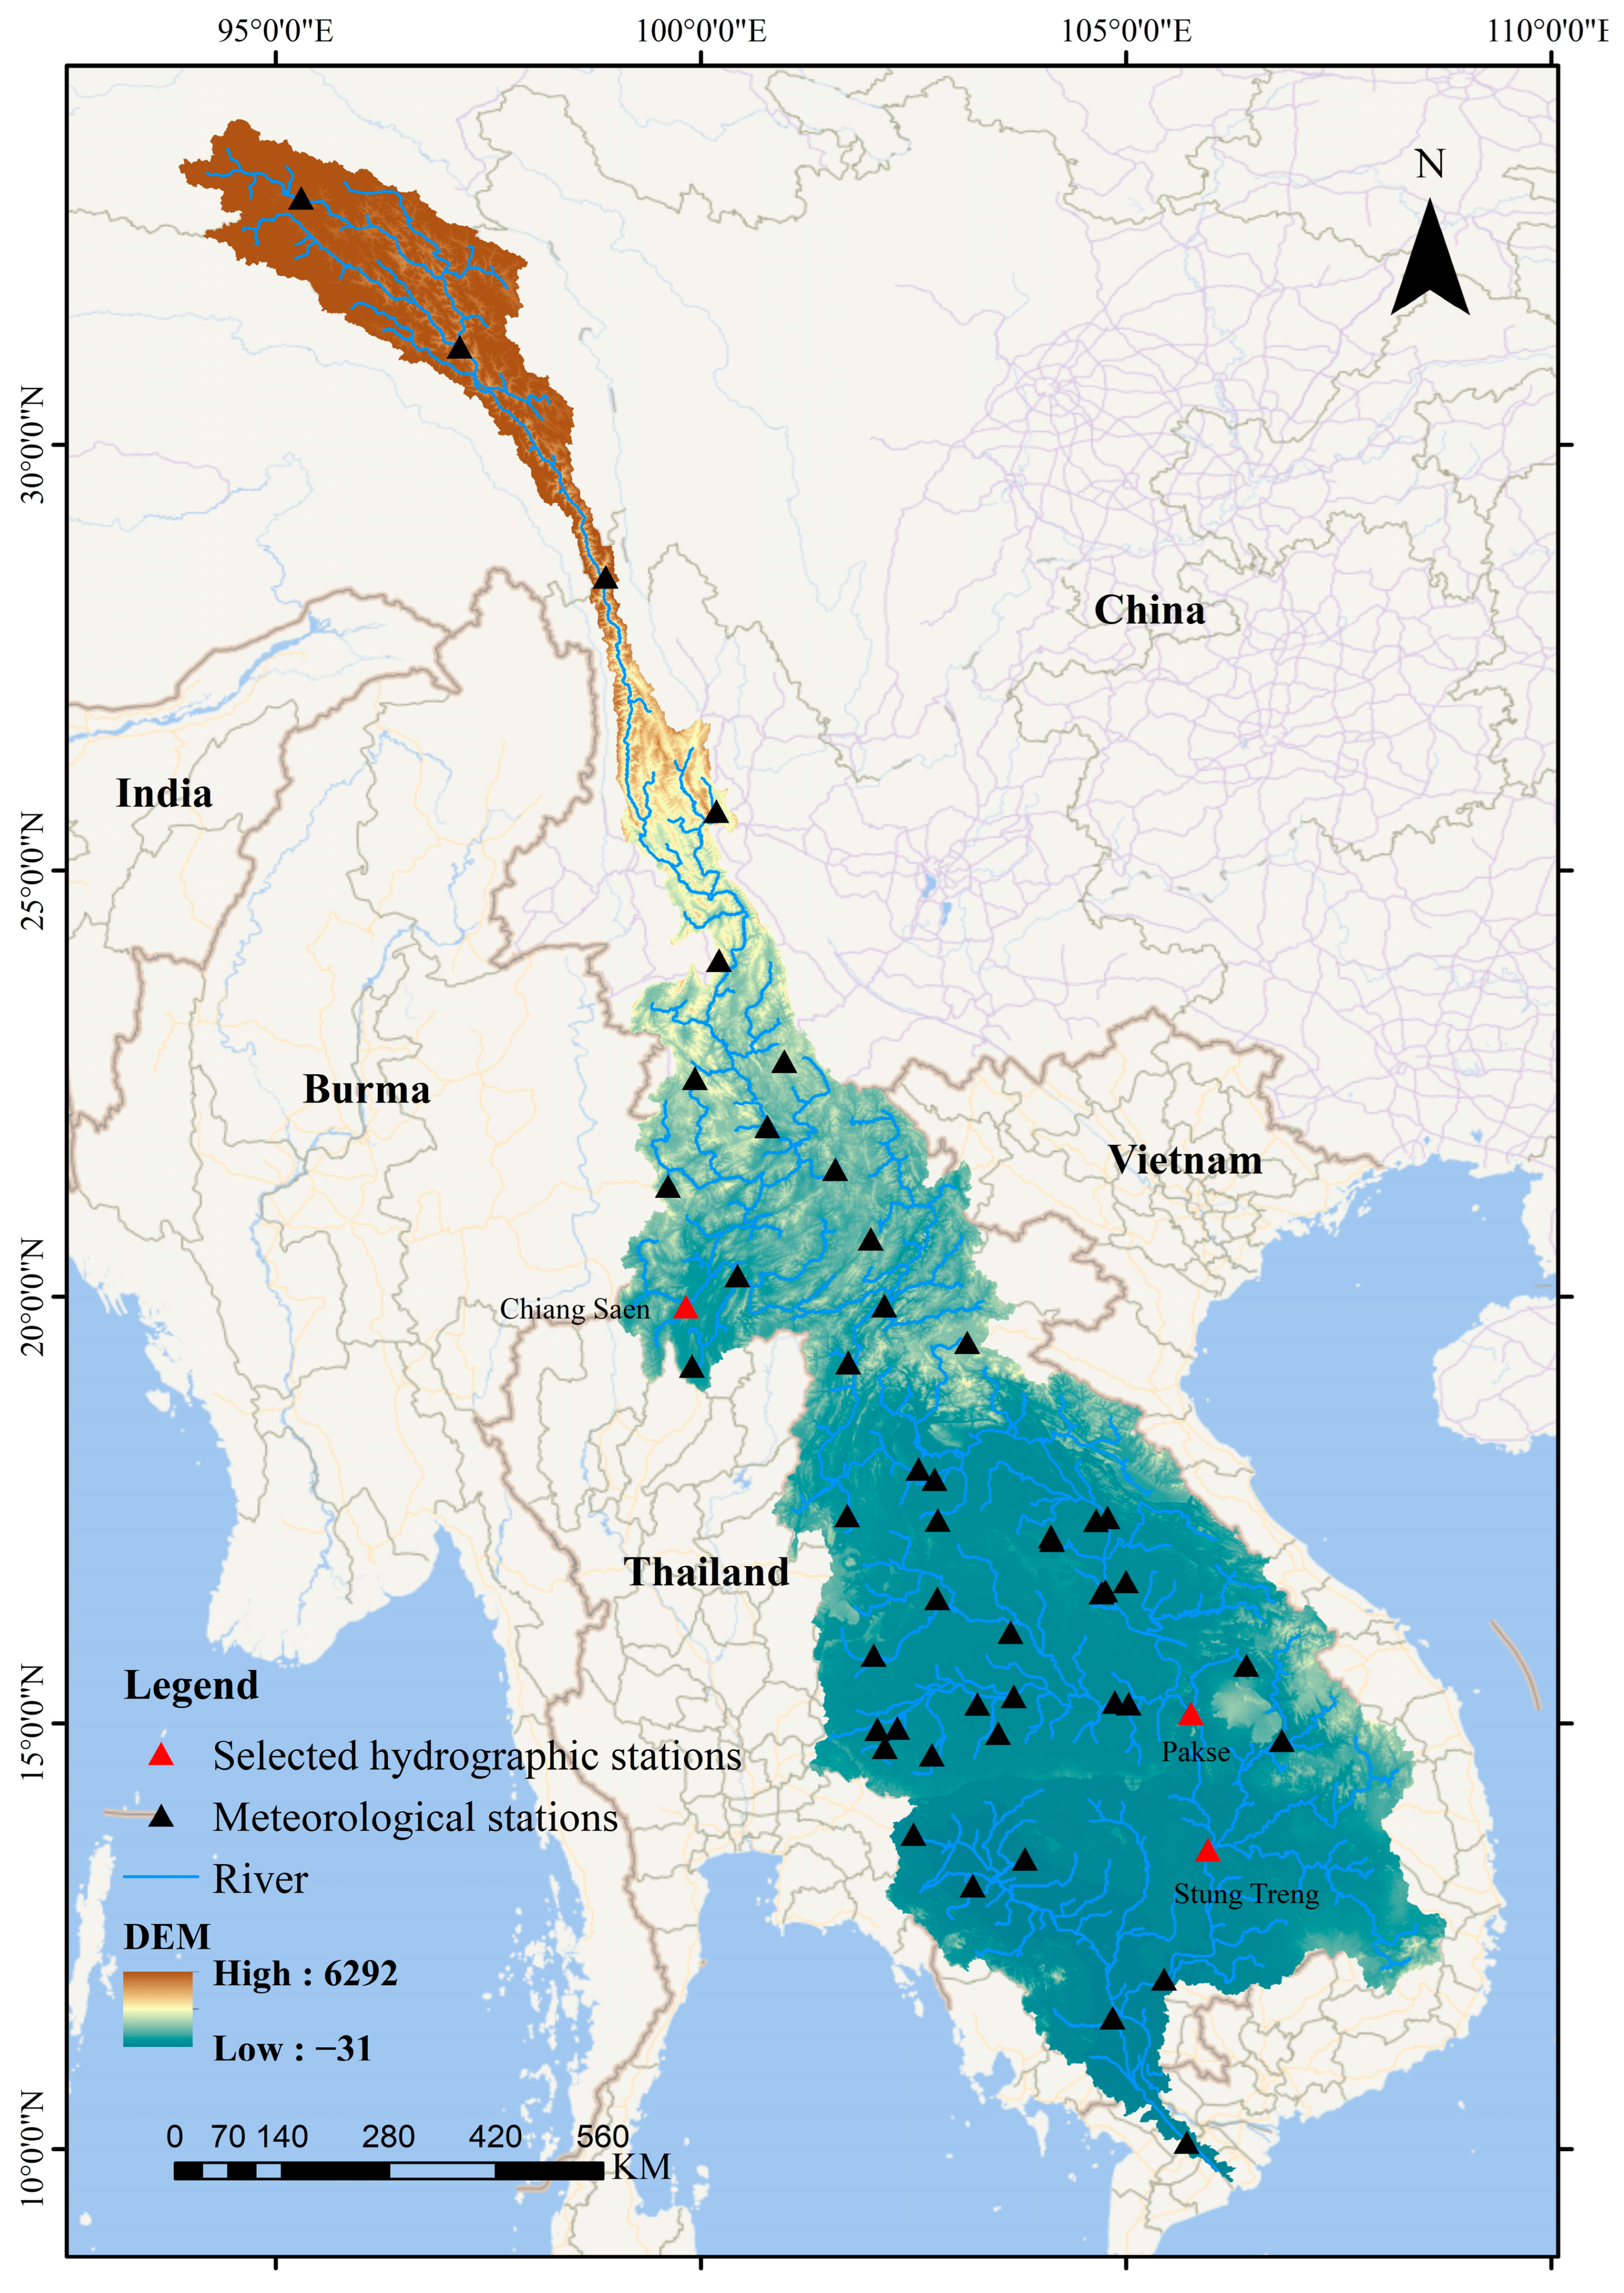
Figure 1. Geographical overview of the Lancang–Mekong River Basin.
Water 17 02352 g001
Figure 2. Schematic diagram of the CNN-LSTM-based runoff reduction method.
Water 17 02352 g002
Figure 3. Schematic diagram of Run Theory and drought events.
Water 17 02352 g003
Figure 4. Schematic diagram of scenario settings for the Variable Separation Method.
Water 17 02352 g004
Figure 5. Comparison of the simulated and observed runoff values using a Convolutional Neural Network–Long Short-Term memory (CNN-LSTM) network, where (a) is the comparison value for the Chiang Saen Station, (b) is for the Pakse Station, and (c) is for the Stung Treng Station.
Water 17 02352 g005
Figure 6. Comparison of the CNN-LSTM simulated and observed runoff processes, where (a) is for the Chiang Saen Station, (b) is for the Pakse Station, and (c) is for the Stung Treng Station.
Water 17 02352 g006
Figure 7. Sensitivity analysis of the CNN-LSTM model.
Water 17 02352 g007
Figure 8. Multi-year average of extreme precipitation indices: (a) Rx1day (mm), (b) Rx5day (mm), (c) R10mm, (d) R95p (mm).
Water 17 02352 g008
Figure 9. Trends in extreme precipitation indices: Rx1day, Rx5day, R10mm, and R95p. (Note: Black dots indicate significant changes in this area).
Water 17 02352 g009
Figure 10. Comparison of the annual maximum one-day flood volume at the Chiang Saen, Pakse, and Stung Treng Stations in 2001–2010 (gray) and 2011–2020 (red). (* indicates significant differences).
Water 17 02352 g010
Figure 11. Heatmap of the drought severity at the representative stations in the Lancang–Mekong River Basin under different scenarios, where (a) is for the Chiang Saen Station, (b) is for the Pakse Station, and (c) is for the Stung Treng Station.
Water 17 02352 g011
Table 1. Extreme precipitation indices.
Index TypeDescriptionUnit
Rx1dayMaximum 1-day precipitation in a yearmm
Rx5dayMaximum 5-day consecutive precipitation in a yearmm
R10mmAnnual total days with a daily precipitation of ≥10 mmd
R95pAnnual cumulative precipitation on days with precipitation in the >95th percentilemm
Table 2. Scenario settings for the Environmental Variable Separation Method.
ScenarioPeriodMeteorological DataVegetation Cover DataRunoff Data TypeDescription
S0Baseline1–10 Meteorological1–10 VegetationObserved SeriesBaseline Runoff
S1Impact11–20 Meteorological11–20 VegetationSimulated SeriesRestored Runoff
S2Impact11–20 Meteorological11–20 VegetationObserved SeriesObserved Runoff
Table 3. CNN-LSTM monthly runoff simulation accuracy.
Hydrological StationCalibration PeriodValidation Period
R2NS PBIASR2NS PBIAS
Chiang Saen0.840.84−1.000.760.75−3.78
Pakse0.900.905.840.810.7910.41
Stung Treng0.910.913.380.790.74−11.76
Table 4. Statistical table of the maximum one-day flood volume at the selected hydrological stations in the Lancang–Mekong River Basin.
Hydrological StationChiang Saen StationPakse StationStung Treng Station
YearsFlood TimeMaximum 1-Day Runoff Depth (mm)Flood TimeMaximum 1-Day Runoff Depth (mm)Flood TimeMaximum 1-Day Runoff Depth (mm)
MonthDayMonthDayMonthDay
2001854.898196.71998.40
20028205.818226.248207.86
2003983.159155.428247.33
20049154.079136.119237.54
20058284.388196.27974.54
2006101213.48305.039106.50
2007854.8910105.16966.31
20088106.588175.419127.79
20098243.58144.608315.59
20107223.01935.098267.43
20118242.978106.568278.34
20127254.02934.31877.12
201312133.129236.018127.26
20149152.38815.729267.74
20157313.828104.569125.14
20168192.489134.669157.81
2017993.197275.598315.92
20188313.67306.289117.28
2019152.2946.95835.99
20208161.848273.55937.45
Table 5. Statistical table of the drought characteristics of hydrological stations in the Lancang–Mekong River Basin.
Hydrological StationChiang Saen StationPakse StationStung Treng Station
Average duration (month)6.565.567.56
Average severity4.484.167.07
Average peak value1.221.051.36
Disclaimer/Publisher’s Note: The statements, opinions and data contained in all publications are solely those of the individual author(s) and contributor(s) and not of MDPI and/or the editor(s). MDPI and/or the editor(s) disclaim responsibility for any injury to people or property resulting from any ideas, methods, instructions or products referred to in the content.