Abstract
Water is essential to human civilization and development, yet its quality is increasingly threatened by climate change, pollution, and resource mismanagement. This work introduces an empirical, non-invasive framework for assessing water potability using electrical impedance spectroscopy (EIS) combined with a novel equivalent circuit model. A customized sensor holder was designed to reduce impedance magnitude and enhance phase sensitivity, improving detection accuracy. Various water samples, including seawater, groundwater, and commercially bottled water, were analyzed. The proposed method achieved a 100% classification accuracy in distinguishing among water types, as validated by extracted circuit parameters and verified by inductively coupled plasma (ICP) measurements. Sensitivity analysis demonstrated the ability to detect compositional changes as small as 10%, highlighting a strong potential for fine discrimination of ionic contents. The extracted parameters, such as resistance, capacitance, and inductance, showed clear correlations with ionic composition, enabling reliable potability classification in accordance with WHO guidelines. The approach is rapid, label-free, and suitable for field applications, offering a promising tool for real-time water quality monitoring and supporting sustainable water resource management.
Keywords:
analysis; circuit models; cyclic voltammetry; electrical; impedance; sensing; quality; water 1. Introduction
The availability of water has been essential for the evolution and advancement of human civilization, from the earliest Mesopotamian times to the rapidly expanding cities in the Middle [1,2]. Water has even taken on a more intricate role due to its interrelation within the water–energy–food nexus, and any lack or disruption in its quality could severely impact both urban and rural living conditions, as well as the country’s strategic development plans [3]. Climate change, pollution, and mismanagement have resulted in significant degradation of available water resources, adversely affecting human health [4,5,6,7] and socio-economic development [8]. While natural events might exacerbate water pollution, anthropogenic activities significantly intensify the issue [9]. Marine habitats adjacent to industrial areas are particularly susceptible to heavy metal contamination, while wetlands and water sources adjacent to agricultural areas are at risk of pollutants like fertilizers and pesticides [10]. Coastal aquifers are particularly susceptible to seawater intrusion [11]. As a result, ongoing surveillance and regulation of water quality are necessary for the accurate assessment, prediction, and management of water pollution, thus ensuring sustainable utilization of water resources [12]. The World Health Organization (WHO) has set international guidelines to mitigate the health risks associated with drinking water contaminated by various harmful elements, urging all nations to implement these guidelines to ensure the provision of safe and high-quality water to their citizens [13].
Water quality can be assessed using various physical, chemical, and biological techniques. Depending on the water quality parameters being monitored, these analytical methods can be categorized into biological (e.g., pathogenic organisms), chemical (e.g., chemical oxygen demands (CODs)), and physical (e.g., turbidity) categories [14,15]. Additionally, various instruments are available for assessing water quality, including but not limited to Inductively Coupled Plasma (ICP) [16] and spectrophotometry [17,18], Electrical Impedance Spectroscopy (EIS) [19], as well as statistical and remote sensing methods [20]. Each possesses advantages depending on the type of contamination and the extent of monitoring needed.
Recent progress in electrical impedance techniques has led them to be recognized as a rapid, portable, highly accurate, and non-invasive method for contemporary environmental monitoring. For example, Bifano et al. [19] implemented this method to detect microplastics in water, showing how electrical impedance spectroscopy (EIS) can evaluate the influence of microplastic particles on the electrical characteristics of water. Additionally, electrical impedance has been implemented in biosensing applications, including detecting algal poisons in water, highlighting its potential in modern water quality analysis. EIS has lately been implemented in multiple studies to detect salts and ions in aqueous solutions [21,22,23,24]. These studies demonstrate the effectiveness of EIS as a technique for analyzing the ionic properties of water. However, most focus on controlled environments containing single or selected ions in synthetic solutions with inadequate insight into how EIS performs in more complex water sources. Nagaraj et al. [25] used electrochemical sensors with nanochannels to detect ibuprofen in water, showing that impedance was affected by diffusion at low frequencies and solution resistance at high frequencies using a modified Randles circuit. Houssin et al. [26] applied EIS with interdigitated microelectrodes to detect C. parvum, finding capacitive effects dominated at low frequencies and water’s dielectric properties at high frequencies. Yang et al. [27] developed a label-free EIS immunosensor for E. coli O157, using a circuit model involving ohmic resistance, double-layer capacitance, electron-transfer resistance, and Warburg impedance. Brosel-Oliu et al. [28] presented an aptasensor for E. coli O157 in KCl solutions, modeled with contact resistance, geometrical capacitance, electrode resistance, and a constant phase element.
This study addresses this gap by presenting a unique impedance-based circuit model optimized for measuring and analyzing the water quality of the following distinct water sources: seawater, groundwater, and bottled drinking water, each possessing unique characteristics influenced by differing concentrations of ions, suspended particles, and contaminants. The tailored circuit model demonstrates improved precision and efficacy in evaluating the selected water constituents. ICP was also used to complement the impedance measurements, further improving the accuracy of the water quality analysis.
2. Materials and Methods
2.1. Sample Collection
Groundwater (GW1, GW2, GW3, GW4, GW5, GW6, and GW7) and seawater (SW1, SW2, and SW3) samples were collected from Khorfakkan city, United Arab Emirates. Also, bottled branded waters (Evian, Fiji, Alpin, AlAin, MaiDubia, Masafi zero, and Masafi) were included in the assessment. This ensures a wide range of ionic concentrations necessary to demonstrate the efficiency of the proposed method.
2.2. ICP-MS Measurements
Inductively Coupled Plasma Mass Spectrometry (ICP-MS) was utilized to measure the concentrations of sodium, potassium, magnesium, and calcium ions (mg/L) in the water samples, following the procedures outlined by Fernández-Turiel et al. [29]. The process involved transferring water samples into polyethylene bottles, acidifying them with nitric acid, and filtering to remove particulates. Calibration was performed using certified sodium, potassium, magnesium, and calcium standards to ensure accurate concentration measurements. It is worth noting that Inductively Coupled Plasma (ICP) measurements were carried out to confirm that the water content in the samples varied significantly, validating the effectiveness of the proposed approach. Table 1 presents the ICP-MS results for all samples under study.

Table 1.
Concentrations of sodium (Na+), potassium (K+), calcium (Ca2+), and magnesium (Mg2+) ions (mg/L) measured using ICP-MS. All values are in mg/L.
2.3. Experimental Setup
Electrical measurements were carried out by introducing 500 μL of each sample into a cuvette interfaced with a Gamry 3000 system (Gamry, Warminster, PA, USA). The impedance magnitude and phase were recorded across a frequency range spanning 10 Hz to 1 MHz, using a 10 mV AC excitation signal. Within this range, the phase of the impedance profiles revealed resonance frequencies between 50 Hz and 500 Hz. These variations in resonance behavior reflect the influence of differing ionic concentrations within the water suspensions. In this experiment, a two-electrode setup was used to analyze a cuvette containing a suspension, which was treated as a dielectric material. The cuvette dimensions were 10 mm × 21 mm × 4 mm. It features embedded polished aluminum plate electrodes [30]. The polished aluminum electrodes effectively reduce static electricity and minimize electrical arcing. The experimental setup is shown in Figure 1. The cuvette functions as a low-frequency, open-ended, parallel-plate sensor. The water samples were tested at a controlled room temperature of approximately 27 °C during the measurements.
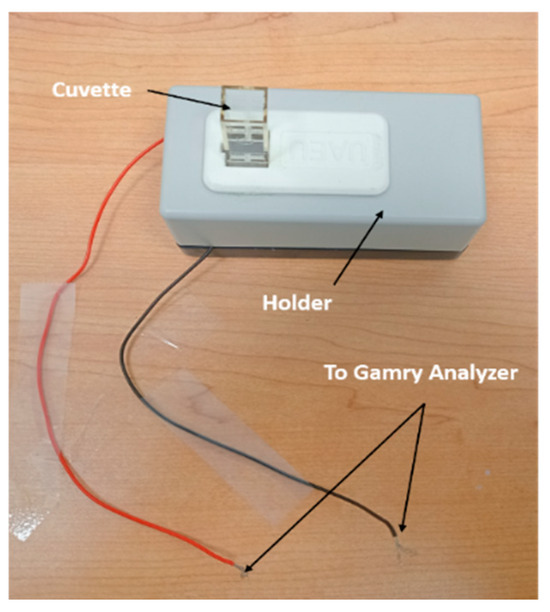
Figure 1.
Cuvette and holder setup connection.
As a reference, EIS measurements were conducted on the clean empty cuvette and deionized water with an ohmic resistance of 18.2 MΩ·cm and a conductivity of 0.05 μS/cm. As anticipated, the electrical impedance measurements for both the empty cuvette and when it is filled with deionized water are similar, as shown in Figure 2. This confirms the effectiveness of the proposed method and the accuracy of the measurements. The integrated cuvette and holder system exhibit predominantly resistive behavior, which is advantageous for sensing applications. This configuration enables the detection of minor ionic concentration changes in water, thereby enhancing the selectivity and sensitivity of the measurements.
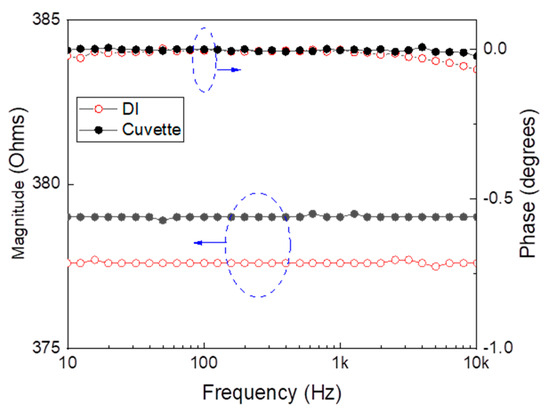
Figure 2.
Measured electrical impedance and phase versus frequency: (red) de-ionized water, (black) cuvette. The blue dashed circuit and its designated arrow refer to the corresponding Y-axis.
2.4. Equivalent Circuit Model
The introduced equivalent circuit model employed in this study is illustrated in Figure 3. This circuit is an enhanced version of the Randles circuit. The section enclosed within the red dashed box represents the standard Randles circuit configuration, where
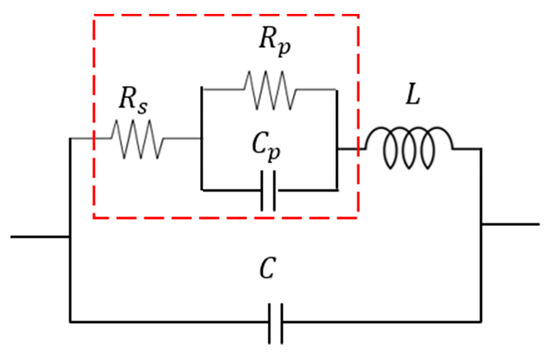
Figure 3.
Proposed circuit model designed to accommodate a wide range of frequencies and ionic concentrations.
- Rs represents the resistance of the solution medium;
- Cp denotes the double-layer capacitance at the solid–liquid interface;
- and Rp corresponds to the charge transfer resistance.
Beyond the traditional Randles circuit, additional components have been incorporated to extend the model’s functionality:
- A series inductance L is added to account for the high ionic concentration effects at elevated frequencies, which is characteristic of seawater samples. The observed inductance may arise from the manifestation of a negative capacitance effect, which can occur at electrified interfaces.
- An additional capacitance C is included to represent high-frequency performance, enabling the circuit to adapt to different media conditions.
This modified circuit is tailored to address a wider range of frequencies and ionic concentrations, making it particularly suitable for analyzing complex solution media like seawater and high-quality water.
Figure 4a,b show the impedance magnitude and phase of the Evian sample, respectively, superimposed with the performance curves of the Randles model and the modified equivalent circuit model. Figure 4c,d present the impedance magnitude and phase of the SW3 sample, respectively, superimposed with the performance curves of the Randles model and the modified equivalent circuit model. The close agreement between the proposed model and the measured data highlights its capability to account for the intricacies in the electrical behavior of different water samples, which the Randles model fails to capture adequately.
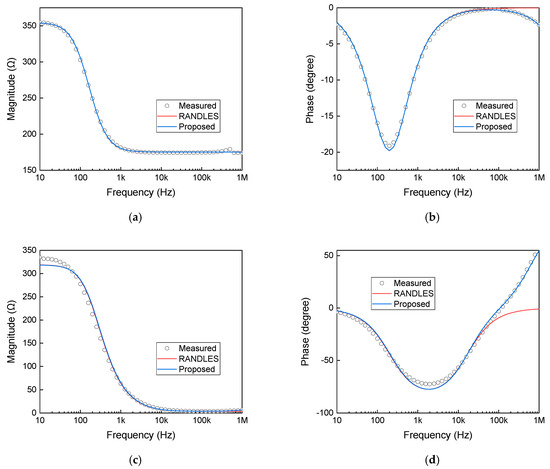
Figure 4.
Measurements and circuit performance: (a,b) show the impedance magnitude and phase of the Evian sample, respectively, superimposed with the performance curves of the Randles model and the modified equivalent circuit model. (c,d) present the impedance magnitude and phase of the SW3 sample, respectively, superimposed with the performance curves of the Randles model and the modified equivalent circuit model.
The fitting process in the Gamry Reference 3000 is performed using Echem Analyst software 7.9.0, which facilitates the extraction of equivalent circuit parameters from EIS measurements [31]. A small AC voltage perturbation is initially applied to the sample, and the corresponding current response is recorded across a range of frequencies to characterize its impedance. The proposed circuit was implemented in the software as a custom model for analysis. The fitting process utilizes a non-linear least squares (NLLS) regression algorithm, which iteratively refines the circuit parameters to minimize the discrepancy between the measured and theoretical impedance values. The accuracy of the fit is assessed through the Chi-square test and residual error analysis, ensuring a precise representation of the system’s electrical behavior. The proposed model consistently achieves an optimal fit across all measurements. The integration of non-linear least squares fitting ensures high precision in modeling, enhancing the sensitivity and selectivity of water quality assessment.
3. Results and Discussion
Electrical Impedance Spectroscopy (EIS) Tests
Figure 5 shows the impedance magnitude and phase across different frequencies for all samples under study, indicating that variations in water content resulted in changes in both the impedance magnitude and phase. Figure 5a,c,e present the impedance magnitude over a frequency range from 10 Hz to 1 MHz. It indicates that for all samples, the impedance decreases as the frequency increases. As the total ion content in the sample increases, the solution becomes less resistive to current, i.e., lower impedance. This conclusion is supported by the data shown in Table 1. Figure 5b,d,f present the impedance phases over a frequency range. The phase is a critical parameter in distinguishing between capacitive and inductive impedance behavior. Bottled water samples consistently exhibit capacitive characteristics, while seawater samples predominantly demonstrate inductive behavior, especially at frequencies exceeding 50 kHz. Similarly, groundwater samples generally exhibit capacitive behavior, although some show weak inductive characteristics at frequencies above 50 kHz. This will play a significant role in the development of the equivalent circuit model.
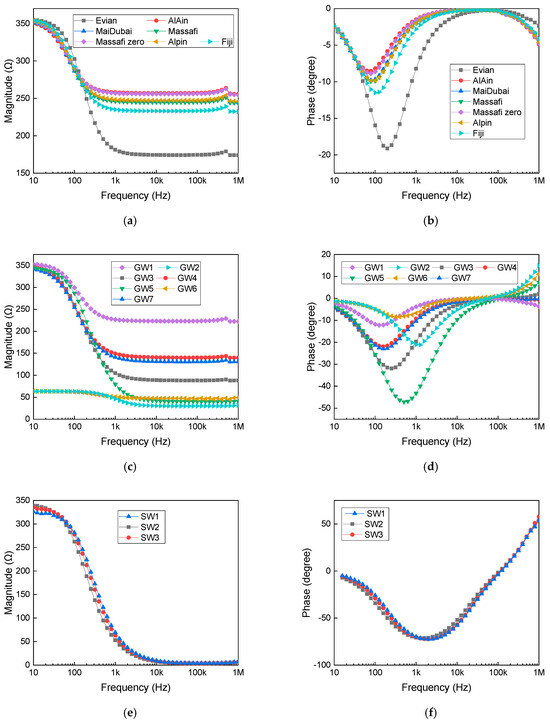
Figure 5.
Measured electrical impedance as a function of frequency: (a) magnitude for bottled water, (b) phase for bottled water, (c) magnitude for groundwater samples, (d) phase for groundwater samples, (e) magnitude for seawater samples, and (f) phase for seawater samples.
While seawater is non-magnetic, sharing the same permeability as free space can exhibit positive phase behavior at high frequencies, as reported by Baptista et al. [32] and Hattab et al. [33], respectively. This observed inductive response may also be influenced by the measurement setup, as the holder circuit itself can exhibit inductive behavior, contributing to the phase shift. Ionic currents in seawater, driven by electric fields or concentration gradients, can generate weak magnetic fields due to ion motion. However, these are significantly weaker than those produced by eddy currents in metals, which are induced by changing magnetic fields and are commonly used in induction heating and non-destructive testing. Furthermore, Gonzalez-Tovar et al. reported that negative capacitance effects can emerge at electrified interfaces, giving rise to inductive behavior [34]. Their study shows that negative differential capacitance can theoretically occur under conditions enforcing a uniform surface charge; however, in real electrochemical systems, this condition leads to instability and the formation of non-uniform charge distributions, resulting in an apparent negative capacitance effect
Impedance measurements indicate a strong correlation between ionic concentration and electrical response, where increased ion content results in a lower impedance and enhanced conductivity. Solutions with higher ionic concentrations exhibit greater conductivity and stronger capacitive effects, while those with lower concentrations display dominant resistive characteristics. The observed variations align with established electrochemical principles, where ion mobility, charge density, and hydration shell effects govern overall impedance behavior. These findings underscore the impact of ionic composition on electrical properties, highlighting the interplay between resistive and capacitive elements in electrolyte solutions.
The circuit model’s performance for Evian and seawater samples, representing extreme conditions of low and high ionic concentrations, respectively, is illustrated in Figure 4. Furthermore, Figure 5 categorizes the measured performance as aligning with either the Evian or seawater profiles mainly at a frequency higher than 50 KHz. Total dissolved solids (TDS) and total ion concentration play a crucial role in modulating the phase and magnitude of bioimpedance, as observed in the lumped element parameters. These factors impact both the resistive (conductive) and capacitive components of bioimpedance. Table 2 summarizes the extracted lumped element model parameters for each analyzed sample.

Table 2.
Extracted circuit model parameters and elements.
4. Water Quality Classification
Now, we shift our focus to demonstrating the effectiveness of the proposed model in assessing water quality. As previously mentioned, the term “quality” refers to its suitability for outdoor use, irrigation, and drinking, as well as seawater designated for non-consumptive purposes. The circuit element parameters listed in Table 2 play a crucial role in determining water quality. Notably, this approach incorporates inductance (L) and capacitance (C), as they provide valuable sensitivity in detecting variations in water quality. The assessment of water quality is based on these parameters, where higher water quality corresponds to lower inductance (L), higher capacitance (C), and the highest Rs, whereas lower water quality is indicated by higher inductance, lower capacitance, and the lowest Rs. Therefore, the first rows in Table 2 are classified as the worst quality, i.e., seawater samples. Meanwhile, the last seven rows, in addition to the fourth row, are classified as the best quality, i.e., drinkable water. The experimental results and data presented empirically in Table 2 for drinkable water are defined as follows: Inductance (L) should be less than 30 nH, capacitance (C) should exceed 30 pF, and solution resistance (Rs) should be greater than 150 ohms. For seawater, inductance (L) should be higher than 100 nH, capacitance (C) should less than 1 pF, and solution resistance (Rs) should be lower than 10 ohms. If these conditions are not met, the water should be designated for irrigation and outdoor use.
Impedance measurements were conducted on three samples from each type of water, and the results showed variations of 3% for seawater, 10% for groundwater, and 3% for bottled water. These variations reflect the homogeneity of the water samples, where seawater and bottled water demonstrated more consistent impedance values due to their uniform composition. In contrast, groundwater exhibited higher variability, likely due to its heterogeneous nature, which can result from varying mineral content, dissolved solids, and other impurities commonly present in groundwater sources.
5. Sensitivity Study
A dilution experiment was conducted using seawater and deionized water to demonstrate the sensitivity of the system. Figure 6 presents the measured impedance magnitude and phase as a function of frequency for seawater and its dilutions, with the corresponding equivalent circuit parameters summarized in Table 3. While the impedance magnitude exhibits only minor variation across different dilution levels, indicating a relatively stable bulk resistance, the phase response shows pronounced shifts, particularly in the mid- to high-frequency range. This highlights the greater sensitivity of phase measurements to changes in ionic concentration and interfacial polarization. The limited variation in magnitude suggests that the bulk resistive path of the solution remains largely unaffected by moderate dilution. In contrast, the enhanced phase sensitivity likely stems from changes in interfacial polarization, double-layer capacitance, and alterations in the system’s effective time constant.
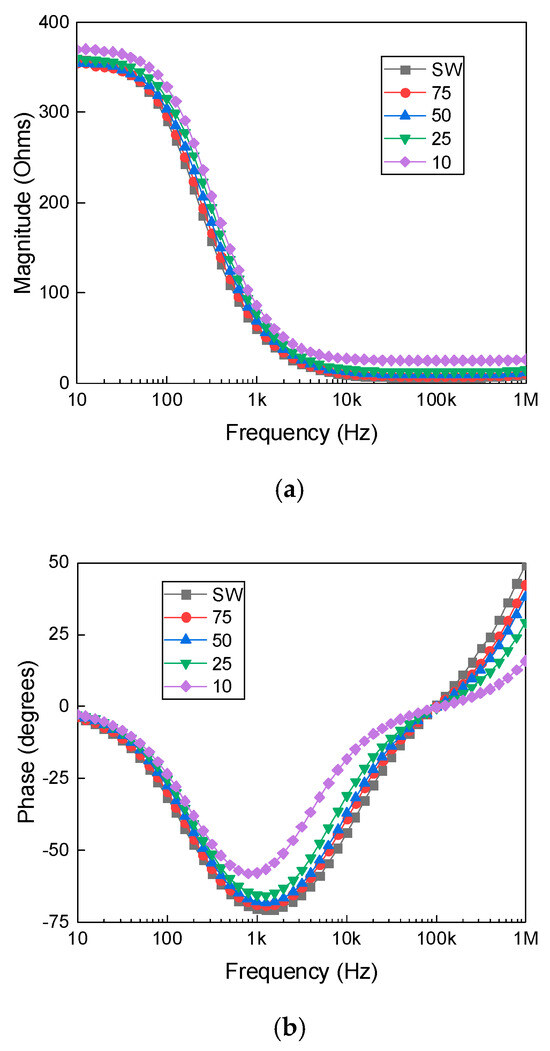
Figure 6.
Impedance magnitude (a) and phase (b) as a function of frequency for seawater (SW) and its dilutions with deionized water at 75%, 50%, 25%, and 10% concentrations.

Table 3.
Extracted equivalent circuit parameters for the seawater dilution.
Based on the classification criteria, the seawater dilutions exhibit electrical characteristics unsuitable for potable water. While lower concentrations slightly improve the solution resistance (Rs), the inductance (L) remains high and capacitance (C) remains significantly low, placing all dilutions outside the drinkable range. The 75% and 100% seawater samples clearly align with the worst quality category, while the more diluted samples may be more appropriate for irrigation or outdoor use but not for direct consumption.
Finally, the aim of this study is to utilize impedance-based measurements to classify water quality electrically, eliminating the need for subjective human intervention, such as taste testing or user preferences. Traditional water quality assessments often rely on sensory perception or chemical testing, which can introduce variability, inconsistency, and potential bias. By leveraging electrical impedance spectroscopy (EIS), this approach enables an objective, automated, and quantitative classification of water quality. By removing subjective evaluation criteria, this study advances the field of electrical water quality analysis and provides a scientifically robust, technology-driven approach to water classification.
6. Discussions
The electrical impedance profiles and lumped-element model parameters obtained in this study (Table 2) demonstrate strong capability to classify different water sources (bottled, groundwater, and seawater) based on their physicochemical signatures. This holistic approach contrasts with methods reported in previous works. Wu et al. [16] employed ICP-OES for heavy metal detection in irrigation water. While their method provides high accuracy for targeted elements, it requires extensive sample preparation and laboratory infrastructure, limiting real-time or field applicability. In contrast, our impedance-based method achieves 100% accuracy in classifying natural water samples without any chemical pretreatment, as demonstrated in Figure 5 and Figure 6. Agberien and Örmeci [17] used UV-visible spectrophotometry to monitor cyanobacteria through pigment-based optical signatures. Although effective for detecting specific biological contaminants, it does not provide a comprehensive assessment of ionic content or overall potability. Our results, on the other hand, correlate directly with total ionic composition, as verified by ICP-MS measurements (Table 1), enabling broader water quality classification. Similarly, Bifano et al. [19] demonstrated the use of electrical impedance spectroscopy combined with support vector machines to detect microplastics in water. Their focus was on particulate detection and not on ion-based potability assessment. In our study, impedance magnitude and phase variations (Figure 5) clearly differentiate samples with different ionic strengths, supporting robust potability classification. Houssin et al. [26] utilized EIS with interdigitated electrodes to detect parasites, emphasizing specific biological identification. In contrast, our equivalent circuit approach (Figure 3 and Table 2) captures both resistive and capacitive elements reflective of overall physicochemical properties, providing a non-targeted, comprehensive water quality evaluation. A clear correlation is observed between the electrical parameters extracted in Table 2 and the ionic composition data presented in Table 1, particularly for seawater and closely related groundwater samples. The observed variations within each group (groundwater and bottled water) are likely influenced by additional unmeasured constituents, such as trace metals or organic matter, which were not included in the current ICP analysis. Recognizing this, future work could incorporate a broader range of chemical analyses to capture these components and further refine the classification accuracy of the proposed method.
By integrating these comparisons, our results underscore the novelty and practical utility of the proposed impedance-based method. The approach is not only non-invasive and label-free but also capable of rapid on-site assessments, addressing a critical gap left by conventional optical and chemical techniques.
Furthermore, compared to conventional water quality testing methods, the proposed impedance spectroscopy approach offers several advantages. In terms of accuracy, the method achieved 100% correct classification of samples from different sources (bottled, groundwater, and seawater), as demonstrated by the results. Regarding sensitivity, the technique was able to detect compositional changes as low as 10%, as shown in the sensitivity study (Section 5). This level of sensitivity is comparable to, and in some cases exceeds, that of traditional chemical or spectroscopic methods, which often require more complex sample preparation and longer analysis times. From a practical use perspective, impedance spectroscopy provides a rapid, label-free, and non-destructive assessment using relatively simple and portable equipment. The system only requires an electrical impedance analyzer connected to a processor or microcontroller with a display, making it feasible for field deployment and real-time monitoring. These advantages position the technique as a promising alternative or complementary tool to existing water quality testing methods.
Moreover, we would like to emphasize that the proposed circuit model was developed and validated using natural water samples collected from real sources, rather than laboratory-prepared solutions with isolated or overlapping ionic species (e.g., CaCl2 or NaCl alone). The primary objective of this study is to discriminate between naturally occurring water types (bottled, groundwater, and seawater) and assess their potability using lumped element parameters, rather than to identify individual ionic contaminants. Nevertheless, certain bottled water samples, such as zero-sodium variants, which represent adjusted compositions, were still effectively detected and distinguished by our approach. Future studies could expand on this framework by integrating additional measurements or combining it with advanced chemometric or machine learning methods to resolve more subtle compositional overlaps if needed.
It is worth noting that the standard electrode holder used in typical impedance spectroscopy setups generally exhibits inherent capacitive behavior, which can limit measurement accuracy and sensitivity. In contrast, the customized holder developed in this work demonstrates purely resistive characteristics when unloaded. Upon loading with water samples, the holder’s response shifts to either capacitive or inductive behavior, depending on the sample’s ionic content and dielectric properties. This transition enables the system to capture subtle differences among various water types more effectively, thus improving overall sensitivity and selectivity. The enhanced measurement performance of the customized holder has been experimentally validated, as presented in Figure 2. In this study, all impedance measurements were conducted at room temperature (~27 °C) to maintain consistency. We acknowledge that temperature fluctuations, including measurements at lower temperatures such as 4 °C, could potentially affect the dielectric properties of water and, consequently, the extracted circuit parameters. However, due to time and resource constraints, these temperature-dependent effects were not investigated in the current work. Future studies are planned to systematically explore the influence of sample temperatures on measurement precision and model consistency, and to report these findings in future work.
Finally, the proposed approach has been developed with reference to WHO drinking water guidelines and has demonstrated the ability to reliably distinguish between potable and non-potable water. All tested samples were real and obtained from various natural sources with diverse compositions, reflecting practical, real-world conditions. Importantly, none of the samples were artificially prepared or modified, ensuring that the results directly represent natural water quality variations. The method’s straightforward, non-invasive nature makes it highly practical for field applications, supporting rapid, on-site assessments without the need for extensive laboratory infrastructure.
7. Conclusions
The study emphasizes the crucial need for accurate water quality monitoring, especially given the growing challenges posed by climate change, pollution, and resource mismanagement, demonstrating that water quality is fundamental for sustainable human development. The findings confirm that Electrical Impedance Spectroscopy (EIS) is an effective and non-invasive method for assessing water quality in various real-world settings. Its portability and precision make it particularly useful for environmental monitoring. An optimized impedance-based circuit model was developed and shown to accurately capture the resistive, inductive, and capacitive properties of different water sources, including seawater, groundwater, and bottled water. This model effectively analyzes the influence of varying ion concentrations and suspended materials on water quality. Inductively Coupled Plasma (ICP) measurements complemented the impedance findings, confirming significant differences in ion content across the samples and further validating the model’s accuracy. Overall, the proposed method offers a promising tool for comprehensive water quality analysis, supporting the sustainable management of water resources in diverse environments.
Author Contributions
O.A. and R.A.I. were responsible for chemical measurements and analysis. M.A.A. was responsible for electrical measurements and analysis. M.A.A. and A.H.-A. supervised the project. All authors have read and agreed to the published version of the manuscript.
Funding
This research was funded by the University of Khorfakkan (UKF) through the University Research Board (URB) under project reference V.C.A.A./T.D. 0002/2023, and additionally supported by the internal grant #12N132 from the United Arab Emirates University.
Data Availability Statement
Dataset available on request from the authors.
Conflicts of Interest
The authors declare no conflicts of interest.
References
- Lambert, L.A. Water, State Power, and Tribal Politics in the GCC: The Case of Kuwait and Abu Dhabi. SSRN Electron. J. 2014. [Google Scholar] [CrossRef]
- Gleick, P.H. Basic water requirements for human activities: Meeting basic needs. Water Int. 1996, 21, 83–92. [Google Scholar] [CrossRef]
- Amuthakkannan, R.; Al Yaqoubi, M.H.A. Development of IoT Based Water Pollution Identification to Avoid Destruction of Aquatic Life and to Improve the Quality of Water. Int. J. Eng. Trends Technol. 2023, 71, 355–370. [Google Scholar] [CrossRef]
- Bassem, S.M. Water pollution and aquatic biodiversity. Biodivers. Int. J. 2020, 4, 10–16. [Google Scholar]
- Dulsat-Masvidal, M.; Ciudad, C.; Infante, O.; Mateo, R.; Lacorte, S. Water pollution threats in important bird and biodiversity areas from Spain. J. Hazard. Mater. 2023, 448, 130938. [Google Scholar] [CrossRef]
- Heidari, A.; Kumar, V.; Keshavarzi, A. Appraisal of metallic pollution and ecological risks in agricultural soils of Alborz province, Iran, employing contamination indices and multivariate statistical analyses. Int. J. Environ. Health Res. 2021, 31, 607–625. [Google Scholar] [CrossRef]
- Saravanakumar, K.; SivaSantosh, S.; Sathiyaseelan, A.; Naveen, K.V.; AfaanAhamed, M.A.; Zhang, X.; Priya, V.V.; Mubarak Ali, D.; Wang, M.H. Unraveling the hazardous impact of diverse contaminants in the marine environment: Detection and remedial approach through nanomaterials and nano-biosensors. Hazard. Mater. 2022, 433, 128720. [Google Scholar] [CrossRef]
- Ibrahim, Y.; Ismail, R.A.; Ogungbenro, A.; Pankratz, T.; Banat, F.; Arafat, H.A. The sociopolitical factors impacting the adoption and proliferation of desalination: A critical review. Desalination 2021, 498, 114798. [Google Scholar] [CrossRef]
- Uddin, M.G.; Nash, S.; Olbert, A.I. A review of water quality index models and their use for assessing surface water quality. Ecol. Indic. 2021, 122, 107218. [Google Scholar] [CrossRef]
- Chowdhury, M.A.Z.; Banik, S.; Uddin, B.; Moniruzzaman, M.; Karim, N.; Gan, S.H. Organophosphorus and carbamate pesticide residues detected in water samples from paddy and vegetable fields of Savar and Dhamrai, Bangladesh. Int. J. Environ. Res. Public. Health 2012, 9, 3318–3329. [Google Scholar] [CrossRef]
- Manivannan, V.; Elango, L. Seawater intrusion and submarine groundwater discharge along the Indian coast. Environ. Sci. Pollut. Res. 2019, 26, 31592–31608. [Google Scholar] [CrossRef]
- Syeed, M.M.M.; Hossain, M.S.; Karim, M.R.; Uddin, M.F.; Hasan, M.; Khan, R.H. Surface water quality profiling using the water quality index, pollution index and statistical methods: A critical review. Environ. Sustain. Indicat. 2023, 18, 100247. [Google Scholar] [CrossRef]
- Karim, K.; Guha, S.; Beni, R. Comparative Analysis of Chemical, Physical and Biological Contaminants in Drinking Water in Various Developed Countries around the World. J. Water Resour. Prot. 2020, 12, 1–15. [Google Scholar] [CrossRef]
- Rocha, F.C.; Andrade, E.M.; Lopes, F.B. Water quality index calculated from biological, physical and chemical attributes. Environ. Monit. Assess. 2015, 187, 4163. [Google Scholar] [CrossRef]
- Vasanthavigar, M.; Srinivasamoorthy, K.; Vijayaragavan, K.; Ganthi, R.R.; Chidambaram, S.; Anandhan, P.; Manivannan, R.; Vasudevan, S. Application of water quality index for groundwater quality assessment: Thirumanimuttar sub-basin, Tamilnadu, India. Environ. Monit. Assess. 2010, 171, 595–609. [Google Scholar] [CrossRef]
- Wu, Y.; Gao, X.; Li, Y. Application of inductively coupled plasma optical emission spectrometer in water quality monitoring. Desalination Water Treat. 2023, 314, 1–10. [Google Scholar] [CrossRef]
- Agberien, A.V.; Örmeci, B. Monitoring of cyanobacteria in water using spectrophotometry and first derivative of absorbance. Water 2020, 12, 124. [Google Scholar] [CrossRef]
- Thomas, O.; Burgess, C. UV-Visible Spectrophotometry of Water and Wastewater; Elsevier Science: Amsterdam, The Netherlands, 2017. [Google Scholar]
- Bifano, L.; Meiler, V.; Peter, R.; Fischerauer, G. Detection of microplastics in water using electrical impedance spectroscopy and support vector machines. Tech. Mess. 2023, 90, 374–387. [Google Scholar] [CrossRef]
- Giao, N.T.; Nhien, H.T.H. Application of GIS and Multi-Criteria Statistical Techniques in Assessing Water Quality in the Coastal Province of Vietnamese Mekong Delta. Appl. Environ. Res. 2021, 43, 17–33. [Google Scholar] [CrossRef]
- Lasia, A. Electrochemical Impedance Spectroscopy and Its Applications, 1st ed.; Springer: Berlin/Heidelberg, Germany, 2014. [Google Scholar] [CrossRef]
- Lee, M.H.; Won, J.; Chung, S.; Kim, S.; Park, S.S. Rapid detection of ionic contents in water through sensor fusion and convolutional neural network. Chemosphere 2022, 294, 133746. [Google Scholar] [CrossRef]
- Pía Canales, C. Electrochemical impedance spectroscopy and its applications. In 21st Century Nanostructured Materials—Physics, Chemistry, Classification, and Emerging Applications in Industry, Biomedicine, and Agriculture; IntechOpen: London, UK, 2022. [Google Scholar] [CrossRef]
- Widodo, C.S.; Sela, H.; Santosa, D.R. The effect of NaCl concentration on the ionic NaCl solutions electrical impedance value using electrochemical impedance spectroscopy methods. AIP Conf. Proc. 2018, 2021, 050003. [Google Scholar] [CrossRef]
- Nagaraj, V.; Jacobs, M.; Vattipalli, K.; Annam, V.; Prasad, S. Nanochannel-based electrochemical sensor for the detection of pharmaceutical contaminants in water. Environ. Sci. Process. Impacts 2014, 16, 135–140. [Google Scholar]
- Houssin, T.; Follet, J.; Follet, A.; Dei-Casa, E.; Senez, V. Label-free analysis of water-polluting parasite by electrochemical impedance spectroscopy. Biosens. Bioelectron. 2010, 25, 1122–1129. [Google Scholar]
- Yang, L.; Li, Y.; Erf, G. Interdigitated Array Microelectrode-Based Electrochemical Impedance Immunosensor for Detection of Escherichia coli O157:H7. Anal. Chem. 2024, 76, 1107–1113. [Google Scholar]
- Brosel-Oliu, S.; Ferreira, R.; Uria, N.; Abramova, N.; Gargallo, R.; Muñoz-Pascual, F.-X. Novel impedimetric aptasensor for label-free detection of Escherichia coli O157:H7. Sens. Actuators B Chem. 2018, 255, 2988–2995. [Google Scholar]
- Fernández-Turiel, J.L.; Llorens, J.F.; López-Vera, F.; Gómez-Artola, C.; Morell, I.; Gimeno, D. Strategy for water analysis using ICP-MS. Fresenius’ J. Anal. Chem. 2000, 368, 601–606. [Google Scholar] [CrossRef]
- GenePulser Cuvette from BioRad. Available online: https://www.bio-rad.com/ (accessed on 1 August 2025).
- Gamry Reference 3000. Available online: https://www.gamry.com/ (accessed on 1 August 2025).
- Baptista, J.P.; Matos, T.; Lopes, S.F.; Faria, C.L.; Magalhaes, V.H.; Vieira, E.M.F.; Martins, M.S.; Goncalves, L.M.; Brito, F.B. A four-probe salinity sensor optimized for long-term autonomous marine deployments. In Proceedings of the OCEANS 2019—Marseille, Marseille, France, 17–20 June 2019; pp. 1–5. [Google Scholar] [CrossRef]
- Hattab, G.; El-Tarhuni, M.; Al-Ali, M.; Joudeh, T.; Qaddoumi, N. An Underwater Wireless Sensor Network with Realistic Radio Frequency Path Loss Model. Int. J. Distrib. Sens. Netw. 2013, 9, 188–192. [Google Scholar] [CrossRef]
- Gonzalez-Tovar, E.; Jimenez-Angeles, F.; Messina, R.; Lozada-Cassou, M. A new correlation effect in the Helmholtz and surface potentials of the electrical double layer. J. Chem. Phys. 2004, 120, 9782–9792. [Google Scholar]
Disclaimer/Publisher’s Note: The statements, opinions and data contained in all publications are solely those of the individual author(s) and contributor(s) and not of MDPI and/or the editor(s). MDPI and/or the editor(s) disclaim responsibility for any injury to people or property resulting from any ideas, methods, instructions or products referred to in the content. |
© 2025 by the authors. Licensee MDPI, Basel, Switzerland. This article is an open access article distributed under the terms and conditions of the Creative Commons Attribution (CC BY) license (https://creativecommons.org/licenses/by/4.0/).
