Article

Response of Grain Yield to Extreme Precipitation in Major Grain-Producing Areas of China Against the Background of Climate Change—A Case Study of Henan Province

1
School of Politics and Public Administration, Qinghai Minzu University, Xining 810007, China
2
State Key Laboratory of Soil Erosion and Dry Land Farming on the Loess Plateau, Institute of Soil and Water Conservation, Northwest A&F University, Yangling 712100, China
3
Qinghai Provincial Climate Center, Xining 810007, China
4
Upper and Middle Yellow River Bureau, YRCC, Xi’an 710016, China
5
Key Laboratory of Ecological Safety and Sustainable Development in Arid Lands, Northwest Institute of Eco-Environment and Resources, Chinese Academy of Sciences, Lanzhou 730000, China
*
Authors to whom correspondence should be addressed.
Water 2025, 17(15), 2342; https://doi.org/10.3390/w17152342
Submission received: 8 June 2025 / Revised: 14 July 2025 / Accepted: 31 July 2025 / Published: 6 August 2025
(This article belongs to the Special Issue Soil Erosion and Soil and Water Conservation, 2nd Edition)

Abstract

Based on the panel data of daily meteorological stations and winter wheat yield in Henan Province from 2000 to 2023, this study comprehensively used the Mann–Kendall trend test, wavelet coherence analysis (WTC), and other methods to reveal the temporal and spatial evolution of extreme precipitation and its multi-scale stress mechanism on grain yield. The results showed the following: (1) Extreme precipitation showed the characteristics of ‘frequent fluctuation-gentle trend-strong spatial heterogeneity’, and the maximum daily precipitation in spring (RX1DAY) showed a significant uplift. The increase in rainstorm events (R95p/R99p) in the southern region during the summer is particularly prominent; at the same time, the number of consecutive drought days (CDDs > 15 d) in the middle of autumn was significantly prolonged. It was also found that 2010 is a significant mutation node. Since then, the synergistic effect of ‘increasing drought days–increasing rainstorm frequency’ has begun to appear, and the short-period coherence of super-strong precipitation (R99p) has risen to more than 0.8. (2) The spatial pattern of winter wheat in Henan is characterized by the three-level differentiation of ‘stable core area, sensitive transition zone and shrinking suburban area’, and the stability of winter wheat has improved but there are still local risks. (3) There is a multi-scale stress mechanism of extreme precipitation on winter wheat yield. The long-period (4–8 years) drought and flood events drive the system risk through a 1–2-year lag effect (short-period (0.5–2 years) medium rainstorm intensity directly impacted the production system). This study proposes a ‘sub-scale governance’ strategy, using a 1–2-year lag window to establish a rainstorm warning mechanism, and optimizing drainage facilities for high-risk areas of floods in the south to improve the climate resilience of the agricultural system against the background of climate change.

1. Introduction

Extreme precipitation refers to meteorological events where the precipitation significantly exceeds the normal climate over a specific time scale [1]. Global warming is driving the hydrological cycle, and extreme precipitation events are showing a significant upward trend in frequency, intensity, and spatial heterogeneity [2,3,4,5]. The upward trend of extreme precipitation is particularly significant in the monsoon region [6,7,8]. Precipitation pattern changes and extreme precipitation events affect agricultural production and water resource distribution, aggravate the risk of food and water shortage, and pose a major threat to food security [9,10,11]. A quantitative analysis of the world’s major agricultural regions shows that climate change has caused global maize and wheat production losses of 3.8% and 5.5%, respectively, between 1980 and 2008, with extreme climate events accounting for 18–43% [12,13]. Therefore, the study of climate change on grain yield has attracted much attention [14,15].
Most of China is located in the monsoon region, so the increasing frequency of extreme weather is profoundly reshaping the agricultural production environment in China under the challenge of global climate change affecting agriculture. The frequency of extreme precipitation in China has increased significantly, especially in the western arid region, the southwest, and the eastern and southern regions [16,17,18]. Drought events have also intensified. Since the 20th century, 185 regional droughts have occurred in China, of which 16 have reached the ‘very serious’ level [19,20,21]. The impact of this change on agro-ecosystems has a dual nature: on the one hand, frequent extreme high temperature events directly inhibit crop photosynthesis [22]; on the other hand, the spatial differentiation of drought and flood disasters is aggravated by the alienation of precipitation patterns. It has been recorded that 52.6% of meteorological stations in China show an increasing trend of extreme precipitation, while 61.6% of meteorological stations show an increasing trend of drought events [23]. This climate stress has threatened the foundation of food security. If no adaptation measures are taken, the yield of major crops may decline by 37% in the second half of the 21st century [24].
Through the regional study of extreme precipitation and grain production, it has been found that there is significant regional heterogeneity between them [25,26,27]. It was found that the yield of maize and wheat was more sensitive to the change in precipitation intensity, while rice was more sensitive to the change in precipitation duration [28,29]. Extreme rainfall resulted in a reduction in rice yield in China by about 1/12, with a loss of 8.3%, 8.6%, and 7.6% for single-cropping rice, early rice, and late rice, respectively [30]. The grain yield in North China, Southwest China, and Southeast China was negatively correlated with the frequency and intensity of EAD, that is, when the frequency and intensity of EAD were higher, the grain yield was lower [31]. In North China, extreme precipitation events have a significant impact on the growth and yield of winter wheat. The frequency and intensity of extreme precipitation events increase, especially in summer and autumn, posing a threat to wheat growth and yield [32].
Related research on plot scale of extreme precipitation and grain production. It was found that extreme precipitation impacted grain crop production through three-dimensional paths of physical damage, physiological stress, and ecological interference. Continuous flooding for more than 10 days can lead to the deoxidation of rice roots. The lodging rate caused by flooding at heading and flowering stage is 84%, and the yield reduction rate is 5–84% [33]. Waterlogging in the germination period of maize will irreversibly damage the photosynthetic membrane structure, even if the later re-irrigation still causes more than a 30% yield reduction [34]. Rapid evaporation after short-term heavy rainfall aggravates the alternation of dry and wet soil and induces secondary drought. Studies have shown that the yield of maize decreased by 39% when the water decreased by 40%, which was higher than that of wheat with a 20% decrease. The key mechanism is that stomatal closure leads to a decrease in CO2 assimilation rate and the accumulation of reactive oxygen species [35]. Water erosion destroyed the soil aggregate structure, the nitrogen leaching rate increased by 50%, and phosphorus availability fluctuated ‘first increased and then decreased’, while continuous waterlogging reduced soil pH and inhibited nutrient mineralization [36].
The related research on extreme precipitation and grain production is divided into two scales: regional scale and plot scale. The existing regional-scale research has a rough time scale, such as the use of total precipitation in the growing season, which covers the sensitivity difference in key growth stages (such as the heading and filling stages) [37]. Extreme precipitation events mostly use qualitative descriptions such as ‘rainstorm’ and ‘flood’ and a lack of quantitative criteria for indicators [35,38]. The existing block-scale studies have physical defects of mainstream models. DSSAT, APSIM, and other models only indirectly simulate drought/waterlogging through soil water content, ignoring the direct physical damage of extreme precipitation [33]. The matching degree of natural conditions is low, and it is difficult to reproduce the synergistic effect of natural extreme events by the artificial simulation of precipitation [33,39]. Therefore, it is of great significance to explore the response of grain yield to extreme precipitation in China’s major grain-producing areas.
As a typical major grain-producing area in China, Henan Province’s agricultural production is directly related to the overall situation of national food security. In 2022, the total grain output of the province will reach 135.787 billion kg, accounting for 10% of the total output of the country. The proportion of grain is particularly prominent, with wheat production accounting for 28% of the country and corn accounting for 9% [40,41]. Henan Province covers an area of 167,000 square kilometers, with plains accounting for more than 55%, providing a topographic basis for large-scale grain production [40]. Henan is located in the temperate–subtropical monsoon transition zone, so the seasonal distribution of precipitation is uneven [42], and the increase in precipitation variability in recent years [43,44] makes it an ideal sample for studying precipitation extremes. The development of cultivated land resources in Henan is close to the threshold, and the adaptation space is limited. The growth period of winter wheat in Henan Province (October to May of the next year) overlaps with the pre-flood season, and the key growth stages (such as the heading–filling stage) are extremely sensitive to water stress [45]. Extreme precipitation can directly destroy root structures and nutrient absorption through waterlogging and soil erosion [46,47,48,49]. Therefore, based on the daily precipitation data of meteorological stations in Henan Province from 2000 to 2023 and the panel data of winter wheat yield in the county, this study uses the extreme precipitation index to systematically analyze the spatial and temporal evolution characteristics of winter wheat yield and seasonal extreme precipitation. Through wavelet analysis, the Mann–Kendall trend test, and other methods, the response threshold of winter wheat yield to extreme precipitation index in Henan was revealed, and the zoning response strategy was put forward.

2. Materials and Methods

2.1. Research Area Summary

Henan Province is located in the middle and lower reaches of the Yellow River in central and eastern China (31°23′–36°22′ N, 110°21′–116°39′ S), with a total area of about 167,000 square kilometers. It is China’s most populous province. It is a key transportation and economic hub connecting the east and west of China with the north and south. Its topographic features are ‘high in the west and low in the east, north Tannan concave’. The western and northwestern parts are mainly mountainous areas in western Henan (Funiu Mountain, etc.) and the landscape is mainly mountainous and hilly; the vast central and eastern regions are flat plains formed by the alluvial deposits of the Yellow River and the Huaihe River (the core area of the North China Plain), which are mostly below 200 m above sea level and are the core areas of population and economic activities in the province; and the southern Tongbai Mountain and Dabie Mountain constitute the main framework of the mountainous areas in southern Henan. The climate of Henan Province belongs to the monsoon climate at the transition from a warm temperate zone to a subtropical zone. The four seasons are distinct and the rain and heat are in the same period. The average annual temperature is 12 °C–16 °C (decreasing from south to north), and the average annual precipitation is 600–1000 mm (more in the south and less in the north, with about 60% concentrated in summer). Droughts occur frequently in winter and spring and the area is vulnerable to floods in summer and autumn. The main rivers are the Yellow River, Huaihe River, Yangtze River (Hanjiang River tributary), and Haihe River. The main stream of the Yellow River runs through the north, and its ‘overground suspended river’ characteristics are significant. The Huaihe River system covers most of the central and southern regions. However, the total amount of water resources in the province is limited and the spatial and temporal distribution is uneven. As a traditional ‘Central Plains granary’, Henan Province has a prominent agricultural status. Among them, wheat production accounts for 28% of the country’s total output and corn production accounts for 9% (Figure 1b).

2.2. Data

The daily precipitation data from 2000 to 2023 in this study were based on the daily precipitation data of NOAA global stations (Index of https://www.ncei.noaa.gov/data/global-summary-of-the-day/archive/, accessed on 2 March 2024). The time span of the data is more than 70 years, far exceeding most satellite products [50,51]. NOAA data has the advantages of multi-type site collaborative observations, high-density regional advantages, and multi-source verification [52,53,54]. Standardized, high-precision, long-term consistent and spatially representative precipitation observation data and extreme weather event records are crucial for accurately analyzing the frequency, intensity, spatial and temporal patterns, long-term trends, and climate-driving mechanism of extreme precipitation events, and for verifying model simulation and disaster risk research.
The V2 dataset of the 30 m resolution planting distribution of winter wheat in China from 2001 to 2023 (2 March 2024) [55] was used for wheat planting data. Based on the time-weighted dynamic time planning method and the winter wheat crop index, the 30 m spatial resolution winter wheat planting distribution map of 11 provinces in China (planting area accounts for more than 99% of China’s winter wheat area) from 2001 to 2023 was produced by using the 30 m spatial resolution winter wheat planting distribution V2 dataset in China. Verified by field survey samples and Google Earth samples, the overall accuracy of the winter wheat identification map reached 91.17%, while the producer accuracy and user accuracy were 91.6% and 90.92% [56,57,58].
The grain yield data used in this study are derived from the panel data of the county-level statistical yearbook of Henan Province from 2000 to 2023. This dataset covers the statistical information of grain production in each county-level administrative region of Henan Province during the above time period and has high integrity and accuracy. By integrating and analyzing these panel data, this study aims to deeply analyze the dynamic characteristics of grain production in Henan Province and the driving factors behind it and provide a scientific basis for the formulation and optimization of regional food security policies.

2.3. Method

2.3.1. Extreme Precipitation Index

The purpose of this study is to describe the seasonal characteristics of extreme precipitation in Henan Province, China. The extreme precipitation index system of the International Expert Team on Climate Change Detection and Indices has been widely used in the study of extreme precipitation. The system covers 11 indexes (Table 1). These indicators include extreme precipitation intensity index, duration index, and threshold index, which comprehensively reflect the intensity and frequency of seasonal extreme precipitation [1,59].

2.3.2. Mann–Kendall + False Discovery Rate, FDR

The Mann–Kendall (M-KII) trend test is a non-parametric statistical method for the time series trend analysis of extreme precipitation indicators. This method does not need to assume that the data obey a specific distribution. In the study of extreme precipitation, the applicability of this method is verified at the national scale, regional scale, and watershed scale [60,61,62]. The specific calculation formula is as follows:
(1)
Firstly, in the case of order, the serial number St corresponding to the time series ai is calculated with n samples.
S t = i = 1 t a i ( t = 1 , 2 , 3 , , i )
a i = { 1 x i > x j , j = 1 , 2 , 3 , , i 0 x i x j , j = 1 , 2 , 3 , , i
(2)
Then determine the mean and variance of St as follows:
E S t = t ( t 1 ) 4 Var S t = t ( t 1 ) ( 2 t + 5 ) 72
(3)
The calculation of the UFt statistic is as follows:
U F t = S t E S t Var S t
(4)
Finally, the xi time series of n samples are arranged in reverse order as xn, xn−1, …, x1, so as to obtain the reverse sequence of St and UBt as follows:
U B t = U F t ( t = n , n 1 , n 2 , , 1 )
When the UF line passes through the critical value line starting from the intersection of the UF and UB curves, the extreme precipitation index is considered to have changed abruptly.
In the classical framework, |UFk| or |UBk| > 1.96 is considered as a significant mutation at α = 0.05. However, this approach does not consider the multiple comparison inflation caused by the simultaneous testing of 23 time points. To reduce the false discovery rate (FDR), the Benjamini–Hochberg (BH) method was used.
(5)
Converting UFk and UBk (k = 2, …, n) into two-sided p-values, respectively.
p k = 2 [ 1 Φ ( | U F k | ) ]
where Φ is the standard normal distribution function.
(6)
Merge all 2n − 1 p values in ascending order as follows:
p 1 p 2 p m
where m = 2n − 2.
(7)
Given the control level α = 0.05, the threshold sequence τi = /m is calculated. Find the maximum l such that p(l)τl, then all corresponding hypotheses are rejected.
τ i = i α m
where i = 1, 2, 3 …, m.
(8)
The BH-corrected salient points are mapped back to the original timeline as the final mutation time.
p l τ l

2.3.3. CV—Coefficient of Variation

CV, the coefficient of variation, is a statistical index to measure the degree of data dispersion, which reflects the relative dispersion of data, that is, the dispersion CV of each observed value relative to the average value can be used to measure the volatility and stability of yield. CV is an effective tool for grain yield fluctuation analysis, which is suitable for cross-regional or cross-period comparison [63,64]. The specific calculation formula is as follows:
C V = σ μ
σ = a = 1 t ( x a x ¯ ) 2 t 1
where σ denotes the standard deviation and μ denotes the mean value.

2.3.4. Single-Index Wavelet Period

Single-index wavelet periodic analysis is a time series analysis method based on wavelet transformation, which is used to identify and analyze the periodic changes in a time series. The wavelet transform can decompose the time series into components on different time scales, thus revealing the periodic characteristics of extreme precipitation data and grain yield data on different time scales. Single-index wavelet period analysis has become the core tool for non-stationary time series period detection through multi-scale decomposition and time–frequency localization capabilities [65,66]. The calculation formula is as follows:
T = s × t × C
where T is the signal period, S is the dimensionless wavelet scale, and t is the signal sampling interval; C is the wavelet basis correlation constant.

2.3.5. Wavelet Coherence (WTC)

Wavelet coherence is an analysis method based on wavelet transformation. Wavelet coherence reveals the dynamic correlation between extreme precipitation and grain yield in the time–frequency domain [67,68]. The calculation formula is as follows:
R t 2 ( s ) = S s 1 W t x y ( s ) 2 S s 1 W t x ( s ) 2 S s 1 W t y ( s ) 2
where Rt2(s) is the wavelet coherence value of scale s and time point t (range [0, 1]); Wtx(s) and Wty(s) are the continuous wavelet transform (CWT) results of time series x and y at scale s; Wtxy(s) is the cross wavelet transformation (XWT) of x and y, defined as Wtxy(s) = Wtx(s).Wty*(s) (* denotes complex conjugate); S(.) is the time–frequency dual-domain smoothing operator, which is usually the convolution of a Gaussian window function in the time and scale directions.

2.3.6. Cross Wavelet Transform (XWT)

Cross wavelet transformation is a method for analyzing the time–frequency relationship between two time series of extreme precipitation index and grain yield. It combines the idea of wavelet transformation and cross-correlation analysis, and can detect the resonance period of two signals in time and frequency. XWT can effectively capture the multi-scale nonlinear correlation between extreme precipitation and grain yield through time–frequency localization analysis, and it is especially good at identifying transient resonance period and phase dependence [69,70,71]. The calculation formula is as follows:
W x y ( τ , n ) = 1 n W x ( τ , n ) W y * ( τ , n )
P x y ( τ , n ) = W x y ( τ , n )
where Wx(τ, n) is the continuous wavelet transform coefficient of sequence x(t); Wy(τ, n) is the continuous wavelet transform coefficient of sequence y(t); Wy*(τ, n) is the complex conjugate of Wy(τ, n); τ is the time displacement parameter; and n is the scale parameter (frequency dependent) cross wavelet power (XWP).
The Morlet mother wavelet (center frequency ωo = 6) was used in all wavelet analysis. The significance test was completed by 1000 AR (1) red noise Monte Carlo simulations. The threshold was taken at the 95th percentile, and the random seed was fixed at 42 to ensure that the results were repeatable. The black solid line in the figure indicates the cone affected zone (COI) affected by the edge effect. The data other than COI are only for intuitive reference and are not included in the subsequent discussion.

3. Results

3.1. Comparison of Spatial and Temporal Characteristics of Extreme Precipitation in Henan

Based on the meteorological observation data of Henan Province from 2000 to 2023, this study systematically analyzed the extreme precipitation indicators by integrating seasonal-scale time series analysis, spatial distribution patterns, and the Mann–Kendall trend test.
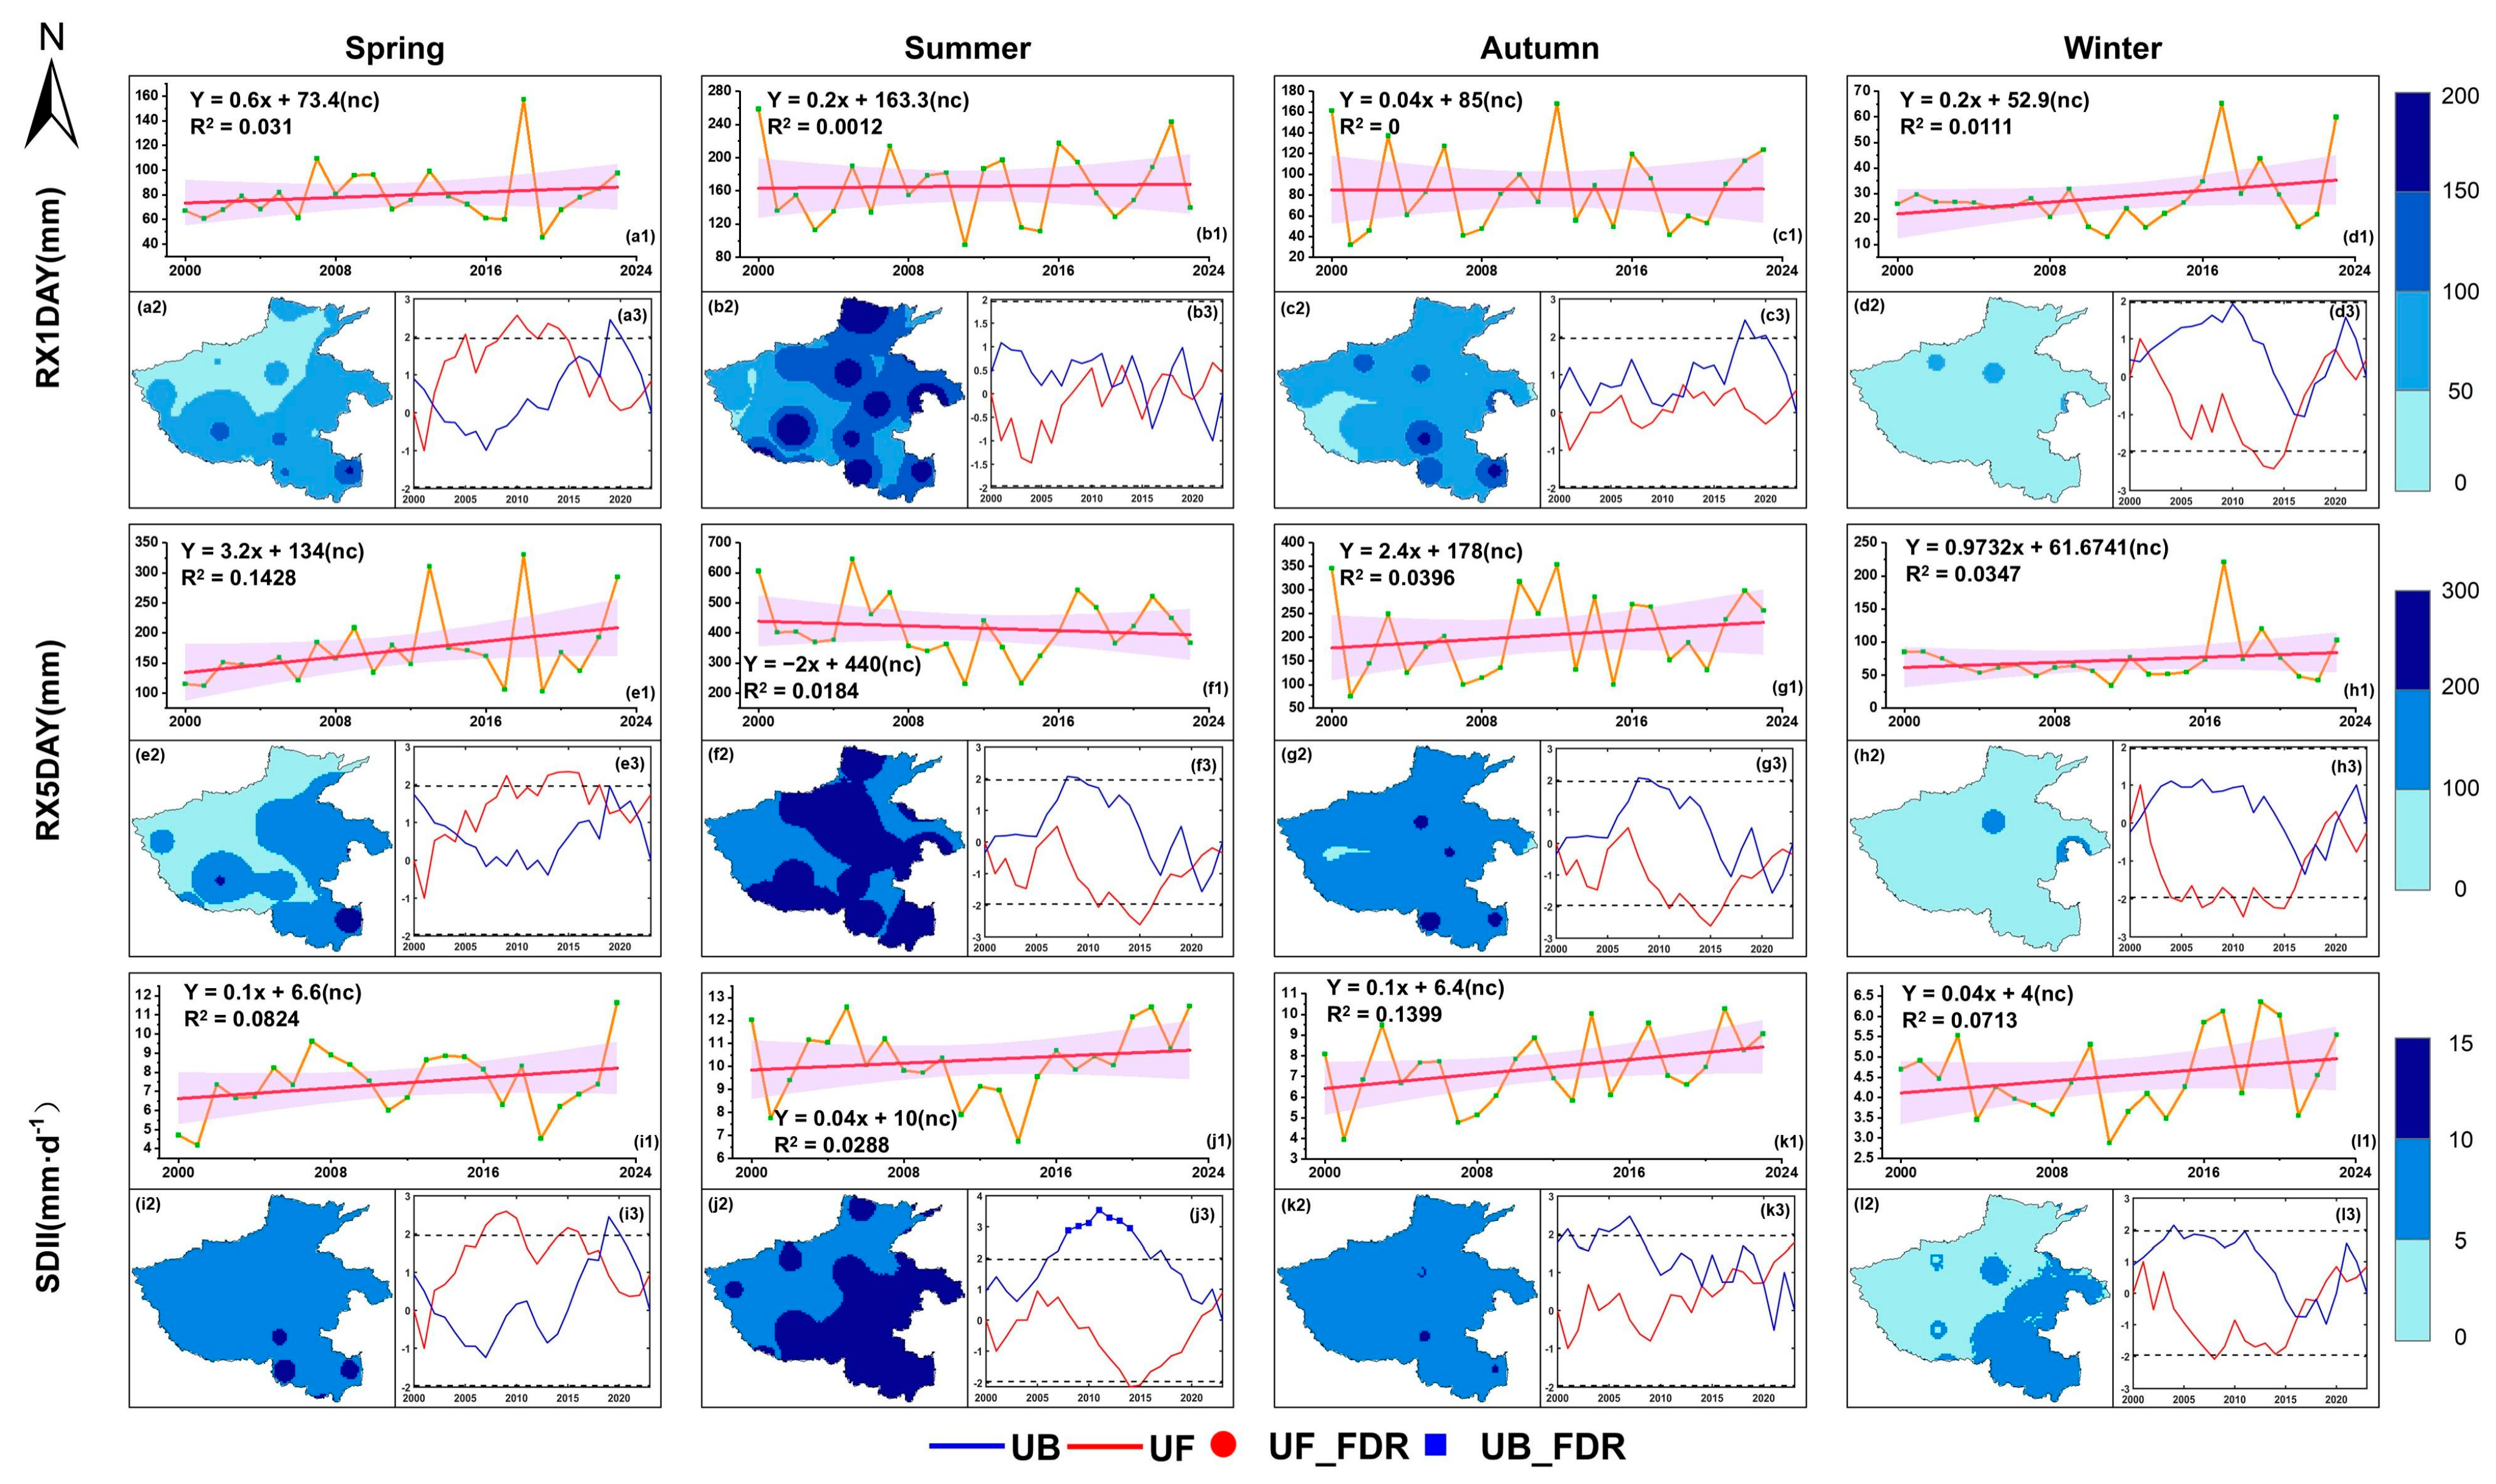
The analysis shows that the time trend and significance of the extreme precipitation intensity index in Henan are as follows: strong interannual volatility, high-frequency oscillation, weak trend leading, and significant spatial differentiation. RX1DAY showed a significant upward trend in spring (slope = 0.6 mm/year) (Figure 2a1); there were local fluctuations in RX5DAY in summer (Figure 2f2); and the weak changes in SDII in winter (Figure 2l1) and spring (Figure 2i2) were not statistically significant. The 95% confidence interval is generally wide, which confirms the strong interannual fluctuation characteristics of extreme precipitation. On the graph, the summer distribution of SDII shows a gradient of high in the south and low in the north (Figure 2j2).
The mutation characteristics are as follows: RX1DAY has an early enhancement signal in spring (UF > 2 in 2010) (Figure 2a3, and experiences a sudden drop around 2010 in winter (UF < −2.5) (Figure 2d3); rX5DAY showed a continuous negative trend in summer (UF long-term < −1) (Figure 2f3) and severe fluctuations in winter (UF amplitude up to 4 units) (Figure 2h3); and the detection of SDII in winter decreased significantly in 2005 (UF < −2.5) (Figure 2l3). The period of 2015–2020 is a common turning point—RX1DAY spring and winter, RX5DAY winter, and SDII summer all have a UF/UB crossover or breakthrough threshold phenomenon at this stage.
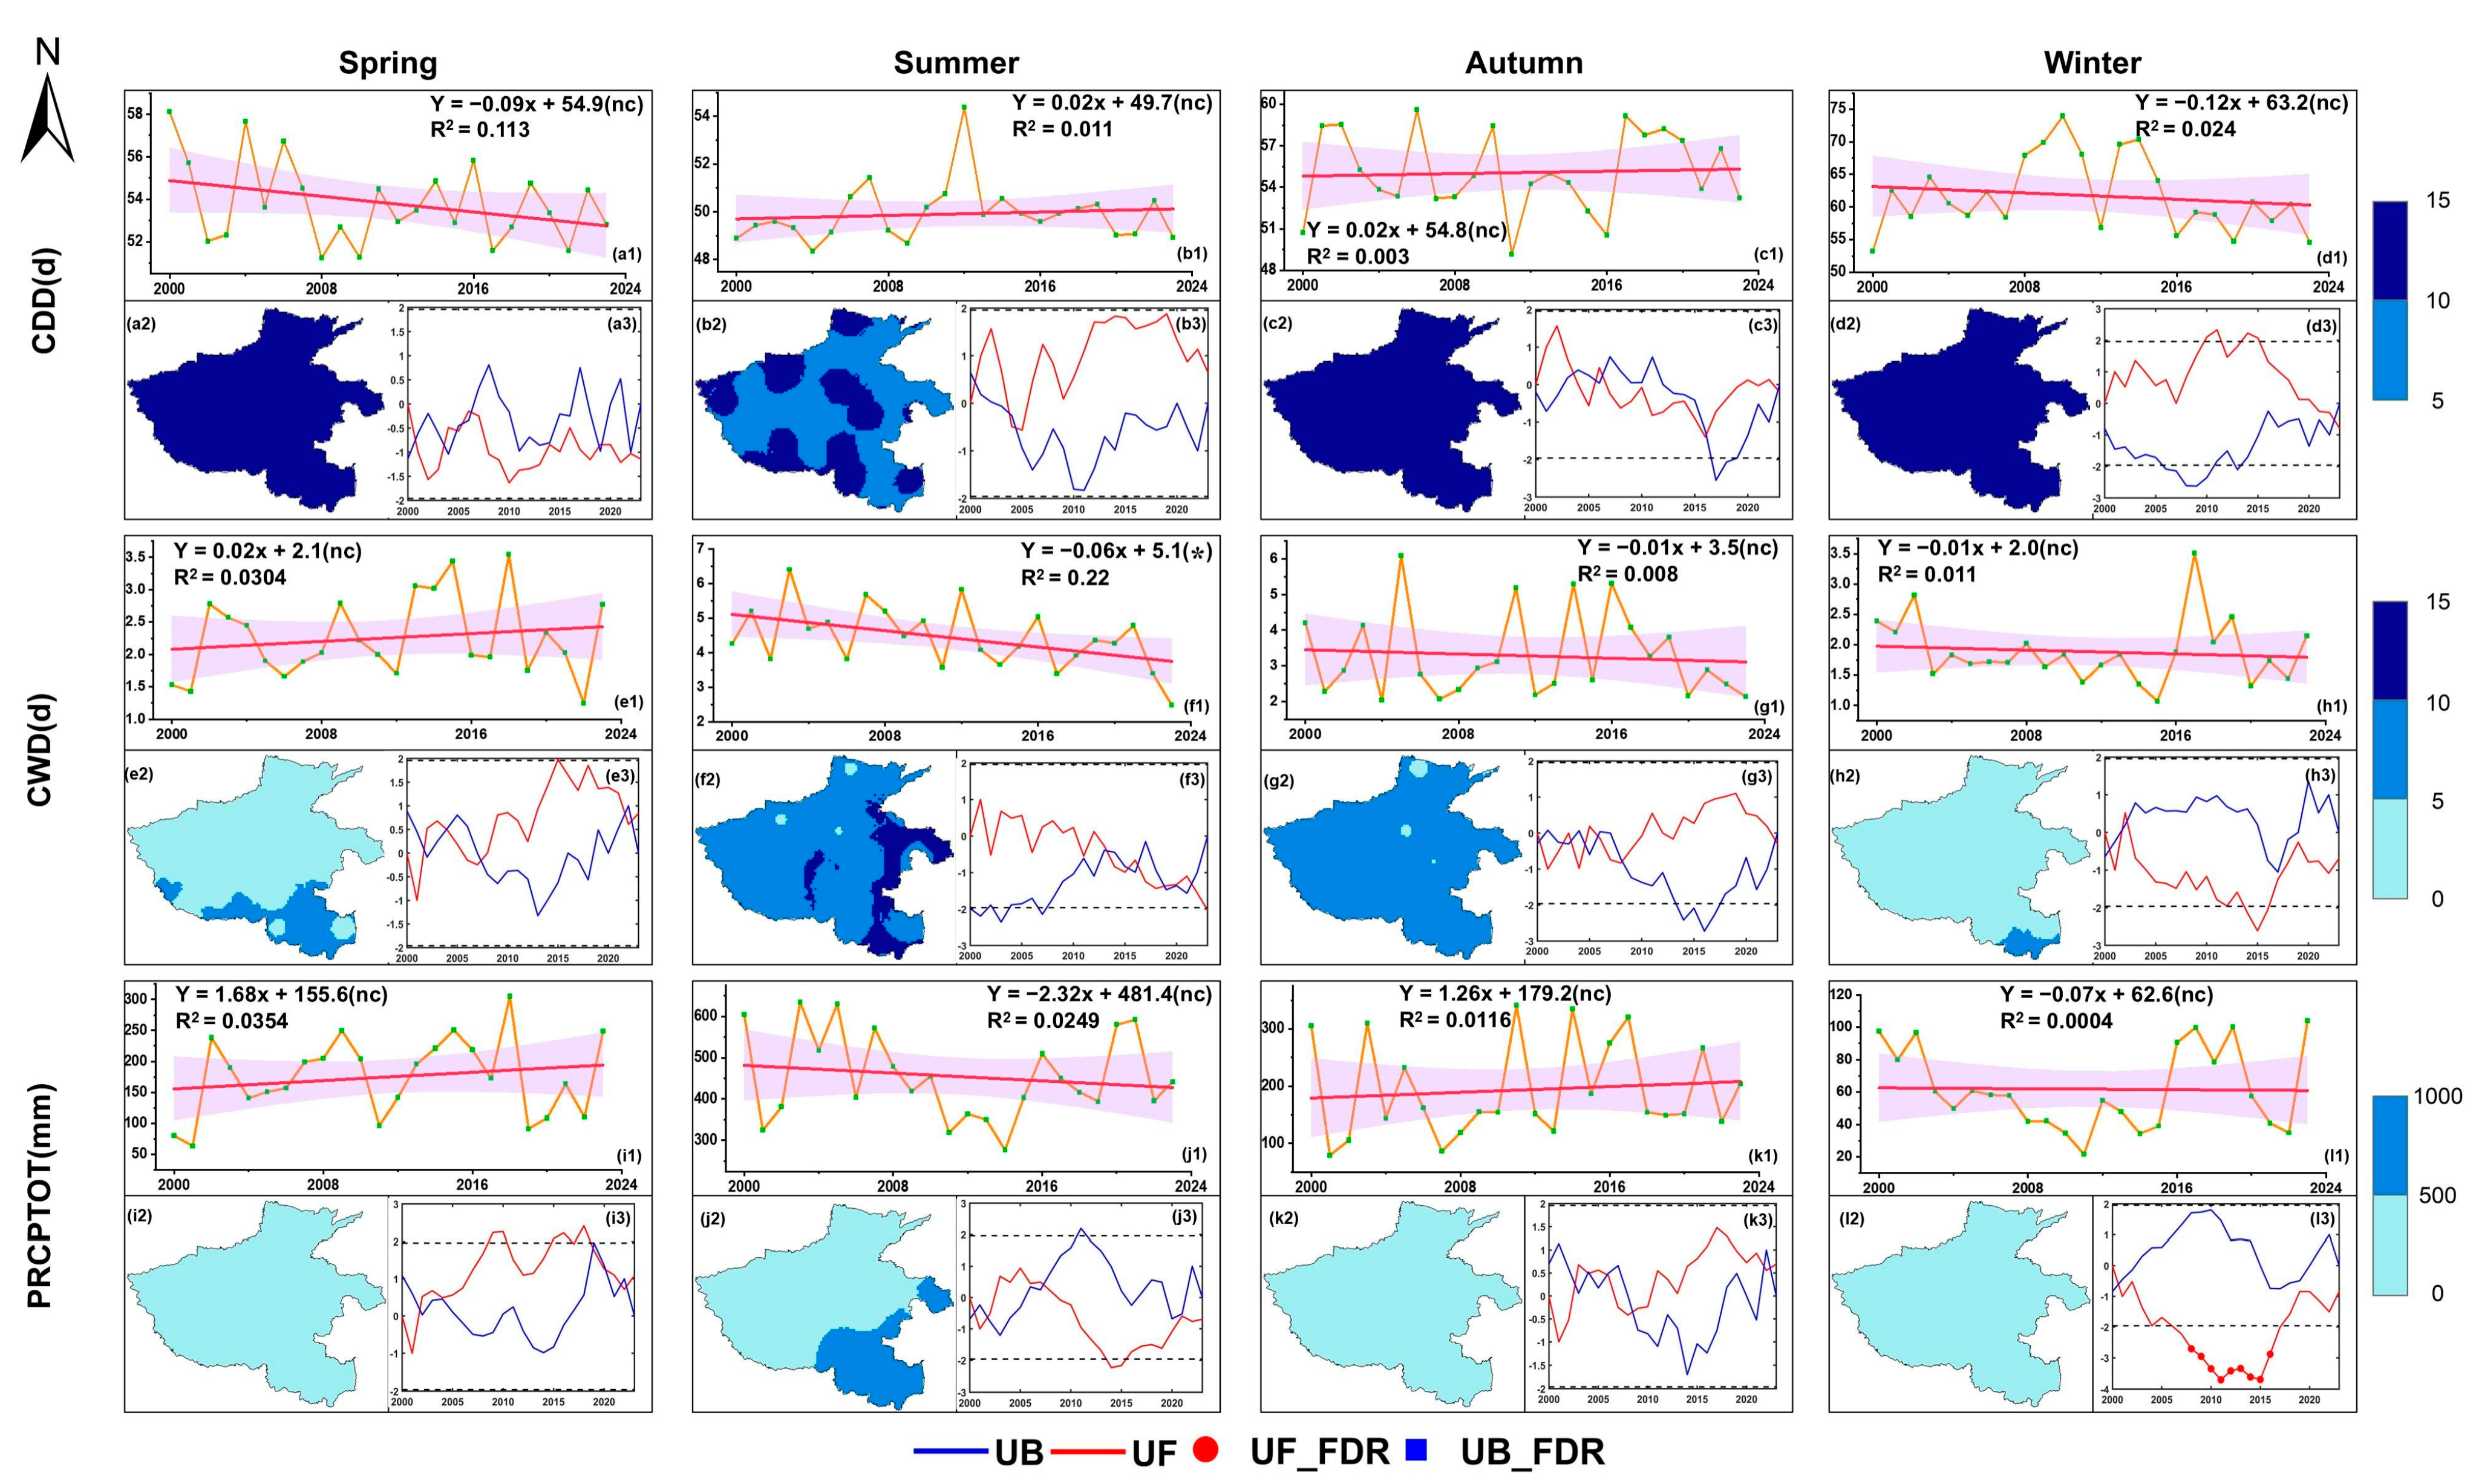
Through the analysis of the seasonal difference in extreme precipitation duration in Henan (Figure 3), it is found that the extreme precipitation in Henan shows significant seasonal differentiation. In autumn, the central plains formed a drought core area characterized by ‘shortened wet period and reduced rainfall’, and the precipitation pattern changed from continuous precipitation to ‘short-term heavy precipitation + long drought period’. The extreme precipitation duration index in this season changed most significantly, and the number of drought days (CDDs) in Henan Province was more than 15 days (Figure 3c) and showed an increasing trend. UF and UB intersected on the 0 axis from 2005 to 2010. After 2010, the UF depth decreased (the lowest was 2.5) and UB increased, which verified that 2010 was the turning point of drought aggravation. The number of continuous wet days (CWDs) decreased (Figure 3g2) and the number of continuous wet days in the central region decreased, and the transformation to ‘warm and dry’ promoted the replacement of precipitation patterns. The double attenuation is especially serious in the central plains, which seriously restricts the supply of water resources during the sowing period of winter wheat.
In summer, the spatial imbalance pattern of ‘more in the south and less in the north’ appeared, and the precipitation distribution evolved from a uniform type to a concentrated rainstorm and high-frequency drought interval type. Although the cumulative precipitation (PRCPTOT) decreased slightly, UF and UB intersected strongly in 2010: UF decreased sharply from peak 2.5 to negative and UB climbed rapidly from −2.5. After 2010, UF continued to >0 (1.0–2.0) UB500 mm (local 500–1000 mm) and the northern plains were often <500 mm, forming a ‘south flood and north drought’ situation. During the same period, the overall CDDs showed a fluctuating increase, revealing that the risk of intermittent drought increased simultaneously.
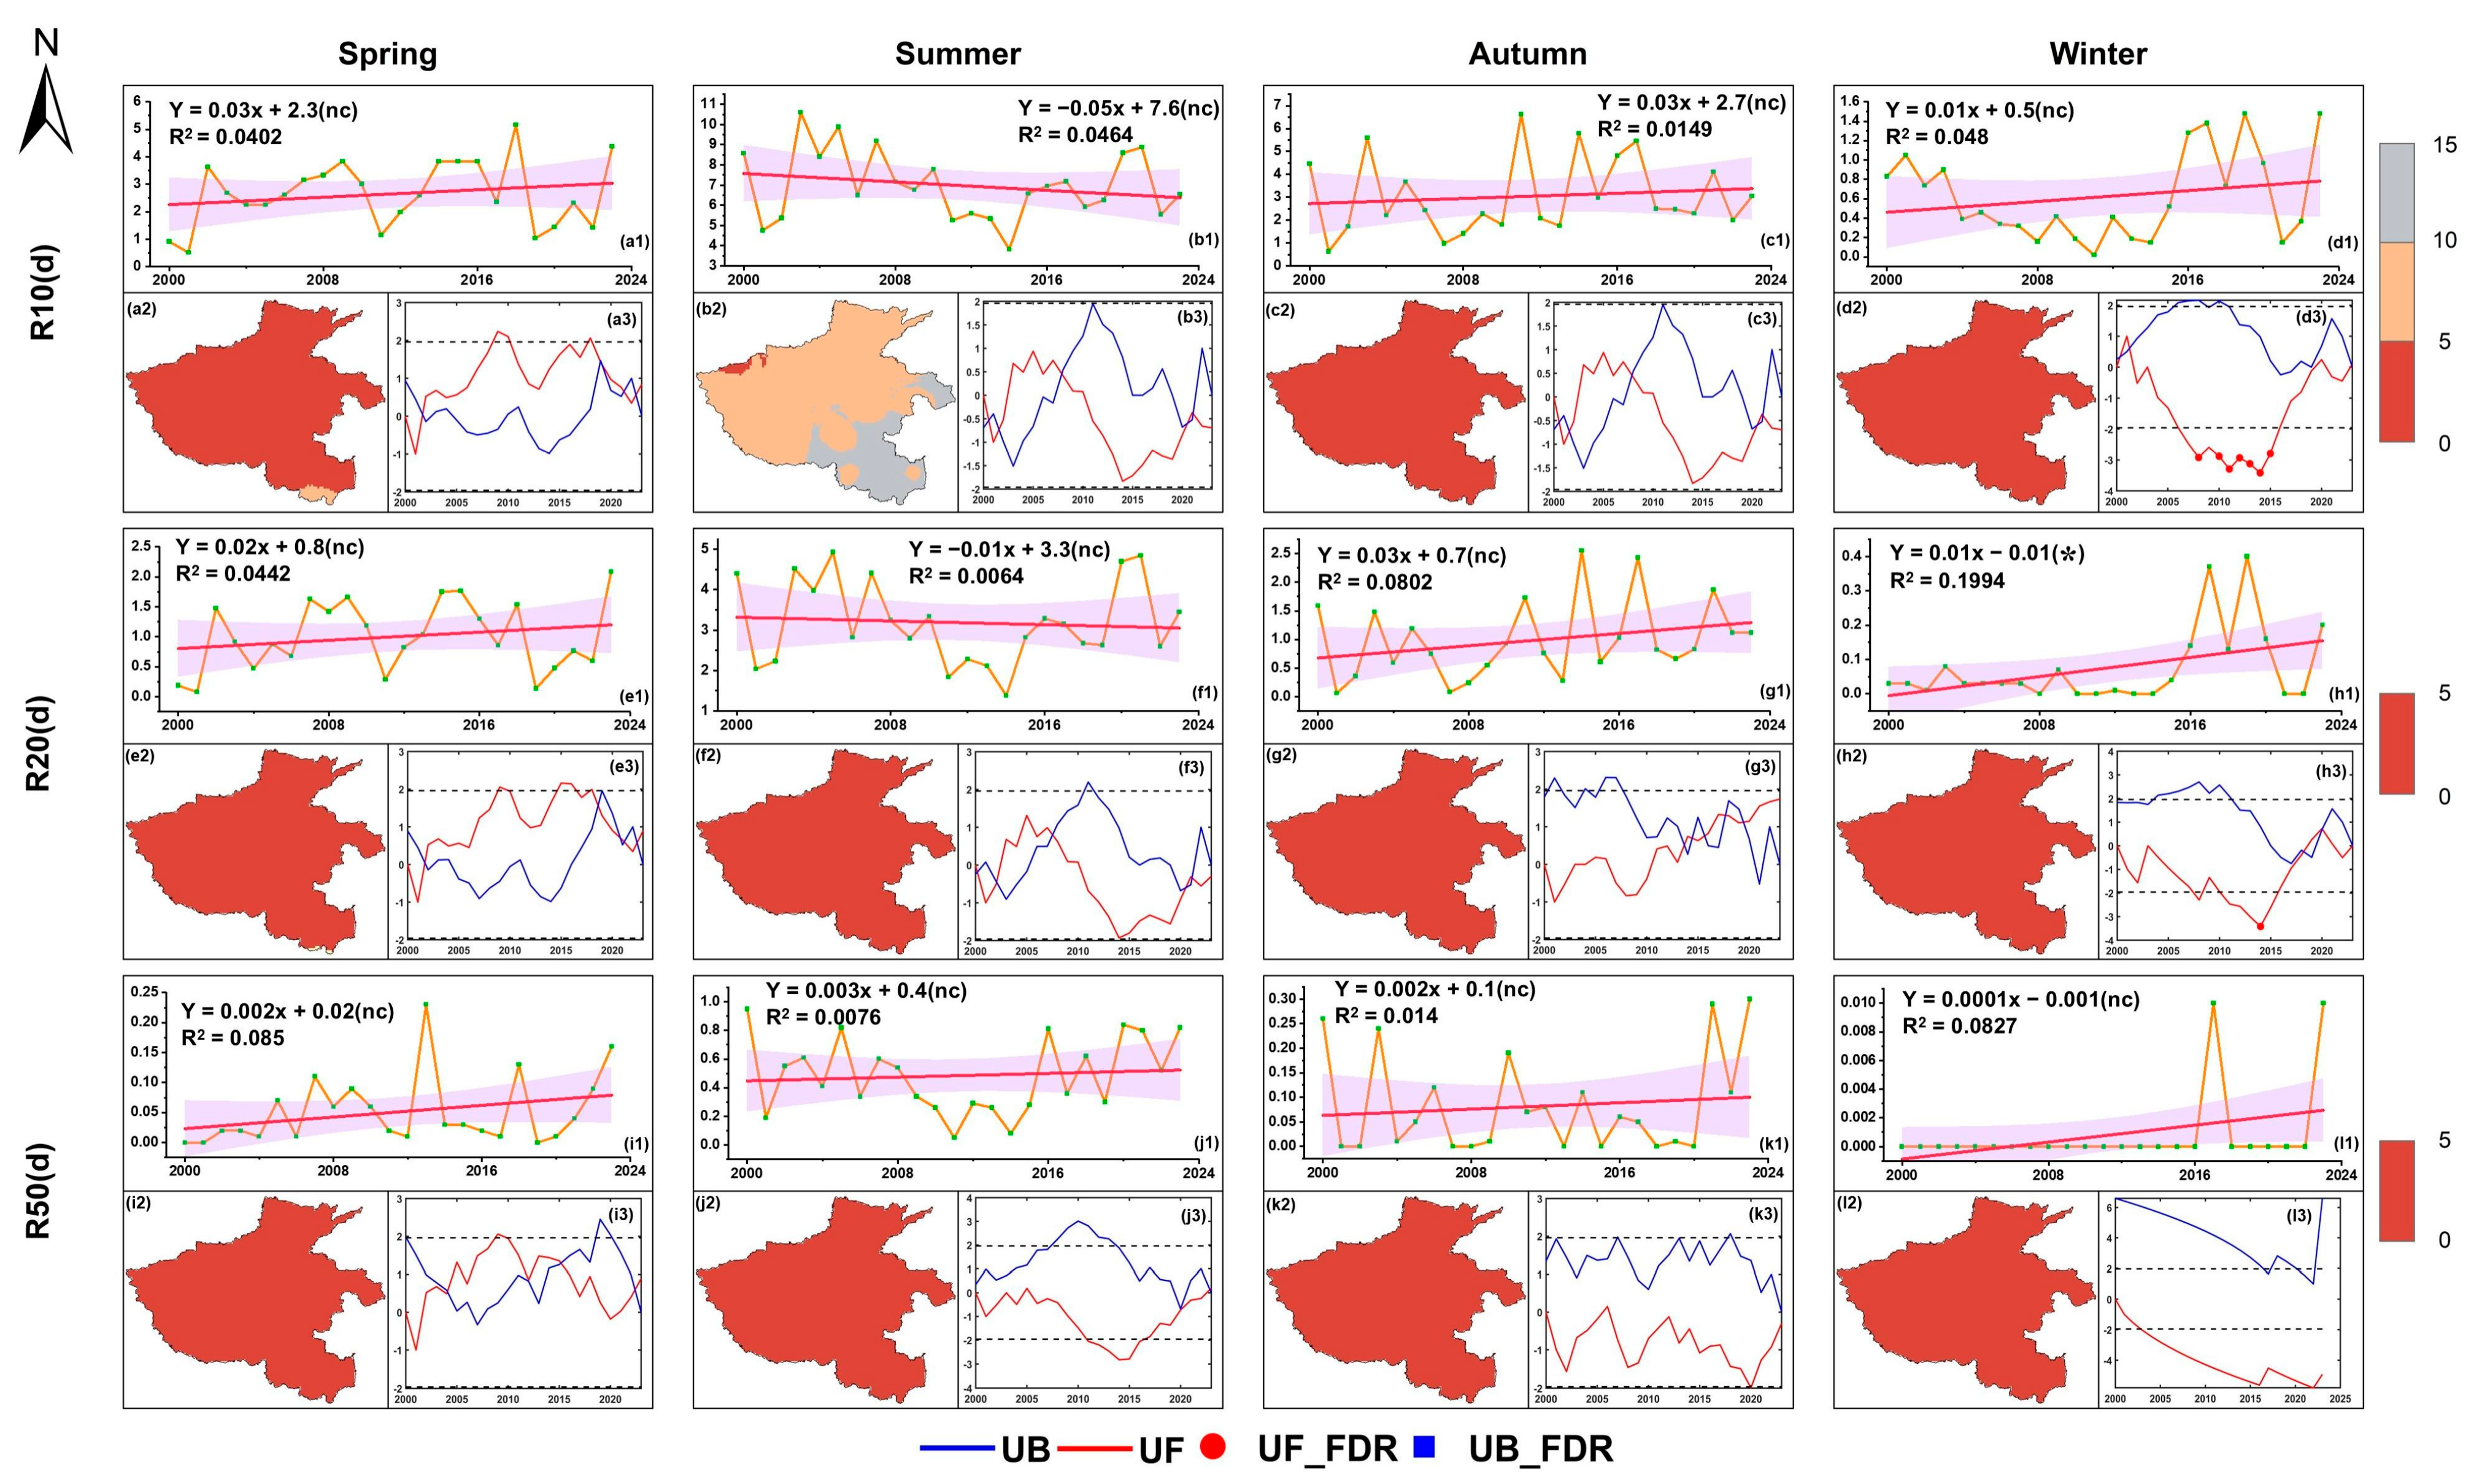
The long-term evolution of the absolute threshold index of extreme precipitation in Henan Province from 2000 to 2023 (Figure 4) is characterized by high fluctuations, dominated by a weak trend and spatial heterogeneity that is significantly stronger than the time trend. In summer, R10 (Figure 4b1) and R50 (Figure 4j1) decreased at a weak rate of −0.05 days/year and −0.003 days/year, respectively. In winter, R10 (Figure 4d2) and R50 (Figure 4i2) showed a weak increase but the trend was not significant. The R10 summer (Figure 4b2) showed a gradient pattern from south to north spatially, and its MK test revealed that UF and UB fluctuated greatly in this area, especially in winter (Figure 4d3) and summer (Figure 4b3). There was only a significant increase in spring (UF > 2 in 2010) and there was no persistent supercritical phenomenon in other seasons (Figure 4a3). The high-frequency cross between UF and UB in summer (Figure 4b3) indicates that the stability of the trend is weak.
The overall trend of R20 is flat, and there is no seasonal breakthrough significance threshold. In the late autumn (after 2020), UF showed a weak upward trend, while UB showed a synchronous downward trend (Figure 4g3). Although the UF in winter is mostly negative, it has not decreased significantly by the high buffer of UB (Figure 4h3), reflecting that the response of the region to climate change is lagging behind and the environmental stability is strong. The seasonal variation in R50 is significant: only in spring is there is an upward mutation (Figure 4i1), there is no stable trend in summer (Figure 4j1), and there is a downward trend in autumn and winter (Figure 4k1). In winter, the change is the most dramatic, and the UF has a long period of significant decline (Figure 4l3). The initial abnormal high value of UB represents the early climate.
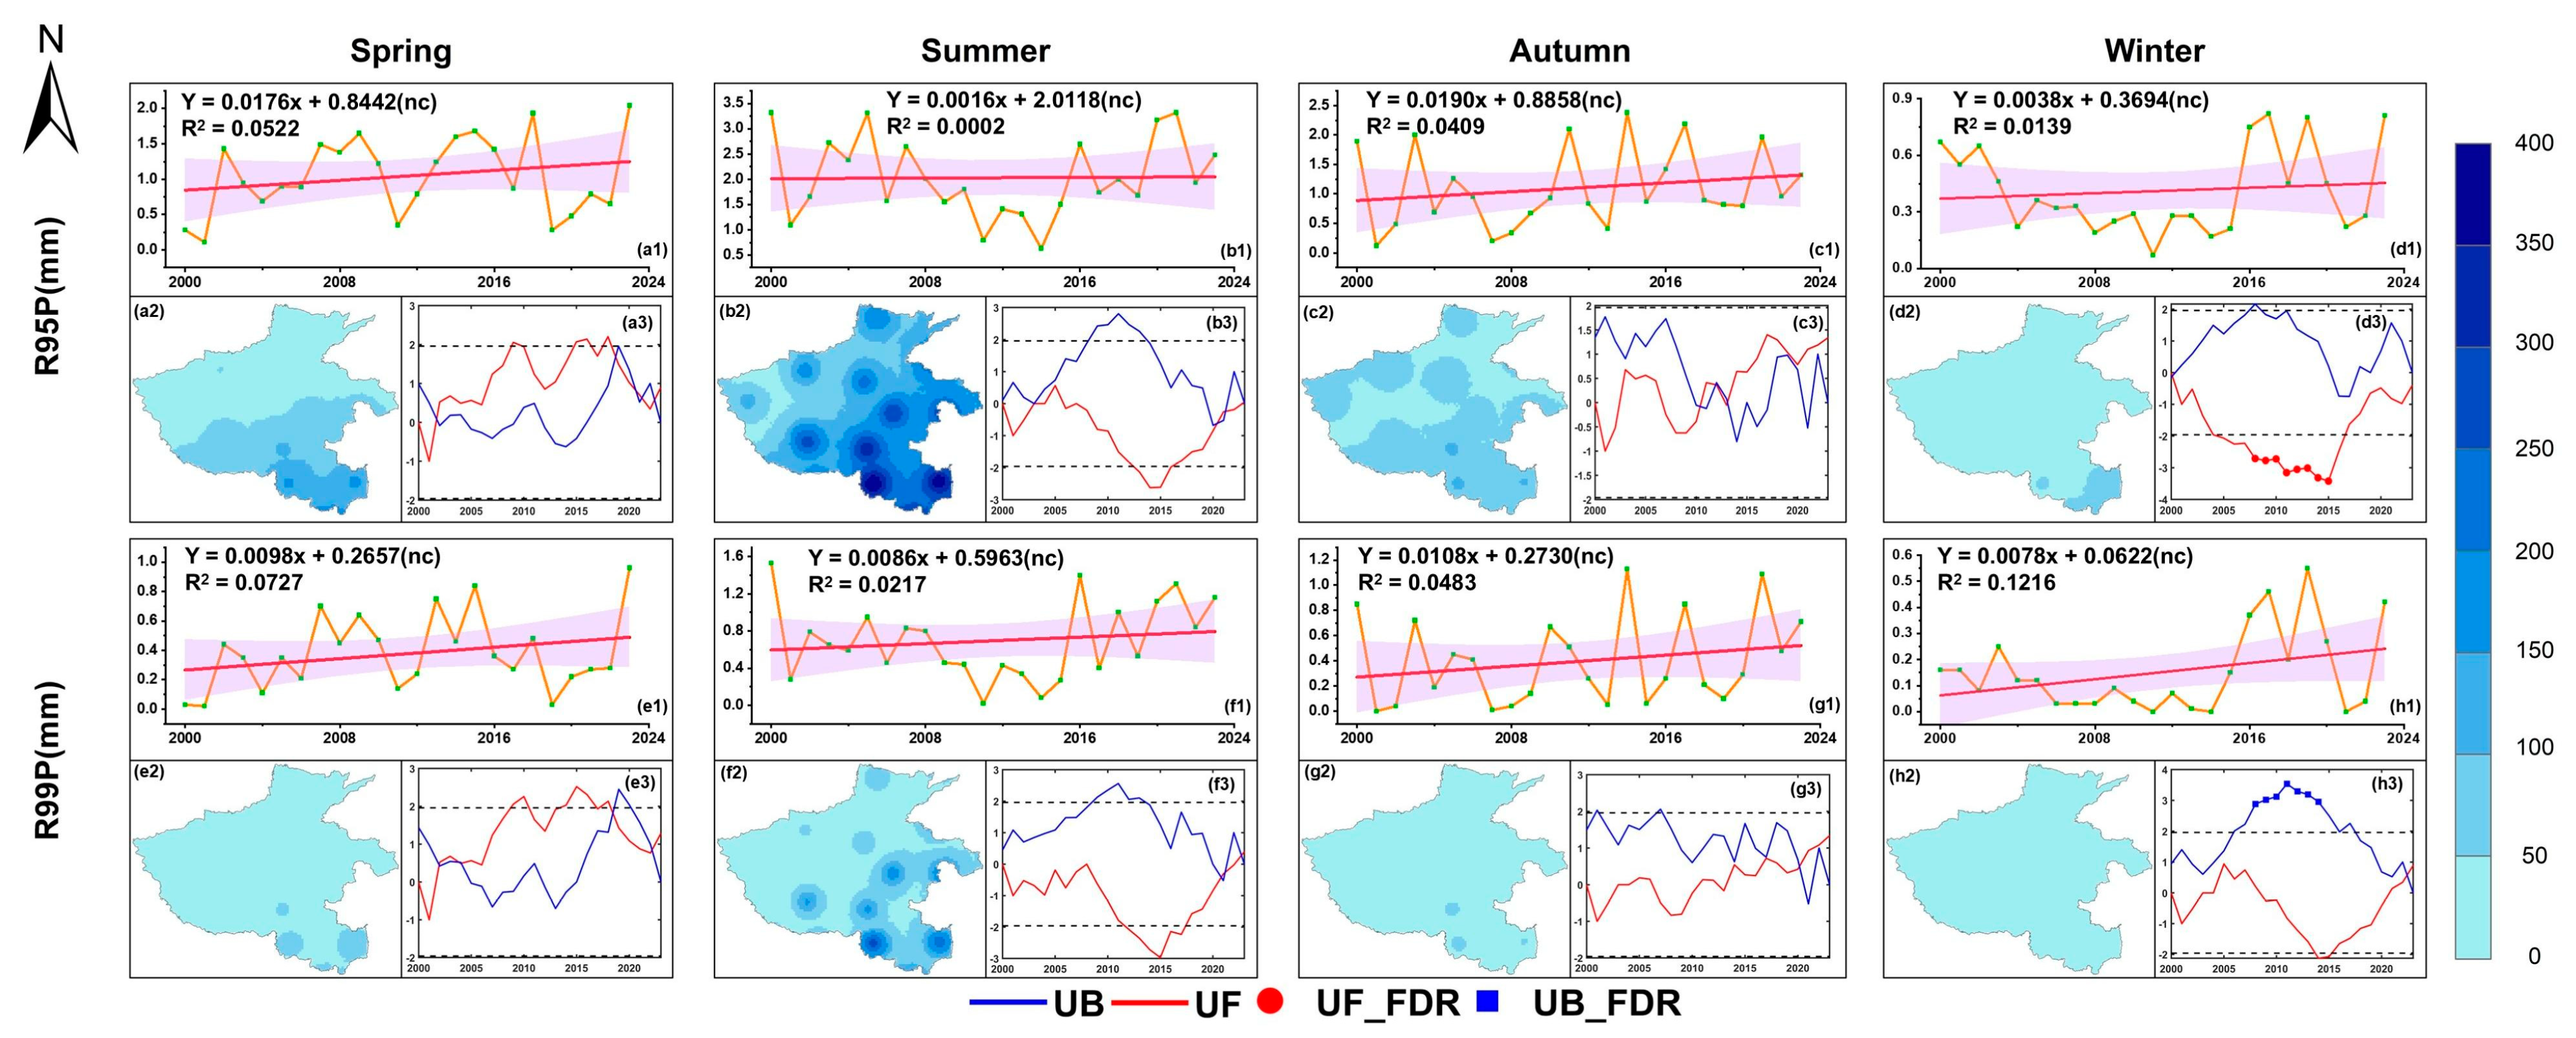
The relative threshold indexes of extreme precipitation in Henan Province from 2000 to 2023 showed different characteristics at the seasonal level, but there were significant differences in the increase and spatial distribution. The increase in summer was the most prominent, and the interannual growth intensity of R95p (Figure 5b1) and R99p (Figure 5f1) was significantly higher than that in other seasons. Spatially, the high-value area of extreme precipitation is concentrated in the mountainous areas of southern and western Henan (especially in summer), and the dark blue area has the largest coverage, which proves that the southern mountainous area is the core area of high flood risk. In winter, the whole area is covered by a light color, which indicates that the precipitation intensity is the weakest and the space is homogeneous. The R95p (Figure 5a2–d2) showed a stable interannual fluctuation, but the summer (Figure 5b2) and winter (Figure 5d2) oscillations intensified: the UF reached the lowest point (near-3) in the summer of 2010, and the UB peaked in the winter of the same period (about 2), reflecting that the extreme precipitation in summer and winter was dominated by interannual variability. In contrast, the trend of the R99p sequence (Figure 5e1–h1) is more significant, especially in spring (Figure 5 e3) and autumn (Figure 5g3). After 2020, UF breaks through the 95% confidence band and continues to rise, which supports the increasing trend of extremely strong precipitation events in the past decade. The range of R95p (Figure 5d3) and R99p (Figure 5h3) in winter is the largest, which highlights the strongest variability of extreme precipitation in this season. The autumn fluctuation is gentle (Figure 5c3,g3), but the R99p autumn UF rebounds to about 2 after 2020, showing a potential upward signal.

3.2. Comparison of Grain Production Time Characteristics of Winter Wheat

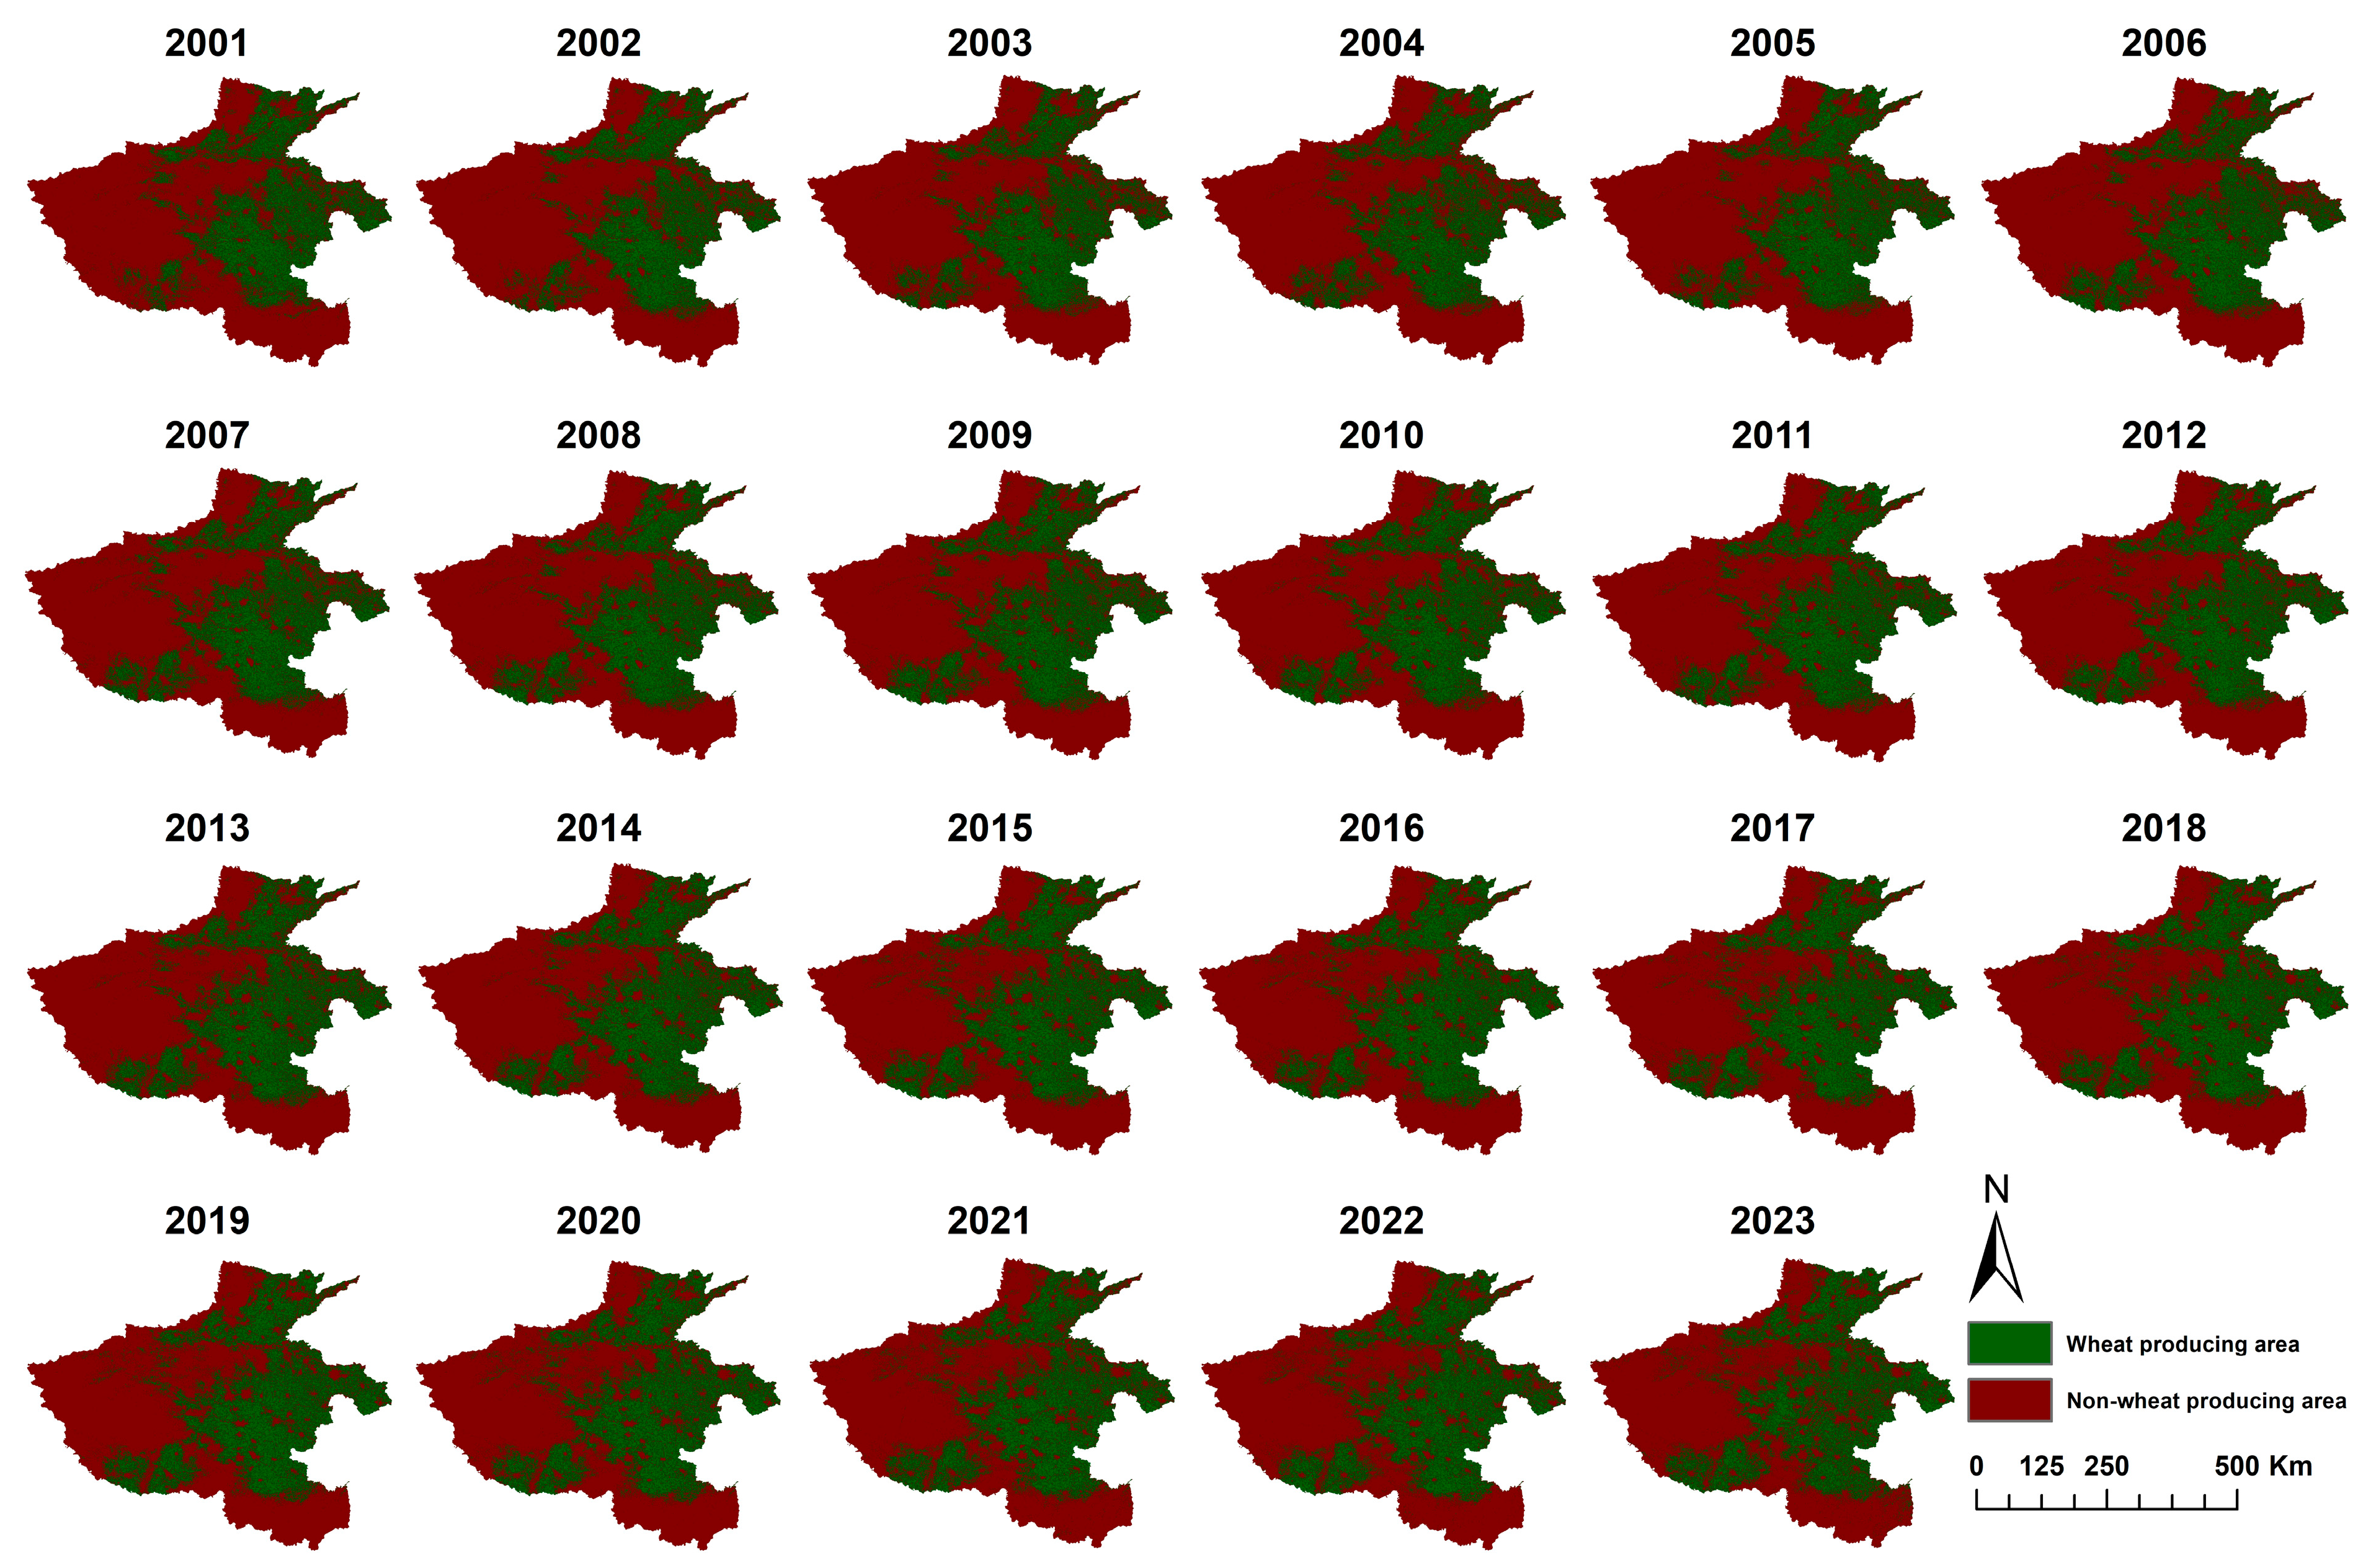
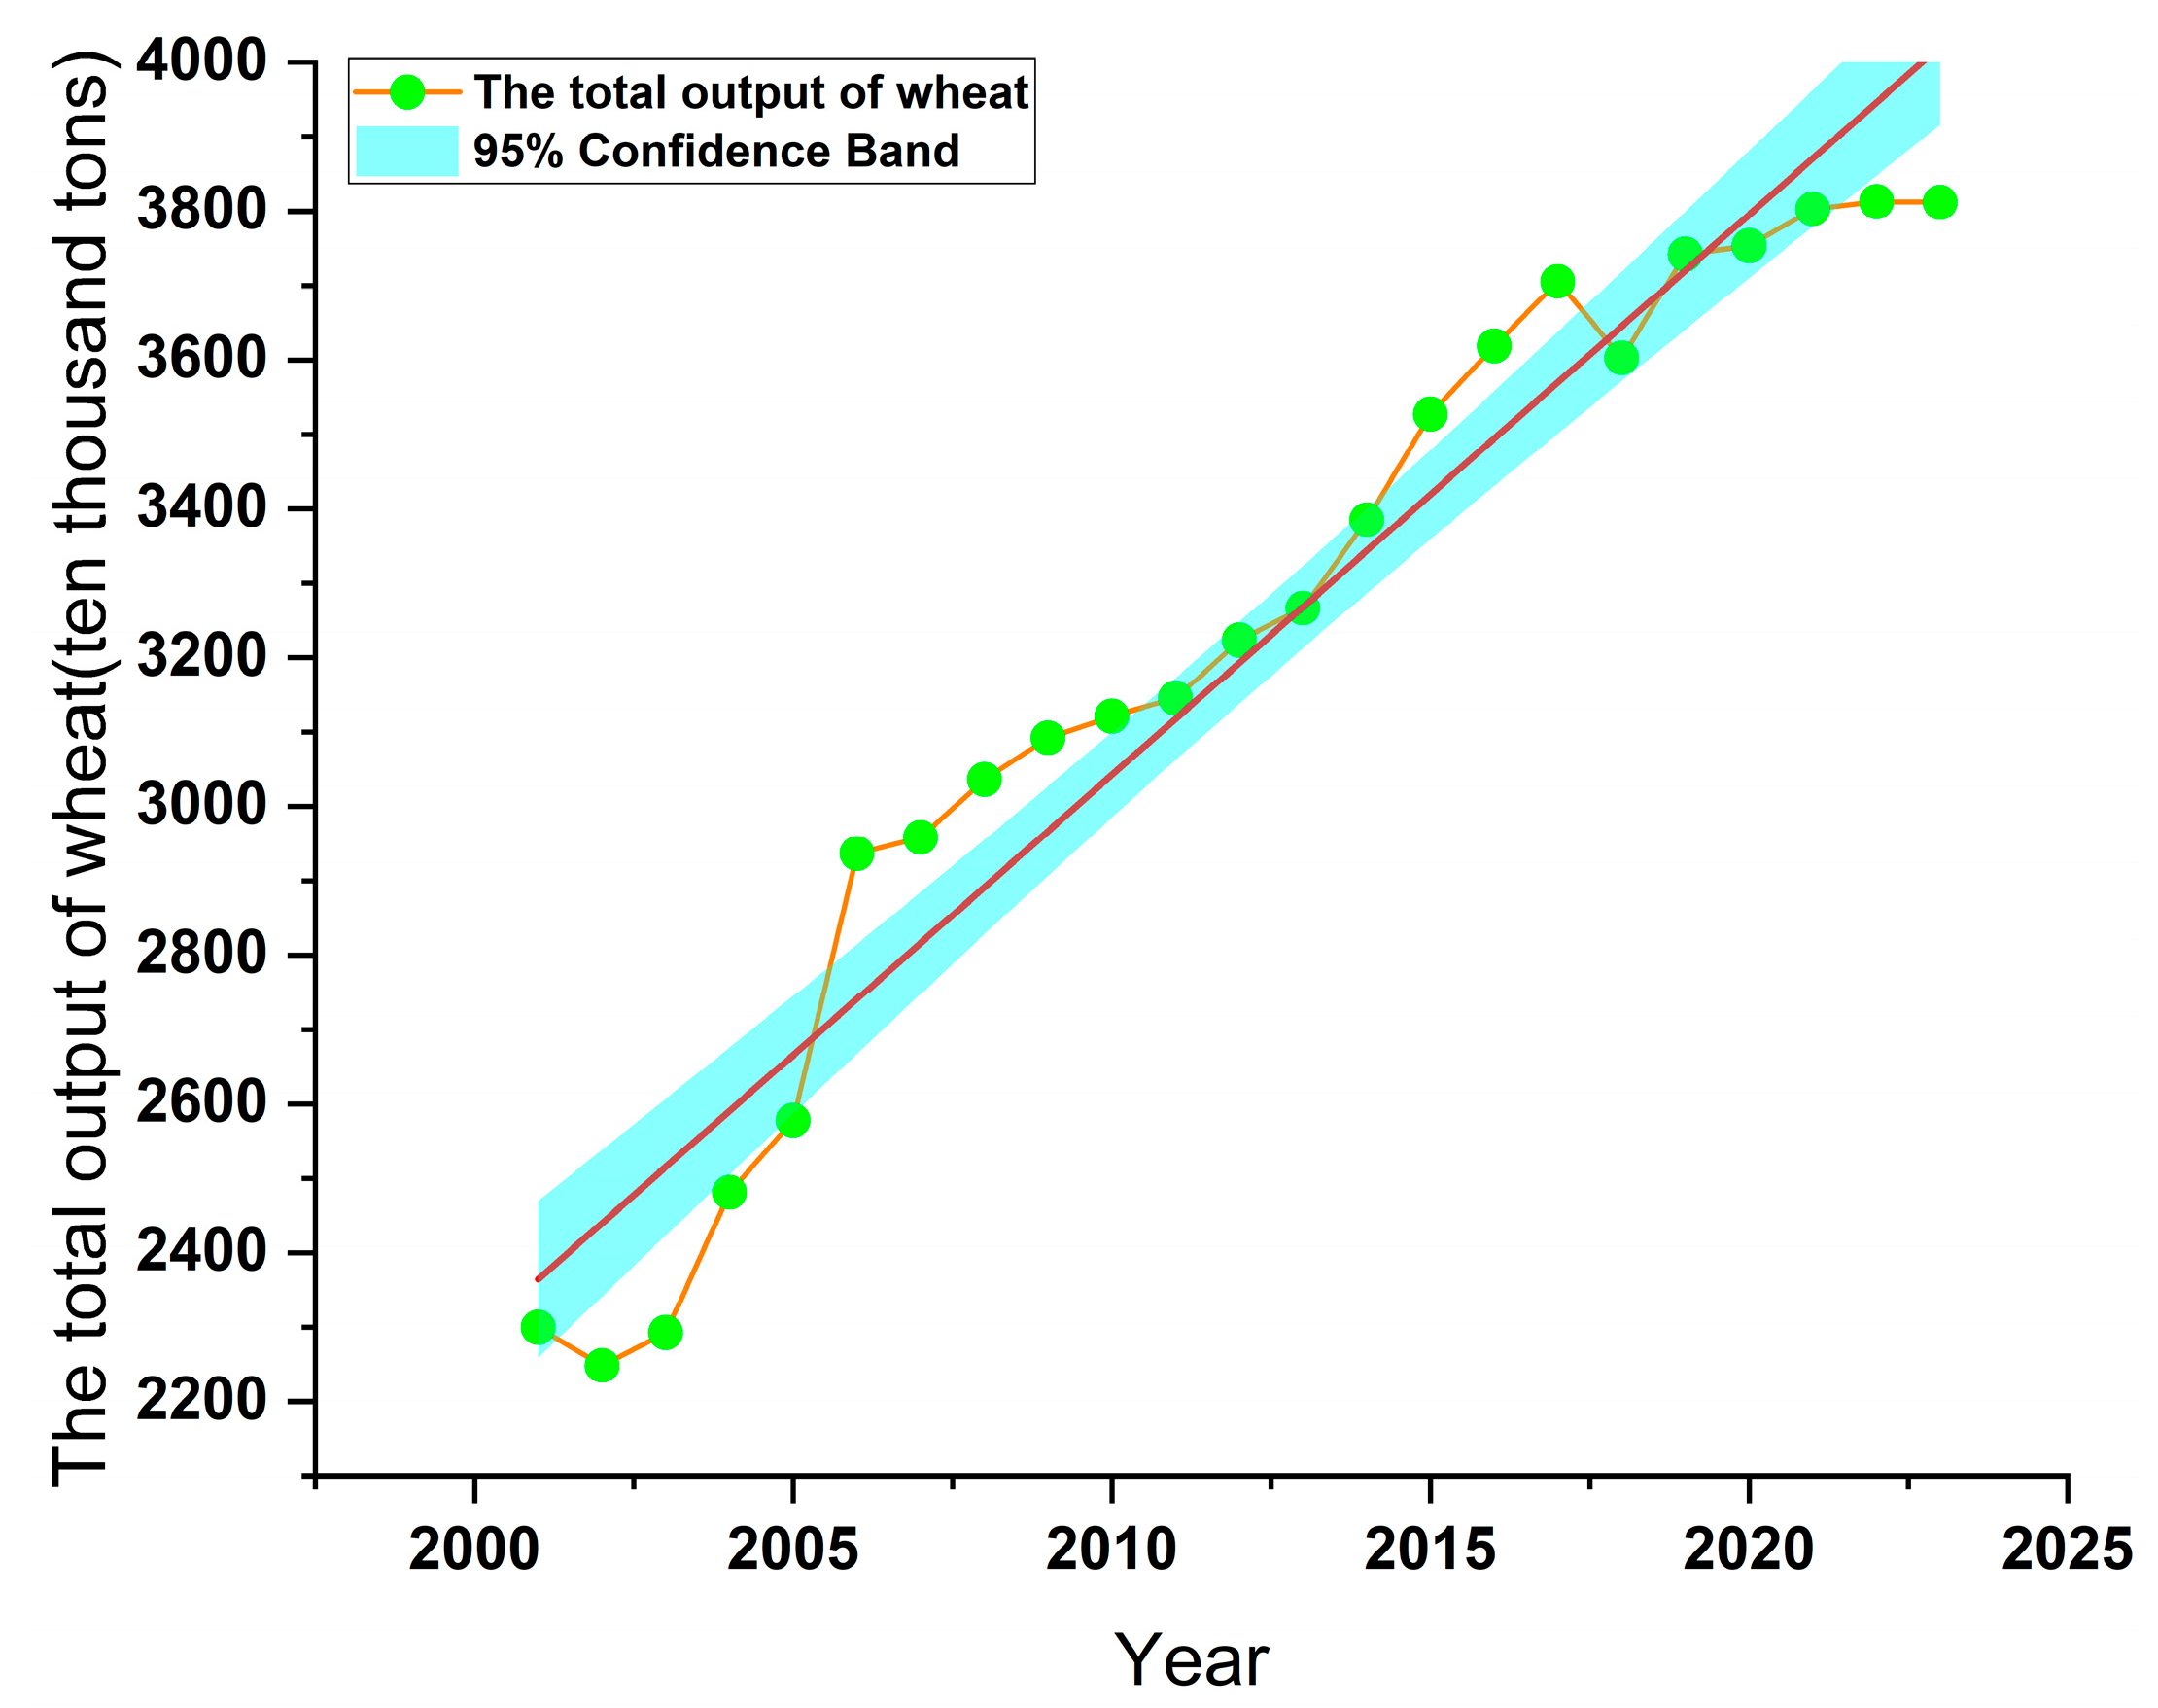
There was significant spatial differentiation in the winter planting area of Henan Province from 2001 to 2023. Figure 6 shows that the hinterland of the Huang-Huai-Hai Plain (about 113° E–115° E, 34° N–35° N) continues to show a large-scale continuous green distribution, indicating that the winter wheat production capacity in the region has been stable for a long time. The boundary of the core producing area changed little in 23 years. In contrast, there are persistent red blocks in the Funiu Mountain area of western Henan, while the northern foot of the Dabie Mountain in southern Henan shows a red–green staggered pattern. During the period of 2001–2010, there was an obvious process of spatial connection. The area of green patches in the eastern Henan Plain has expanded significantly: in 2001, the proportion of fragmented red blocks in the region was about 27%, and by 2010 it had fallen to about 12%. This contiguity is spatially manifested as radiation from the core area to the northeast. The line chart in Figure 7 shows that the overall yield increased during the same period and its peak change was synchronized with the spatial expansion. It is worth noting that the expansion process tended to stagnate after 2011. In the map of 2016, irregular red patches invaded the southern part of the central Henan Plain, with an area of about 15% larger than that in 2015. The line chart for the same period showed a sharp decline in production in that year.
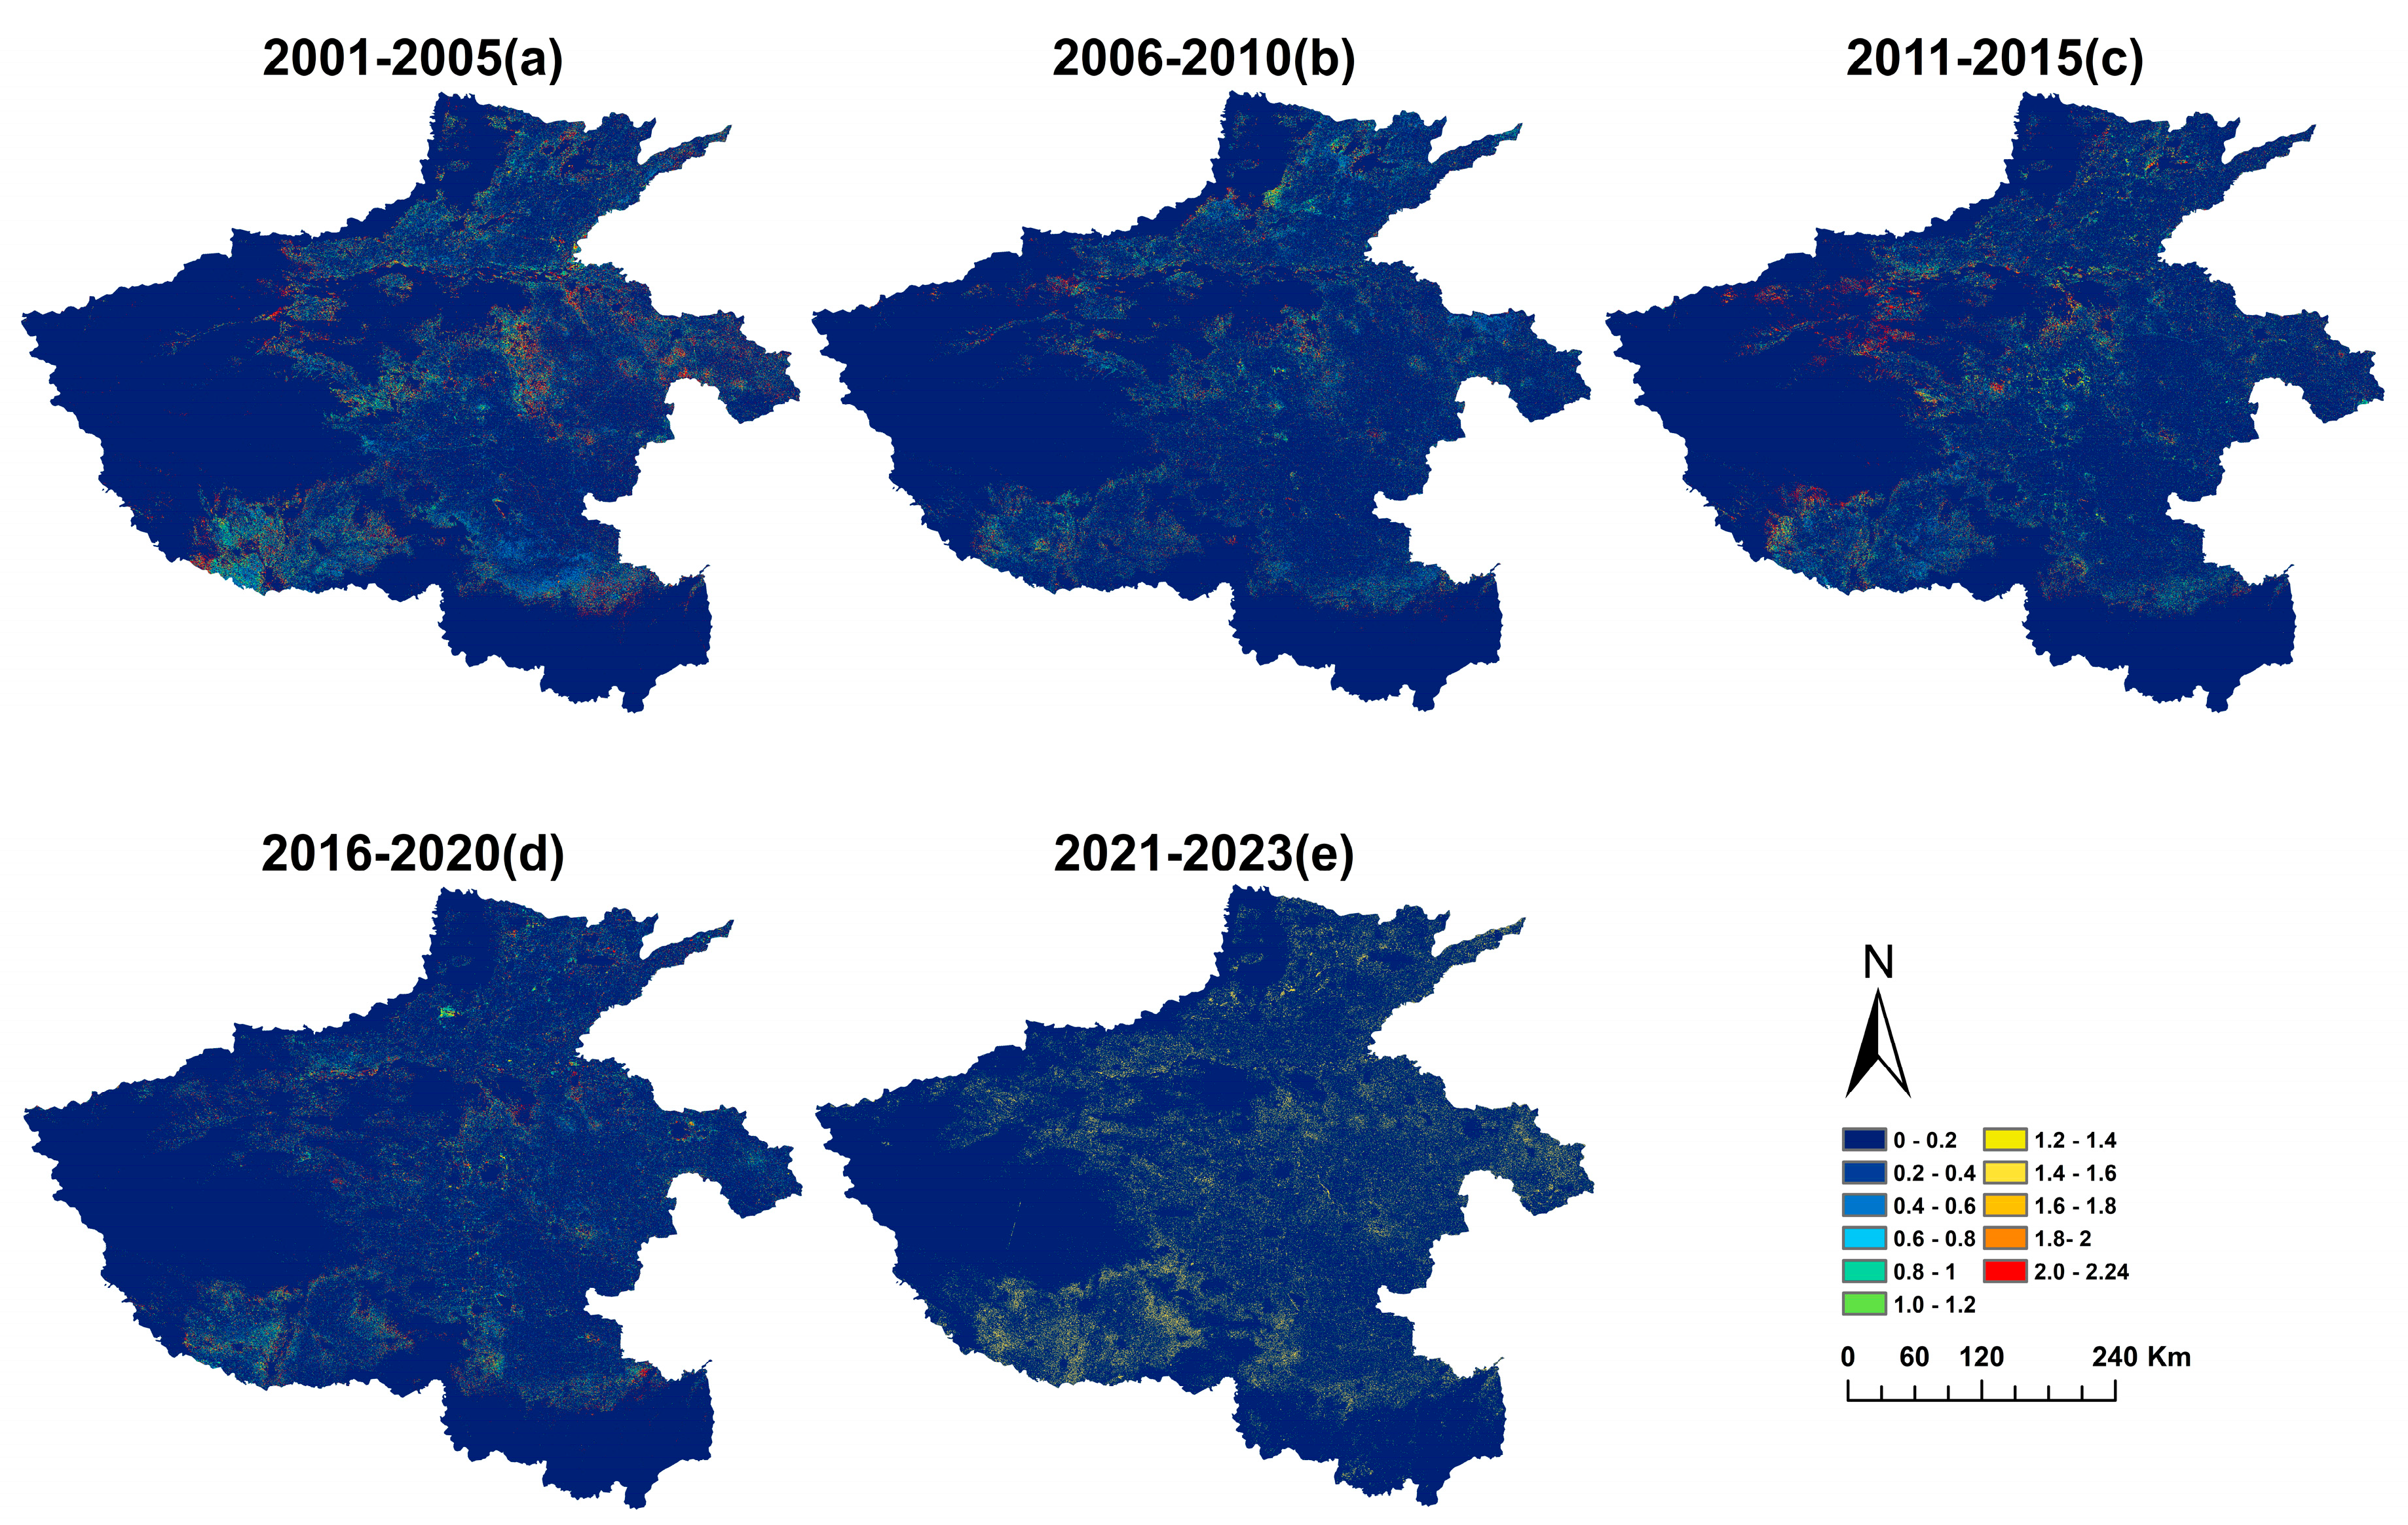
At the same time, by calculating the CV coefficient of variation in the winter wheat planting area in Henan Province, it is found that the stability of grain production in Henan Province has experienced significant spatial reconstruction and systematic improvement in the past 23 years. From 2001 to 2005, Henan Province (Figure 8a) showed a generally high fluctuation state, especially in the southern and western regions of Henan Province. The coefficient of variation generally exceeded 1.6, forming a large range of red and yellow high-value areas (up to 2.24). Only the sporadic areas in northern Henan maintained a low fluctuation state of dark blue (CV < 0.4). From 2006 to 2010, the spatial differentiation pattern began to change, the volatility of the core producing areas in the eastern Henan Plain was significantly weakened (Figure 8b), and the orange-yellow patches gradually subsided, but the northern part of Xinyang in the Huaihe River Basin still stubbornly maintained a dark red high-value area of more than 1.8.
The period 2011–2015 became the key turning point of stability. The Huanghuai Plain formed a dark blue stable triangle area for the first time (CV < 0.4) and the CV value of the transitional zone in central Henan decreased significantly from 0.8 to 1.0 to below 0.6 (Figure 8c). From 2016 to 2020, the stability in the region was qualitatively changed and the yellow-brown transition zone (0.8–1.0) completely disappeared. About 75% of the winter wheat planting areas in Henan Province entered the middle and low fluctuation stage with CV < 0.6 (Figure 8d), and only a small red-orange risk area remained.
From 2021 to 2023, the spatial pattern is further optimized and the dark blue low-fluctuation region expands to cover the whole Huang-Huai Plain. However, extreme fluctuation islands appear in some areas (Figure 8e), and there are bottlenecks in the treatment of local fragile zones in the upper reaches of the Huaihe River.

3.3. Response of Winter Wheat Yield to Extreme Precipitation in Henan

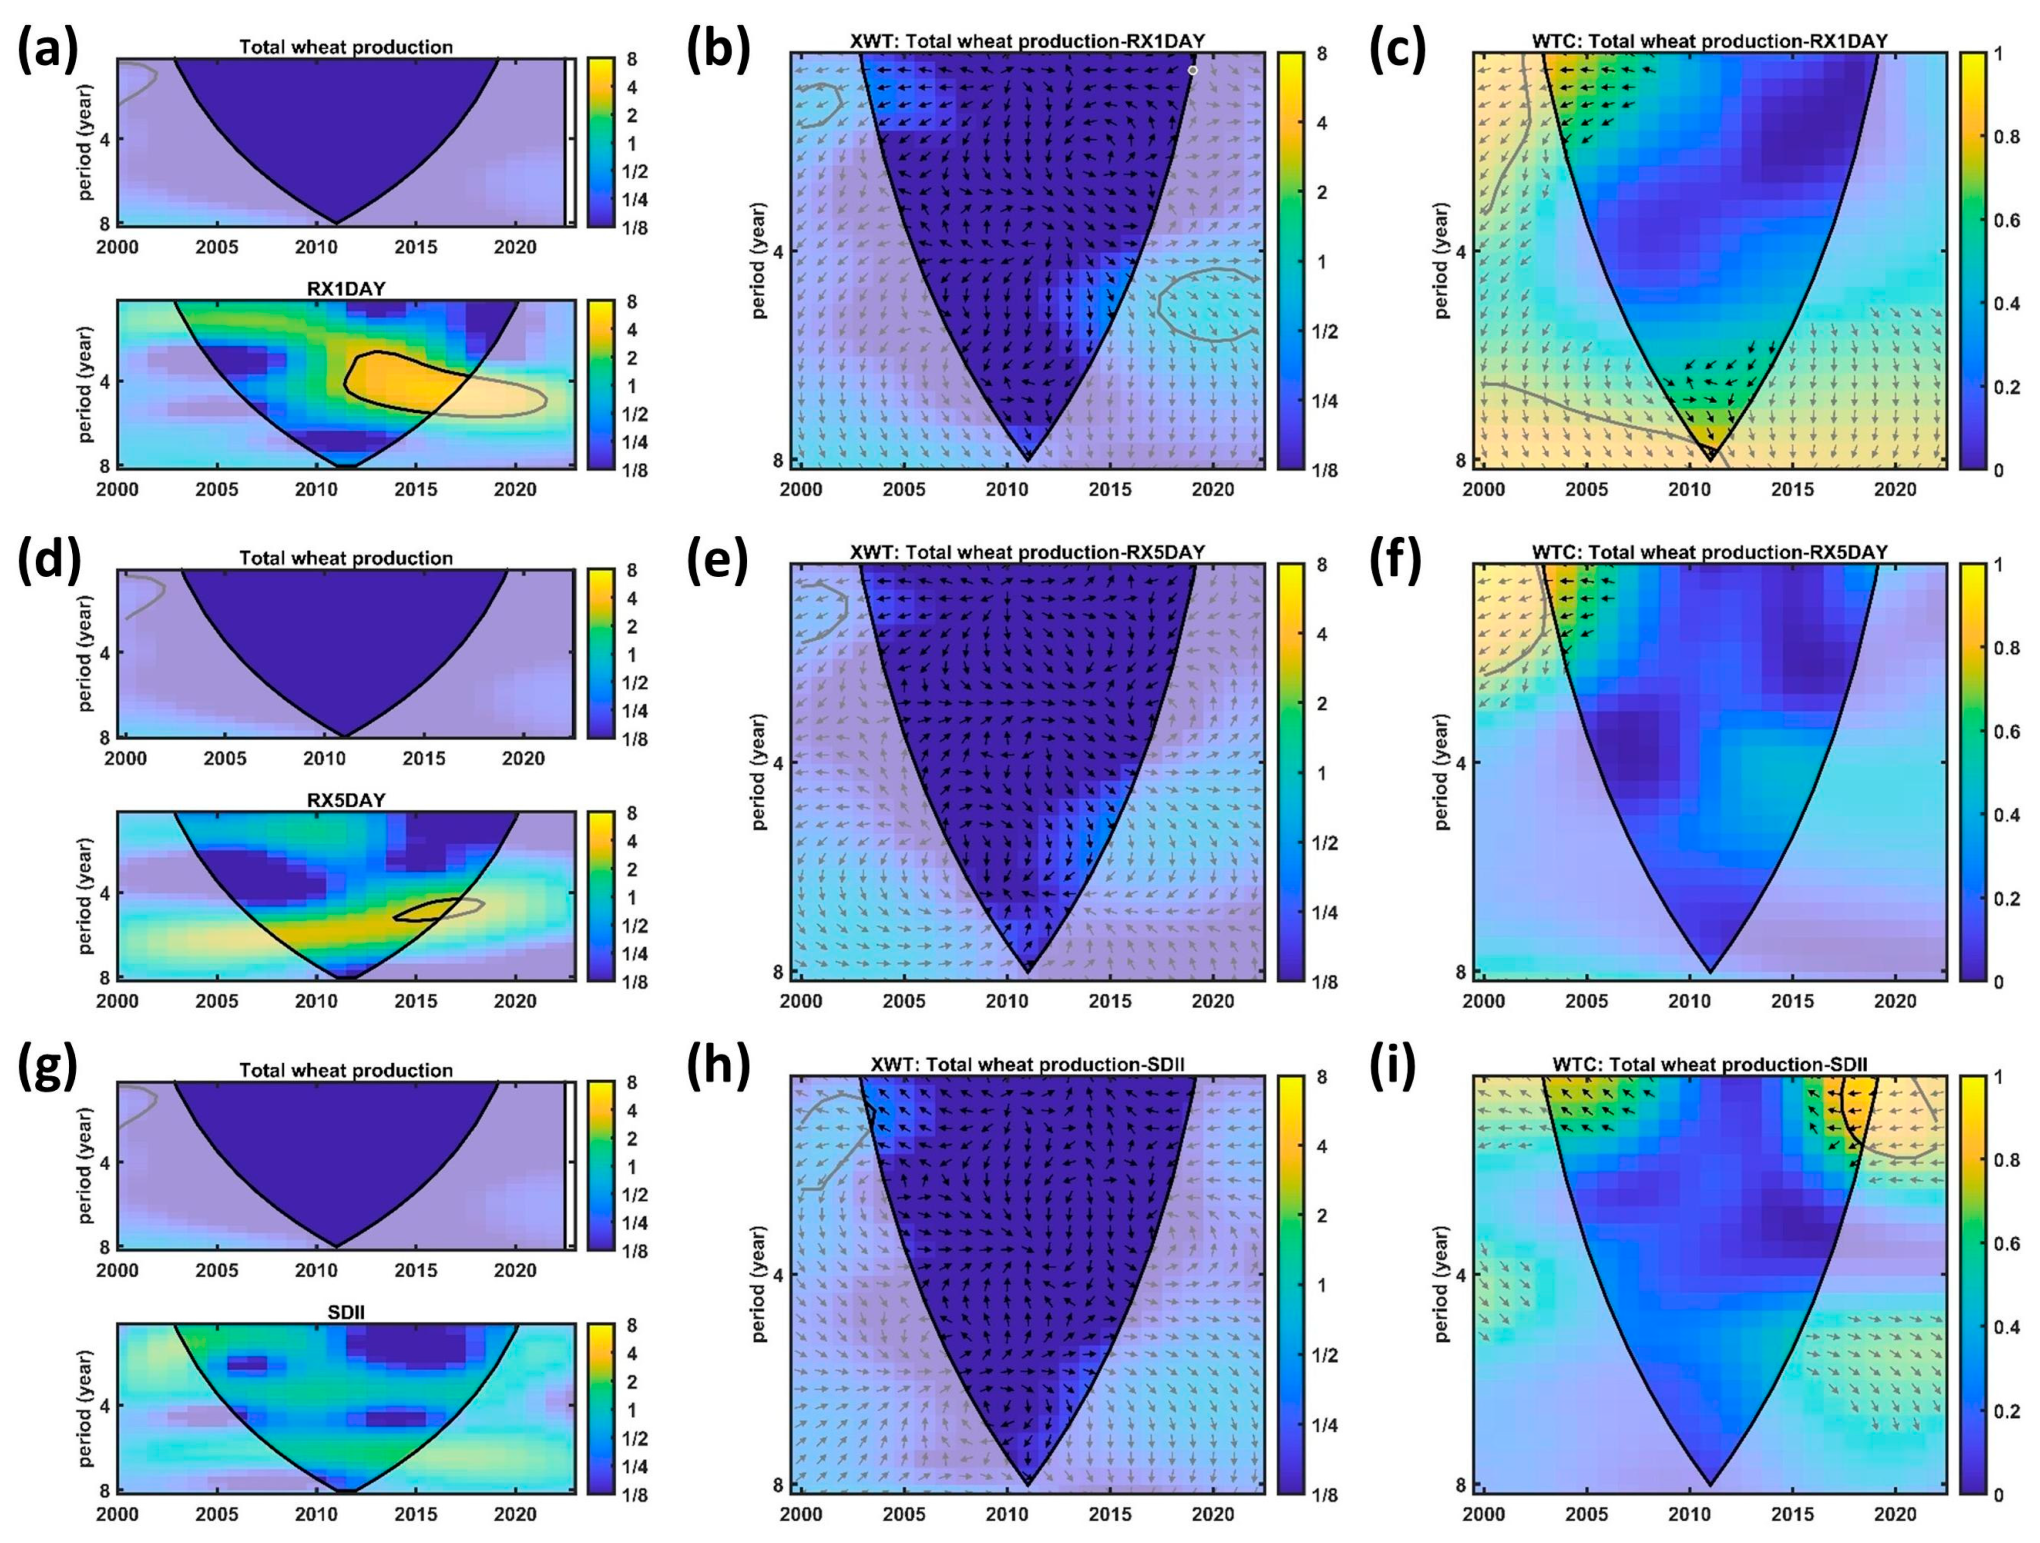
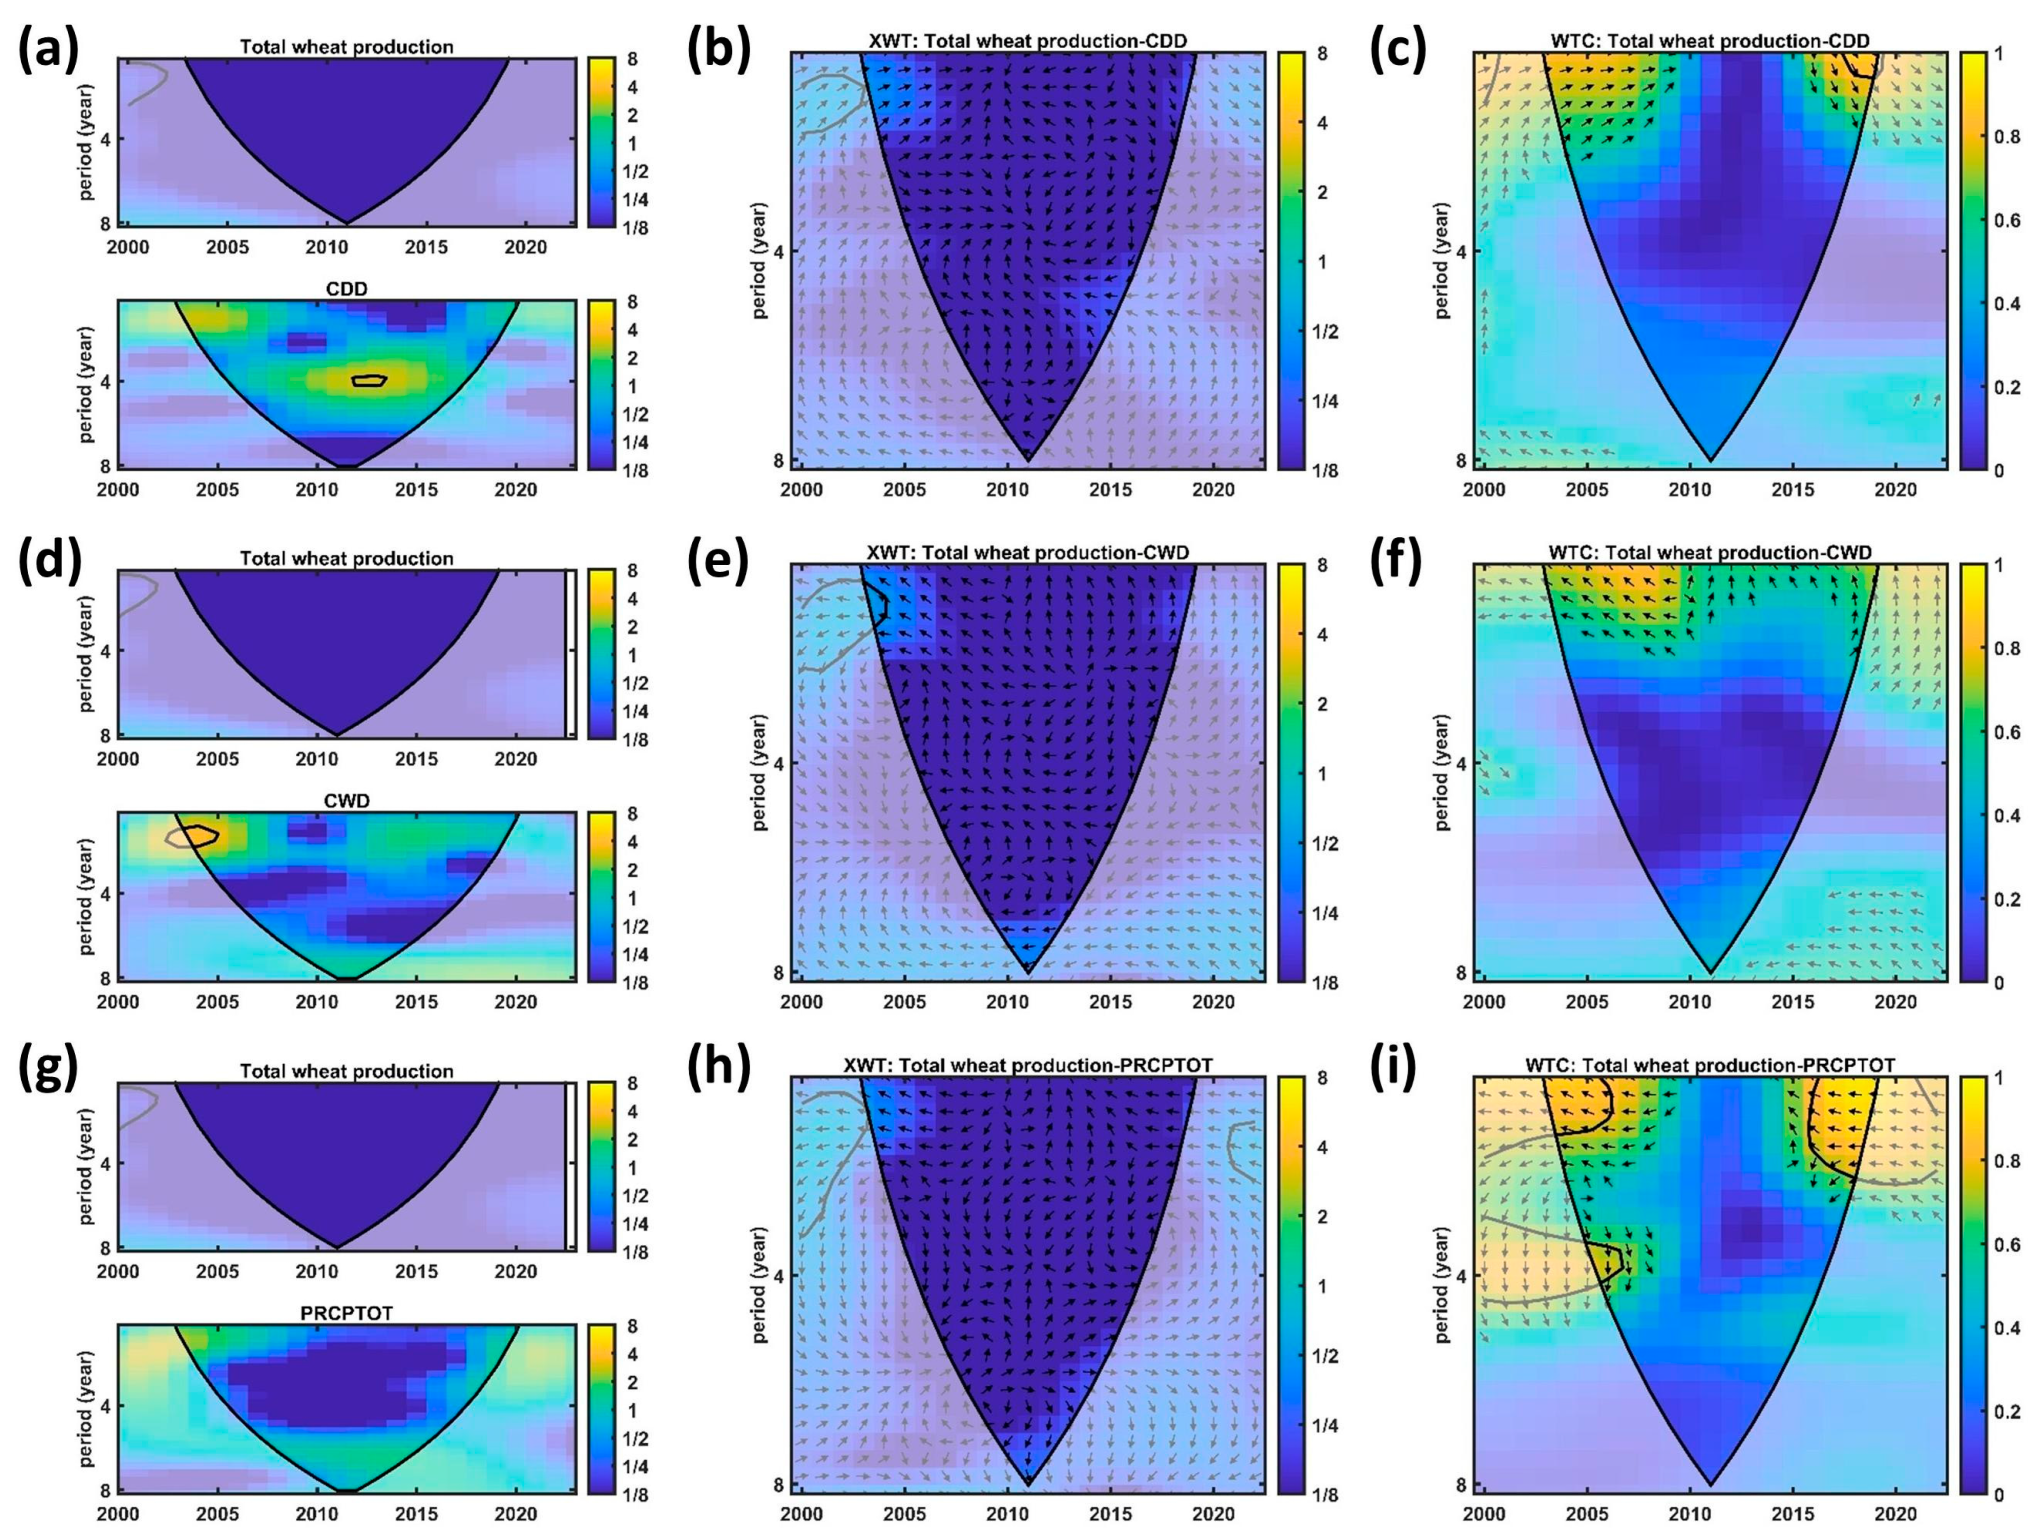
The multi-scale correlation between winter wheat yield and short-duration extreme precipitation indices (RX1DAY, RX5DAY, and SDII) in Henan is analyzed. The cross wavelet transform (XWT) shows (Figure 9b,d,g) that there is a stable high-energy region (dark region) in the 4–8-year cycle between the yield and the daily maximum precipitation (RX1DAY) and the five-day maximum precipitation (RX5DAY). The consistent right deviation of the arrow indicates that the precipitation peak leads the yield change by about 1/4–1/2 cycles (lagging 1–2 years). The wavelet coherence (WTC) analysis further confirmed (Figure 9c,h) that the coherence between precipitation intensity (SDII) and yield was significant in the short period (0.5–2 years) (WTC > 0.6), especially during 2010–2015, reflecting that the immediate impact of concentrated heavy precipitation on yield fluctuations was enhanced. It is worth noting that the long-period (4-year) coherence of RX5DAY is higher than that of RX1DAY, indicating that the contribution of persistent extreme precipitation to systemic risk is more prominent.
The antagonism between drought and wet events is clearly characterized in(Figure 10b,e). The drought duration (CDDs) and yield showed a significant anti-phase in the 4-year cycle (the arrow in Figure 10b pointed to the lower left), and the XWT high-energy region and the 180 °phase difference jointly confirmed the direct inhibition mechanism of drought on yield. The correlation of continuous wet days (CWDs) shows complex spatial and temporal characteristics: long-period (8 years) XWT shows a positive phase (Figure 10e arrow), but short-period (2–4 years) weak coherence (WTC > 0.6) is compared with short-period weak correlation, revealing the differential influence of total precipitation and distribution timing.
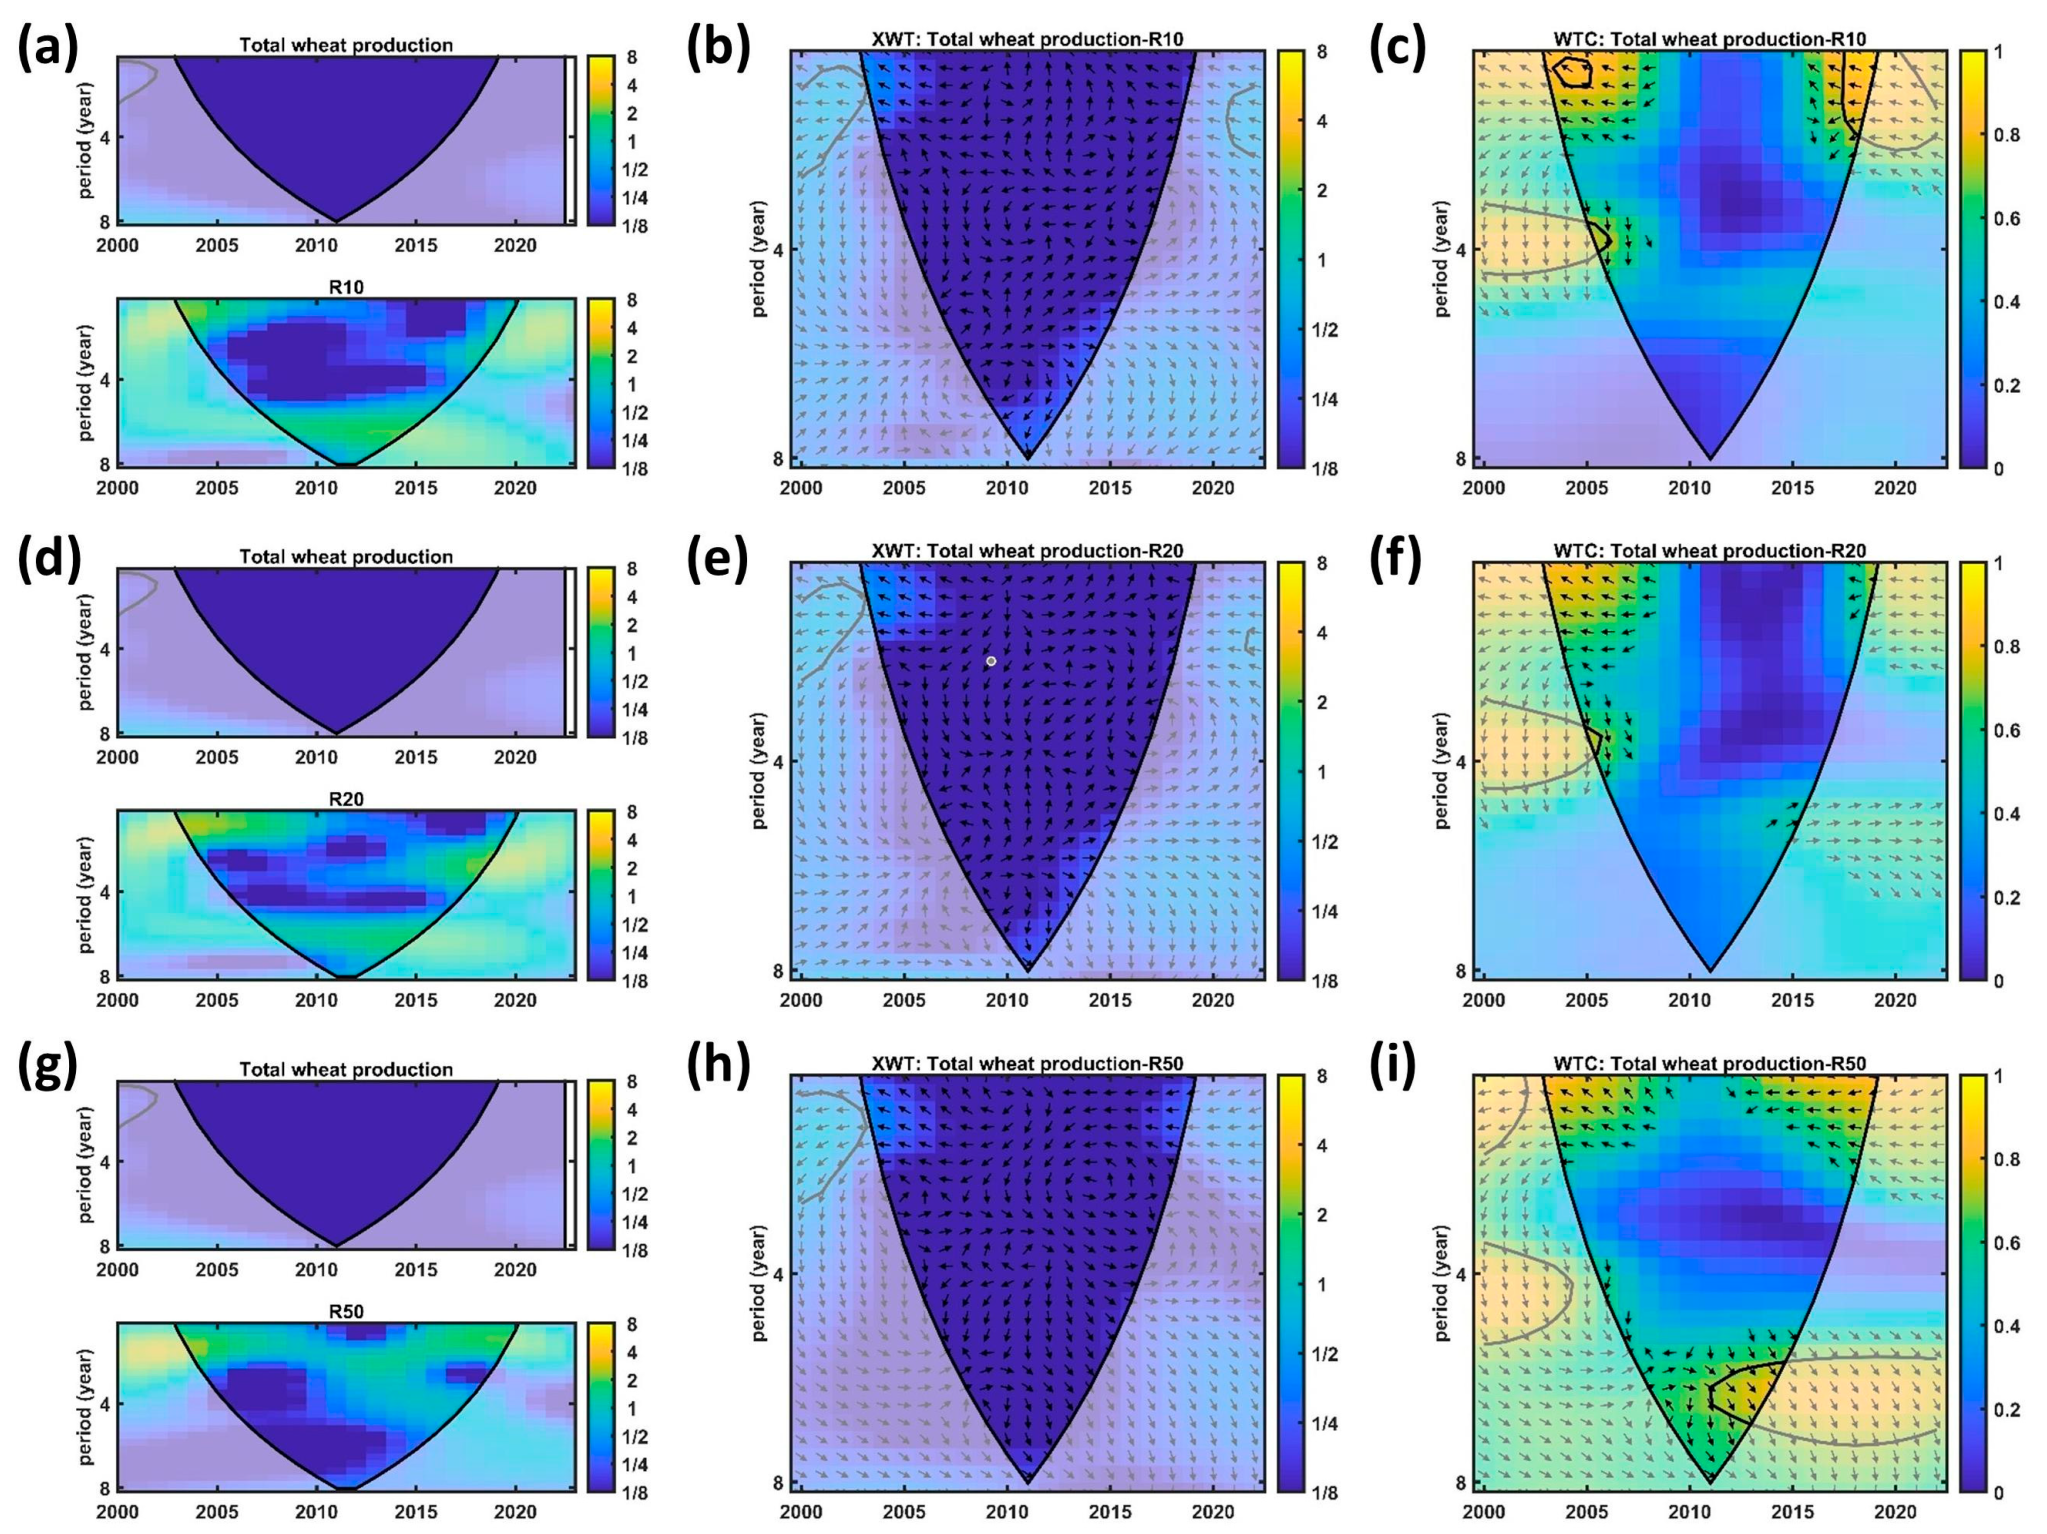
There is a significant gradient in the influence intensity of the absolute threshold index (Figure 11b,c,f,h,i). The XWT energy intensity (dark area in Figure 11h) and WTC value (0.8, Figure 11i) of R50 (daily precipitation ≥ 50 mm) are much higher than those of R10 (≥10 mm, WTC ≈ 0.4). The spatio-temporal evolution showed that R50 formed a continuous high-coherence zone (WTC > 0.6) at the 2-year periodic scale after 2015, and the right deviation of the phase arrow indicated the lag effect of the rainstorm event on the yield (about 1 year). In contrast, although R20 (≥20 mm) has an intermittent high coherence in the four-year cycle, the overall impact intensity (WTC peak 0.6) is weaker than R50, highlighting the key to the extreme precipitation intensity threshold.
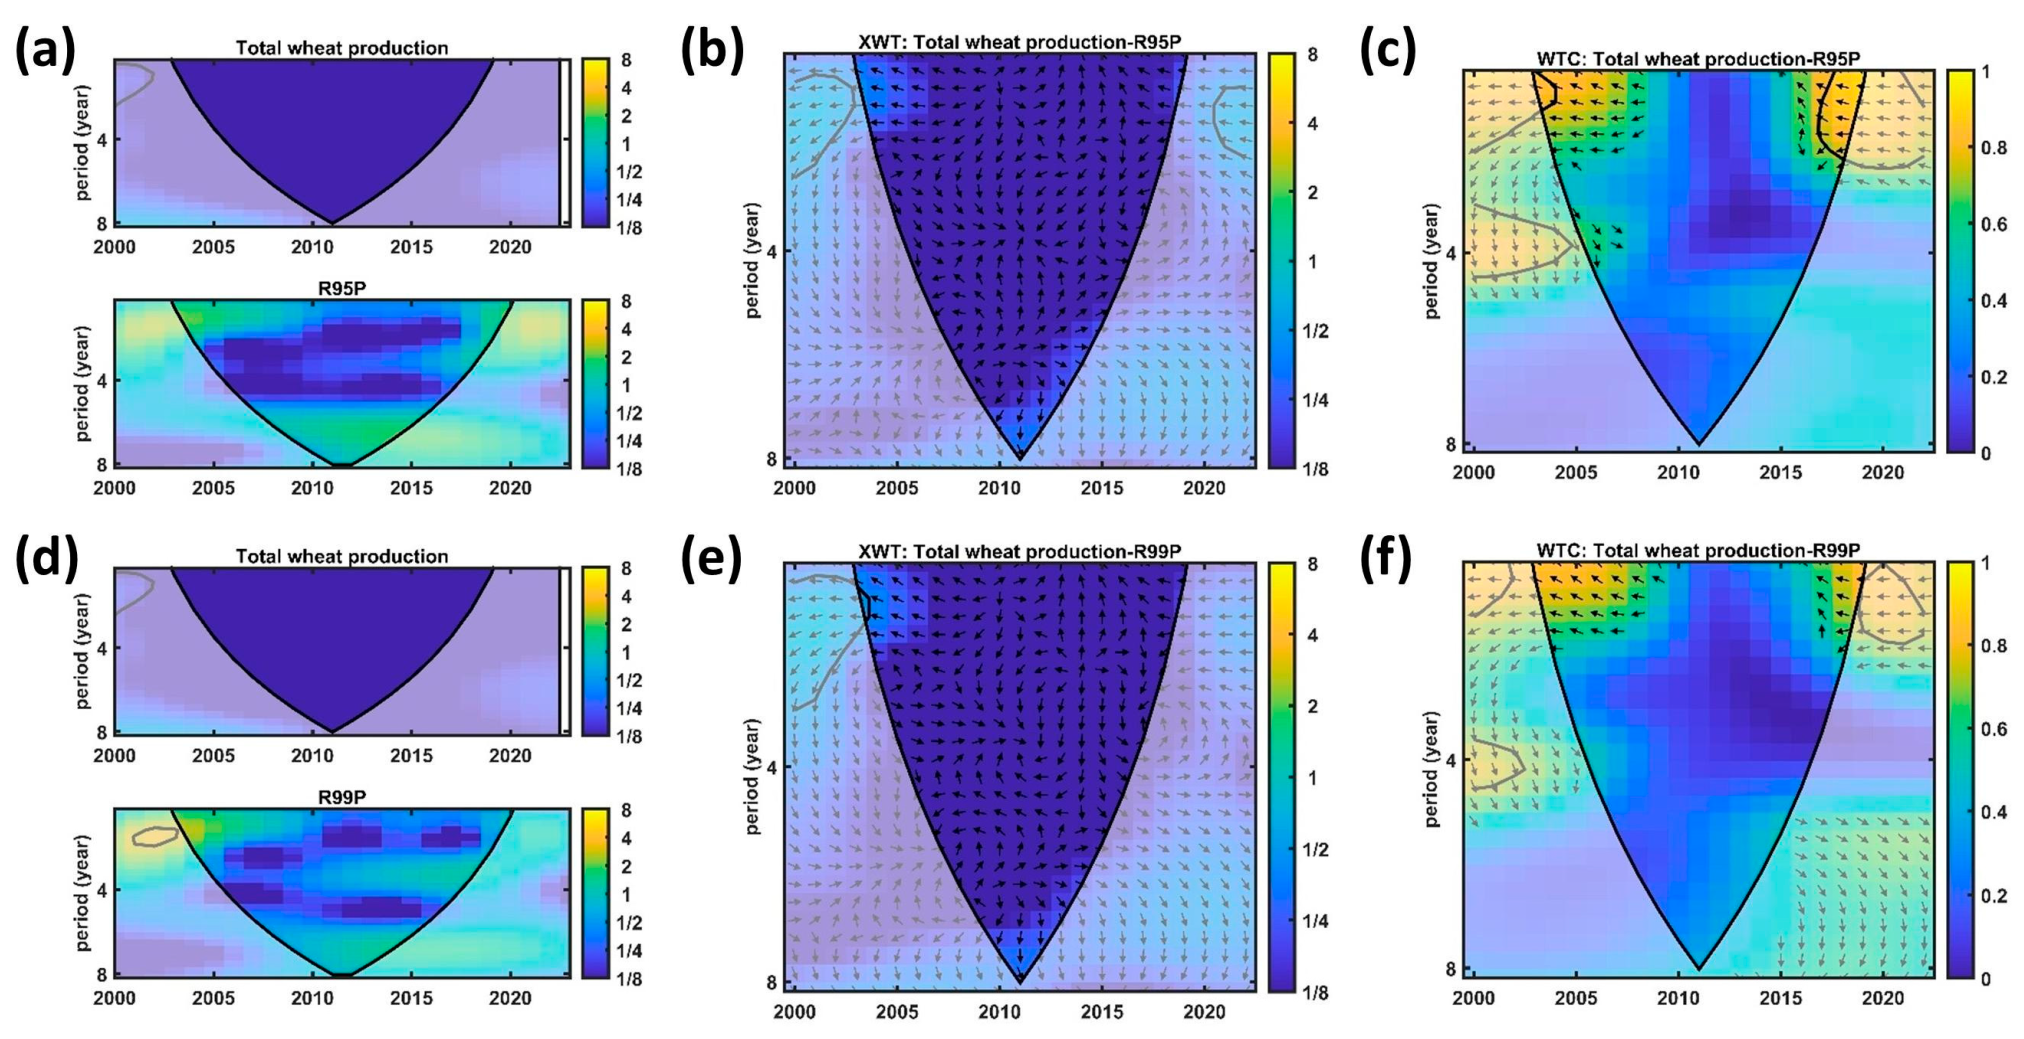
The stress of the relative threshold index (R95P/R99P) on yield has increased significantly in the past decade (Figure 12b,e). The coherence of R99P (the first 1% extreme precipitation) in the short period (1–2 years) from 2010 to 2020 is more than 0.8 (Figure 12f dark red area), and the XWT arrow continues to shift to the right, indicating that the extreme rain disaster has an inhibitory effect on the yield by about a 1-year lag (Figure 12e). It is worth noting that although R95P (the first 5% extreme precipitation) is stably correlated with yield in the long period (4–8 years) (WTC > 0.6), its short-period influence is significantly weaker than that of R99P (WTC difference > 0.2) and R99P is becoming the main driving force of yield fluctuation.
On the 4–8-year periodic scale, the correlation between yield and daily maximum precipitation (RX1DAY), five-day maximum precipitation (RX5DAY), number of rainstorm days (R50), and extreme strong precipitation (R95P/R99P) showed stable high coherence (WTC > 0.6), and the coherence of R99P reached more than 0.8 in 2010–2020. The changes in these extreme precipitation indices generally lead the yield by 1/4–1/2 cycles (arrow to the right), indicating that the lag effect of extreme precipitation events on yield is about 1–2 years. It is worth noting that the correlation between precipitation intensity (SDII) and yield was significantly enhanced in a short period (0.5–2 years), while the drought duration (CDDs) directly inhibited yield formation with an inverse phase relationship (arrow left deviation), highlighting the antagonistic effect of drought and flood events.
The coherence of R50 (daily precipitation ≥ 50 mm) (0.8) is significantly higher than that of R10 (≥10 mm, coherence 0.4), which confirms that short-term heavy precipitation is more destructive to wheat production. The total precipitation (PRCPTOT) was positively correlated with yield in the long period, but the correlation was weak in the short period, reflecting the dual effects of moderate precipitation and excessive precipitation. The number of continuous wet days (CWDs) showed a positive correlation in the long term, and the phase was variable in the short term, revealing that there was a threshold limit for the yield increase effect. After 2010, the stress of extreme precipitation on yield continued to intensify, which was manifested by the significant increase in the coherence of R50, R99P, and other indicators in the 1–4-year cycle, and the driving effect of rainstorm events (R50) on yield fluctuation in the 2-year cycle was further enhanced after 2015.

4. Discussion

4.1. Temporal and Spatial Variation in Extreme Precipitation in Henan Province

The precipitation pattern in Henan Province changed from ‘uniform type’ to ‘concentrated rainstorm superimposed high-frequency drought intermittent’. The extreme precipitation is mainly concentrated in the southern and central regions with high intensity and frequency, while the precipitation in the north is relatively less [39,71,72,73]. The enhancement of thermal conditions leads to an increase in precipitation intensity per unit time, which leads to the frequent occurrence of short-term heavy precipitation events. Based on the CMIP6 model, it is predicted that under the high-emission scenario (SSP5-8.5), the annual total precipitation in southern Henan will increase by more than 250 mm at the end of this century and the intensity of extreme precipitation will increase significantly [74]. At the same time, the future precipitation in Henan will show the characteristics of ‘slight increase in total amount but sharp increase in concentration’. This centralization trend has lengthened the drought interval and formed the characteristics of ‘drought–flood abrupt alternation’ [74,75]. El Niño years are prone to drought because it inhibits the northward jump of the western Pacific monsoon trough; in La Nina years, the risk of heavy rain increases. ENSO phase oscillation leads to the increase in drought–flood alternation frequency [76,77,78]. At the same time, the average annual potential evaporation in Henan increased by 12% from 1990 to 2020, but the precipitation variability increased (the interannual fluctuation in the north reached 30%) [79]. The 4–8-year-long period in the periodic variation in precipitation in Henan Province may be related to ENSO phenomenon. Studies have shown that ENSO events have a significant impact on precipitation in China, especially in the period of 4–8 years. There is a significant correlation between ENSO events and precipitation changes in China during the 4–8-year cycle, especially in the eastern and southern regions [80]. Through research and analysis, it is found that the relationship between ENSO events and precipitation shows significant common power and phase difference in a period of 4–8 years [81]. After the soil moisture deficit in the warm and dry period, the subsequent precipitation needs to give priority to supplement soil water storage and prolong the time of surface runoff generation, thus forming a ‘drought–storm–waterlogging’ chain response. The dynamic triggering mechanism of mountain terrain leads to significant differences in precipitation between the north and the south of Henan Province. For example, the terrain uplift of Funiu Mountain and the south slope of Taihang Mountain only contributes 4.9% of the precipitation in Zhengzhou in July [72]. WRF simulation shows that reducing the height of Funiu Mountain can reduce the rainfall of rainstorm center by 26% [82]. At the same time, the ‘bistable switching’ of the circulation mode is the direct cause of the drought and flood mutation. When the subtropical high continues to be strong, the ‘Kongmei’ drought appears in Henan; when it is coupled with typhoon, it triggers extreme rainstorms [83,84].
The drying core area characterized by a ‘shortened wet period and reduced rainfall’ was formed in autumn in Henan. From 1960 to 2001, the autumn precipitation in the lower reaches of the Yellow River showed a significant downward trend, while the spring and winter showed an upward trend. Henan presents the characteristics of ‘warm and dry’ [85]. At the same time, from 2000 to 2019, the standardized precipitation evapotranspiration index of 31% of meteorological stations in Henan decreased significantly and 85% of the decline stations were concentrated in the central and northern cities, indicating that the drying trend has intensified since the 21st century [86]. SPEI-based drought monitoring shows that the frequency of autumn drought in Henan is second only to spring and summer, and the intensity of autumn drought shows regional differences [76]. It is worth noting that the study in 2024 further verifies that spring and autumn are the high-incidence seasons of drought in Henan, and the core area of drought shifts to the north, which is consistent with the results of historical SPEI analysis [87]. Although Henan’s climate experienced the wettest decade in Henan in the 2000s, the increase in the proportion of wet grades in the 2010s was accompanied by a rebound in the drought grade, suggesting that the stability of the wet period weakened [86]. In this context, the natural wetland in Henan decreased by 74% and the artificial wetland increased, but the water storage capacity was limited. In addition, the decrease in precipitation in autumn and the overexploitation of groundwater accelerate the formation of the core area of drying [88]. At the same time, autumn is a critical period for winter wheat sowing, but reduced precipitation has forced irrigation to rely on groundwater, exacerbating the regional water balance deficit for a long time [89].

4.2. The Yield Distribution Difference in Winter Wheat in Henan

The yield of winter wheat in Henan formed a spatial pattern of ‘rigid stability in the core area–climate sensitivity in the transitional zone–continuous shrinkage in the suburbs’. The yield of the central and northern and eastern subregions (core area) of Henan Province was significantly higher than that of other regions and showed a steady upward trend from 1987 to 2017 [90,91]. The accumulated temperature (key heat index) of its strong climate adaptability is strongly positively correlated with yield. The accumulated temperature in the core area is high and increases every ten years to meet the needs of crops [91], and the irrigation facilities are perfect. The drought resistance index is 0.44–0.62, and the drought vulnerability is low [92].
The meteorological drought index (sc-PDSI) showed that drought in February had a significant positive effect on yield in the western region (i.e., drought led to yield reduction), while drought in December/May had a negative effect on yield in the central and northern regions [90]. Phenological period is highly sensitive to temperature response. The phenophase before winter (three leaf stage, tillering stage) was delayed by 4.36–6.92 days per decade due to the increase in temperature, while the heading stage/filling stage was advanced by 2.91–3.97 days, and the growth rhythm was disordered [93]. The correlation between phenological period change and minimum temperature is the strongest, indicating that the transition zone is more sensitive to heat change [94]. The yield stability of the western subregion is lower than that of the core region and it is more driven by climate [90]. Furthermore, the correlation between the core area and the transition zone makes the high stability of the core area partly due to the climate barrier effect of the transition zone, but the sensitivity of the transition zone itself is intensified [95].
The planting belt in the suburbs (around the city) continued to shrink and the planting area decreased significantly. This phenomenon is mainly driven by two factors: first, urban expansion and construction land expansion lead to the loss of cultivated land, and the proportion of agricultural planting in areas with a higher urbanization rate is lower and the shrinkage rate is faster; second, the decline in planting income and the rise in agricultural costs in the suburbs have prompted farmers to shift to non-agricultural industries [93,95].

4.3. Effect of Extreme Precipitation on Grain Yield

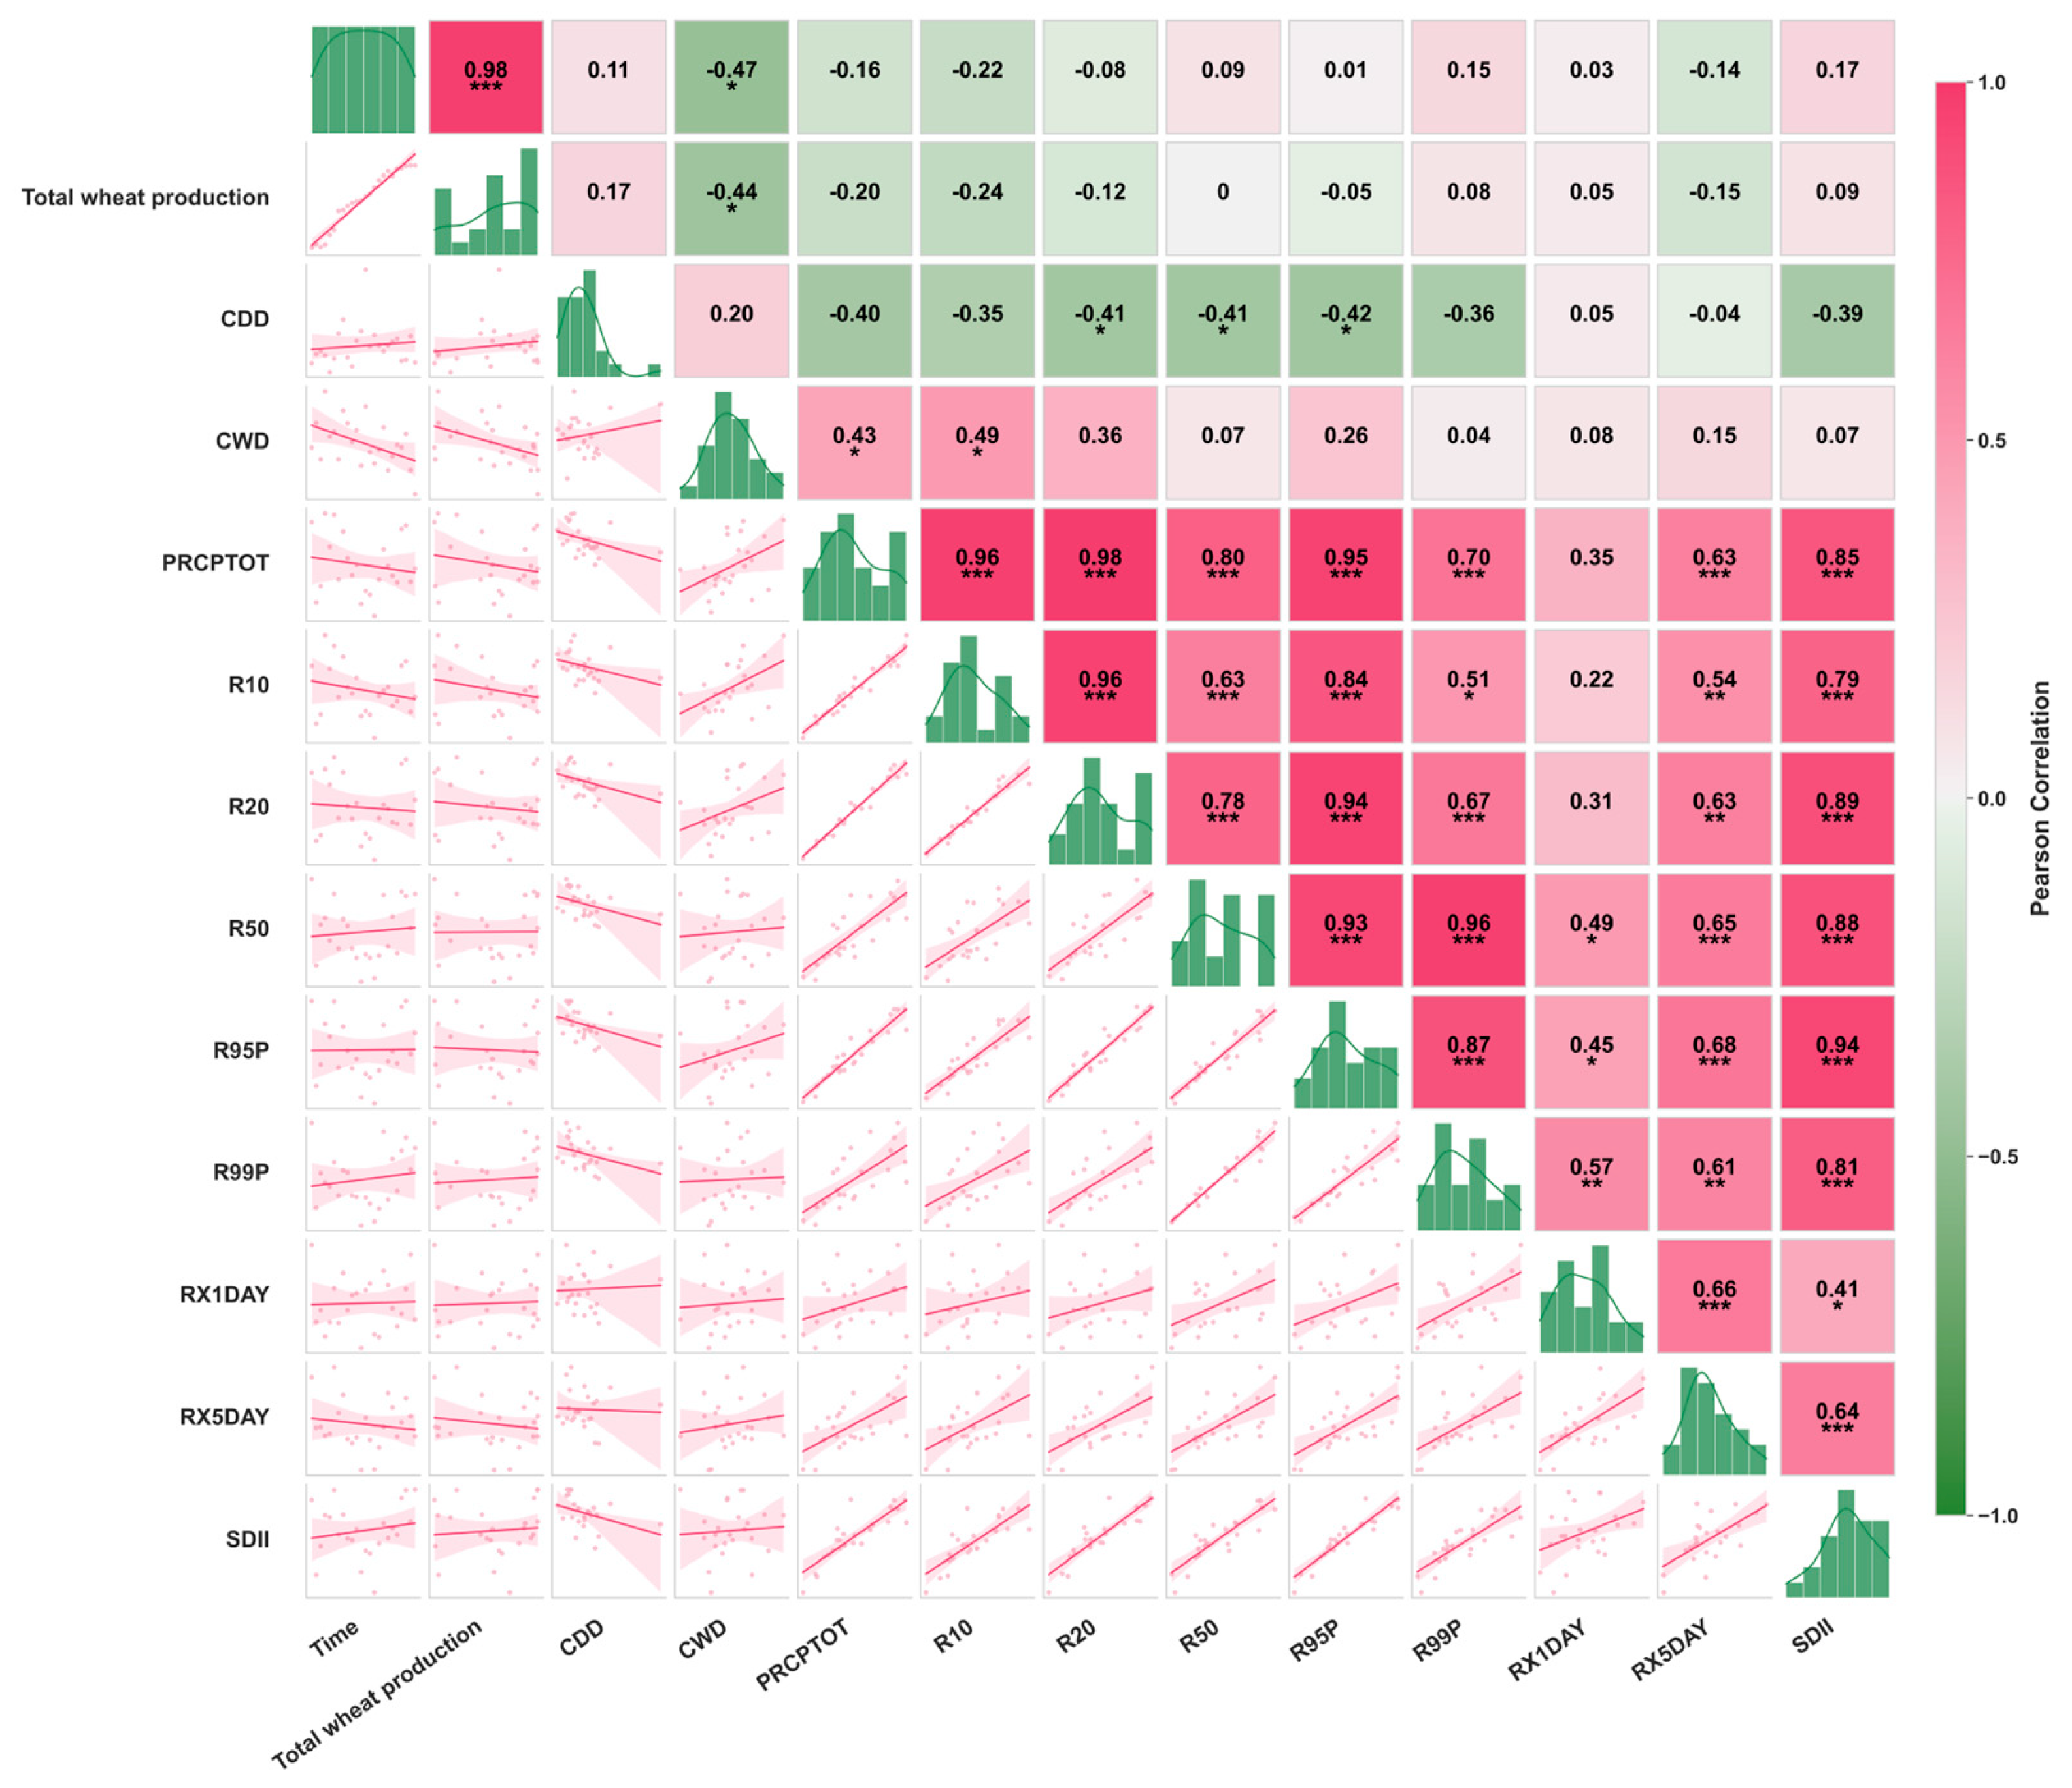
The response characteristics of winter wheat to seasonal precipitation were revealed by analyzing the correlation between winter wheat yield and seasonal extreme precipitation index in Henan Province [71]. The results showed that summer extreme precipitation events generally had a negative effect on winter wheat yield. Specifically, ‘continuous wet days’ (CWDs) were significantly negatively correlated with yield (Figure 13), indicating that persistent precipitation was the main stress factor. In addition, most extreme precipitation indices were negatively correlated with yield, which was mainly attributed to waterlogging disasters, disease epidemics, grain mildew caused in the late May to early June during the milky mature stage of wheat and the early summer rain, heavy precipitation, and continuous humid environment, which eventually led to significant yield reduction. It is worth noting that the number of ‘continuous dry days’ (CDDs) in summer is positively correlated with yield. Relevant studies have shown that the CDDs of the province showed an upward trend from 1971 to 2018, and the mutation increased after 1996 [80]. In the same period, the yield of winter wheat continued to increase, which was synchronized with the upward trend of CDDs [81]. At the same time, the ‘continuous rainless days’ (CDDs) in summer was positively correlated with yield. Its essence is the result of growth period dislocation and drought adaptability response. Henan winter wheat has been harvested in early June. The high-value period of CDDs in summer (June–August) did not overlap with the growth period of wheat for a long time.
At the same time, the continuous rainless days at the beginning of summer will reduce the loss of pests and diseases. At the same time, the county-scale yield data cannot distinguish irrigation and rain-fed fields, and the extreme precipitation index does not cover hail and wind disasters. The physical explanation of the lag effect still needs to be verified by field experiments.
Studies have shown that every 1% increase in precipitation from heading to maturity in the middle and lower reaches of the Yangtze River will lead to a 0.3%–0.8% reduction in winter wheat yield [96]. In Henan Province, there is a negative correlation between grain yield and extreme precipitation intensity in summer. The increase in extreme precipitation in summer by 10% will increase the fluctuation rate of grain yield (the degree of deviation of actual yield from the long-term trend value) by 1.2% [89]. This influence mechanism is mainly reflected in the following aspects: the accumulation of water in farmland caused by extreme precipitation in summer will lead to the long-term overwetting of soil, destroy soil aggregate structure, and reduce aeration, thus affecting the sowing quality of subsequent crops [73]. Secondly, for the winter wheat planting system, mid-October is the key sowing period. If the previous crop (such as summer maize) fails to be harvested or grow due to flood disasters, the suitable sowing window of winter wheat will be significantly compressed, resulting in problems such as delayed sowing or uneven emergence [73]. Furthermore, the extreme precipitation in summer may also form a ‘flood–drought sharp turn’ phenomenon in the subsequent drought period by raising the groundwater level. This superposition effect of waterlogging and high temperature and drought will aggravate the water stress of winter wheat. Relevant studies have shown that the alternating occurrence of drought and waterlogging has a significantly greater impact on crop yield reduction than a single disaster [97,98]. In other seasons, the extreme precipitation index and the grain yield of winter wheat are positively correlated or negatively correlated but not significant. It may be due to the mismatch of data. The extreme precipitation studied is daily scale, while the annual yield of winter wheat is interannual scale.

4.4. The Imbalance of Precipitation Distribution (Autumn Drought Inhibits Sowing Water Supply and Summer Rainstorm–Drought Are Intermittent) Aggravates the Yield Instability

The seasonal distribution imbalance of precipitation in Henan Province leads to the contribution rate of extreme rainstorm events in summer reaching 20–50%, and alternates with drought events [99]. After 2000, the SPEI index showed a significant downward trend and the drought cycle was shortened to 2–10 years. While the intensity of extreme rainstorms in summer is enhanced, it is often accompanied by periodic drought, forming a typical ‘drought–flood abrupt alternation’ phenomenon [72,86,100]. The effective rainfall in winter wheat sowing period (September-October) was only 7.48 mm, which was significantly lower than the crop water requirement threshold of 49.8 mm, causing water stress during the sowing period [29,30]. Drought leads to a decrease in stomatal conductance by 77%, a decrease in net photosynthetic rate by 60% [31], a decrease in 1000-grain weight by 12–18%, and a decrease in yield by 20–40% [101]. Studies have shown that a water deficit of 60 mm during the sowing period can reduce the emergence rate by 35%, and insufficient reservoir storage in dry years will further amplify the risk of water supply [102].
The spatial–temporal imbalance of precipitation aggravates yield fluctuation through the following dual mechanisms: (1) autumn drought inhibits water supply during the sowing period and weakens basic seedling condition; (2) summer rainstorm–drought alternates through physical damage, physiological stress, and water use efficiency decline, forming compound growth period stress. This mechanism has been verified by a drought index–yield model (R2 = 0.689), DFAA control experiment, and historical disaster data [103,104]. In the future, it is necessary to build a collaborative strategy of ‘precise water regulation–engineering resilience improvement–planting structure optimization’ to hedge climate risks.
Winter wheat production in Henan Province is faced with a systematic drought–flood synergistic risk with a cycle of 4–8 years. The risk is gradually amplified by the triple path of ‘climate oscillation–soil moisture lag–regional differentiation’: the Pacific Decadal Oscillation (PDO) and the El Niño-Southern Oscillation (ENSO) jointly modulate the intensity of the East Asian monsoon and dominate the precipitation oscillation in Henan Province on this time scale. The negative phase of PDO increases the frequency of summer flood in southern Henan by 37%, while the warm phase of ENSO induces the spring drought in northern Henan, and the coupling of the two forms the ‘drought and flood disaster chain’ [80,81,105]. Drought events led to the continuous loss of deep soil water storage (the average annual decrease in groundwater in northern Henan was 12.5 mm), and floods caused soil salinization, both of which weakened the crop water use efficiency in the subsequent 2–3 growth stages. AEZ model calculation shows that the difference between light and temperature production potential and actual yield (YG2-a) in northern Henan is 42% higher than that in southern Henan, which confirms the long-term restriction of drought and flood synergy on production potential [105,106]. Although the drought disaster center has long been located in southern Henan, the vulnerability of drought in northern Henan has increased due to the overexploitation of groundwater, showing a synergistic risk pattern of ‘northern drought and southern flood’ [107,108,109].

5. Conclusions

Based on the multi-dimensional analysis of extreme precipitation index and grain yield in Henan Province of China from 2000 to 2023, this study reveals the response characteristics of grain yield to extreme precipitation in Henan Province. The main conclusions are as follows:
(1)
The spatial and temporal characteristics of extreme precipitation are significantly different, and seasonal mutations and interannual fluctuations coexist.
The extreme precipitation in Henan Province showed the characteristics of ‘high-frequency oscillation-weak trend-strong spatial heterogeneity’ from 2000 to 2023. In autumn, a ‘warm and dry’ region with the central plain as the core was formed. The number of drought duration days (CDDs) increased and the period of wet duration (CWD) shortened. In 2010, there was a turning point for drought intensification, which seriously restricted the water supply of winter wheat during sowing. In summer, it turned to the ‘concentrated rainstorm superimposed high-frequency drought intermittent’ model. After 2010, the rainstorm events (R99p) increased significantly, and the total precipitation highlighted the pattern of ‘more in the south and less in the north’ in space. The abrupt change analysis showed that 2010 (increased rainstorm), 2005 (sudden drop of extreme precipitation in winter), and 2007 (shortened wet period in summer) were the key turning points, and the trend reversal of multiple indicators occurred simultaneously from 2015 to 2020. The southern mountainous area has always been a high-value area of extreme precipitation, and the flood risk is prominent, while the drought risk in the northern plains continues to rise.
(2)
The planting stability of winter wheat was improved, but the local vulnerability persisted.
The spatial pattern of winter wheat planting is characterized by the three-level differentiation of ‘stable core area, sensitive transition zone and shrinking suburban area’. The core area of Huang-Huai-Hai Plain (113°E–115°E, 34°N–35°N) has a high yield and low volatility (CV > 2.24), which is under the dual stress of drought vulnerability and phenological phase disorder. The suburban area continues to shrink due to the squeeze of urbanization. The province’s output stability jumped from 2011 to 2015 and the core area formed a ‘deep blue triangle’ low fluctuation zone. However, after 2016, there was a production reduction patch in the central Henan Plain, exposing local systemic risks.
(3)
There is a multi-scale stress mechanism of extreme precipitation on winter wheat yield.
The core mechanism of extreme precipitation on the periodic stress of winter wheat yield in Henan can be summarized in the following three aspects: (1) in the long term (4–8 years), the synergy of drought and flood transmits systemic risk through a lag effect; (2) in the short term (0.5–4 years), the direct impact of rainstorms (SDII) and extreme heavy precipitation (R99p) continued to increase; (3) the change in precipitation anomaly is about 1/4–1/2 cycles ahead of the yield response (providing an early warning window period of about 1–2 years). The imbalance of precipitation distribution in time series data (drought and heavy precipitation) is one of the key factors that aggravates the instability of yield. Against the background of climate warming, the Henan agricultural system is facing the severe challenge of increasing extreme precipitation. In the future, it is necessary to improve climate resilience based on the ‘partition governance’ strategy and the ‘periodic response’ mechanism.

Author Contributions

Conceptualization, K.S.; methodology, K.S., F.Z. and R.L.; validation, T.C. and P.L.; formal analysis, K.S., F.Z. and T.C.; resources, R.L., B.L. and Y.H.; data curation, K.S.; writing—original draft preparation, K.S.; writing—review and editing, K.S. and T.C.; visualization, K.S. and Z.S.; supervision, P.L.; project administration, P.L.; funding acquisition, P.L. All authors have read and agreed to the published version of the manuscript.

Funding

This research was funded by “Research on the Evaluation Method of “Carbon Neutrality” Progress in Qinghai Province, grant number 2023-ZJ-726”, “Response of Grassland Ecosystem Carbon Sources/Sinks to Climate Change in Sanjiangyuan National Park, grant number 2024ZY012”, and “Socio-economic Influencing Factors of Soil Erosion in Huangshui River Basin and Its Control Measures, grant number 23Q061”, the APC was funded by 2023-ZJ-726.

Data Availability Statement

The original data presented in this study are openly available in the NOAA Global Summary of the Day (GSOD) repository at (https://www.ncei.noaa.gov/data/global-summary-of-the-day/archive/, accessed on 7 June 2025); Planting distribution data set of winter wheat with 30 m resolution in China from 2001 to 2024 dataset is provided by National Ecosystem Science Data Center, National Science & Technology Infrastructure of China (http://www.nesdc.org.cn, accessed on 7 June 2025).

Conflicts of Interest

The authors declare no conflicts of interest.

References

  1. Sheng, K.; Li, R.; Chen, T.; Wang, L. Temporal and Spatial Variation Characteristics of Seasonal Differences in Extreme Precipitation in China Monsoon Region in the Last 40 Years. Water 2025, 17, 1672. [Google Scholar] [CrossRef]
  2. Pirani, A.; Fuglestvedt, J.S.; Byers, E.; O’Neill, B.; Riahi, K.; Lee, J.-Y.; Marotzke, J.; Rose, S.K.; Schaeffer, R.; Tebaldi, C. Scenarios in IPCC assessments: Lessons from AR6 and opportunities for AR7. npj Clim. Action 2024, 3, 1. [Google Scholar] [CrossRef]
  3. Tabari, H. Climate change impact on flood and extreme precipitation increases with water availability. Sci. Rep. 2020, 10, 13768. [Google Scholar] [CrossRef] [PubMed]
  4. Gründemann, G.J.; van de Giesen, N.; Brunner, L.; van der Ent, R. Rarest rainfall events will see the greatest relative increase in magnitude under future climate change. Commun. Earth Environ. 2022, 3, 235. [Google Scholar] [CrossRef]
  5. Westra, S.; Alexander, L.V.; Zwiers, F.W. Global increasing trends in annual maximum daily precipitation. J. Clim. 2013, 26, 3904–3918. [Google Scholar] [CrossRef]
  6. Myhre, G.; Alterskjær, K.; Stjern, C.W.; Hodnebrog, Ø.; Marelle, L.; Samset, B.H.; Sillmann, J.; Schaller, N.; Fischer, E.; Schulz, M.; et al. Frequency of extreme precipitation increases extensively with event rareness under global warming. Sci. Rep. 2019, 9, 16063. [Google Scholar] [CrossRef]
  7. Zhang, W.; Zhou, T.; Zou, L.; Zhang, L.; Chen, X. Reduced exposure to extreme precipitation from 0.5 °C less warming in global land monsoon regions. Nat. Commun. 2018, 9, 3153. [Google Scholar] [CrossRef]
  8. Zhang, W.; Zhou, T. Significant increases in extreme precipitation and the associations with global warming over the global land monsoon regions. J. Clim. 2019, 32, 8465–8488. [Google Scholar] [CrossRef]
  9. Singh, B.R.; Singh, O. Study of impacts of global warming on climate change: Rise in sea level and disaster frequency. In Global Warming—Impacts and Future Perspective; Intech Open: London, UK, 2012; pp. 94–118. [Google Scholar]
  10. Shivanna, K.R. Climate change and its impact on biodiversity and human welfare. Proc. Indian Natl. Sci. Acad. 2022, 88, 160–171. [Google Scholar] [CrossRef]
  11. Halkos, G.; Zisiadou, A. The effects of climate change to weather-related environmental hazards: Interlinkages of economic factors and climate risk. J. Risk Financ. Manag. 2023, 16, 264. [Google Scholar] [CrossRef]
  12. Lobell, D.B.; Schlenker, W.; Costa-Roberts, J. Climate trends and global crop production since 1980. Science 2011, 333, 616–620. [Google Scholar] [CrossRef] [PubMed]
  13. Vogel, E.; Donat, M.G.; Alexander, L.V.; Meinshausen, M.; Ray, D.K.; Karoly, D.; Meinshausen, N.; Frieler, K. The effects of climate extremes on global agricultural yields. Environ. Res. Lett. 2019, 14, 054010. [Google Scholar] [CrossRef]
  14. Li, Y.; Guan, K.; Schnitkey, G.D.; DeLucia, E.; Peng, B. Excessive rainfall leads to maize yield loss of a comparable magnitude to extreme drought in the United States. Glob. Change Biol. 2019, 25, 2325–2337. [Google Scholar] [CrossRef] [PubMed]
  15. Lesk, C.; Rowhani, P.; Ramankutty, N. Influence of extreme weather disasters on global crop production. Nature 2016, 529, 84–87. [Google Scholar] [CrossRef]
  16. Bao, L.; Yu, L.; Li, Y.; Yan, F.; Lyne, V.; Ren, C. Climate change impacts on agroecosystems in China: Processes, mechanisms and prospects. Chin. Geogr. Sci. 2023, 33, 583–600. [Google Scholar] [CrossRef]
  17. Dong, S.; Sun, Y.; Zhang, X. Attributing observed increase in extreme precipitation in China to human influence. Environ. Res. Lett. 2022, 17, 095005. [Google Scholar] [CrossRef]
  18. Peng, Y.; Zhao, X.; Wu, D.; Tang, B.; Xu, P.; Du, X.; Wang, H. Spatiotemporal variability in extreme precipitation in China from observations and projections. Water 2018, 10, 1089. [Google Scholar] [CrossRef]
  19. Chen, J.; Zhang, B.; Zhou, J.; Guo, F. Temporal and spatial changes of drought characteristics in temperate steppes in China from 1960 to 2020. Sustainability 2023, 15, 12909. [Google Scholar] [CrossRef]
  20. Yang, Y.; Dai, E.; Yin, J.; Jia, L.; Zhang, P.; Sun, J. Spatial and Temporal Evolution Patterns of Droughts in China over the Past 61 Years Based on the Standardized Precipitation Evapotranspiration Index. Water 2024, 16, 1012. [Google Scholar] [CrossRef]
  21. Cai, X.; Zhang, W.; Fang, X.; Zhang, Q.; Zhang, C.; Chen, D.; Cheng, C.; Fan, W.; Yu, Y. Identification of regional drought processes in North China using MCI analysis. Land 2021, 10, 1390. [Google Scholar] [CrossRef]
  22. Yuan, W.; Cai, W.; Chen, Y.; Liu, S.; Dong, W.; Zhang, H.; Yu, G.; Chen, Z.; He, H.; Guo, W.; et al. Severe summer heatwave and drought strongly reduced carbon uptake in Southern China. Sci. Rep. 2016, 6, 18813. [Google Scholar] [CrossRef] [PubMed]
  23. Liu, M.; Liu, P.; Guo, Y.; Wang, Y.; Geng, X.; Nie, Z.; Yu, Y. Change-point analysis of precipitation and drought extremes in China over the past 50 years. Atmosphere 2019, 11, 11. [Google Scholar] [CrossRef]
  24. Wu, M.; Zhu, Y.; Yang, Q. Diversification or specialisation? Farmers’ cropping strategy and economic performance under climate change in China. Int. J. Clim. Change Strat. Manag. 2021, 14, 20–38. [Google Scholar] [CrossRef]
  25. Fujita, M.; Mizuta, R.; Ishii, M.; Endo, H.; Sato, T.; Okada, Y.; Kawazoe, S.; Sugimoto, S.; Ishihara, K.; Watanabe, S. Precipitation changes in a climate with 2-K surface warming from large ensemble simulations using 60-km global and 20-km regional atmospheric models. Geophys. Res. Lett. 2019, 46, 435–442. [Google Scholar] [CrossRef]
  26. Allan, R.P.; Barlow, M.; Byrne, M.P.; Cherchi, A.; Douville, H.; Fowler, H.J.; Gan, T.Y.; Pendergrass, A.G.; Rosenfeld, D.; Swann, A.L.S.; et al. Advances in understanding large-scale responses of the water cycle to climate change. Ann. N. Y. Acad. Sci. 2020, 1472, 49–75. [Google Scholar] [CrossRef]
  27. Akpa, A.F. The effects of climate extreme events on selected food crop yields in Sub-Saharan Africa. Heliyon 2024, 10, e30796. [Google Scholar] [CrossRef]
  28. Lobell, D.B.; Field, C.B. Global scale climate–crop yield relationships and the impacts of recent warming. Environ. Res. Lett. 2007, 2, 014002. [Google Scholar] [CrossRef]
  29. Heino, M.; Kinnunen, P.; Anderson, W.; Ray, D.K.; Puma, M.J.; Varis, O.; Siebert, S.; Kummu, M. Increased probability of hot and dry weather extremes during the growing season threatens global crop yields. Sci. Rep. 2023, 13, 3583. [Google Scholar] [CrossRef] [PubMed]
  30. Fu, J.; Jian, Y.; Wang, X.; Li, L.; Ciais, P.; Zscheischler, J.; Wang, Y.; Tang, Y.; Müller, C.; Webber, H.; et al. Extreme rainfall reduces one-twelfth of China’s rice yield over the last two decades. Nat. Food 2023, 4, 416–426. [Google Scholar] [CrossRef] [PubMed]
  31. Liu, M.; Guo, Y.; Wang, Y.; Hao, J. Changes of Extreme Agro-Climatic Droughts and Their Impacts on Grain Yields in Rain-Fed Agricultural Regions in China over the Past 50 Years. Atmosphere 2021, 13, 4. [Google Scholar] [CrossRef]
  32. Li, Y.; Wang, X.; Xing, G.; Wang, D. Meteorological disaster disturbances on the main crops in the north–south transitional zone of China. Sci. Rep. 2024, 14, 8846. [Google Scholar] [CrossRef] [PubMed]
  33. Jian, Y.; Fu, J.; Zhou, F. A review of the impact of extreme precipitation on rice yield. Prog. Geogr. 2021, 40, 1746–1760. [Google Scholar] [CrossRef]
  34. Song, L.; Jin, J.; He, J. Effects of severe water stress on maize growth processes in the field. Sustainability 2019, 11, 5086. [Google Scholar] [CrossRef]
  35. Ojuederie, O.B.; Olanrewaju, O.S.; Babalola, O.O. Plant growth promoting rhizobacterial mitigation of drought stress in crop plants: Implications for sustainable agriculture. Agronomy 2019, 9, 712. [Google Scholar] [CrossRef]
  36. Rupngam, T.; Messiga, A.J. Unraveling the interactions between flooding dynamics and agricultural productivity in a changing climate. Sustainability 2024, 16, 6141. [Google Scholar] [CrossRef]
  37. Jiang, S.; Li, Z.; Yuan, H.; Jin, J.; Xiao, C.; Cui, Y. Quantification Assessment of Winter Wheat Sensitivity under Different Drought Scenarios during Growth. Water 2024, 16, 2048. [Google Scholar] [CrossRef]
  38. Wang, Z.; Wu, Y.; Xi, S.; Sun, X. Predictive study on extreme precipitation trends in Henan and their impact on population exposure. Atmosphere 2023, 14, 1484. [Google Scholar] [CrossRef]
  39. Chen, G.; Li, K.; Gu, H.; Cheng, Y.; Xue, D.; Jia, H.; Du, Z.; Li, Z. Climatic Challenges in the Growth Cycle of Winter Wheat in the Huang-Huai-Hai Plain: New Perspectives on High-Temperature–Drought and Low-Temperature–Drought Compound Events. Atmosphere 2024, 15, 747. [Google Scholar] [CrossRef]
  40. Wang, H.; Wan, Q.; Huang, W.; Niu, J. Spatial heterogeneity characteristics and driving mechanism of land use change in Henan province, China. Geocarto Int. 2023, 38, 2271442. [Google Scholar] [CrossRef]
  41. Xinfa, T.; Guozu, H.; Yonghua, W.; Dan, L.; Yan, L. Research on an equilibrium development model between urban and rural areas of Henan including carbon sink assets under the dual carbon goal. Front. Environ. Sci. 2023, 10, 1037286. [Google Scholar] [CrossRef]
  42. Song, Y.; Zhou, G.; Linderholm, H.W.; Wang, J.; Li, Y.; Wang, G.; Fu, Y.; Xu, J.; Shi, Y.; Xu, Y.; et al. Growth of winter wheat adapting to climate warming may face more low-temperature damage. Int. J. Clim. 2022, 43, 1970–1979. [Google Scholar] [CrossRef]
  43. Sun, J.; Fu, S.; Wang, H.; Zhang, Y.; Chen, Y.; Su, A.; Wang, Y.; Tang, H.; Ma, R. Primary characteristics of the extreme heavy rainfall event over Henan in July 2021. Atmos. Sci. Lett. 2022, 24, e1131. [Google Scholar] [CrossRef]
  44. Xiao, Y.; Yin, S.; Yu, B.; Fan, C.; Wang, W.; Xie, Y. The most extreme rainfall erosivity event ever recorded in China up to 2022: The 7.20 storm in Henan Province. Hydrol. Earth Syst. Sci. 2023, 27, 4563–4577. [Google Scholar] [CrossRef]
  45. Liu, L.; Basso, B.; Wang, X. Impacts of climate variability and adaptation strategies on crop yields and soil organic carbon in the US Midwest. PLoS ONE 2020, 15, e0225433. [Google Scholar] [CrossRef]
  46. Zhao, W.; Chou, J.; Li, J.; Xu, Y.; Li, Y.; Hao, Y. Impacts of extreme climate events on future rice yields in global major rice-producing regions. Int. J. Environ. Res. Public Health 2022, 19, 4437. [Google Scholar] [CrossRef]
  47. Trnka, M.; Feng, S.; Semenov, M.A.; Olesen, J.E.; Kersebaum, K.C.; Rötter, R.P.; Semerádová, D.; Klem, K.; Huang, W.; Ruiz-Ramos, M.; et al. Mitigation efforts will not fully alleviate the increase in water scarcity occurrence probability in wheat-producing areas. Sci. Adv. 2019, 5, eaau2406. [Google Scholar] [CrossRef]
  48. Xu, C.; Xu, Z.; Li, Y.; Luo, Y.; Wang, K.; Guo, L.; Hao, C. Drought Characteristics and Causes during Winter Wheat Growth Stages in North China. Sustainability 2024, 16, 5958. [Google Scholar] [CrossRef]
  49. Prakash, A.J.; Begam, S.; Vilímek, V.; Mudi, S.; Das, P. Development of an automated method for flood inundation monitoring, flood hazard, and soil erosion susceptibility assessment using machine learning and AHP–MCE techniques. Geoenvironmental Disasters 2024, 11, 14. [Google Scholar] [CrossRef]
  50. Qi, W.; Wang, S.; Chen, J. Inter-Comparison of Multiple Gridded Precipitation Datasets over Different Climates at Global Scale. Water 2024, 16, 1553. [Google Scholar] [CrossRef]
  51. Ombadi, M.; Nguyen, P.; Sorooshian, S.; Hsu, K.L. Develo intensity-duration-frequency (IDF) curves from satellite-based precipitation: Methodology and evaluation. Water Resour. Res. 2018, 54, 7752–7766. [Google Scholar] [CrossRef]
  52. Ikpaya, I.; Underwood, C. Towards high-temporal-resolution global monitoring of atmospheric carbon-dioxide using a compact spaceborne spatial heterodyne SWIR spectrometer: SHACS. Infrared Technol. Appl. XLIX 2023, 12534, 468–484. [Google Scholar]
  53. Yang, S.; Jones, P.D.; Jiang, H.; Zhou, Z. Development of a near-real-time global in situ daily precipitation dataset for 0000–0000 UTC. Int. J. Climatol. 2020, 40, 2795–2810. [Google Scholar] [CrossRef]
  54. El Hachem, A.; Seidel, J.; Imbery, F.; Junghänel, T.; Bárdossy, A. Space-time statistical quality control of extreme precipitation observations. Hydrol. Earth Syst. Sci. 2022, 26, 6137–6146. [Google Scholar] [CrossRef]
  55. Dong, J.; Fu, Y.; Yuan, W. Winter Wheat Distribution Mapping Dataset in China with 30-Meter Resolution (2001–2024); National Ecosystem Science Data Center: Beijing, China, 2023. [Google Scholar] [CrossRef]
  56. Dong, J.; Fu, Y.; Wang, J.; Tian, H.; Fu, S.; Niu, Z.; Han, W.; Zheng, Y.; Huang, J.; Yuan, W. Early-season mapping of winter wheat in China based on Landsat and Sentinel images. Earth Syst. Sci. Data 2020, 12, 3081–3095. [Google Scholar] [CrossRef]
  57. Dong, J.; Pang, Z.; Fu, Y.; Peng, Q.; Li, X.; Yuan, W. Annual Winter Wheat Mapping Dataset in China from 2001 to 2020. Sci. Data 2024, 11, 1218. [Google Scholar] [CrossRef]
  58. Fu, Y.; Chen, X.; Song, C.; Huang, X.; Dong, J.; Peng, Q.; Yuan, W. High-resolution mapping of global winter-triticeae crops using a sample-free identification method. Earth Syst. Sci. Data 2025, 17, 95–115. [Google Scholar] [CrossRef]
  59. Zhang, B.; Song, S.; Wang, H.; Guo, T.; Ding, Y. Evaluation of the performance of CMIP6 models in simulating extreme precipitation and its projected changes in global climate regions. Nat. Hazards 2024, 121, 1737–1763. [Google Scholar] [CrossRef]
  60. Tørseth, K.; Aas, W.; Breivik, K.; Fjæraa, A.M.; Fiebig, M.; Hjellbrekke, A.G.; Myhre, C.L.; Solberg, S.; Yttri, K.E. Introduction to the European Monitoring and Evaluation Programme (EMEP) and observed atmospheric composition change during 1972–2009. Atmos. Chem. Phys. 2012, 12, 5447–5481. [Google Scholar] [CrossRef]
  61. Renard, B.; Lang, M.; Bois, P.; Dupeyrat, A.; Mestre, O.; Niel, H.; Sauquet, E.; Prudhomme, C.; Parey, S.; Paquet, E.; et al. Regional methods for trend detection: Assessing field significance and regional consistency. Water Resour. Res. 2008, 44, W08419. [Google Scholar] [CrossRef]
  62. Ali, R.; Kuriqi, A.; Abubaker, S.; Kisi, O. Long-term trends and seasonality detection of the observed flow in Yangtze River using Mann-Kendall and Sen’s innovative trend method. Water 2019, 11, 1855. [Google Scholar] [CrossRef]
  63. Rajput, A.; Chaturvedi, P.; Verma, A.; Singh, D. Growth, Variability and Decomposition Analysis of Rice in Major States of India. J. Exp. Agric. Int. 2024, 46, 8–14. [Google Scholar] [CrossRef]
  64. Yu, L.; Yanbing, Z.; Yuchun, P. Spatial-temporal Variation Characteristics of Grain Yield per Unit Area and its Balanced Increasing Potential in China. Adv. J. Food Sci. Technol. 2015, 7, 558–565. [Google Scholar] [CrossRef]
  65. Dahal, N.M.; Xiong, D.; Neupane, N.; Zhang, S.; Yuan, Y.; Zhang, B.; Fang, Y.; Zhao, W.; Wu, Y.; Deng, W. Estimating and analyzing the spatiotemporal characteristics of crop yield loss in response to drought in the koshi river basin, Nepal. Theor. Appl. Clim. 2023, 152, 1053–1073. [Google Scholar] [CrossRef]
  66. Wang, Y.; Peng, Z.; Wu, H.; Wang, P. Spatiotemporal variability in precipitation extremes in the Jianghuai region of China and the analysis of its circulation features. Sustainability 2022, 14, 6680. [Google Scholar] [CrossRef]
  67. Padakandla, S.R.; Bhandari, A.; Atluri, A.K. Does climate impact vary across time horizons? A time–frequency analysis of climate-crop yields in India. Stoch. Environ. Res. Risk Assess. 2021, 36, 1689–1701. [Google Scholar] [CrossRef]
  68. Yang, X.; Sun, J.; Gao, J.; Qiao, S.; Zhang, B.; Bao, H.; Feng, X.; Wang, S. Effects of climate change on cultivation patterns and climate suitability of spring maize in Inner Mongolia. Sustainability 2021, 13, 8072. [Google Scholar] [CrossRef]
  69. Reddy, N.M.; Saravanan, S. Extreme precipitation indices over India using CMIP6: A special emphasis on the SSP585 scenario. Environ. Sci. Pollut. Res. 2023, 30, 47119–47143. [Google Scholar] [CrossRef]
  70. Grinsted, A.; Moore, J.C.; Jevrejeva, S. Application of the cross wavelet transform and wavelet coherence to geophysical time series. Nonlinear Process. Geophys. 2004, 11, 561–566. [Google Scholar] [CrossRef]
  71. Vale, T.M.C.D.; Spyrides, M.H.C.; Andrade, L.D.M.B.; Bezerra, B.G.; da Silva, P.E. Subsistence agriculture productivity and climate extreme events. Atmosphere 2020, 11, 1287. [Google Scholar] [CrossRef]
  72. Jin, Z.; Yu, J.; Dai, K. Topographic elevation’s impact on local climate and extreme rainfall: A case study of Zhengzhou, Henan. Atmosphere 2024, 15, 234. [Google Scholar] [CrossRef]
  73. Feng, X.; Zhang, F.; Wang, C. Gravity Waves Enhance the Extreme Precipitation in Henan, China, July 2021. Chin. Sci. Bull. 2022, 67, 2809–2828. [Google Scholar]
  74. Zhou, X.; Zhang, Y.; Wang, W.; Li, X.; Yang, H.; Sun, Y.; Guo, F. Social vulnerability assessment under different extreme precipitation scenarios: A case study in Henan Province, China. PLoS ONE 2024, 19, e0299956. [Google Scholar] [CrossRef]
  75. Wang, Z.; Jiang, B.; Wang, X.; Wang, D.; Xue, H. Psychological challenges and related factors of ordinary residents after “7.20” heavy rainstorm disaster in Zhengzhou: A cross-sectional survey and study. BMC Psychol. 2023, 11, 3. [Google Scholar] [CrossRef] [PubMed]
  76. Shi, B.; Zhu, X.; Hu, Y.; Yang, Y. Drought characteristics of Henan province in 1961–2013 based on Standardized Precipitation Evapotranspiration Index. J. Geogr. Sci. 2016, 27, 311–325. [Google Scholar] [CrossRef]
  77. Wang, S.; Huang, J.; He, Y.; Guan, Y. Combined effects of the Pacific decadal oscillation and El Niño-southern oscillation on global land dry–wet changes. Sci. Rep. 2014, 4, 6651. [Google Scholar] [CrossRef] [PubMed]
  78. Liang, P.; Zhi, X.F.; Zhang, F.; Zhang, R.H.; Tang, Y. The Extreme Precipitation Over the Yangtze–Huaihe River Basin in August 2021: Driven by the Rapid Tropical Atlantic Warming and the Second Developing La Niña. Adv. Atmos. Sci. 2022, 65, 1959–1975. [Google Scholar]
  79. Zhang, X.; Zheng, Z.; Ouyang, R. Study on Spatiotemporal Evolution Characteristics of Regional Annual Precipitation. Nat. Environ. Pollut. Technol. 2021, 20, 1243–1250. [Google Scholar] [CrossRef]
  80. Gao, T.; Cao, F.; Dan, L.; Li, M.; Gong, X.; Zhan, J. The precipitation variability of the wet and dry season at the interannual and interdecadal scales over eastern China (1901–2016): The impacts of the Pacific Ocean. Hydrol. Earth Syst. Sci. 2021, 25, 1467–1481. [Google Scholar] [CrossRef]
  81. Baddoo, T.D.; Guan, Y.; Zhang, D.; Andam-Akorful, S.A. Rainfall Variability in the Huangfuchuang Watershed and Its Relationship with ENSO. Water 2015, 7, 3243–3262. [Google Scholar] [CrossRef]
  82. Han, L.; Xi, L.; Zhao, Y.K.; Chen, Y.Q.; Zhang, Y.; Luo, Z.W.; Wang, Z.Y. A high-resolution numerical simulation of the “7.19” extraordinary heavy rainfall in Henan Province under topographic effect. Front. Earth Sci. 2022, 10, 1541. [Google Scholar]
  83. Zhang, Z.; Jin, Q.; Chen, X.; Xu, C.Y.; Jiang, S. On the linkage between the extreme drought and pluvial patterns in China and the large-scale atmospheric circulation. Adv. Meteorol. 2016, 2016, 8010638. [Google Scholar] [CrossRef]
  84. Vicente-Serrano, S.M.; Beguería, S.; López-Moreno, J.I. A multiscalar drought index sensitive to global warming: The standardized precipitation evapotranspiration index. J. Clim. 2010, 23, 1696–1718. [Google Scholar] [CrossRef]
  85. Lu, Q.; Zhang, J.B.; Zhang, F.; Li, R.Y.; Wang, Y.Y. Characteristics of the temporal variation in temperature and precipitation in China’s Lower Yellow River region. Theor. Appl. Climatol. 2024, 155, 3065–3081. [Google Scholar] [CrossRef]
  86. Lu, Q.; Zhang, F.; Wang, Y.Y.; Liu, J.Q.; Li, R.Y. Spatiotemporal Changes and the Prediction of Drought Characteristics in a Major Grain-Producing Area of China. Front. Environ. Sci. 2023, 11, 1275481. [Google Scholar]
  87. Li, Y.; Wang, X.; Wang, F.; Feng, K.; Li, H.; Han, Y.; Chen, S. Temporal and spatial characteristics of agricultural drought based on the TVDI in Henan Province, China. Water 2024, 16, 1010. [Google Scholar] [CrossRef]
  88. Li, H.; Wang, J.; Zhang, J.; Qin, F.; Hu, J.; Zhou, Z. Analysis of characteristics and driving factors of wetland landscape pattern change in Henan Province from 1980 to 2015. Land 2021, 10, 564. [Google Scholar] [CrossRef]
  89. Feng, X.; Wu, F.; Zai, S.; Wang, D.; Zhang, Y.; Chai, Q. Characteristics and Impacts of Water–Thermal Variation on Grain Yield in the Henan Province, China, on Multiple Time Scales. Agronomy 2023, 13, 429. [Google Scholar] [CrossRef]
  90. Li, C.; Gu, Y.; Xu, H.; Huang, J.; Liu, B.; Chun, K.P.; Octavianti, T. Spatial heterogeneity in the response of winter wheat yield to meteorological dryness/wetness variations in Henan province, China. Agronomy 2024, 14, 817. [Google Scholar] [CrossRef]
  91. Wang, Y.; Zhang, F.; Lu, Q.; Zhang, S.; Jin, T.; Li, R. Spatiotemporal Evolution of Winter Wheat Planting Area and Meteorology-Driven Effects on Yield under Climate Change in Henan Province of China. Earth Syst. Sci. Data 2022, 14, 2109. [Google Scholar] [CrossRef]
  92. Yuan, B.; Wang, S.; Guo, L. Drought Vulnerability Assessment of Winter Wheat Using an Improved Entropy–Comprehensive Fuzzy Evaluation Method: A Case Study of Henan Province in China. Atmosphere 2023, 14, 779. [Google Scholar] [CrossRef]
  93. Gao, Z. Extraction and spatio-temporal analysis of phenological dates of winter wheat in north Henan Province of China from 2003 to 2018 based on MODIS NDVI time series. PLoS ONE 2024, 19, e0300486. [Google Scholar] [CrossRef]
  94. Luo, Y.; Zhang, Z.; Zhang, L.; Cao, J. Spatiotemporal patterns of winter wheat phenology and its climatic drivers based on an improved pDSSAT model. Sci. China Earth Sci. 2021, 64, 2144–2160. [Google Scholar] [CrossRef]
  95. Zou, J.; Huang, Y.; Chen, L.; Chen, S. Remote Sensing-Based Extraction and Analysis of Temporal and Spatial Variations of Winter Wheat Planting Areas in the Henan Province of China. Open Life Sci. 2018, 13, 533–543. [Google Scholar] [CrossRef] [PubMed]
  96. Zuo, H.; Lou, Y.; Li, Z. Spatiotemporal variation of hourly scale extreme rainstorms in the Huang-Huai-Hai plain and its impact on NDVI. Remote Sens. 2023, 15, 2778. [Google Scholar] [CrossRef]
  97. Bi, W.; Weng, B.; Yan, D.; Zhang, D.; Liu, C.; Shi, X.; Jing, L.; Yan, S.; Wang, H. Response of summer maize growth to drought-flood abrupt alternation. Front. Earth Sci. 2023, 11, 1086769. [Google Scholar] [CrossRef]
  98. Ren, J.; Wang, Y.; Sun, X.; Liu, L.; Liu, X.; Li, G. Digested Slurry Analysis for Utilization Based on Irrigated Crop Water Demand. BioResources 2023, 18, 7098–7108. [Google Scholar] [CrossRef]
  99. Zhu, L.; Zhu, A.-X. Extraction of irrigation signals by using SMAP soil moisture data. Remote Sens. 2021, 13, 2142. [Google Scholar] [CrossRef]
  100. Zhao, W.; Liu, L.; Shen, Q.; Yang, J.; Han, X.; Tian, F.; Wu, J. Effects of water stress on photosynthesis, yield, and water use efficiency in winter wheat. Water 2020, 12, 2127. [Google Scholar] [CrossRef]
  101. Han, H.; Ren, Y.; Gao, C.; Yan, Z.; Li, Q. Response of winter wheat grain yield and water use efficiency to deficit irrigation in the North China Plain. Emir. J. Food Agric. 2017, 29, 971–977. [Google Scholar] [CrossRef]
  102. Liu, L.; Ma, J.; Hao, X.; Li, Q. Limitations of water resources to crop water requirement in the irrigation districts along the lower reach of the Yellow River in China. Sustainability 2019, 11, 4680. [Google Scholar] [CrossRef]
  103. Peng, K.; Peng, J. Temporal dynamics of standardized precipitation evapotranspiration index and its influence to summer maize yield from Kaifeng Region in He’nan Province. J. Geosci. Environ. Prot. 2017, 5, 80–89. [Google Scholar] [CrossRef]
  104. Zhang, M.; Liu, D.; Wang, S.; Xiang, H.; Zhang, W. Multisource remote sensing data-based flood monitoring and crop damage assessment: A case study on the 20 July 2021 extraordinary rainfall event in Henan, China. Remote Sens. 2022, 14, 5771. [Google Scholar] [CrossRef]
  105. Deng, G.; Tian, Z.; Wei, H. Quantitative assessment of the impact of climate change on winter wheat yields in Henan Province. Adv. Meteorol. Sci. Technol. 2022, 12, 30–36. [Google Scholar]
  106. Cheng, L.; Liu, R.; Wang, X. Preliminary study on the impacts of climate change on irrigated wheat in Henan Province and countermeasures. J. Appl. Meteorol. Sci. 2012, 23, 571–577. [Google Scholar]
  107. Ren, Y.; Zhao, Y.; Wang, C. Risk assessment and regionalization of drought insurance for winter wheat in Henan Province. J. Appl. Meteorol. Sci. 2011, 22, 537–548. [Google Scholar]
  108. Cao, Y. Simulation of Impacts of Potential Drought on Maize and Wheat Yields in China 1961–2010. Ph.D. Thesis, Chinese Academy of Agricultural Sciences, Beijing, China, 2014. [Google Scholar]
  109. Huang, X. Characterization of Spatial and Temporal Evolution of Groundwater in Henan Province Based on GRACE Satellite and MODFLOW Models. Master’s Thesis, Henan University, Zhengzhou, China, 2024. [Google Scholar] [CrossRef]
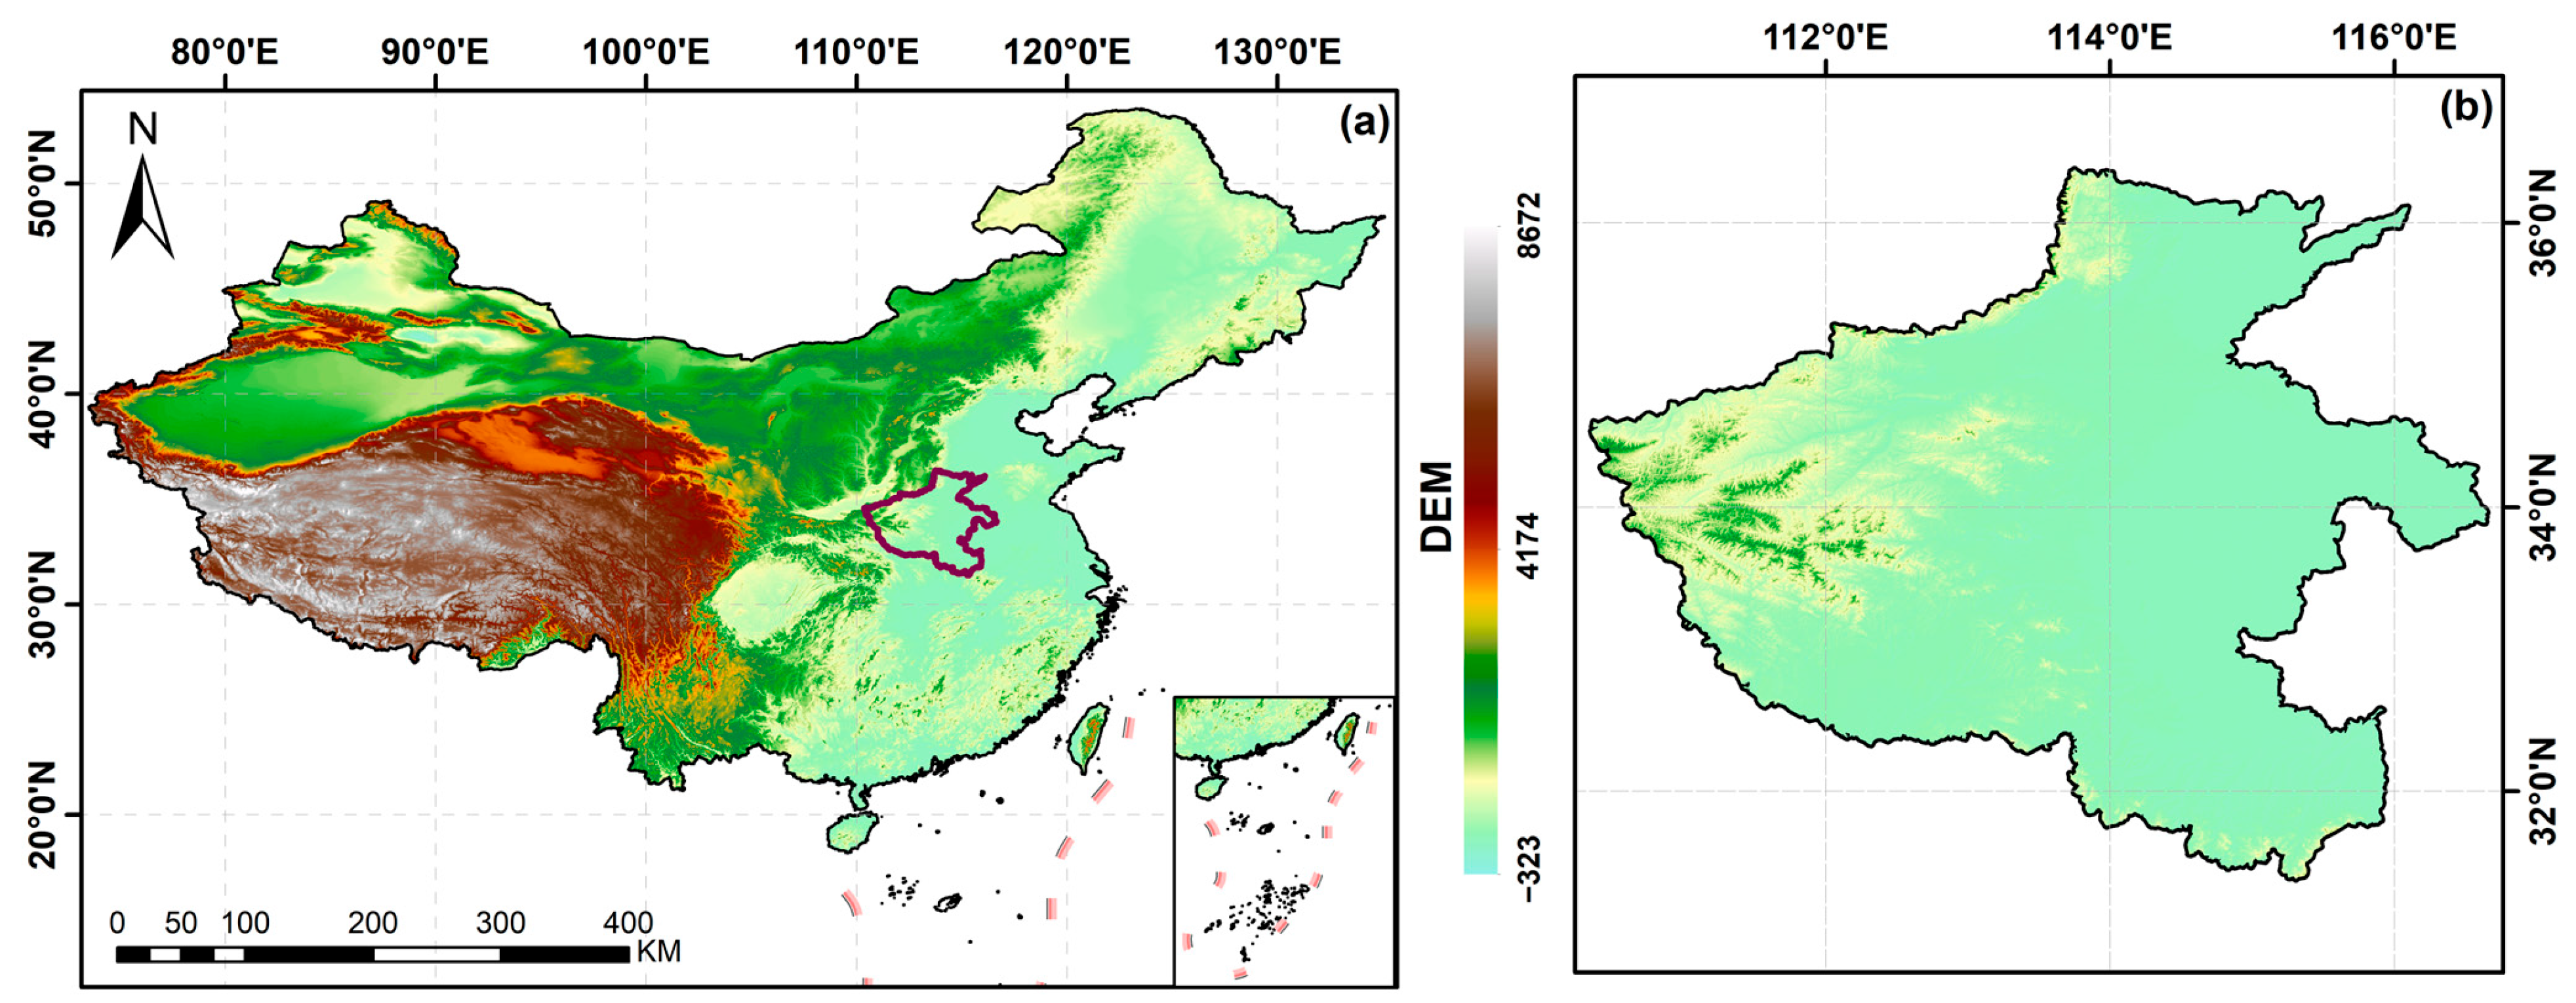
Figure 1. Geographical distribution map of Henan Province. ((a) Geographical location of the study area; (b) Enlarged schematic of the study area).
Water 17 02342 g001
Figure 2. Seasonal difference characteristics of extreme precipitation intensity index in Henan Province. (In Figure 2a1l1, the green point represents the statistical value of the corresponding seasonal index of the year.; the pink area: the 95% confidence interval; The rose red line: the fitting line). The (a1l1) are the interannual linear regression diagrams of RX1day, RX5day and SDII in spring, summer, autumn and winter, respectively. (a2l2) are the spatial distribution of RX1day, RX5day and SDII in spring, summer, autumn and winter, respectively. The (a3l3) are the MKII test charts of RX1day, RX5day and SDII in spring, summer, autumn and winter, respectively.
Water 17 02342 g002
Figure 3. Seasonal variation characteristics of extreme precipitation duration index in Henan Province. (In Figure 3a1l1, the green point represents the statistical value of the corresponding seasonal index of the year.; the pink area: the 95% confidence interval; The rose red line: the fitting line). The (a1l1) are the interannual linear regression diagrams of CDD, CWD and PRCPTOT in spring, summer, autumn and winter, respectively. (a2l2) are the spatial distribution of CDD, CWD and PRCPTOT in spring, summer, autumn and winter. The MKII test diagrams of CDD, CWD and PRCPTOT in spring, summer, autumn and winter are shown as (a3l3).
Water 17 02342 g003
Figure 4. Seasonal difference characteristics of absolute threshold index of extreme precipitation in Henan. (In Figure 4a1l1, the green point represents the statistical value of the corresponding seasonal index of the year.; the pink area: the 95% confidence interval; The rose red line: the fitting line). The (a1l1) are the interannual linear regression diagrams of R10, R20 and R50 in spring, summer, autumn and winter, respectively. (a2l2) are the spatial distribution maps of R10, R20 and R50 in spring, summer, autumn and winter, respectively. The MKII test diagrams of R10, R20 and R50 in spring, summer, autumn and winter are shown as (a3l3).
Water 17 02342 g004
Figure 5. Seasonal difference characteristics of relative threshold index of extreme precipitation in Henan. (In Figure 5a1h1, the green point represents the statistical value of the corresponding seasonal index of the year.; the pink area: the 95% confidence interval; The rose red line: the fitting line). The (a1h1) are the interannual linear regression plots of R95P and R99P in spring, summer, autumn and winter, respectively. (a2h2) are the spatial distribution of R95P and R99P in spring, summer, autumn and winter, respectively. The (a3h3) are the MKII test plots of R95P and R99P in spring, summer, autumn and winter, respectively.
Water 17 02342 g005
Figure 6. The spatial distribution map of grain planting in Henan Province from 2001 to 2023.
Water 17 02342 g006
Figure 7. Winter wheat interannual output.
Water 17 02342 g007
Figure 8. CV of winter wheat in Henan (2001−2023).
Water 17 02342 g008
Figure 9. Wavelet periodicity of single-index extreme precipitation intensity, XWT, and WTC of single indices. ((a,d,g) represent the continuous wavelet transform between the total yield of winter wheat and RX1day, RX5day and SDII, respectively. (b,e,h) represent the total yield of winter wheat and the XWT analysis of RX1day, RX5day and SDII, respectively; (c,f,i) represent the total yield of winter wheat and WTC analysis plots of RX1day, RX5day and SDII, respectively).
Water 17 02342 g009
Figure 10. Wavelet periodicity analysis of the precipitation duration index(XWT, and WTC analysis of single indices. ((a,d,g) represent the continuous wavelet transform between the total yield of winter wheat and CDD, CWD and PRCPTOT, respectively. (b,e,h) represent the total yield of winter wheat and the XWT analysis of CDD, CWD and PRCPTOT, respectively; (c,f,i) represent the total yield of winter wheat and WTC analysis plots of CDD, CWD and PRCPTOT, respectively).
Water 17 02342 g010
Figure 11. Analysis of wavelet periodicity, XWT, and WTC of the absolute threshold index with respect to single indicators. ((a,d,g) represent the continuous wavelet transform between the total yield of winter wheat and R10, R20 and R50, respectively. (b,e,h) represent the total yield of winter wheat and the XWT analysis of R10, R20 and R50, respectively; (c,f,i) represent the total yield of winter wheat and the WTC analysis of R10, R20 and R50, respectively).
Water 17 02342 g011
Figure 12. Analysis of wavelet periodicity, XWT, and WTC of the relative threshold index with respect to single indicators. ((a,d) represent the continuous wavelet transform between the total yield of winter wheat and R95P and R99P, respectively. (b,e) represent the total yield of winter wheat and the XWT analysis of R95P and R99P, respectively; (c,f) represent the total yield of winter wheat and the WTC analysis of R95P and R99P, respectively).
Water 17 02342 g012
Figure 13. Summer extreme precipitation index and winter wheat yield heat map (*, **, *** denote p < 0.10, p < 0.05 and p < 0.01, respectively).
Water 17 02342 g013
Table 1. Classification of 11 extreme precipitation indices.
CategoryCodeNameDefinitionUnit
Extreme precipitation intensity indexRx1dayMax 1-day precipitationMonthly maximum 1-day precipitationd
RX5dayMax 5-day precipitationMonthly maximum consecutive 5-day precipitationd
SDIISeasonal average daily precipitation intensityAverage daily precipitation in each seasonmm/d
Extreme precipitation duration indexCDDContinuous drought daysLongest continuous number of days with precipitation < 1 mm in a quarterd
CWDContinuous wet daysLongest continuous days of precipitation ≥1 mm in a quarterd
PRCPTOTTotal seasonal precipitationTotal precipitation in a quartermm
Relative threshold index of precipitationR95pExtremely strong precipitation exceeding 95% quantileSeasonal total precipitation when daily precipitation >95th percentilemm
R99pExtremely strong precipitation exceeding 99% quantileSeasonal total precipitation when daily precipitation >99th percentilemm
Absolute threshold index of precipitationR10Moderate rain dayDaily precipitation in the quarter ≥10 mmmm
R20Heavy rain daysDaily precipitation in the quarter ≥20 mmmm
R50Rainstorm daysDaily precipitation in the quarter ≥50 mmmm
Disclaimer/Publisher’s Note: The statements, opinions and data contained in all publications are solely those of the individual author(s) and contributor(s) and not of MDPI and/or the editor(s). MDPI and/or the editor(s) disclaim responsibility for any injury to people or property resulting from any ideas, methods, instructions or products referred to in the content.