Article

Integrated Environmental–Economic Assessment of CO2 Storage in Chinese Saline Formations

1
China Huaneng Clean Energy Research Institute, Beijing 102209, China
2
National Key Laboratory of High-Efficiency Flexible Coal Power Generation and Carbon Capture Utilization and Storage, Beijing 102209, China
3
General Prospecting Institute of China National Administration of Coal Geology, Beijing 100039, China
4
Key Laboratory of Transparent Mine Geology and Digital Twin Technology National Mine Safety Administration, Beijing 100039, China
*
Author to whom correspondence should be addressed.
Water 2025, 17(15), 2320; https://doi.org/10.3390/w17152320
Submission received: 26 May 2025 / Revised: 25 June 2025 / Accepted: 30 June 2025 / Published: 4 August 2025
(This article belongs to the Special Issue Mine Water Treatment, Utilization and Storage Technology)

Abstract

This study develops an integrated environmental–economic assessment framework to evaluate the life cycle environmental impacts and economic costs of CO2 geological storage and produced water treatment in saline formations in China. Using a case study of a saline aquifer carbon storage project in the Ordos Basin, eight full-chain carbon capture, utilization, and storage (CCUS) scenarios were analyzed. The results indicate that environmental and cost performance are primarily influenced by technology choices across carbon capture, transport, and storage stages. The scenario employing potassium carbonate-based capture, pipeline transport, and brine reinjection after a reverse osmosis treatment (S5) achieved the most balanced outcome. Breakeven analyses under three carbon price projection models revealed that carbon price trajectories critically affect project viability, with a steadily rising carbon price enabling earlier profitability. By decoupling CCUS from power systems and focusing on unit CO2 removal, this study provides a transparent and transferable framework to support cross-sectoral deployment. The findings offer valuable insights for policymakers aiming to design effective CCUS support mechanisms under future carbon neutrality targets.

1. Introduction

Limiting global warming to below 2 °C demands net-zero emissions by 2050, with carbon capture, utilization, and storage (CCUS) deemed indispensable for decarbonizing hard-to-abate sectors such as steel, cement, and fossil power [1,2,3,4,5]. China’s dual-carbon targets (announced by President Xi Jinping at the United Nations to peak carbon emissions by 2030 and achieve carbon neutrality by 2060) face unique challenges; as the world’s largest emitter, its coal-dominated energy system contributes ~30% of the global CO2 emissions [6]. Recent projections suggest that aggressive CCUS deployment could reduce China’s cumulative emissions by 3.8% by 2040, rising to 15–20% by 2060 through retrofitting coal plants and industrial facilities [6]. Geological storage in saline aquifers represents China’s most scalable solution, with an estimated capacity of 1.4 × 10¹¹ t CO2-equivalent (CO2-eq) to 40 years of national emissions at 2003 levels [7]. Key basins like the North China Plain and Sichuan Basin offer high injectivity but require rigorous evaluation of trade-offs between storage potential, leakage risks, and economic feasibility [7,8].
Life cycle assessment (LCA) has emerged as a standard tool to quantify the cradle-to-grave environmental impacts of CCS/CCUS systems, including capture, transport, and storage. Numerous LCA studies have analyzed fossil power plants with CO2 capture, finding that the capture step often dominates life cycle emissions and energy use. For example, Wu et al. performed LCA on six coal-fired power plant CCS scenarios in China and found that nearly all life cycle CO2 emissions still come from the plant operations and upstream coal processes, highlighting the importance of system boundaries in evaluating mitigation potential [9]. Similarly, Gupta et al. evaluated three coal plants in India with post-combustion capture and saline storage, showing that CCS could abate ~89% of plant CO2, but that retrofitting capture incurred large ancillary emissions and costs (power penalty increases around 66%) [10]. These studies illustrate how LCA can reveal trade-offs; for instance, saline aquifer storage incurs lower indirect emissions than enhanced oil recovery [9].
Complementary to LCA, life cycle costing (LCC) or techno-economic assessment (TEA) quantifies the lifetime economic costs of CCUS pathways. Many analyses of CCS use TEA to estimate the capture and storage costs and to compare technologies under different scenarios. Integrated LCA–LCC frameworks have begun to appear; for example, Dong et al. developed an LCA-based cost–benefit accounting for CCUS in China (incorporating China-specific data), revealing that neglecting life cycle impacts can overestimate the net climate benefit [11]. In general, LCA and LCC are often combined in CCUS research to support sustainability assessments, with authors emphasizing that purely techno-economic analyses must be supplemented by life cycle environmental metrics [10,12]. However, most existing LCA/TEA studies focus on individual components (e.g., a capture plant) or single metrics (e.g., net CO2 abatement, $/t-CO2). A few works explicitly integrate full-chain LCA and cost perspectives into a cohesive decision framework for geological storage, especially in the Chinese context.
Environmental–economic evaluations often involve multiple conflicting criteria (e.g., emissions, cost, safety), motivating the use of multi-criteria decision-making (MCDM) techniques [13,14,15]. Classic approaches include the analytic hierarchy process (AHP) and the technique for order of preference by similarity to ideal solution (TOPSIS), sometimes combined with objective weighting (the entropy method) or fuzzy logic [13,16,17,18]. Such methods have been applied to CCUS decision problems. For instance, Davarpanah et al. employed AHP, TOPSIS, and multi-attribute utility theory to rank CCUS technology options, finding that AHP prioritized capture efficiency and risk management, while TOPSIS favored particular capture processes [19].
In the context of CO2 sequestration in saline formations, entropy-weighted TOPSIS has been used to evaluate site suitability by combining geological, safety, and economic factors. Yuan et al. applied an entropy-weighted TOPSIS model to assess five depression areas of China’s Bohai Bay Basin, constructing an index system of geological, safety, and economic subcriteria [20]. Their results identified key target basins (e.g., Huanghua Depression) by integrating sedimentology, tectonics, and cost metrics. More broadly, MCDM approaches can synthesize diverse LCA impact categories and cost factors into composite scores [20,21]. These methods facilitate transparent weighting and ranking of alternatives, for example, ranking potential storage zones or technology pathways under multiple objectives. Taken together, the literature shows that LCA/LCC and multi-criteria techniques each have advanced CCUS assessments, but explicitly integrated environmental–economic decision frameworks are still sparse. Notably, a few studies target the specific case of CO2 storage in Chinese saline aquifers with a combined LCA–LCC–MCDM approach.
Despite broad recognition of CCUS’s importance, a clear gap exists in the literature; there is no comprehensive framework that jointly evaluates the environmental and economic performance of geological CO2 storage in China’s saline formations. Prior Chinese studies have assessed storage capacity and site distribution [7], and some have performed LCA or economic estimates separately for CCUS scenarios [9,10]. However, these typically treat technical, environmental, and cost factors in isolation. In practice, decision-makers need a unified metric or ranking that captures both the cradle-to-grave emissions impacts and the full life cycle costs of CO2 injection projects. In short, the literature has yet to deliver an integrated environmental–economic assessment tailored to Chinese saline CO2 storage, leaving a critical knowledge gap.
The objectives of this work are, therefore, to fill this gap. We aim to develop and demonstrate an integrated LCA–LCC framework for evaluating CO2 geological storage projects in China. This involves the following: (i) quantifying life cycle environmental impacts for candidate saline storage scenarios; (ii) estimating corresponding life cycle costs (capital and operational) of the complete CCUS chain; and (iii) combining these environmental and economic indicators using a multi-criteria decision model (e.g., entropy-weighted TOPSIS). The framework will be applied to representative Chinese basins to rank their suitability for CO2 storage. The proposed framework and analysis will enable a more holistic comparison of CO2 storage strategies in China, guiding research, planning, and investment toward the most sustainable and cost-effective solutions.

2. Materials and Methods

2.1. Background Information

The case project is located in the Ordos Basin of China, approximately 40 km from the nearest county seats and 80 km from the closest prefecture-level city. It benefits from proximity to both highway and railway networks and is situated near coal mines and a thermal power plant, providing favorable energy infrastructure.
The local subsurface saline aquifer is characterized by a multilayer stratigraphy comprising six distinct horizons from top to bottom. Figure 1 illustrates the vertical distribution of caprock (in brown) and reservoir (in blue) across the six storage units (T1–T6):
(1)
From ~1964 m down to 2323 m, the T1 caprock (dark mudstone) overlies the T1 reservoir (~2323–2470 m).
(2)
T2 follows immediately below, showing a thin seal (2470–2483 m) over its reservoir (2483–2501 m).
(3)
T3 extends from 2501 m, with a caprock to 2572 m and a reservoir to 2608 m.
(4)
The thicker T4 unit spans 2608–2874 m, with ~95 m of seal and ~171 m of reservoir.
(5)
Similarly, T5 is marked by a long caprock (2874–3035 m) above its reservoir (3035–3082 m).
(6)
Finally, T6 occupies 3082–3406 m, with ~285 m of mudstone seal and a 39 m sandy reservoir at its base.
During the preliminary phase of the project, a total of 14 wells were drilled and constructed at this survey stage to assess the stratigraphic structure. The pressure of these saline aquifers ranges between 20 and 30 MPa, exhibiting a strong linear correlation with depth. The lithologies and thickness ratios of the caprock and reservoir layers differ across the six storage units, as detailed in Table 1.
The carbon storage project is planned to sequester 1 million tons of CO2 annually over a 25-year duration. Based on an operational schedule of 8 h per day, the hourly CO2 injection rate is approximately 340 tons, equivalent to about 94 kg/s. Given a single-well injection rate of approximately 36 kg/s [22], a minimum of three injection wells will be required.

2.2. Goal and Scope Definition

The system boundaries of this study are shown in Figure 2, which encompass the following: processes of CO2 capture, compression, and transportation; site preparation, excavation, and well construction for saline aquifer storage; CO2 injection; well closure; land-use changes; and the monitoring activities associated with saline water extraction and management. The system is contextualized within the Ordos region in China, as described earlier, with the aim of conducting a comprehensive analysis of the environmental impacts and economic costs across the entire life cycle of a saline aquifer CO2 storage project in the Ordos Basin. The goal is to identify and analyze the key environmental and economic factors that influence such projects, providing a scientific basis for the development and optimization of this technology.
The functional unit of this study is the storage of 1 ton of CO2 in the saline aquifer, with all subsequent data presented relative to this unit. The geographical scope of the study includes the Ordos Basin and surrounding areas, with a temporal scope extending to the year 2025. The data used in this study are derived from the actual project under investigation, with missing data supplemented by published research. The selected data are intended to reflect the current situation in China as accurately as possible, ensuring that the study’s findings are of maximum relevance to China’s context. Given the lack of reliable data to establish credible uncertainty bounds for key parameters, a sensitivity analysis was not performed in this study to avoid speculative or non-informative outcomes.

2.3. Environmental Analysis

In light of the environmental characteristics of saline aquifer carbon sequestration technology, six representative environmental impact categories were selected for evaluation: global warming potential (GWP, expressed as mass of CO2 equivalents, kg CO2-eq), fossil fuel potential (FFP, expressed as mass of crude oil equivalents, kg oil-eq), land use (expressed as square meter-years of crop equivalents, m2·a crop-eq), water use (expressed as cubic meter water, m3), material resources (expressed as mass of copper equivalents, kg Cu-eq), and non-carcinogenic human toxicity (expressed as mass of 1,4-dichlorobenzene equivalents, kg 1,4-DCB-eq). The following sections present a detailed compilation of environmental inventory data for each category, categorized by the three major stages of the system: carbon capture, carbon sequestration, and brine management. In this study, the Activity Browser v2.11.2 [23] software was employed to perform LCA modeling and calculations.

2.3.1. Carbon Capture, Compression, and Transportation

Based on the actual conditions of the thermal power plant located near the project site in this case, this study adopts carbon dioxide capture from the thermal power plant as the baseline scenario. According to the requirements of the Standard for Design of Carbon Dioxide Capture and Purification Engineering for Flue Gas [24], flue gas carbon dioxide capture should employ the chemical absorption method, with the overall energy consumption of the capture system not exceeding 4.2 GJ/ton CO2.
Accordingly, this study primarily focuses on evaluating the environmental impacts of chemical absorption for carbon capture. In the baseline scenario, monoethanolamide (MEA) is used as the solvent, with an average consumption of approximately 2.34 kg of MEA and 0.13 kg of sodium hydroxide per ton of CO2 captured [25]. The process requires 23.6 kWh of electricity and 4 GJ of steam per ton of CO2 [26].
An alternative scenario using potassium carbonate as the solvent is also considered. In this case, capturing 1 ton of CO2 consumes approximately 0.12 kg of potassium carbonate and 4.5 kg of potassium hydroxide, along with 17 kWh of electricity and 2.3 GJ of steam [27].
Given that the environmental impact of the capture equipment itself is relatively minor compared to the operational energy and material consumption, this study assumes that the equipment inventory remains the same across both scenarios. Equipment-related data were adopted based on the study by Wang et al. [27]. The land used for the CO2 capture facilities is neglected.
The compression process involves compressing 1 ton of carbon dioxide from atmospheric pressure to 7 MPa, followed by pipeline transportation. The pipeline is assumed to have an inner diameter of 95 cm, a transportation distance of 100 km, and a pressure drop of 0.006 MPa/km [26]. The electricity consumptions for the compression and transportation processes are calculated according to Equations (1) and (2). The calculated power consumption for the compression process is approximately 103 kWh per ton of CO2, while the energy consumption during the transportation process is about 1.9 kWh per ton of CO2. The land used for CO2 compression and the transportation facilities are assumed to be 400 and 150,000 m2, respectively. The material and energy consumption inventory for the construction of CO2 compression and transportation facilities is also referenced from the study by Wang et al. [26].
W = Z R T M N γ γ 1 p 2 p 1 γ 1 N γ 1
E = W φ i s φ m 3600
In the equation, W represents the actual work done in kJ/kg; E denotes the required electrical energy in kW·h/kg; Z is the compressibility factor, 0.9942; R stands for the universal gas constant, 8.3145 J/(mol·K); T indicates the inlet gas temperature, 313.15 K; γ signifies the heat capacity ratio (cp/cv), 1.293759; M is the molar mass of CO2, 44.01 g/mol; φ_is represents the isentropic efficiency, 80%; φ_m denotes the mechanical efficiency, 99%; N_γ is the number of compressor stages (4 for transportation, 2 for storage); p2 is the outlet pressure; and p1 is the inlet pressure.
For the CO2 transportation process, this study also considers a scenario involving liquefied CO2 transport via tank trucks. It is assumed that a standard tanker truck has a total weight of 40 tons, operates under a working pressure of 7 MPa, and has a tank volume of approximately 30 m3. Under ambient temperature conditions, each truck is capable of transporting about 20 tons of liquefied CO2 per trip. The average driving speed is set to 60 km/h, and the loading/unloading times are each estimated at 0.5 h.
Based on the total CO2 capture volume, approximately 90 trucks of the same model are required for the transport task. Given a typical vehicle lifespan of 5 to 10 years, the project would require 2 to 4 replacement cycles, resulting in a total of 270 to 450 vehicles over the project’s lifetime.
For vehicles with comparable loading capacities, the fuel consumption ranges from approximately 32 to 40 L per 100 km, with the lower bound representing unloaded and the upper bound representing fully loaded conditions. Assuming a diesel density of 0.85 kg/L and a lower heating value of 43.5 MJ/kg, the estimated diesel energy consumption for transporting 1 ton of CO2 is approximately 133 MJ. Due to the lack of detailed life cycle inventory (LCI) data specific to pressurized CO2 tanker trucks, this study approximates the associated impacts using conventional heavy-duty truck datasets, with a scaling factor of 2 to 3 applied to account for the increased material and energy demands associated with high-pressure CO2 transport. All data in this section are compiled in Table 2.

2.3.2. Carbon Storage

This deep saline aquifer sequestration project comprises several stages, including site preparation, well drilling and construction, CO2 injection, brine extraction, well closure, and monitoring. During the site preparation phase, a total of 14 monitoring wells were drilled, and 3 injection wells were constructed for the injection phase. The average depth of all wells was set to 2900 m, representing the mean depth across six target saline formations.
Material and energy requirements for constructing the 14 monitoring wells and 3 injection wells were estimated by linearly extrapolating the data from Singh et al. [22], which reported resource consumption for a 1000 m deep well.
In the CO2 injection phase, the CO2 transported to the site via a pipeline must be compressed prior to the injection. Given an endpoint pressure of 6.4 MPa at the pipeline terminal and assuming a 10% pressure drop during the injection, with an average reservoir pressure of 40 MPa, the CO2 must be pressurized to approximately 44 MPa. Based on Equations (1) and (2), the energy consumption for the injection process is calculated to be approximately 46 kWh.
Upon completion of the injection process, the injection wells are sealed using cement and steel, as referenced from the NETL’s (National Energy Technology Laboratory) report [28]. A total of 10 monitoring wells and 3 injection wells were permanently closed, while the remaining 4 monitoring wells were retained for long-term project monitoring. Consequently, a detailed inventory of material requirements for well closure was established. As no new monitoring wells were constructed, the resource inputs associated with the monitoring phase were excluded from this study.
The project is situated on undeveloped natural land. Each well occupies approximately 1000 m2, and the injection equipment occupies an additional 400 m2, resulting in a total land use of 17,400 m2. All relevant data are summarized in Table 2.

2.3.3. Brine Management

To maintain reservoir pressure stability, approximately 1.5 tons of brine must be extracted for every ton of CO2 injected. This study establishes a brine management model with two options. The default option involves reinjecting the extracted brine into abandoned mines or oil fields. As an alternative, the brine undergoes a reverse osmosis treatment, with the resulting concentrate being reinjected into the original saline formation.
Given the high native pressure of deep saline aquifers, the energy consumption associated with brine extraction is assumed to be negligible. In the default scenario, the extracted brine is transported 10 km to the designated disposal site. Based on an assumed vehicle capacity of 30 cubic meters, an average driving speed of 40 km/h, loading and unloading times of 15 min each, and approximately 6 min for waiting and inspection, it is estimated that approximately 26 transport vehicles are required to fulfill the transportation task. Assuming the same conditions as those used for liquid CO2 transportation by tank trucks, it is estimated that approximately 78 to 130 transport vehicles will be required over the entire project duration to meet the logistical demands. Based on the fuel consumption assumptions used for CO2 transport vehicles, the diesel energy consumption for transporting 1.5 tons of brine—corresponding to the storage of 1 ton of CO2—is estimated to be approximately 13.3 MJ.
For the alternative scenario, the energy requirements for the reverse osmosis treatment and concentrate reinjection are based on data from the U.S. National Energy Technology Laboratory (NETL) [28]. Additionally, the brine treatment facility is assumed to occupy a land area of 6400 m2. All relevant data are summarized in Table 2.

2.3.4. Scenario Analyses

As described previously, the carbon capture, CO2 transportation, and brine management stages each include one alternative option, while all other stages follow a single default configuration. Accordingly, a total of eight analytical scenarios can be constructed for a comparative assessment. The detailed scenario configurations are presented in Table 3.

2.4. Economic Analysis

The total economic cost of the saline aquifer sequestration project was estimated based on the current market prices of raw materials and energy. The unit prices of various materials and energy inputs are presented in Table 4. By combining these unit prices with the consumption quantities in each project stage, the cost contribution of each process was calculated. To ensure temporal comparability, all future expenditures were discounted to a common base year using a 5% discount rate (Equation (1)). While labor cost is a major expenditure category, its substantial regional and international variability limits its applicability in a generalized assessment. As such, it was excluded from the cost boundary of this study.
N P V = F T × 1 1 + r T r
In this equation, NPV denotes the net present value of the project; F represents the total cost incurred in each year; T is the project’s lifetime; and r is the discount rate, which is set at 5% in this study.

2.5. MCDM Analyses

This study employs the entropy-weighted TOPSIS (technique for order of preference by similarity to ideal solution) integrated method to comprehensively analyze environmental and economic indicators [29,30]. The entropy weight method is an objective weighting technique based on information entropy theory, which automatically assigns weights based on the data characteristics of each indicator. Information entropy is an important measure of system uncertainty and information content. The lower the entropy value of the data, the higher the information content and certainty; conversely, the higher the entropy value, the greater the uncertainty of the data. Based on this principle, the entropy weight method calculates the weight of each category by analyzing the distribution of influencing factors and utilizing the magnitude of entropy values, thereby achieving an objective allocation of weights.
TOPSIS is a commonly used multi-criteria decision analysis method, which ranks and selects alternatives by calculating the distance between each alternative and the ideal and anti-ideal solutions. This method is based on the assumption that the optimal solution should be the one that is closest to the ideal solution and farthest from the anti-ideal solution [31].
The detailed procedures of the entropy weight method and TOPSIS are provided in Supplementary Information Section S1.

3. Results

3.1. Environmental Results

The environmental impacts of the six selected categories across all scenarios are presented in Figure 3. For the eight scenarios, GWP ranges from 380 to 505 kg CO2-eq; FFP ranges from 80 to 110 kg oil-eq; land use ranges from 4.7 to 5.7 m2·a crop-eq; water use varies from 0.8 to 1.10 m3; material resources (minerals and metals, expressed as copper equivalents) range from 0.8 to 1.5 kg Cu-eq; and human toxicity (non-carcinogenic) potential ranges from 205 to 288 kg 1,4-DCB-eq.
All eight scenarios exhibit similar variation patterns across the assessed impact categories. Except for material resources, the remaining five environmental impact indicators show that scenarios S0, S2, S4, and S6 form one cluster with relatively higher values, while S1, S3, S5, and S7 form another with consistently lower values. In contrast, for material resource use, scenarios S0, S1, S4, and S5 demonstrate significantly lower impacts compared to the other four scenarios.
The variations in environmental impacts across scenarios are primarily attributed to differences in carbon capture, CO2 transportation, and brine management processes. Each of these subsystems includes two technical options (as detailed in Table 2), and their environmental performance comparisons across six impact categories are illustrated in Figure 4. With the exception of material resources, the differences between the two options within each process are generally comparable and follow similar trends. However, for material resources, the variation patterns are notably divergent; the difference between capture options is minimal, while that of CO2 transport is more pronounced, and the brine management options exhibit the largest and oppositely directed difference.
From the process contribution results of each scenario, it is evident that the differences in the overall environmental performance across scenarios are primarily driven by the variations in the three key processes discussed above. Figures S1–S6 illustrate the process hotspots of each scenario. Except for the material resources category, scenarios S0, S2, S4, and S6 consistently exhibit higher impacts across the other five environmental impact categories compared to the remaining scenarios. This discrepancy can be attributed to the carbon capture option employed; the default technology—MEA absorption—contributes significantly more environmental burden than the alternative option, potassium carbonate absorption.
To further explore these differences, the contributions of individual unit processes to the five impact categories across scenarios were analyzed (Figures S7–S10 and S12). The main unit processes responsible for the divergence between the two scenario groups include cogeneration of power and heat from hard coal, hard coal mining and preparation, spillage coal treatment, and coal ash management. These findings suggest that the higher environmental impacts of scenarios S0, S2, S4, and S6 are primarily due to increased electricity and steam demand associated with MEA-based carbon capture, given that this study used datasets based on coal-fired power plants.
In the material resources category, scenarios S0, S1, S4, and S5 exhibit significantly lower impacts than the others. This is mainly due to the higher resource intensity of Option 1 for CO2 transport (tank truck transportation) compared to the default option (pipeline transport). A further analysis of the unit process contributions to this impact category (Figure S11) reveals that the differences are primarily driven by rare earth element extraction and use, which are associated with the manufacturing of transportation vehicles.

3.2. Economic Analysis

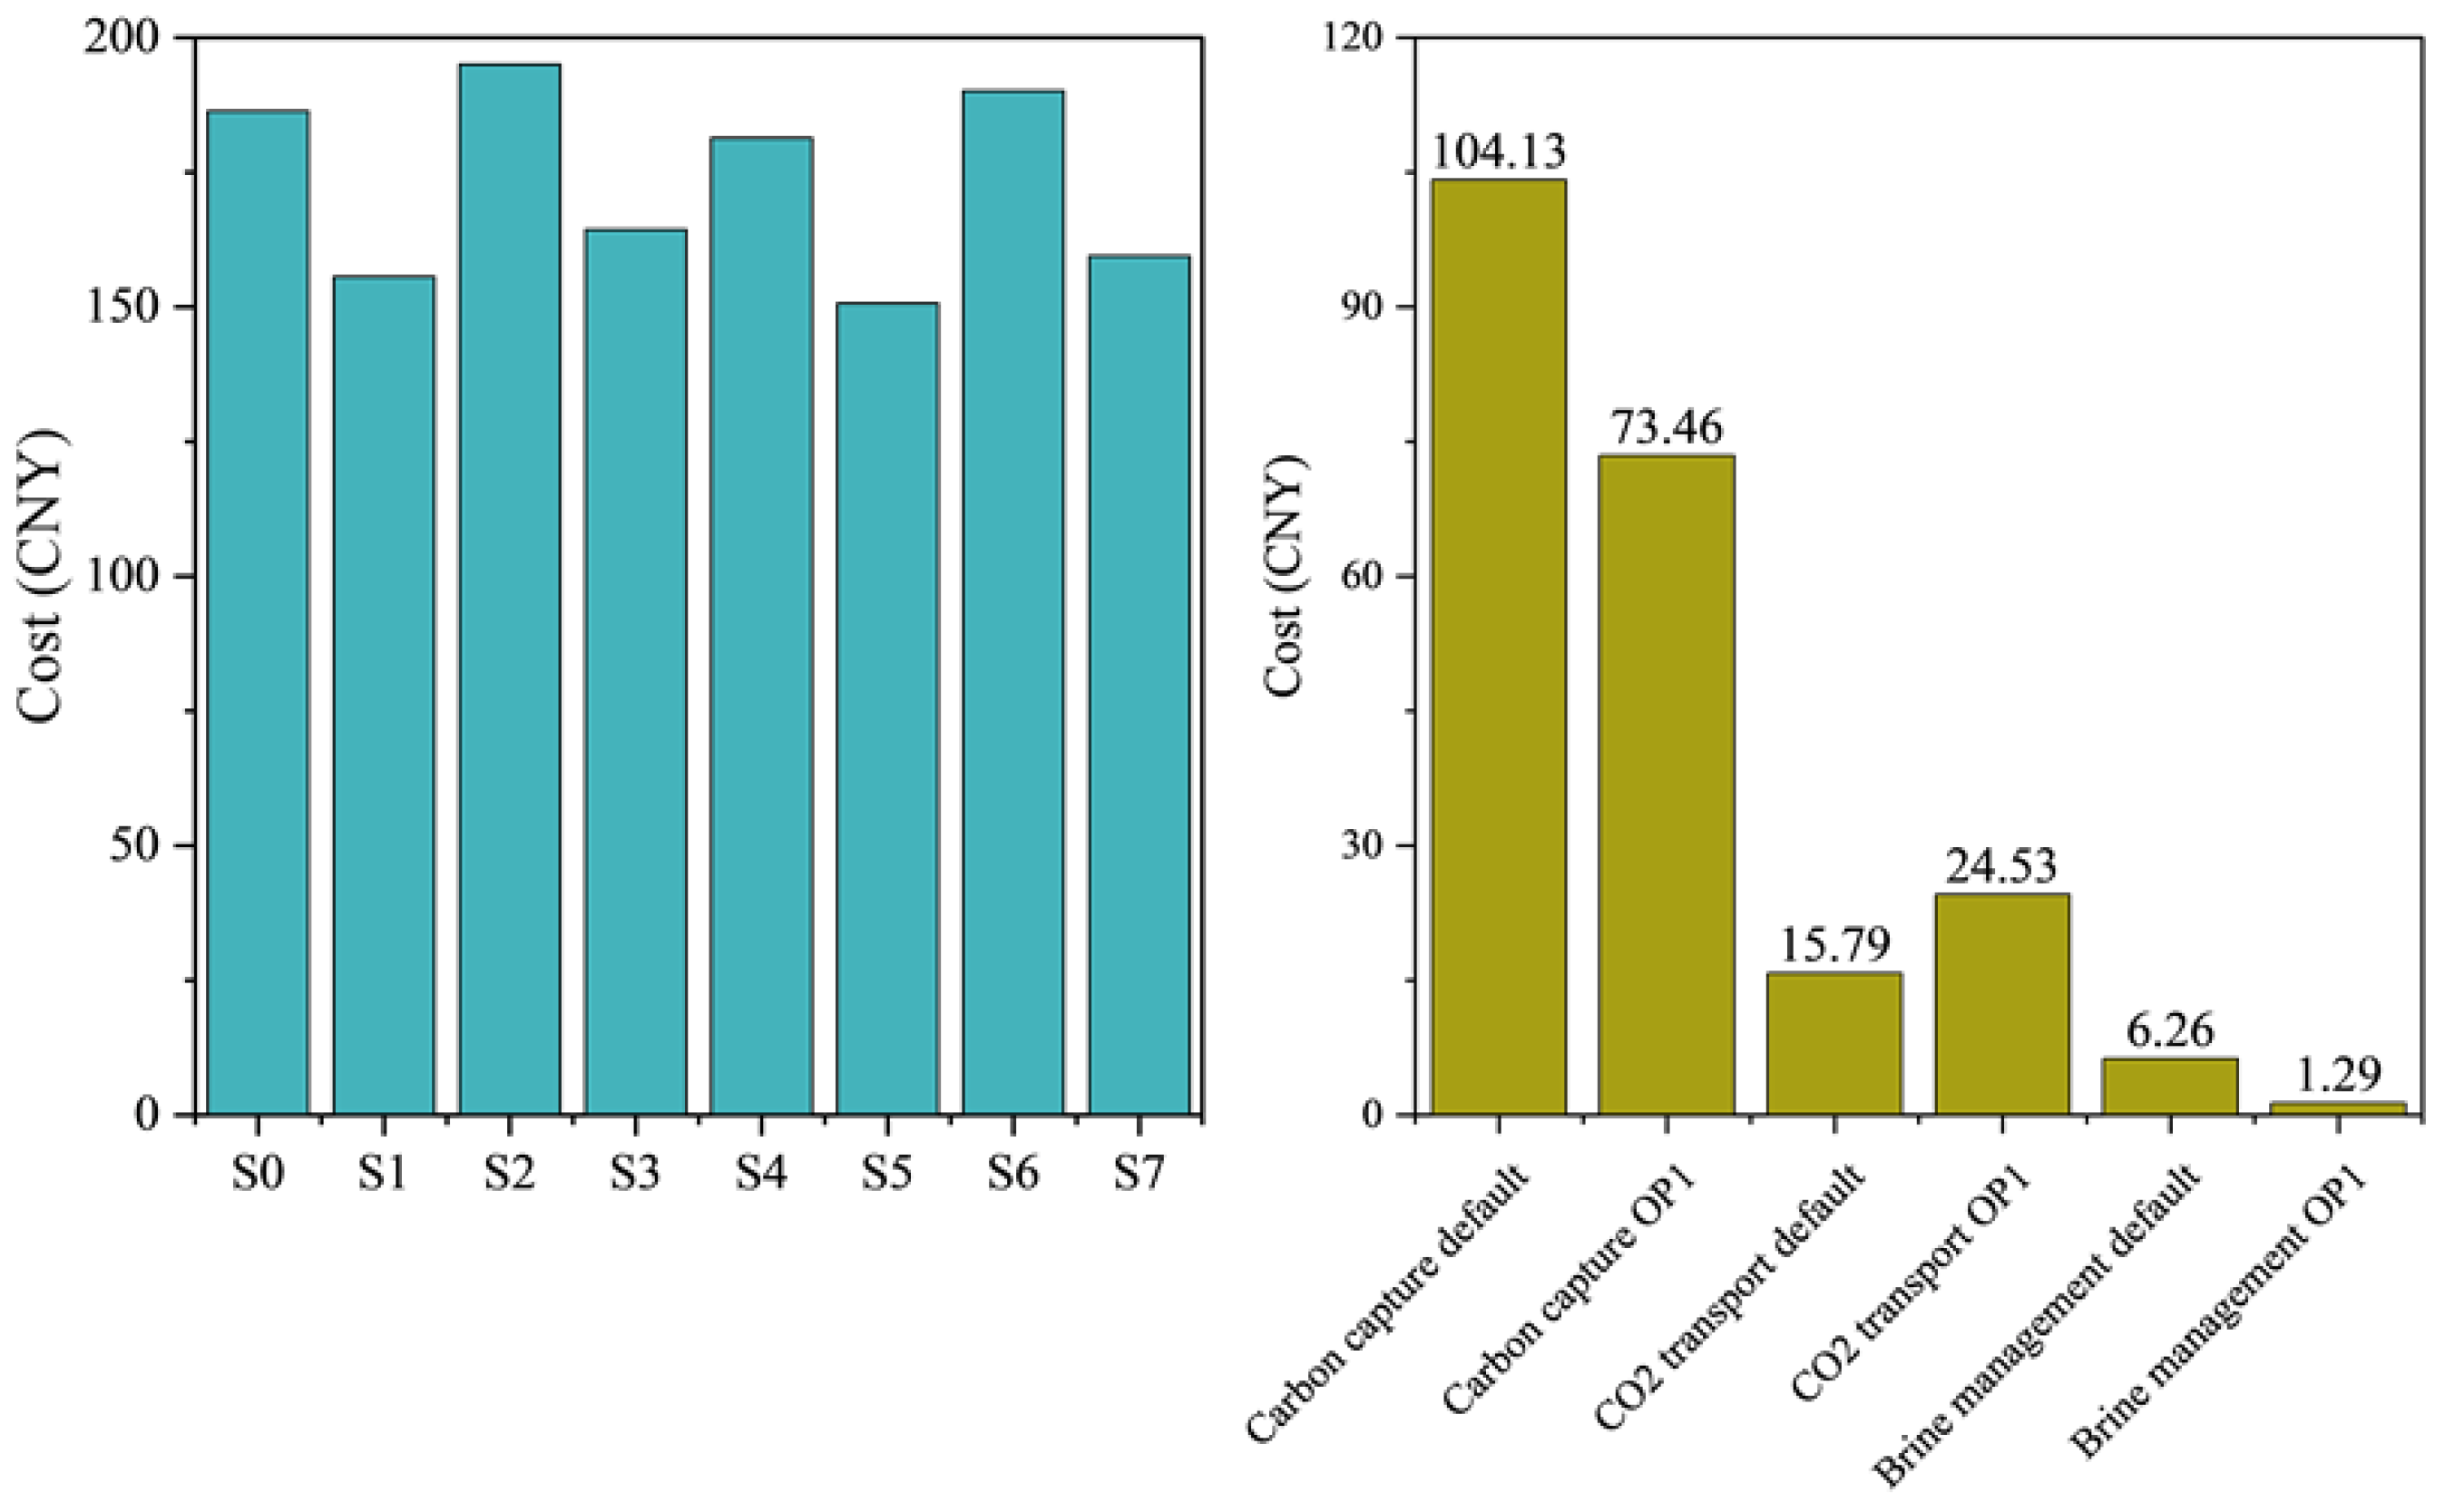
The LCC results for all scenarios in this study are presented in Figure 5. The calculated costs include expenditures related to facility procurement, construction, and the consumption of energy and materials during operation. Labor costs were excluded from the analysis. All expenditures occurring throughout the project lifetime were discounted to the base year (2025) using a discount rate of 5%. The results indicate that the total costs across all scenarios range from 150 to 195 CNY per ton of CO2, which is in accordance with recent research.
Similar to the environmental impact results, the cost differences among scenarios are primarily driven by variations in the carbon capture, transportation, and brine management processes. Figure 5 also illustrates the cost differences among the alternative options for these three processes. For carbon capture, the default option (MEA absorption) incurs approximately 30 CNY/ton CO2 more than Option 1 (potassium carbonate absorption). For transportation, the default option (pipeline transport) is about 10 CNY/ton CO2 less expensive than Option 1 (tank truck transport). Regarding brine management, the default option (off-site disposal after transport) costs about 5 CNY/ton CO2 more than Option 1 (reinjection after a reverse osmosis treatment). These differences in process-level costs are consistent with the overall cost variations observed across the scenarios.

3.3. MCDM Framework

The weights of the seven indicators were calculated using the entropy weight method, as shown in Table 5. Among them, land use, water use, and global warming potential (GWP) have the highest weights, indicating the lowest uncertainty. In contrast, cost has the lowest weight, reflecting the highest uncertainty. This suggests that, in current deep saline aquifer carbon sequestration projects, land and water use as well as carbon emissions are relatively stable, while costs are subject to greater fluctuations.
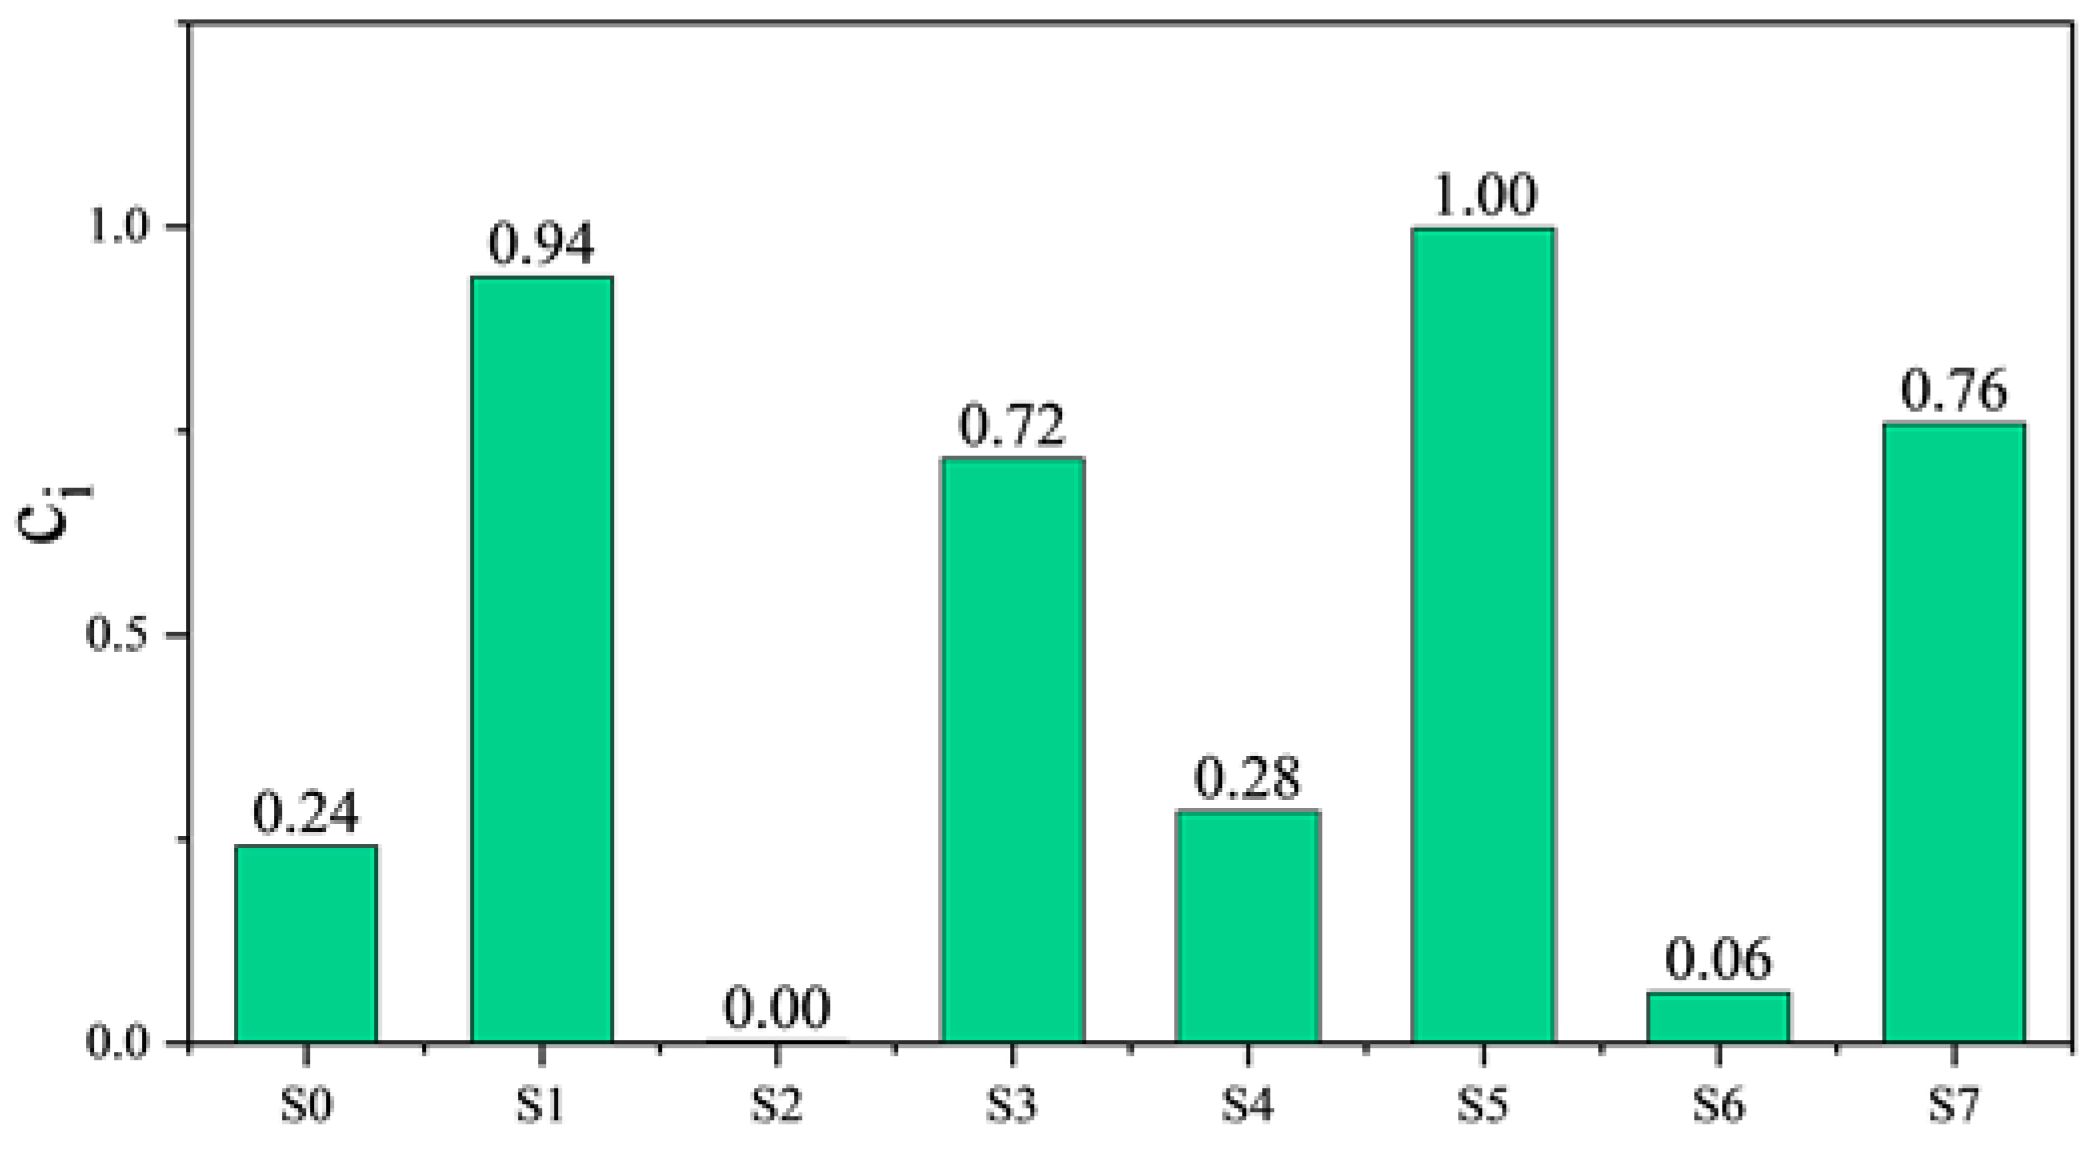
Based on these weights and the TOPSIS method, the comprehensive scores of all scenarios were calculated, as shown in Figure 6. The ranking of the eight scenarios is as follows: S5 > S1 > S7 > S3 > S4 > S0 > S6 > S2. This indicates that Scenario S5, which adopts CO2 capture Option 1 (potassium carbonate absorption), the default transportation method (pipeline), and brine management Option 1 (reverse osmosis followed by reinjection), exhibits the best overall environmental and economic performance.

3.4. Breakeven Analysis of the Best Scenario

According to the comprehensive MCDM analysis, Scenario S5 was identified as the optimal choice. To further evaluate its economic feasibility, a breakeven analysis was conducted for this scenario. Annual cost data throughout the project lifetime were obtained from the LCC analysis, while the revenue was derived from the market value of the net amount of CO2 removed and stored.
The CO2 revenue estimation involves two steps. First, the net storage rate of Scenario S5 was calculated based on its GWP result per ton of CO2 stored. Second, different carbon price evolution models were developed using the current carbon price and projections for 2035 and 2050 from relevant studies [32,33].
Three carbon price forecasting models were established: Model 1 assumes linear growth; Model 2 is a piecewise linear model with 2035 as the inflection point; and Model 3 adopts a nonlinear trajectory with rapid growth around 2035. Detailed descriptions and graphical representations of these models are provided in Supplementary Information Section S5 and Figure S13.
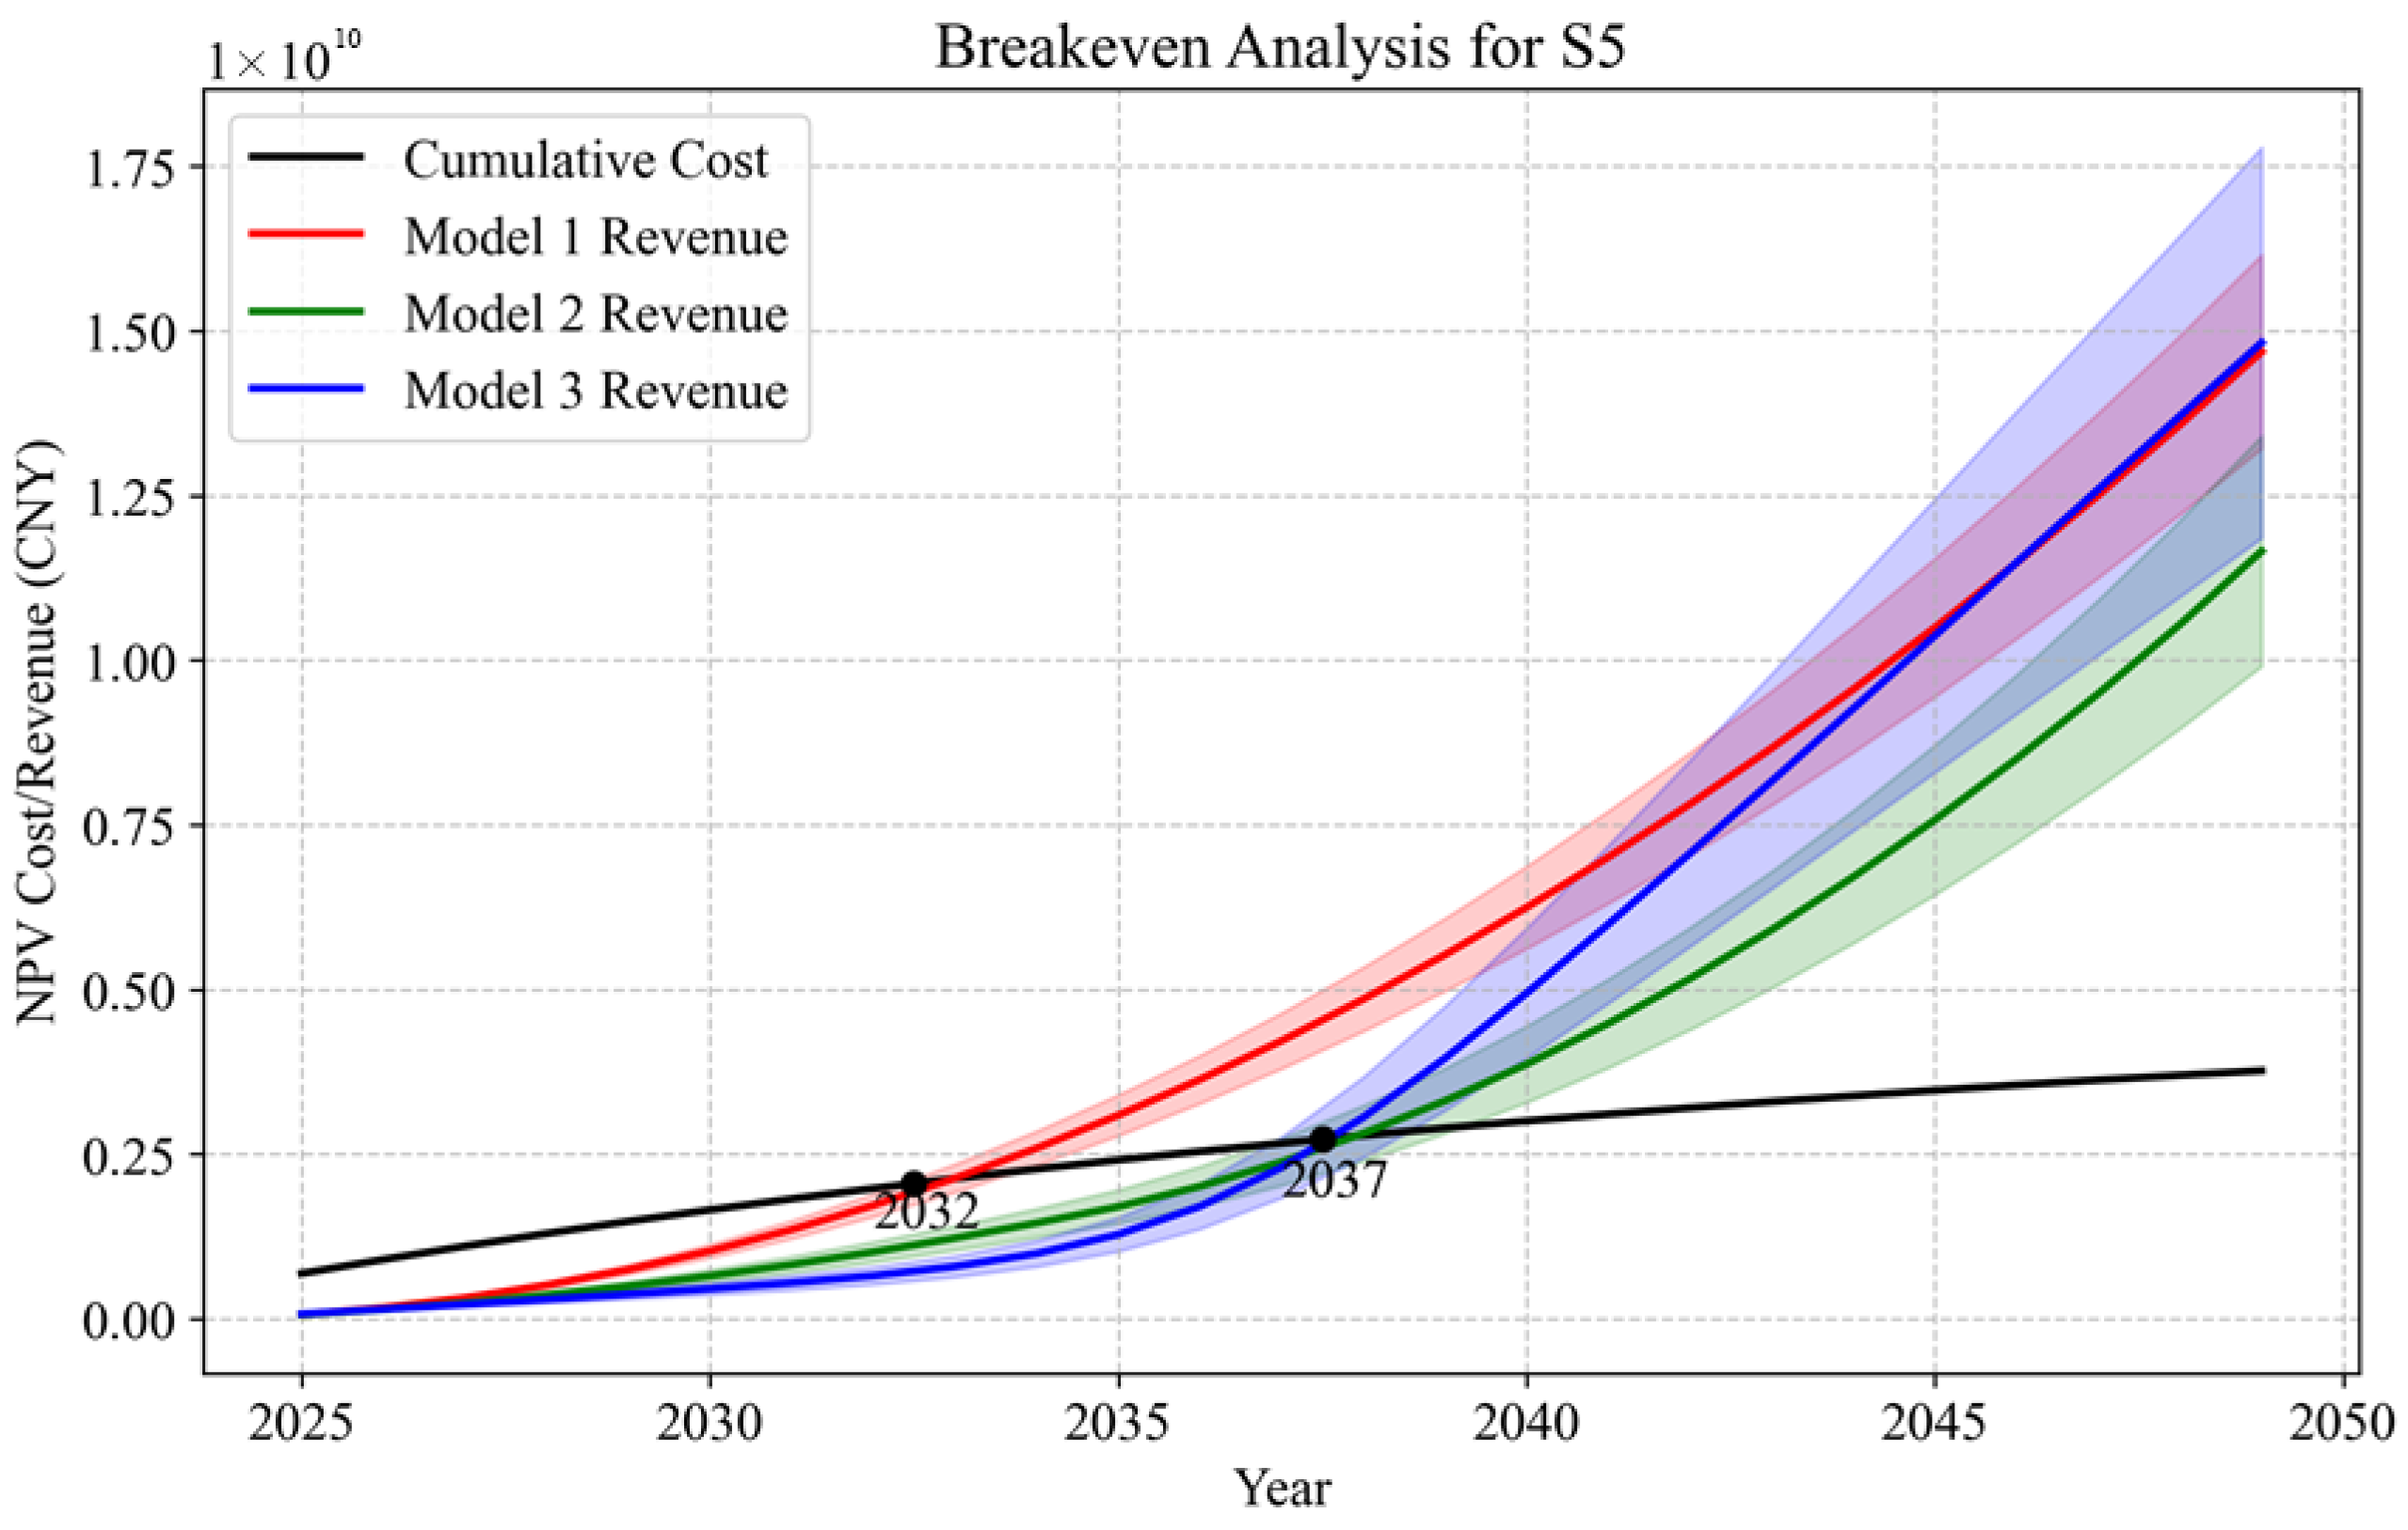
Based on these models, the annual cumulative cost and cumulative revenue curves over the project lifetime for Scenario S5 were calculated and are shown in Figure 7. The analysis indicates that if the carbon price increases linearly over time (Model 1), Scenario S5 would achieve breakeven in year 7. However, if the carbon price follows the trends of Models 2 or 3, the breakeven point would be delayed by approximately five years. Overall, total profit under Models 1 and 3 is comparable and significantly higher than that under Model 2.
The breakeven analysis results of the other scenarios, based on the same method, are shown in Figures S14–S20. It can be observed that under carbon price projections following Model 1, all scenarios reach breakeven the earliest, mostly around the year 2035, but still later than Scenario S5. When carbon prices follow the trends projected by Models 2 or 3, the breakeven points for all scenarios occur after 2035.

4. Discussion

This study broadens the scope of existing CCUS-related research. Using a deep saline aquifer storage project as the case study, it evaluates the full-chain environmental impacts and economic costs of carbon capture through geological storage, based on a functional unit of storing one ton of CO2. Compared to studies that focus solely on the storage phase [28,34], this analysis provides a more comprehensive assessment. In this project, the captured CO2 originates from a coal-fired power plant, thus sharing many commonalities with research on CCUS-equipped power generation [10,22,25,26,27,35]. However, unlike studies that embed CCUS within the power generation system, this study treats CCUS as an independent carbon removal technology, decoupled from the power system’s life cycle. By decoupling it from the power generation life cycle, the analysis avoids complex trade-offs among different environmental impacts and enables a clearer, more transparent accounting of carbon credits [11,36]. This approach facilitates the evaluation of CCUS feasibility across sectors beyond power generation, thereby enhancing its broader applicability.
This study contributes LCA data for a CCUS application case in China. As detailed in the methodology section, data on materials used throughout the life cycle of various facilities and equipment were largely drawn from the existing literature. However, data related to the operation phase were estimated based on the actual conditions of the project, in combination with the characteristics of Chinese products and processes. Moreover, the embedded environmental impacts of these products were calculated using China-specific data sources. The LCA and LCC results both demonstrate that, although the production and installation of equipment and infrastructure consume substantial resources and incur significant embedded environmental burdens and upfront costs, their contributions to most environmental impact categories and total costs are considerably lower than those from the ongoing consumption of energy and materials (e.g., electricity, steam, and diesel) during the operation phase [27,36]. This indicates that, while the estimation of equipment-related impacts may be relatively rough and deviate somewhat from the actual values, the accuracy of operational data is far more critical for LCA and LCC studies of such projects. By incorporating operational estimates grounded in Chinese project conditions and industrial context, this study provides valuable insights for understanding the environmental and economic performance of CCUS projects in China.
This study establishes an environment–economic integrated assessment framework for CCUS projects under different scenarios using an objective methodological system. The entropy-based weighting method assigns greater weights to indicators with lower uncertainty. Compared to subjective weighting methods, such as the analytic hierarchy process (AHP), which relies on expert judgment, the resulting weights may be less intuitive and more difficult to interpret [13,14,15]. This trade-off reflects the current stage of CCUS development—particularly in China—where the technology is still evolving, and available information remains insufficient and non-transparent.
The breakeven analysis presented in this study offers valuable insights for the development of CCUS projects in China and globally. By assuming three different carbon price projection models, the results show that a linear increase in carbon price leads to the earliest breakeven point—representing the most optimistic scenario. However, in reality, carbon prices are unlikely to follow a strictly linear trajectory, as they are highly susceptible to fluctuations driven by technological progress and political factors. Taking China as an example, the national carbon peaking target is set for 2030. Prior to this milestone, the total carbon emissions are expected to continue rising, suggesting that significant increases in carbon price may only occur closer to the peaking year. This implies that the actual breakeven point for CCUS projects could be delayed by approximately five years compared to the most optimistic projection.
This study also has several limitations that could be addressed in future research. Due to the lack of available data on parameter ranges, an uncertainty analysis was not performed for each scenario. As a result, each scenario is represented by a single outcome rather than a plausible range of results. Furthermore, this study did not include a sensitivity analysis to examine the influence of key parameters on the overall results.

5. Conclusions

This study developed and demonstrated an integrated LCA–LCC framework, combined with entropy-weighted TOPSIS, to evaluate eight full-chain CCUS scenarios involving carbon capture, transport, and deep saline aquifer storage in China. Our results highlight that the environmental and cost performance is predominantly influenced by technology configurations across the capture, transportation, and brine management stages. Among the eight scenarios, the combination of potassium carbonate-based capture, pipeline transport, and brine reinjection after reverse osmosis (S5) offers the most balanced outcome across environmental and economic indicators.
The breakeven analyses under three carbon price models further reveal that long-term pricing trajectories critically affect project viability. A steadily rising carbon price results in earlier profitability, underscoring the importance of stable and predictable carbon market signals for encouraging large-scale CCUS deployment.
Importantly, by decoupling CCUS from the power generation life cycle and focusing on unit-based CO2 removal, this study presents a transparent and transferable evaluation framework. The approach not only allows for fair comparison of technological pathways across sectors (e.g., industrial sources beyond coal power) but also supports cross-sectoral policy planning.
This work contributes to bridging the gap between environmental and economic evaluation in CCUS research, particularly in the Chinese context, where integrated assessment studies remain limited. It also provides valuable empirical data and insights for government agencies and investors seeking to design cost-effective and environmentally sound CCUS strategies under China’s dual-carbon targets.
Given the urgency of achieving net-zero emissions by 2050, as emphasized in the Introduction, the proposed framework and findings serve as a practical tool for guiding low-carbon investments and technology prioritization. The methodology can be adapted to other regions with saline storage potential, offering broader applicability to global climate mitigation efforts.
This study also has some limitations. Firstly, a sensitivity analysis was not conducted due to limited availability of parameter variability data, particularly for energy and material inputs under Chinese project conditions. Secondly, labor costs were excluded from the economic assessment, as they vary significantly across regions and are relatively minor in capital-intensive CCUS projects. Future research should incorporate uncertainty and sensitivity analyses, as well as a more detailed cost breakdown including labor and operational expenses, to enhance the robustness and practical relevance of the proposed framework.

Supplementary Materials

The following supporting information can be downloaded at https://www.mdpi.com/article/10.3390/w17152320/s1, Figure S1: Process hotspot analysis for global warming potential (GWP) across all scenarios. Figure S2: Process hotspot analysis for fossil fuel potential (FFP) across all scenarios. Figure S3: Process hotspot analysis for land use across all scenarios. Figure S4: Process hotspot analysis for water use across all scenarios. Figure S5: Process hotspot analysis for material resources across all scenarios. Figure S6: Process hotspot analysis for non-carcinogenic human toxicity across all scenarios. Figure S7: Activity hotspot analysis for GWP across all scenarios. Figure S8: Activity hotspot analysis for FFP across all scenarios. Figure S9: Activity hotspot analysis for land use across all scenarios. Figure S10: Activity hotspot analysis for water use across all scenarios. Figure S11: Activity hotspot analysis for material resources across all scenarios. Figure S12: Activity hotspot analysis for non-carcinogenic human toxicity across all scenarios. Figure S13: Illustration of the carbon price projection models used in this study. Figure S14: Breakeven analysis of scenario S0 under different carbon price evolution models. Figure S15: Breakeven analysis of scenario S1 under different carbon price evolution models. Figure S16: Breakeven analysis of scenario S2 under different carbon price evolution models. Figure S17: Breakeven analysis of scenario S3 under different carbon price evolution models. Figure S18: Breakeven analysis of scenario S4 under different carbon price evolution models. Figure S19: Breakeven analysis of scenario S6 under different carbon price evolution models. Figure S20: Breakeven analysis of scenario S7 under different carbon price evolution models. Reference [37] is cited in the Supplementary Materials.

Author Contributions

Formal analysis, T.J. and J.Z. (Jian Zhang); investigation, W.Z., Z.J., and X.L.; methodology, W.Z.; validation, Z.Y.; visualization, W.Z.; writing—original draft, Z.J., J.Z. (Jingchao Zhao), and S.Z.; writing—review and editing, J.Z. (Juan Zhou). All authors have read and agreed to the published version of the manuscript.

Funding

The authors appreciate the financial support from the Science and Technology Projects of China Huaneng Group Co., Ltd. (No. HNKJ24-H25, No. HNKJ24-H13, and No. HNKJ25-H49) and the Geological Sequestration Research Team for Low-Carbon Technologies (No. TD20232305).

Data Availability Statement

Data available on request due to restrictions, e.g., privacy or ethical.

Conflicts of Interest

Authors Wentao Zhao, Tieya Jing, Jian Zhang, Juan Zhou, and Jingchao Zhao were employed by the company China Huaneng Group Co., Ltd. The remaining authors declare that the research was conducted in the absence of any commercial or financial relationships that could be construed as a potential conflict of interest. The authors declare that this study received funding from the China Huaneng Group Co., Ltd. The funder had the following involvement with the study: design, collection, analysis, interpretation of data, the writing of this article or the decision to submit it for publication.

References

  1. IPCC. Global Warming of 1.5 °C: IPCC Special Report on Impacts of Global Warming of 1.5 °C Above Pre-Industrial Levels in Context of Strengthening Response to Climate Change, Sustainable Development, and Efforts to Eradicate Poverty; Cambridge University Press: Cambridge, UK, 2022. [Google Scholar] [CrossRef]
  2. Skea, J.; Shukla, P.R.; Reisinger, A.; Slade, R.; Fradera, R.; Pathak, M.; Al Khourdajie, A.; van Diemen, R.; Abdulla, A.; Akimoto, K.; et al. Climate Change 2022—Mitigation of Climate Change: Working Group III Contribution to the Sixth Assessment Report of the Intergovernmental Panel on Climate Change; Cambridge University Press: Cambridge, UK, 2023. [Google Scholar] [CrossRef]
  3. Global CCS Institute. Available online: https://status23.globalccsinstitute.com/ (accessed on 1 January 2025).
  4. Bongaarts, J. IPCC, 2023: Climate Change 2023: Synthesis Report. IPCC, 184 p., doi: https://doi.org/10.59327/IPCC/AR6-9789291691647. Popul. Dev. Rev. 2024, 50, 577–580. [Google Scholar] [CrossRef]
  5. Section 45Q Credit for Carbon Oxide Sequestration—Policies. Available online: https://www.iea.org/policies/4986-section-45q-credit-for-carbon-oxide-sequestration (accessed on 1 January 2025).
  6. Wang, P.; Shi, B.; Li, N.; Kang, R.; Li, Y.; Wang, G.; Yang, L. CCUS development in China and forecast its contribution to emission reduction. Sci. Rep. 2023, 13, 17811. [Google Scholar] [CrossRef] [PubMed]
  7. Zhong, Z.; Chen, Y.; Fu, M.; Li, M.; Yang, K.; Zeng, L.; Liang, J.; Ma, R.; Xie, Q. Role of CO2 geological storage in China’s pledge to carbon peak by 2030 and carbon neutrality by 2060. Energy 2023, 272, 127165. [Google Scholar] [CrossRef]
  8. Kelemen, P.; Benson, S.M.; Pilorgé, H.; Psarras, P.; Wilcox, J. An overview of the status and challenges of CO2 storage in minerals and geological formations. Front. Clim. 2019, 1, 9. [Google Scholar] [CrossRef]
  9. Yujia, W.; Zhaofeng, X.; Zheng, L. Lifecycle analysis of coal-fired power plants with CCS in China. Energy Procedia 2014, 63, 7444–7451. [Google Scholar] [CrossRef]
  10. Gupta, A.; Paul, A.R.; Haque, N. Life cycle assessment of carbon capture and storage in saline aquifers for coal-fired power generation: An Indian scenario. Greenh. Gases Sci. Technol. 2023, 13, 81–98. [Google Scholar] [CrossRef]
  11. Dong, C.; Jiang, J.; Ye, B.; Xia, C.; Zhang, Y. LCA-based cost-benefit assessment and carbon footprint accounting of CCUS technologies in China. J. Clean. Prod. 2025, 486, 144557. [Google Scholar] [CrossRef]
  12. Wang, P.; Robinson, A.J.; Papadokonstantakis, S. Prospective techno-economic and life cycle assessment: A review across established and emerging carbon capture, storage and utilization (CCS/CCU) technologies. Front. Energy Res. 2024, 12, 1412770. [Google Scholar] [CrossRef]
  13. Hu, M. Building impact assessment—A combined life cycle assessment and multi-criteria decision analysis framework. Resour. Conserv. Recycl. 2019, 150, 104410. [Google Scholar] [CrossRef]
  14. Zanghelini, G.M.; Cherubini, E.; Soares, S.R. How multi-criteria decision analysis (MCDA) is aiding life cycle assessment (LCA) in results interpretation. J. Clean. Prod. 2018, 172, 609–622. [Google Scholar] [CrossRef]
  15. Dias, L.C.; Freire, F.; Geldermann, J. Perspectives on multi-criteria decision analysis and life-cycle assessment. In New Perspectives in Multiple Criteria Decision Making: Innovative Applications and Case Studies; Doumpos, M., Figueira, J.R., Greco, S., Zopounidis, C., Eds.; Springer International Publishing: Cham, Switzerland, 2019; pp. 315–329. [Google Scholar] [CrossRef]
  16. Wang, J.-J.; Jing, Y.-Y.; Zhang, C.-F.; Zhao, J.-H. Review on multi-criteria decision analysis aid in sustainable energy decision-making. Renew. Sustain. Energy Rev. 2009, 13, 2263–2278. [Google Scholar] [CrossRef]
  17. Le Roux, D.; Olivès, R.; Neveu, P. Combining entropy weight and TOPSIS method for selection of tank geometry and filler material of a packed-bed thermal energy storage system. J. Clean. Prod. 2023, 414, 137588. [Google Scholar] [CrossRef]
  18. Zhou, Z.; Chi, Y.; Dong, J.; Tang, Y.; Ni, M. Model development of sustainability assessment from a life cycle perspective: A case study on waste management systems in China. J. Clean. Prod. 2019, 210, 1005–1014. [Google Scholar] [CrossRef]
  19. Davarpanah, A. Comparative Evaluation of Carbon Capture, Utilization, and Storage (CCUS) Technologies Using Multi-Criteria Decision-Making Approaches. ACS Sustain. Chem. Eng. 2024, 12, 9498–9510. [Google Scholar] [CrossRef]
  20. Yuan, X.; Zhao, X. Evaluation of CO2 sequestration suitability in bohai bay basin based on entropy weighted TOPSIS approach. Acad. J. Sci. Technol. 2025, 14, 24–27. [Google Scholar] [CrossRef]
  21. A Scientific Approach to Evaluating Carbon Storage Sites. Available online: https://www.slb.com/resource-library/insights-articles/a-scientific-approach-to-evaluating-carbon-storage-sites (accessed on 1 January 2025).
  22. Singh, B.; Strømman, A.H.; Hertwich, E. Life cycle assessment of natural gas combined cycle power plant with post-combustion carbon capture, transport and storage. Int. J. Greenh. Gas Control 2011, 5, 457–466. [Google Scholar] [CrossRef]
  23. Steubing, B.; De Koning, D.; Haas, A.; Mutel, C.L. The activity browser—An open source LCA software building on top of the brightway framework. Softw. Impacts 2020, 3, 100012. [Google Scholar] [CrossRef]
  24. GB/T 51316-2018; Standard for Design of Carbon Dioxide Capture and Purification Engineering for Flue Gas. The Standardization Administration of China: Beijing, China, 2018.
  25. Koornneef, J.; Van Keulen, T.; Faaij, A.; Turkenburg, W. Life cycle assessment of a pulverized coal power plant with post-combustion capture, transport and storage of CO2. Int. J. Greenh. Gas Control 2008, 2, 448–467. [Google Scholar] [CrossRef]
  26. Wang, Y.; Zhao, Y.; Zhang, J.; Zheng, C. Life Cycle Carbon Emission Assessment for a Coal-fired Power Plant Using MEA CO2 Capture and Storage Technology. Jounal Power Eng. 2011, 5, 362–368. [Google Scholar]
  27. Grant, T.; Anderson, C.; Hooper, B. Comparative life cycle assessment of potassium carbonate and monoethanolamine solvents for CO 2 capture from post combustion flue gases. Int. J. Greenh. Gas Control 2014, 28, 35–44. [Google Scholar] [CrossRef]
  28. Skone, T.J.; James, R.B., III; Marriott, J.; Cooney, G.; Littlefield, J.; Jamieson, M. Gate-to-Grave Life Cycle Analysis Model of Saline Aquifer Sequestration of Carbon Dioxide. 2013. Available online: https://www.osti.gov/biblio/1515271 (accessed on 1 January 2025).
  29. Chen, P. Effects of the entropy weight on TOPSIS. Expert Syst. Appl. 2021, 168, 114186. [Google Scholar] [CrossRef]
  30. Zhu, Y.; Tian, D.; Yan, F. Effectiveness of entropy weight method in decision-making. Math. Probl. Eng. 2020, 2020, 1–5. [Google Scholar] [CrossRef]
  31. Behzadian, M.; Khanmohammadi Otaghsara, S.; Yazdani, M.; Ignatius, J. A state-of the-art survey of TOPSIS applications. Expert Syst. Appl. 2012, 39, 13051–13069. [Google Scholar] [CrossRef]
  32. Liang, S.; Lin, X.; Liu, X.; Pan, H. The pathway to China’s carbon neutrality based on an endogenous technology CGE model. Int. J. Environ. Res. Public Health 2022, 19, 6251. [Google Scholar] [CrossRef]
  33. Cassisa, C.; Chen, X.; Zhang, D. The Role of China’s ETS in Power Sector Decarbonisation; The International Energy Agency (IEA): Paris, France, 2021. [Google Scholar]
  34. Guinan, A.; Sheriff, A.; Morgan, D.; Shih, C.Y. FECM/NETL CO2 Saline Storage Cost Model (2024): User’s Manual. 2024. Available online: https://www.osti.gov/biblio/2496286 (accessed on 1 January 2025).
  35. Bisinella, V.; Hulgaard, T.; Riber, C.; Damgaard, A.; Christensen, T.H. Environmental assessment of carbon capture and storage (CCS) as a post-treatment technology in waste incineration. Waste Manag. 2021, 128, 99–113. [Google Scholar] [CrossRef] [PubMed]
  36. Wang, P.; Liu, Z.; Pan, Z.; González-Arias, J.; Shang, L.; Wang, Y.; Zhang, Z. Advances in life cycle assessment of chemical absorption-based carbon capture technologies. Sep. Purif. Technol. 2024, 346, 127252. [Google Scholar] [CrossRef]
  37. Li, Z.; Luo, Z.; Wang, Y.; Fan, G.; Zhang, J. Suitability evaluation system for the shallow geothermal energy implementation in region by entropy weight method and TOPSIS method. Renew. Energy 2022, 184, 564–576. [Google Scholar] [CrossRef]
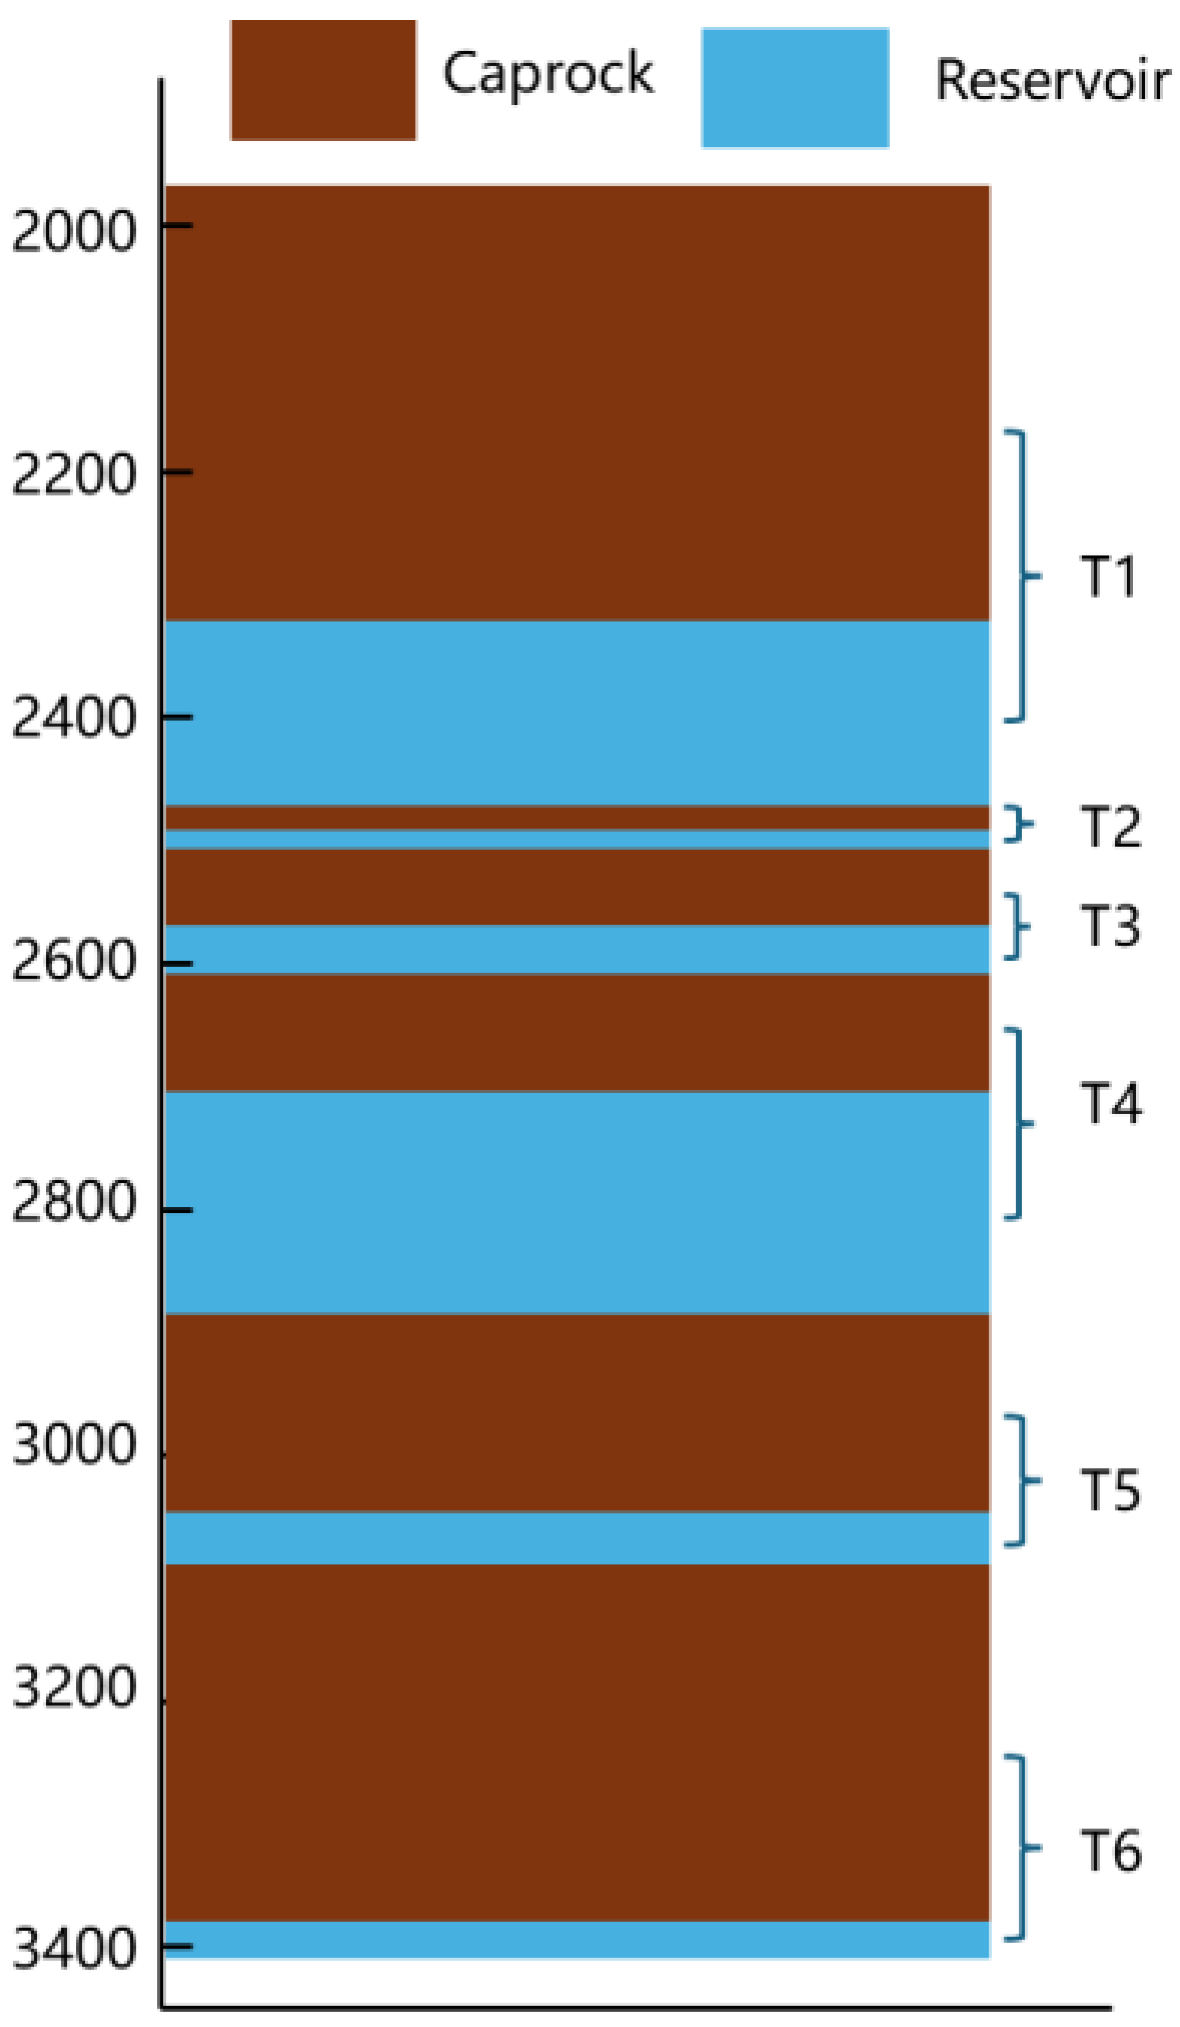
Figure 1. The schematic stratigraphic column of six distinct horizons.
Water 17 02320 g001
Figure 2. The system boundary diagram of this study.
Water 17 02320 g002
Figure 3. The environmental results of all the scenarios.
Water 17 02320 g003
Figure 4. Environmental impact differences across carbon capture, CO2 transport, and brine management options.
Water 17 02320 g004
Figure 5. The LCC results of all the scenarios (left) and LCC differences across carbon capture, CO2 transport, and brine management options (right).
Water 17 02320 g005
Figure 6. Integrated scores of all scenarios based on the entropy-weighted TOPSIS method.
Water 17 02320 g006
Figure 7. Breakeven analysis of Scenario S5 under different carbon price evolution models.
Water 17 02320 g007
Table 1. Summary of the lithological characteristics of the caprock and reservoir layers.
LayersCaprock LithologyReservoir LithologySeal–Reservoir Thickness Ratio
T1Predominantly dark grey–black mudstone, with thin sandstone bedsLight grey coarse to medium sandstone, interbedded with fine sandstones (grey–green and brown–yellow)2.44
T2Red–brown and grey–green mudstoneUpper: brown mudstone and grey–green silty fine sandstone. Lower: light grey medium sandstone and brown–yellow fine sandstone0.72
T3Light brown mudstone and sandy mudstoneLight grey coarse to medium sandstone; basal grey–green sandy mudstone1.97
T4Brown mudstone and sandy mudstone, with a ~10 m interval of light grey medium sandstone and green–grey fine sandstoneGrey medium to fine sandstone, with ~7 m of brown mudstone at the midsection; basal light grey fine sandstone0.57
T5Predominantly light reddish–brown fine sandstone, interbedded with reddish–brown muddy sandstone and grey–green fine to medium sandstoneLight red fine sandstone and siltstone3.43
T6Dominantly mudstone (light grey, grey–green, brown–yellow interbeds), with thin layers of light red sandstonePink sandstone and light grey fine sandstone, interbedded with brown–grey mudstone7.31
Table 2. Summary of environmental impact analysis data.
ProcessMaterials/EnergyAmountUnitsSource
DefaultOption1
CaptureMEA2.34--kg/ton CO2[25]
NaOH0.13--
K2CO3--0.12[27]
KOH--4.5
Electricity23.617kWh/ton CO2[26,27]
Steam42.3GJ/ton CO2
Steel317317ton/unit[26]
Concrete11m3/unit
CompressionElectricity103--kWh/t CO2Authors’ own data
Steel65--ton/unit[26]
Concrete65--m3/unit
Copper7--ton/unit
PVC20--ton/unit
Diesel1978--GJ/unit
Land use400--m2/unitAuthors’ own data
TransportationElectricity1.9--kWh/ton CO2Authors’ own data
Steel48,000--ton/unit[26]
PVC232--
Diesel165,500--GJ/unit
Diesel--0.133GJ/ton CO2Authors’ own data
Tank truck--360item/unit
Land use150,000--m2/unit
Site preparationDiesel585--GJ/unit[22]
Steel6820--ton/unit
Barite8770--
Bentonite650--
Concrete6500--m3/unit
Land use14,000--m2/unit[28]
Well constructionDiesel126--GJ/unit[22]
Steel1462--ton/unit
Barite1880--
Bentonite140--
Concrete1400--m3/unit
Land use3000--m2/unit[28]
CO2 injectionElectricity46--kWh/ton CO2Authors’ own data
Land use400--m2/unit[28]
Well closureSteel24.8--ton/well[28]
Concrete51.3--m3/well
Monitoring--------Authors’ own data
Brine ManagementDiesel0.0133--GJ/ton CO2
Tank truck104--item/unit
Electricity--1.73kWh/ton CO2[28]
RO facilities--1unitAuthors’ own data
Land use--6400m2/unit[28]
Note: MEA—monoethanolamide; PVC—polyvinyl chloride. All the values for materials and energy consumption are average values from the literature.
Table 3. Technical configurations and descriptions of the LCA scenarios.
ScenariosCaptureTransportBrine ManagementOthers
DefaultOption1DefaultOption1DefaultOption1Default
Default (S0)
Alternative 1 (S1)
Alternative 2 (S2)
Alternative 3 (S3)
Alternative 4 (S4)
Alternative 5 (S5)
Alternative 6 (S6)
Alternative 7 (S7)
Table 4. Prices for consumed materials and energy.
Material/EnergyPrice (CNY)
MEA (kg)8.5~9.7
NaOH (kg)3.5~4.2
K2CO3 (kg)5.5~6.5
KOH (kg)4.0~5.0
Electricity (kWh)0.60~0.70
Steam (GJ)30~50
Steel (ton)3310~3750
Concrete (m3)500~700
Copper (ton)67,710~77,280
PVC (ton)5400~10,800
Diesel (GJ)50~61
Barite (ton)700~1000
Bentonite (ton)2200~3500
RO facility (4200 ton/d)7,300,000
Tank truck for brine (30 m3)187,086
Tank truck for CO2 (30 m3)2,175,420
Note: MEA—monoethanolamide; PVC—polyvinyl chloride.
Table 5. Weights for 6 environmental indicators and 1 economic indicator.
IndicatorsWeights
GWP0.16
FFP0.15
Land_use0.17
Water_use0.17
Material_resources0.12
Human_toxicity0.12
Cost0.10
Disclaimer/Publisher’s Note: The statements, opinions and data contained in all publications are solely those of the individual author(s) and contributor(s) and not of MDPI and/or the editor(s). MDPI and/or the editor(s) disclaim responsibility for any injury to people or property resulting from any ideas, methods, instructions or products referred to in the content.