


Hydrological Responses to Territorial Spatial Change in the Xitiaoxi River Basin: A Simulation Study Using the SWAT Model Driven by China Meteorological Assimilation Driving Datasets


Abstract
1. Introduction
2. Materials and Methods
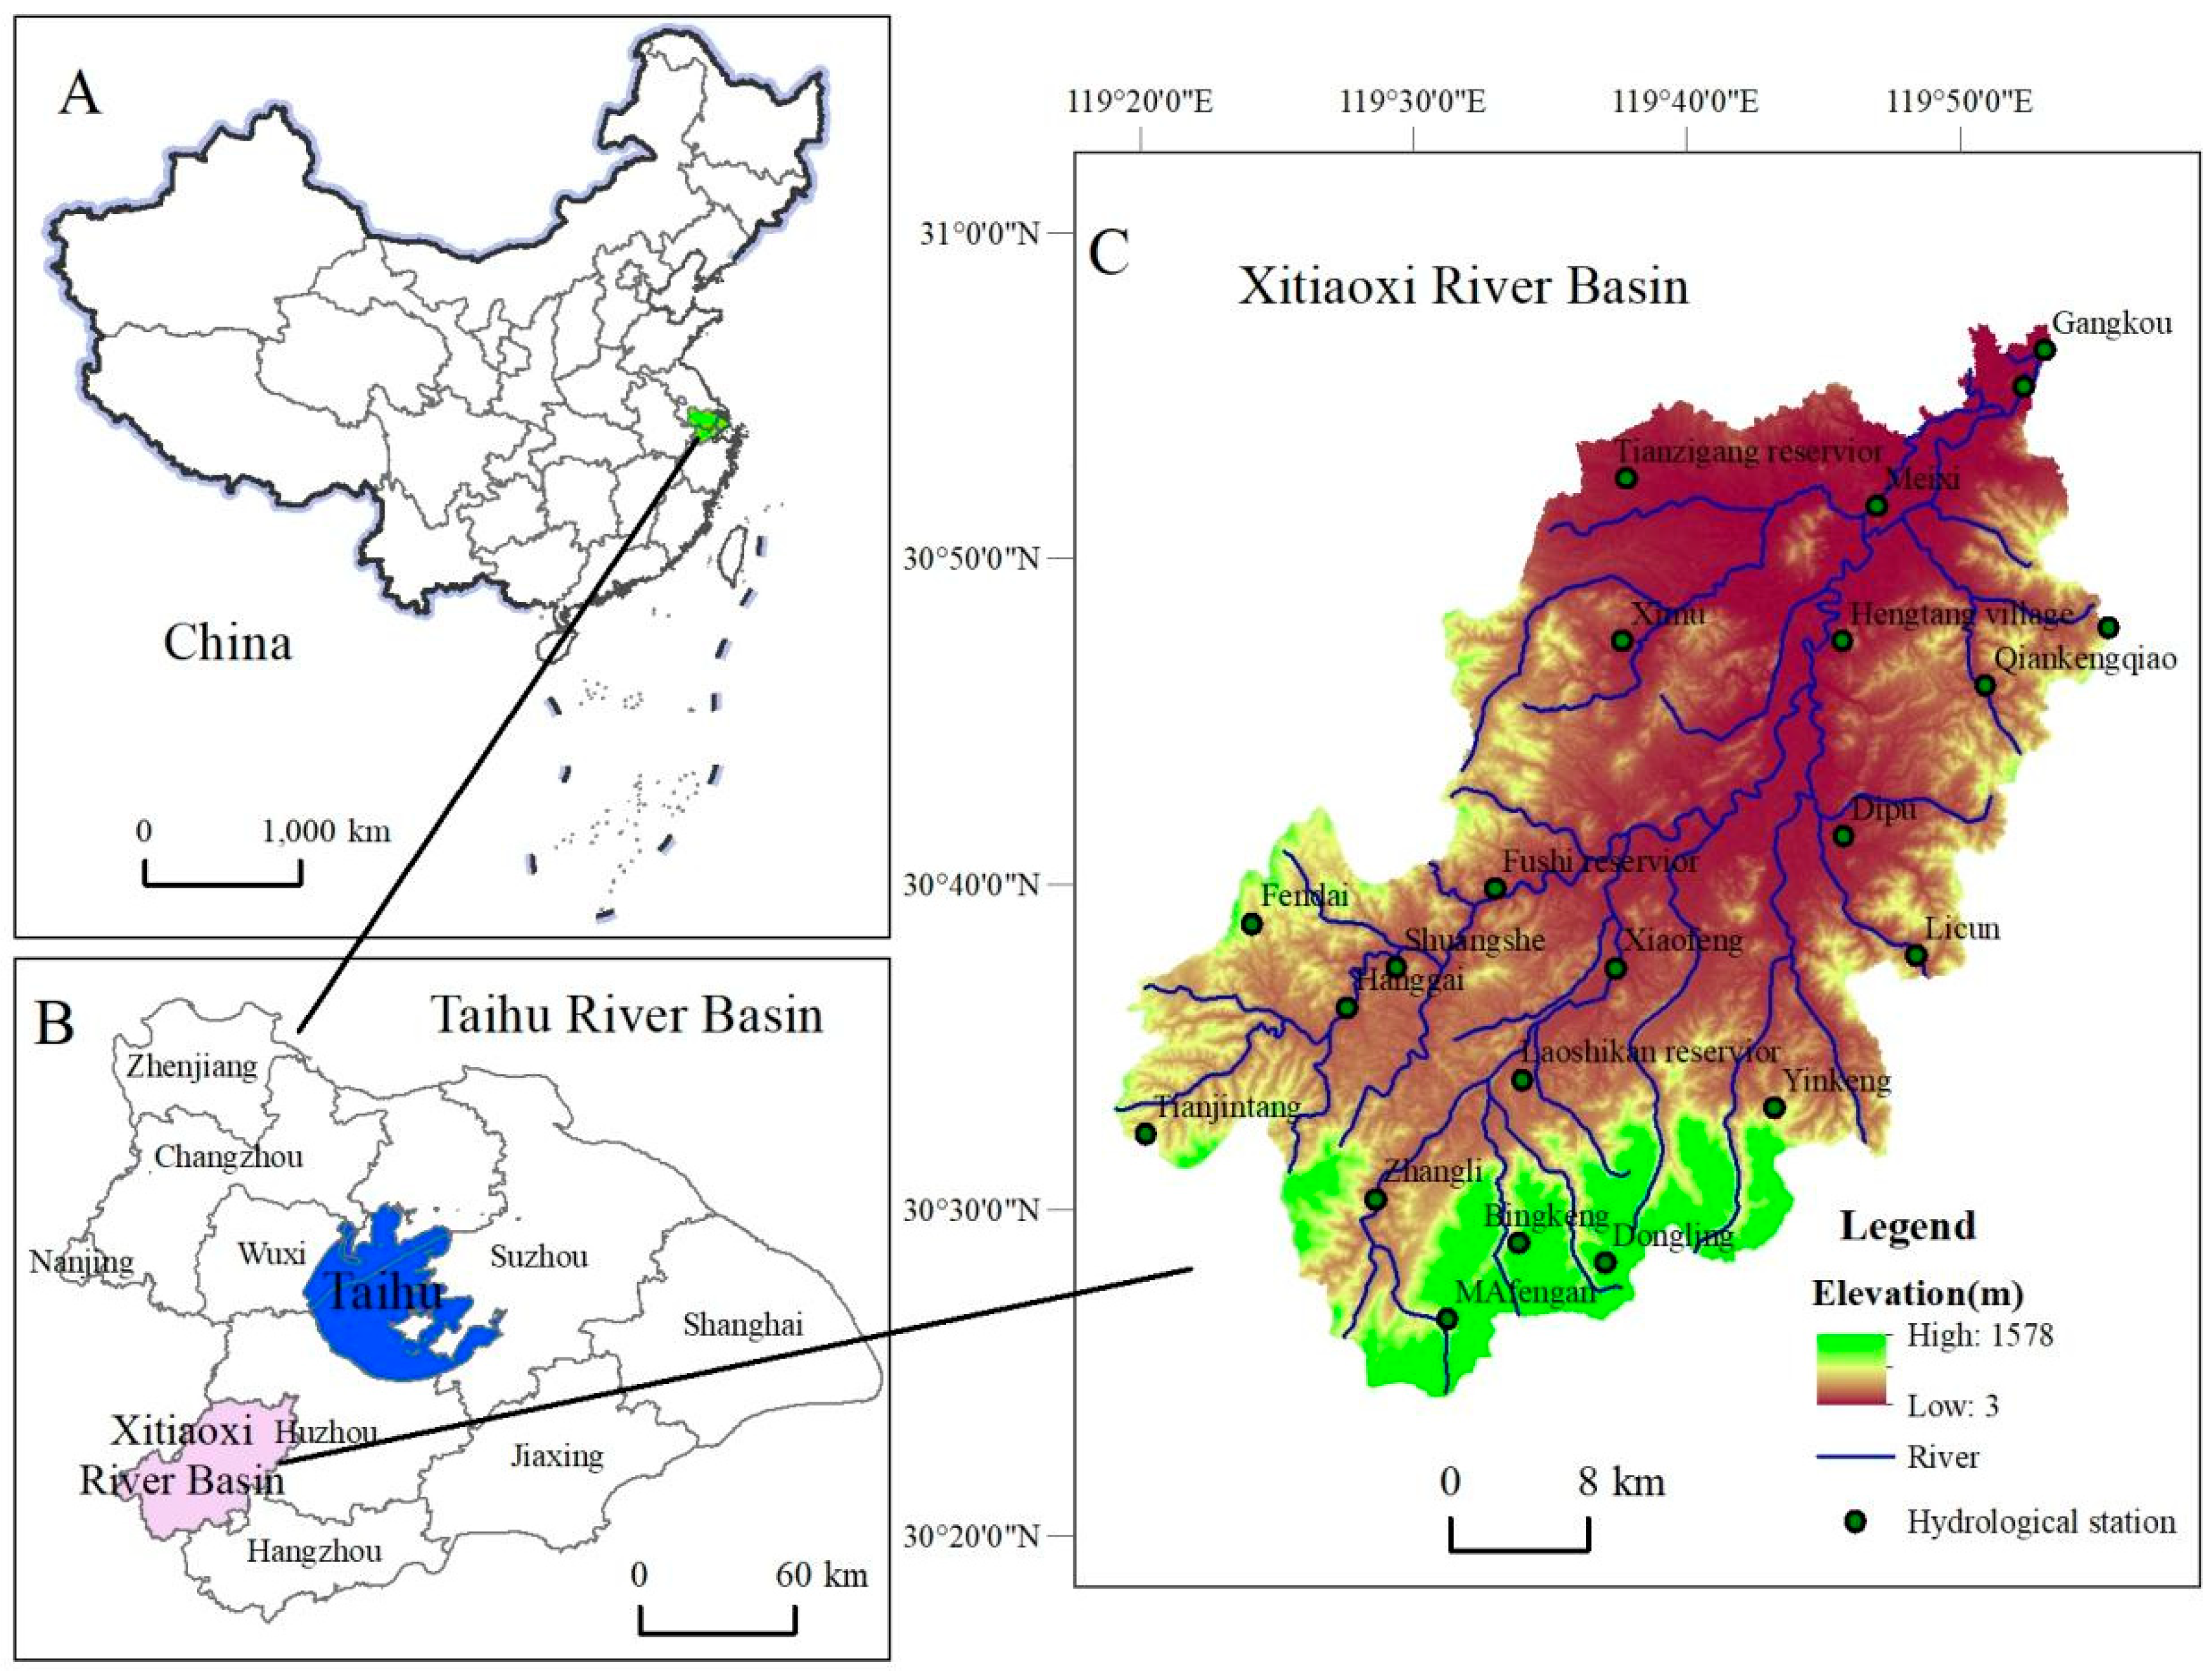
2.1. Study Area
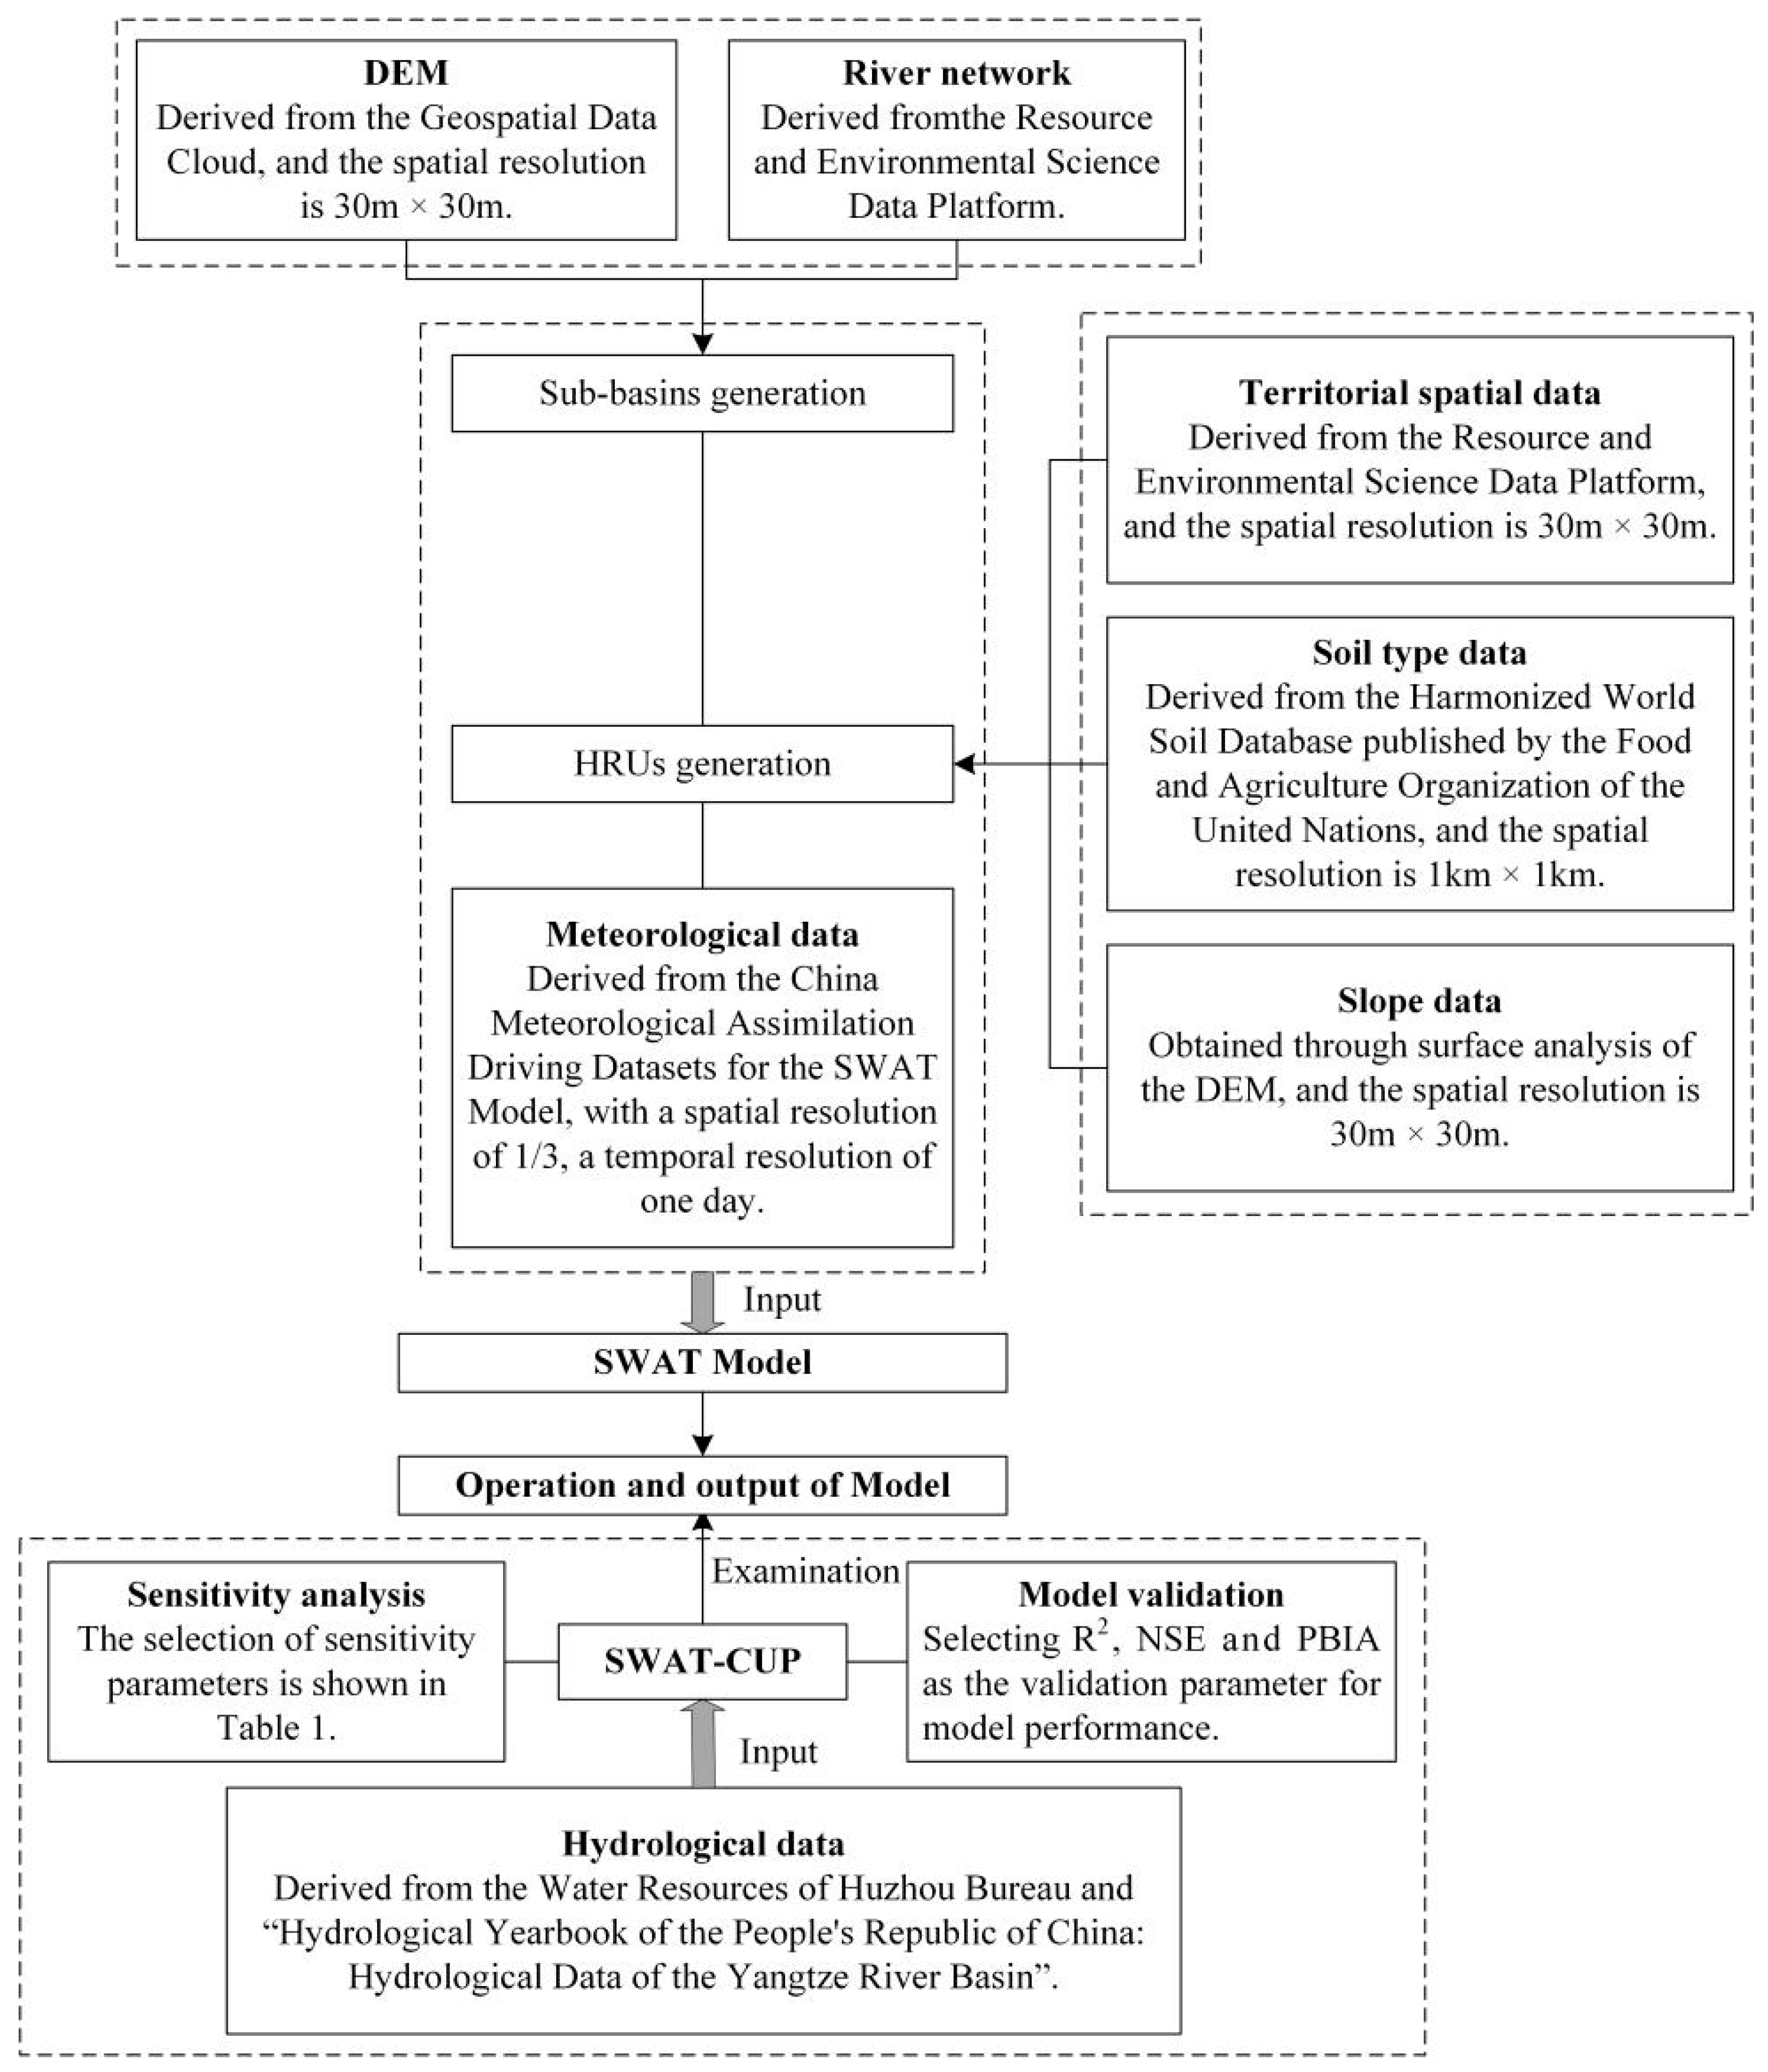
2.2. Data Sources
2.2.1. CMADS
2.2.2. Digital Elevation Model (DEM) and Hydrological Data
2.2.3. The Territorial Spatial Data
2.2.4. The Soil Type Data
2.3. Methodology
2.3.1. The SWAT Model
2.3.2. Model Evaluation Index
2.3.3. The Change Rate of the Production-Living-Ecological Spatial Area and Runoff
3. Results
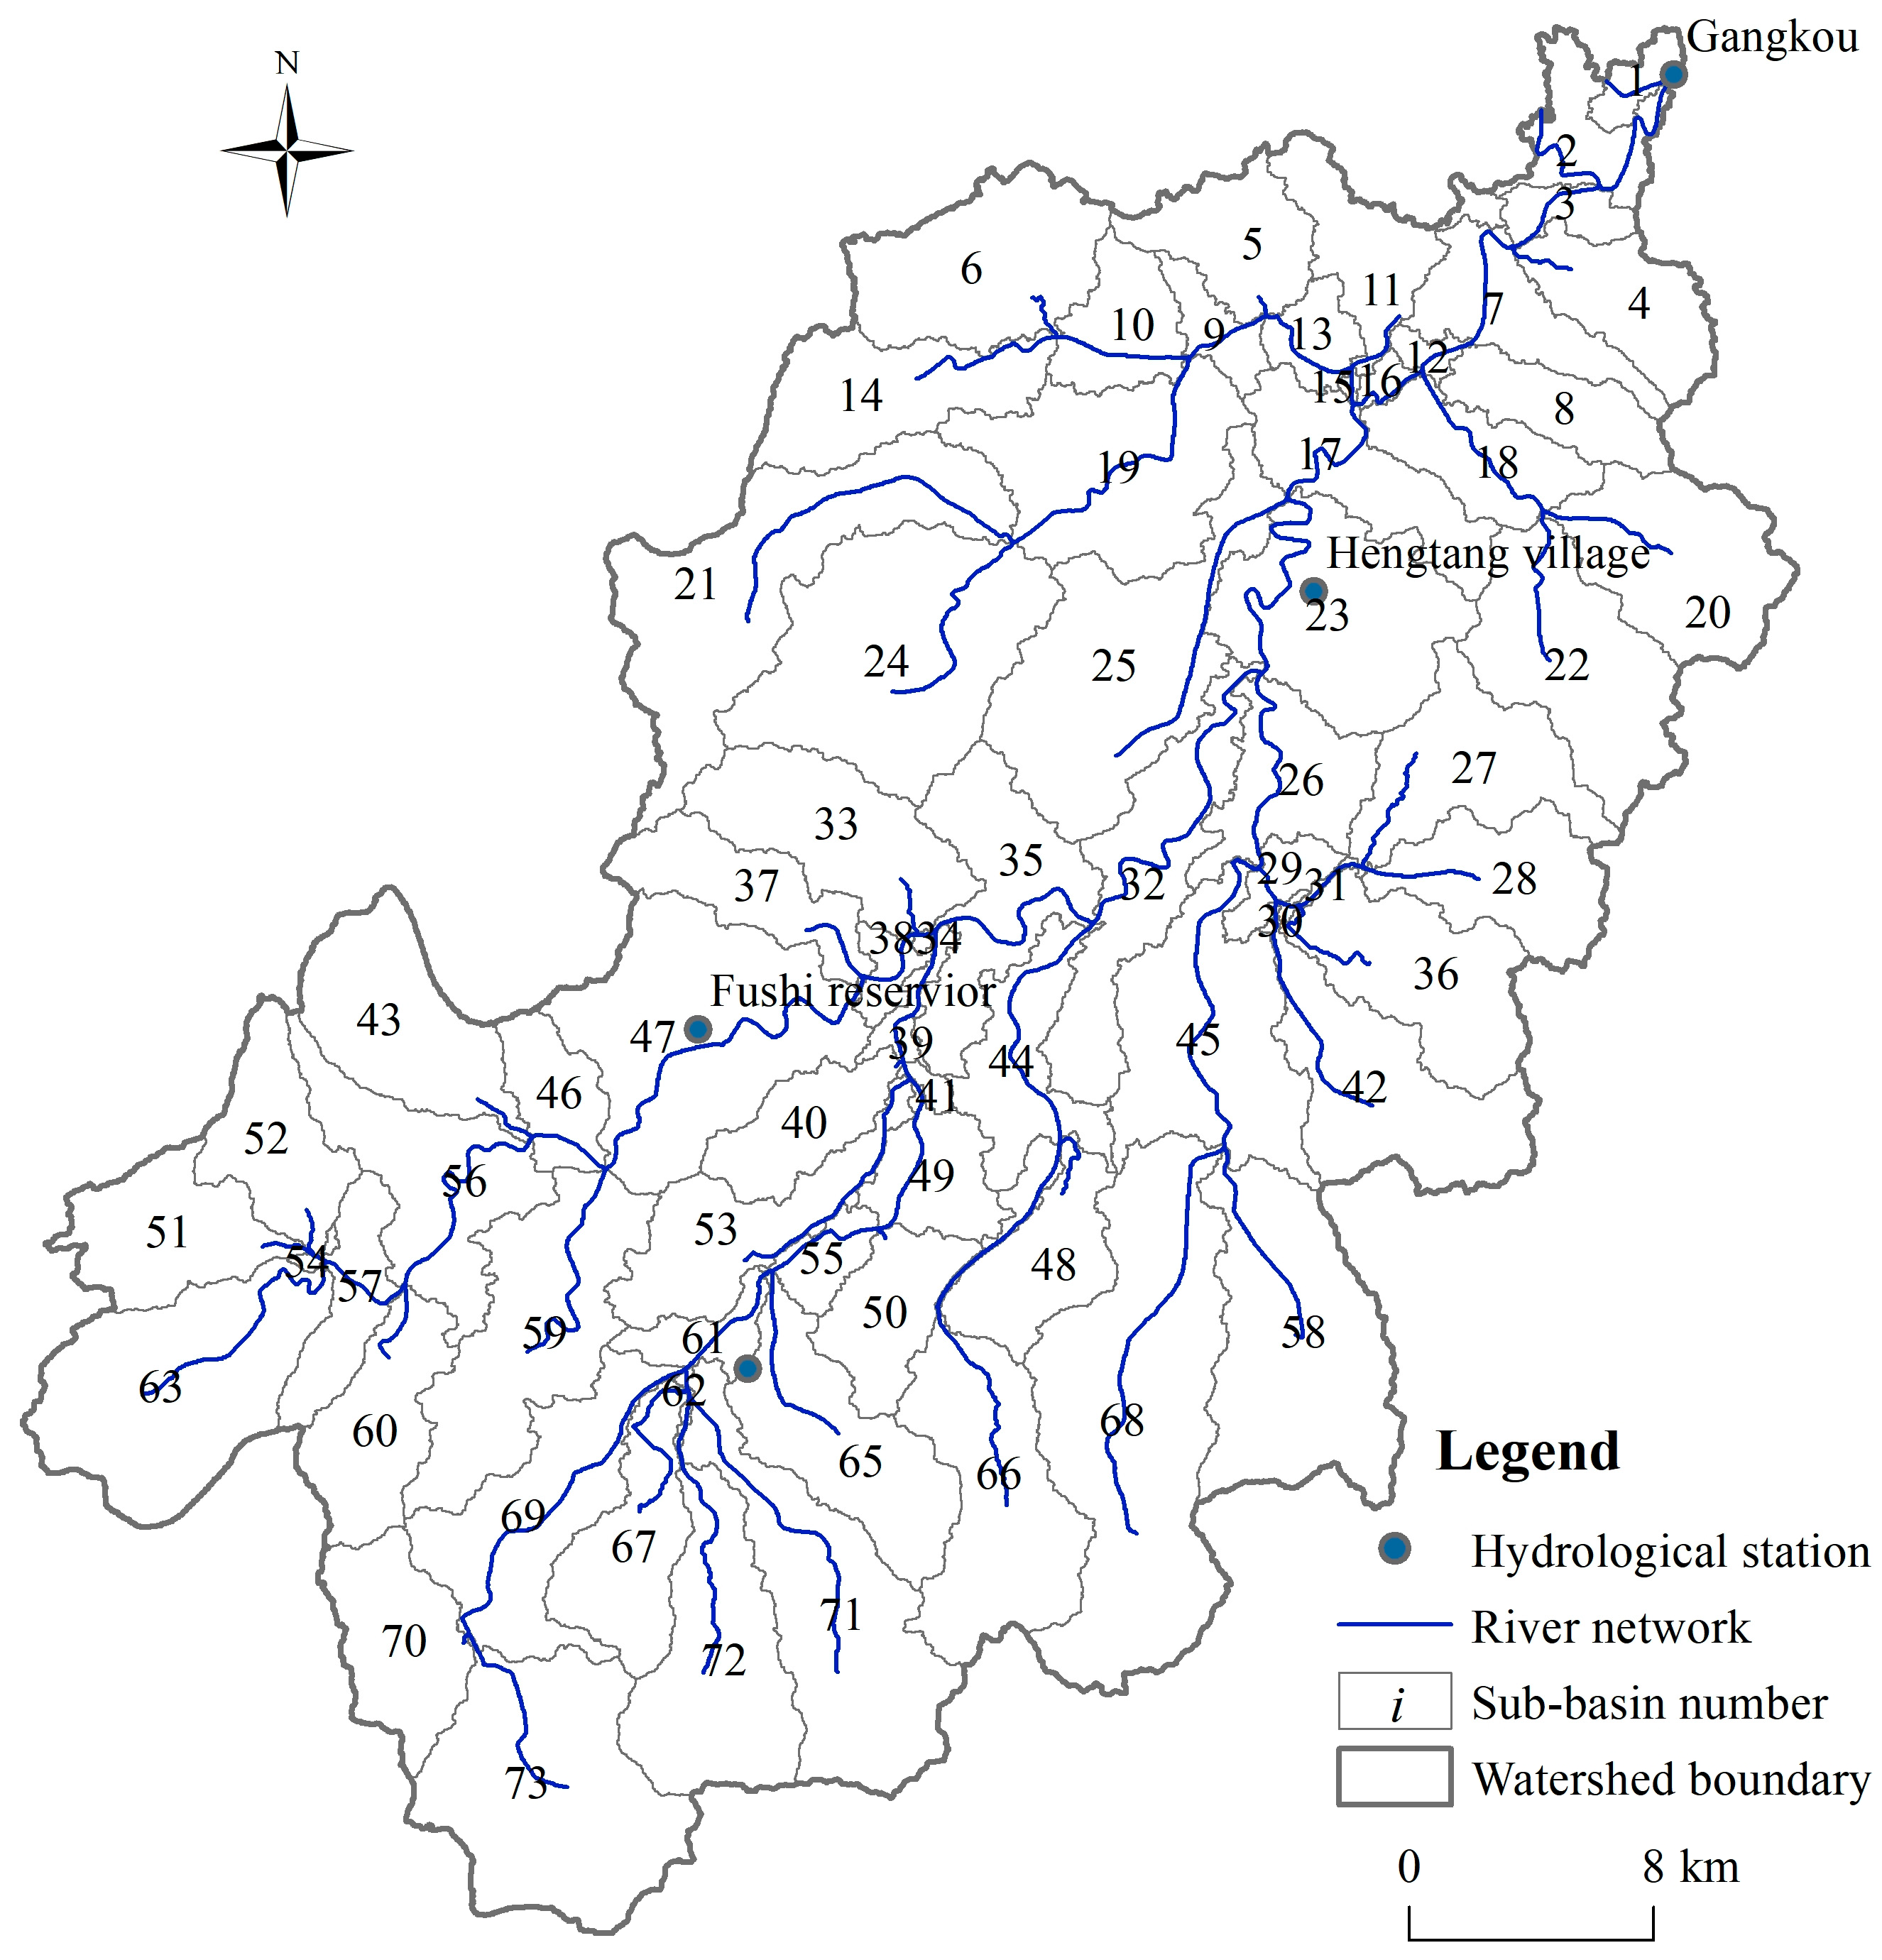
3.1. Construction of SWAT Model
3.2. Sensitivity Analysis and Regular Rate of the SWAT Model
4. Discussion
4.1. Evaluation of Simulation Results
4.2. Response of Runoff to Different Territorial Spatial Structures
4.2.1. Influence of Single Territorial Spatial Type on Runoff
4.2.2. Change in Production-Living-Ecological Space Type and Runoff in Different Periods
4.3. The Limitations of the Study and Future Research
5. Conclusions
Author Contributions
Funding
Data Availability Statement
Acknowledgments
Conflicts of Interest
References
- Mather, A.S. Land Use; Longman Group U.K. Limited: Harlow Essex, UK, 1986; pp. 146–147. [Google Scholar]
- Elmahal, A.E.; Mahmoud, W.H.; Abdalla, A.; Ibrahim, M.M. Quantifying the impacts of land use and land cover change on watershed hydrology using spatial cloud computing. J. Flood Risk Manag. 2025, 18, e70014. [Google Scholar] [CrossRef]
- Ragab, R.; Cooper, J.D. Variability of unsaturated zone water transport parameters: Implications for hydrological modelling. 1. In situ measurements. J. Hydrol. 1993, 148, 109–131. [Google Scholar] [CrossRef]
- Ragab, R.; Cooper, J.D. Variability of unsaturated zone water transport parameters: Implications for hydrological modelling. 2. Predicted vs. in situ measurements and evaluation of methods. J. Hydrol. 1993, 148, 133–147. [Google Scholar] [CrossRef]
- Yuan, Y.; Shi, P.J.; Liu, Y.H.; Zhou, M. Impact of land use change on urban flood disaster. J. Nat. Disasters 2003, 12, 6–13. (In Chinese) [Google Scholar] [CrossRef]
- Sajikumar, N.; Remya, R.S. Impact of land cover and land use change on runoff characteristics. J. Environ. Manag. 2015, 161, 460–468. [Google Scholar] [CrossRef]
- Babar, S.; Ramesh, H. Streamflow response to land use-land cover change over the Nethravathi River Basin, India. J. Hydrol. Eng. 2015, 20, 05015002. [Google Scholar] [CrossRef]
- Barreto-Martin, C.; Sierra-Parada, R.; Calderón-Rivera, D.; Jaramillo-Londonoa, A.; Mesa-Fernández, D. Spatio-temporal analysis of the hydrological response to land cover changes in the sub-basin of the Chicú river, Colombia. Heliyon 2021, 7, e07358. [Google Scholar] [CrossRef] [PubMed]
- Zhou, F.; Lv, H.; Xu, Y. Changes of underlying surface and their influences on storage capacity and flood in the plain river network area. Resour. Environ. Yangtze Basin 2015, 24, 2094–2099. (In Chinese) [Google Scholar] [CrossRef]
- Cheng, J.; Yang, K.; Xu, Q. Rainfall-runoff storage-infiltration effect of LUCC in highly urbanized region on a catchment’s scale: Shanghai urban green space system as an example. Acta Ecol. Sin. 2008, 28, 2972–2980. (In Chinese) [Google Scholar]
- Zhang, L.; Nan, Z.T.; Yu, W.J.; Zhao, Y.B.; Xu, Y. Comparison of baseline period choices for separating climate and land use/land cover change impacts on watershed hydrology using distributed hydrological models. Sci. Total Environ. 2018, 622–623, 1016–1028. [Google Scholar] [CrossRef]
- Liu, Y.; Liu, F.; Chen, C.; Chen, Q.W.; Zhang, J.Y.; Mo, K.L.; Jiang, Q.H.; Yao, S.Y. A holistic approach to projecting streamflow and analyzing changes in ecologically relevant hydrological indicators under climate and land use/cover change. J. Hydrol. 2024, 632, 130863. [Google Scholar] [CrossRef]
- Qin, Y.L.; Shi, P.; Hu, Y.; Li, Q.; Wang, Y.P.; Wang, Q.Q.; Zhou, D.D. Landscape indices explain different responses of runoff and sediment yield to land use/cover change on the Loess Plateau, China. Catena 2025, 249, 108674. [Google Scholar] [CrossRef]
- Bronstert, A.; Vollmer, S.; Ihringer, J. A review of the impact of land consolidation on runoff production and flooding in Germany. Phys. Chem. Earth 1995, 20, 321–329. [Google Scholar] [CrossRef]
- Brath, A.; Montanari, A.; Moretti, G. Assessing the Effect on Flood Frequency of Land Use Change via Hydrological Simulation (With Uncertainty). J. Hydrol. 2006, 324, 141–153. [Google Scholar] [CrossRef]
- Akter, T.; Quevauviller, P.; Eisenreich, S.J.; Vaes, G. Impacts of climate and land use changes on flood risk management for the Schijn River, Belgium. Environ. Sci. Policy 2018, 89, 163–175. [Google Scholar] [CrossRef]
- Liu, J.G.; Dietz, T.; Carpenter, S.R.; Alberti, M.; Folke, C.; Moran, E.; Pell, A.N.; Deadman, P.; Kratz, T.; Lubchenco, J.; et al. Complexity of coupled human and natural systems. Science 2007, 317, 1513–1516. [Google Scholar] [CrossRef]
- Wijesekara, G.N.; Gupta, A.; Valeo, C.; Hasbani, J.-G.; Qiao, Y.; Delaney, P.; Marceau, D.J. Assessing the impact of future land-use changes on hydrological processes in the Elbow River watershed in southern Alberta, Canada. J. Hydrol. 2012, 412–413, 220–232. [Google Scholar] [CrossRef]
- Yin, J.; He, F.; Xiong, Y.J.; Qiu, G.Y. Effect of land use/land cover and climate changes on surface runoff in a semi-humid and semi-arid transition zone in Northwest China. Hydrol. Earth Syst. Sci. 2017, 21, 183–196. [Google Scholar] [CrossRef]
- Yang, W.T.; Long, D.; Peng, B. Impacts of future land cover and climate changes on runoff in the mostly afforested river basin in North China. J. Hydrol. 2019, 570, 201–219. [Google Scholar] [CrossRef]
- Yan, B.; Fang, N.F.; Zhang, P.C.; Shi, Z.H. Impacts of land use change on watershed streamflow and sediment yield: An assessment using hydrologic modelling and partial least squares regression. J. Hydrol. 2013, 484, 26–37. [Google Scholar] [CrossRef]
- Li, M.; Di, Z.H.; Duan, Q.Y. Effect of sensitivity analysis on parameter optimization: Case study based on streamflow simulations using the SWAT model in China. J. Hydrol. 2021, 603, 126896. [Google Scholar] [CrossRef]
- Singh, L.; Saravanan, S. Simulation of monthly streamflow using the SWAT model of the Ib River watershed, India. HydroResearch 2020, 3, 95–105. [Google Scholar] [CrossRef]
- Walega, A.; Amatya, D.M.; Caldwell, P.; Marion, D.; Panda, S. Assessment of storm direct runoff and peak flow rates using improved SCS-CN models for selected forested watersheds in the Southeastern United States. J. Hydrol. Reg. Stud. 2020, 27, 100645. [Google Scholar] [CrossRef]
- Gumindoga, W.; Rientjes, T.H.M.; Haile, A.T.; Dube, T. Predicting streamflow for land cover changes in the Upper Gilgel Abay River Basin, Ethiopia: A TOPMODEL based approach. Phys. Chem. Earth 2014, 76–78, 3–15. [Google Scholar] [CrossRef]
- Fan, J. Draft of major function oriented zoning of china. Acta Geogr. Sin. 2015, 70, 186–201. (In Chinese) [Google Scholar] [CrossRef]
- Wu, C.J.; Hou, F. Territorial Development, Rehabilitation and Planning; Jiangsu Education Press: Nanjing, China, 1990. (In Chinese) [Google Scholar]
- Meng, X.Y. Study on Land-Surface Process Simulation and Validation Using CLM3.5 and SWAT Model Driven by Improved CLDAS: A Case Study of the Jing and Bo River Basins in Xinjiang. Ph.D. Thesis, Xinjiang University, Urumqi, China, 25 May 2016. (In Chinese). [Google Scholar]
- The China Meteorological Assimilation Driving Datasets for the SWAT Model. The China Meteorological Assimilation Driving Datasets. 2024. Available online: http://www.cmads.org (accessed on 22 November 2024).
- Geospatial Data Cloud. Digital Elevation Model. 2024. Available online: http://www.gscloud.cn/ (accessed on 22 November 2024).
- Resource and Environmental Science Data Platform. Land Use Raster. 2024. Available online: http://www.resdc.cn/ (accessed on 22 November 2024).
- Food and Agriculture Organization of the United Nations. Harmonized World Soil Database. 2024. Available online: https://gaez.fao.org/pages/hwsd (accessed on 22 November 2024).
- Kong, D.Y.; Chen, H.G.; Wu, K.S. The evolution of “Production-Living-Ecological” space, eco-environmental effects and its influencing factors in China. J. Nat. Resour. 2021, 36, 1116–1135. (In Chinese) [Google Scholar] [CrossRef]
- Arnold, J.G.; Srinivasan, R.; Muttiah, R.S.; Williams, J.R. Large area hydrologic modeling and assessment part I: Model development. J. Am. Water Resour. Assoc. 1998, 34, 73–89. [Google Scholar] [CrossRef]
- Neitsch, S.L.; Arnold, J.; Kiniry, J.R.; Williams, J.R. Soil and Water Assessment Tool Theoretical Documentation (Version 2009); Texas Water Resources Institute: Dallas, TX, USA, 2011. [Google Scholar]
- Noori, N.; Kalin, L. Coupling SWAT and ANN models for enhanced daily streamflow prediction. J. Hydrol. 2016, 533, 141–151. [Google Scholar] [CrossRef]
- Ahmad, H.M.N.; Sinclair, A.; Jamieson, R.; Madani, A.; Hebb, D.; Havard, P.; Yiridoe, E.K. Modeling sediment and nitrogen export from a rural watershed in Eastern Canada using the soil and water assessment Tool. J. Environ. Qual. 2011, 40, 1182–1194. [Google Scholar] [CrossRef]

| Indicator of Calibration and Validation | Description of the Relationship Between Indicators and Simulation Results | Accuracy Requirements for Indicators |
|---|---|---|
| The coefficient of determination (R2) | The closer R2 value is to 1, the higher the degree of fitting between the simulated value and the measured value, and the more accurate the simulated result. | The simulation results met the requirements when R2 > 0.6, NSE > 0.5, and |PBIAS| < 0.20 [37], this result showed that the constructed SWAT model could accurately describe the runoff process in the study area. |
| Nash–Suttcliffe efficiency (NSE) | The closer NSE value is to 1, the higher the degree of fitting between the simulated value and the measured value, and the more accurate the simulated result. | |
| Standard bias (PBIAS) | The closer the PBIAS is to 0, the better the consistency between the simulation results and the observed values. |
| Rank | Parameter | Description | Parameter Range | Rate Value | t-Stat | p-Value |
|---|---|---|---|---|---|---|
| 1 | V__CH_N2.rte | Manning’s n value for main channel | (−0.01, 0.3) | 0.017840 | −16.8048 | 0.0000 |
| 2 | V__ALPHA_BNK.rte | Base flow alpha factor for bank storage | (0.0, 1.0) | 0.056741 | −13.6155 | 0.0000 |
| 3 | R__HRU_SLP.hru | Average slope steepness | (−0.5, 0.5) | −0.420013 | −12.8899 | 0.0000 |
| 4 | V__EPCO.hru | Plant uptake compensation factor | (0.0, 1.0) | 0.017689 | −12.8084 | 0.0000 |
| 5 | R__SOL_AWC ( ).sol | Available water capacity of the soil layer | (−0.2, 0.4) | 0.072698 | −8.9173 | 0.0000 |
| 6 | V__CANMX.hru | Maximum canopy storage | (0.0, 100.0) | 0.462685 | −8.1778 | 0.0000 |
| 7 | R__CN2.mgt | SCS runoff curve number | (−0.2, 0.2) | −0.052725 | −3.7211 | 0.0002 |
| 8 | V__ESCO.hru | Soil evaporation compensation factor | (0.0, 1.0) | 0.997933 | 3.1444 | 0.0018 |
| 9 | V__CH_K2.rte | Effective hydraulic conductivity in the main channel | (−0.01, 500.0) | 75.039429 | −1.8856 | 0.0600 |
| 10 | V__GWQMN.gw | Threshold depth of water in shallow aquifer for return flow to occur | (0.0, 5000.0) | 1417.180298 | −1.7316 | 0.0840 |
| 11 | V__TIMP.bsn | Snowpack temperature lag factor | (0.0, 1.0) | 0.953033 | −1.6147 | 0.1070 |
| 12 | V__SFTMP.bsn | Snowfall temperature | (−5.0, 5.0) | −4.939772 | −1.3025 | 0.1934 |
| 13 | V__RCHRG_DP.gw | Deep aquifer percolation fraction | (0.0, 1.0) | 0.087207 | 1.2484 | 0.2125 |
| 14 | R__SOL_K ( ).sol | Saturated hydraulic conductivity | (−0.8, 0.8) | −0.755703 | −1.0056 | 0.3151 |
| 15 | V__GW_DELAY.gw | Groundwater delay time | (0.0, 500.0) | 303.878967 | −0.8540 | 0.3935 |
| 16 | V__SLSUBBSN.hru | Average slope length (m) | (10.0, 150.0) | 104.545128 | 0.8514 | 0.3950 |
| 17 | V__SURLAG.bsn | Surface runoff lag time | (0.05, 24.0) | 11.667909 | 0.7858 | 0.4324 |
| 18 | V__REVAPMN.gw | Threshold depth of water in the shallow aquifer for “revap” to occur | (0.0, 500.0) | 156.044724 | 0.7563 | 0.4498 |
| 19 | V__OV_N.hru | Manning’s n value for overland flow | (0.01, 30.0) | 29.390974 | 0.7028 | 0.4825 |
| 20 | V__DEP_IMP.hru | Depth to impervious layer for modeling perched water tables | (0.0, 6000.0) | 251.831955 | 0.6508 | 0.5155 |
| 21 | R__SOL_BD ( ).sol | Moist bulk density of first soil layer | (−0.5, 0.6) | 0.351647 | −0.5465 | 0.5850 |
| 22 | V__SMFMX.bsn | Maximum melt rate for snow during year | (0.0, 20.0) | 7.120377 | 0.4648 | 0.6423 |
| 23 | V__ALPHA_BF.gw | Base flow alpha factor | (0.0, 1.0) | 0.403756 | 0.2039 | 0.8385 |
| 24 | V__GW_REVAP.gw | Groundwater “revap” coefficient | (0.02, 0.2) | 0.132085 | 0.1904 | 0.8490 |
| 25 | R__SOL_ALB ( ).sol | Moist soil albedo | (0.0, 0.25) | 0.164555 | −0.0435 | 0.8490 |
| Gangkou | Hengtang Village | Fushi Reservoir | ||||
|---|---|---|---|---|---|---|
| Calibration Period | Validation Period | Calibration Period | Validation Period | Calibration Period | Validation Period | |
| R2 | 0.83 | 0.71 | 0.79 | 0.74 | 0.72 | 0.71 |
| NSE | 0.80 | 0.69 | 0.78 | 0.73 | 0.71 | 0.67 |
| PBIAS (%) | −12.9 | 5.7 | −6.1 | −2.3 | −2.6 | 11.6 |
| Territorial Spatial Type | Agricultural Production Space | Industrial Production Space | Urban Living Space | Rural Living Space | Forest Ecological Space | Grassland Ecological Space |
|---|---|---|---|---|---|---|
| Runoff (m3/s) | 6.828 | 8.112 | 6.570 | 5.979 | 6.546 | 6.345 |
| Period | Runoff (%) | Agricultural Production Space (%) | Industrial Production Space (%) | Urban Living Space (%) | Rural Living Space (%) | Forest Ecological Space (%) | Grassland Ecological Space (%) | Water Ecological Space (%) |
|---|---|---|---|---|---|---|---|---|
| 1990–2000 | −0.037 | −0.029 | 0.064 | 0.488 | 0.038 | 0.012 | −0.063 | 0.000 |
| 2000–2010 | 0.201 | −0.051 | 6.315 | 1.504 | 0.448 | −0.009 | 0.009 | 0.118 |
| 2010–2018 | 0.326 | −0.049 | 1.088 | 0.437 | 0.170 | −0.007 | 0.023 | −0.030 |
| 1990–2018 | 0.492 | −0.123 | 15.247 | 4.355 | 0.758 | −0.004 | −0.033 | 0.085 |
| Period | Agricultural Production Space | Industrial Production Space | Urban Living Space | Rural Living Space | Forest Ecological Space | Grassland Ecological Space | Water Ecological Space |
|---|---|---|---|---|---|---|---|
| Correlation coefficient | −0.116 | 0.716 | −0.082 | −0.058 | −0.193 | −0.051 | −0.046 |
| p-Value | 0.048 | 0.000 | 0.162 | 0.322 | 0.001 | 0.386 | 0.429 |
Disclaimer/Publisher’s Note: The statements, opinions and data contained in all publications are solely those of the individual author(s) and contributor(s) and not of MDPI and/or the editor(s). MDPI and/or the editor(s) disclaim responsibility for any injury to people or property resulting from any ideas, methods, instructions or products referred to in the content. |
© 2025 by the authors. Licensee MDPI, Basel, Switzerland. This article is an open access article distributed under the terms and conditions of the Creative Commons Attribution (CC BY) license (https://creativecommons.org/licenses/by/4.0/).
Share and Cite
Kong, D.; Chen, H.; Wu, K. Hydrological Responses to Territorial Spatial Change in the Xitiaoxi River Basin: A Simulation Study Using the SWAT Model Driven by China Meteorological Assimilation Driving Datasets. Water 2025, 17, 2267. https://doi.org/10.3390/w17152267
Kong D, Chen H, Wu K. Hydrological Responses to Territorial Spatial Change in the Xitiaoxi River Basin: A Simulation Study Using the SWAT Model Driven by China Meteorological Assimilation Driving Datasets. Water. 2025; 17(15):2267. https://doi.org/10.3390/w17152267
Chicago/Turabian StyleKong, Dongyan, Huiguang Chen, and Kongsen Wu. 2025. "Hydrological Responses to Territorial Spatial Change in the Xitiaoxi River Basin: A Simulation Study Using the SWAT Model Driven by China Meteorological Assimilation Driving Datasets" Water 17, no. 15: 2267. https://doi.org/10.3390/w17152267
APA StyleKong, D., Chen, H., & Wu, K. (2025). Hydrological Responses to Territorial Spatial Change in the Xitiaoxi River Basin: A Simulation Study Using the SWAT Model Driven by China Meteorological Assimilation Driving Datasets. Water, 17(15), 2267. https://doi.org/10.3390/w17152267