Abstract
An extreme flood event occurred in Slovenia in August 2023. This study evaluated the influence of this extreme flood on the design discharges in Slovenia. This evaluation was based on flood frequency analysis for the data from 33 gauging stations. Analyses were conducted with and without the 2023 peak discharge, i.e., for the periods 1961–2022 and 1961–2023, using eight different theoretical distribution functions. In addition, specific discharge values for the 2023 flood event were analyzed and compared with regional envelope curves for Europe. The findings of the study indicate that the impact of a single flood event on the design discharge values can be substantial. Moreover, an analysis of the specific discharges resulting from the 2023 flood event in Slovenia reveals that the values for all gauging stations considered are below the regional envelopes. Concurrently, the analysis indicates that a flood event larger than the 2023 event may occur in the future.
1. Introduction
One of the key challenges facing hydrologists today is the estimation of reliable design discharges under variable climatic conditions. Information on reliable design discharges is essential for designing water engineering structures and flood protection measures, reducing flood risks and for successful water management in general [1]. In addition, hydrologists are now confronted with the effects of climate change on design discharges [2,3,4,5]. In recent decades, the frequency of flood events appears to have increased in many parts of the world [3,4,5,6,7,8,9,10]. The importance of defining reliable design discharge values in a changing climate was also highlighted by members of the International Association of Hydrological Sciences (IAHS) [11], which resulted in the establishment of a working group, Hydrologic Design: Solutions and Communications, within the IAHS HELPING decade [1]. Therefore, further investigations need to be conducted to enhance knowledge regarding the design discharge estimation in both gauged and ungauged catchments. While there was a specific IAHS decade dedicated to the predictions in the ungauged basins [12,13,14], the hydrology design standards in the case of gauged catchments are usually less complex and heavily rely on water level and discharge measurements. However, there are still several open questions related to the design discharge estimation in gauged catchments [1,15,16].
The estimation of design discharges is typically based on statistical methods, called flood frequency analysis (FFA). The FFA approach utilizes a probabilistic theory to determine the relationship between the return period and the design value employed in engineering practice [17,18,19,20]. Some previous research has already shown that a single significantly wet year or an above-average flood event can lead to significant changes in the estimated values of design discharges [21]. However, the impact of individual flood events depends on several factors [16]. Changes in the FFA results suggest that some flood protection structures may no longer be effective. These structures were designed to protect against flooding with a specific frequency, but due to the increasing frequency of flood events, they may no longer be able to withstand the same floods. The focus of this study is to evaluate the impact of the extreme August 2023 flood event [22] on the design discharge estimation.
Due to its location, Slovenia has a mixture of temperate continental, Mediterranean and alpine climates, with mean annual precipitation ranging from less than 900 mm in the eastern part of the country to more than 3000 mm in the western part [23]. It is characterized by high spatial and climatic variability and consequently also by large differences in precipitation amounts and intensities [23,24]. Hence, previous research has shown that no uniform change in the Slovenian flood discharge series can be found, and some gauging stations show positive and others negative trends in flood peaks [25]. Furthermore, no geographical pattern could be found in the trends, and no significant dependence on the geographical characteristics of the gauging station was recognized [3,25]. This result aligns with the findings of other researchers, namely that no uniform pattern of increase or decrease in (flood) discharge series can be identified in Europe [5].
An extreme flood event occurred in Slovenia between 4 and 8 August 2023 [26], causing total direct and indirect damages, including post-disaster needs according to the Post-Disaster Needs Assessment (PDNA), amounting to nearly EUR 10 billion [22]. Unusual summer conditions combined with high air- and sea temperatures of the Mediterranean and Adriatic Sea, together with high antecedent soil moisture, are the main causes of the most extreme flood event in Slovenia in recent decades [22,26]. Between 150 and 200 mm of rain fell in 6 to 12 h on catchments with previously wet soils, causing many torrents, small streams and rivers to rise [27]. The result was widespread and devastating flooding. Reconstruction after such a devastating flood event requires the estimation of new values for the design discharges [22].
Therefore, the main objective of this study is the comprehensive evaluation of the influence of the extreme flood of 2023 on the design discharges in Slovenia based on flood frequency analysis. Additionally, we also evaluate the magnitude of the August 2023 flood event by comparing the specific discharges of the event with regional envelope curves obtained based on data of extreme “surprising” floods that have occurred in hydrologically similar catchments elsewhere in Europe. These curves serve as a surrogate for the locally surprising extreme floods that could occur in the catchment of interest in the future [28].
2. Materials and Methods
2.1. Flood Frequency Analysis (FFA)
In order to investigate the main objective of the present study, more than 30 gauging stations in Slovenia were selected for which continuous data sets of measured discharges and thus information on the annual maximum peak discharge (AM) were available for the period 1961–2023 [29]. In total, 33 gauging stations met this condition (Figure 1). Table 1 presents the main characteristics of the selected gauging stations. In order to determine the impact of the 2023 flood peak on the results of the FFA, analyses were performed with and without the 2023 peak discharge, i.e., for the periods 1961–2022 (62 years of data) and 1961–2023 (63 years of data).
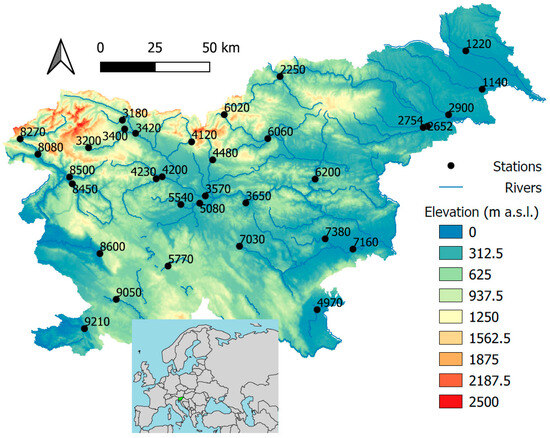
Figure 1.
Location of the selected gauging stations (labeled with station IDs) on the map of Slovenia. Station IDs are shown in Table 1. The map at the bottom of the figure shows the location of Slovenia (highlighted in green) in Europe.

Table 1.
Basic characteristics of the considered gauging stations and corresponding catchments in Slovenia [29].
Eight different theoretical distribution functions were used to perform the FFA:
- Generalized Extreme Value (GEV) distribution;
- Gumbel distribution (GUM);
- Pearson distribution type 3 (P3);
- Log-Pearson distribution type 3 (LP3);
- 3-parameter log-normal distribution (LN3);
- Gamma distribution (GAM);
- Generalized Logistic Distribution (GLO);
- Exponential distribution (EXP).
We selected LN3, P3, LP3, and GUM distributions because they are used by the Slovenian Environment Agency (ARSO). Additionally, we used GEV, GAM, GLO and EXP distributions because they are commonly used in other European countries [30]. The distribution parameters were estimated using the L-moments method [31]. Design discharges were calculated for different return periods, including 10-, 100- and 500-year return periods, which are frequently used for hydrologic design. The best-fitting distribution for each gauging station was selected using the Akaike Information Criterion (AIC), which considers the number of parameters in the distribution as well as the maximum likelihood function. The latter measures how well the statistical model explains the observed data when calculating the goodness-of-fit criterion [32]. The smallest AIC value indicates the best model performance. In general, the AIC performs similarly to some other performance criteria, such as the Bayesian information criterion (BIC) and the Anderson–Darling criterion (ADC). AIC works better for two-parameter distributions, but when the actual distribution comes from a three-parameter family, the AIC (and also the BIC and the ADC) can be less effective [33]. Additionally, some studies have shown that these criteria (e.g., AIC and BIC) cannot accurately capture the true trade-off between model performance and complexity [34]. Nevertheless, these criteria still provide reasonable performance in FFA [33]. For the distribution selected as the best fit according to the AIC, an approximate Kolmogorov–Smirnov test was used to determine whether the selected distribution function adequately described the measured peak discharge data. An approximate Kolmogorov–Smirnov (KS) test was performed by assuming that the distribution parameters are known [35]. The critical value defined by [36] for a fully specified distribution was used to accept or reject the tested distribution at a 0.05 significance level. In addition, confidence intervals were calculated based on Monte Carlo simulations. Calculations were performed using the “lmomco” package [37], which is included in the R software tool 4.3.2 [35].
2.2. Specific Discharge Analysis
Additionally, an analysis of specific discharge values (i.e., peak discharge values divided by the catchment area) for the August 2023 flood event was carried out and a comparison with the regional envelope curves proposed by Bertola et al. [28] was performed.
Bertola et al. [28] derived the specific discharge envelope curves based on the data from over 8000 gauging stations across Europe, with catchment areas ranging from 1 to 800,000 km2. It is worth noting that more than 70 Slovenian gauging stations were also included in this analysis. All the considered catchments were grouped into five hydroclimatic regions, and a regional envelope was defined for each region, representing the relationship between the specific discharge peaks and the catchment area. The envelope represents a curve that has never been exceeded in an individual hydroclimatic region. A description of the methodology applied to derive these regional envelope curves is available in [28]. Bertola et al. [28] showed that extreme floods could be predicted based on large floods that have occurred in the recent past in other European catchments in a specific climate region.
The analysis of specific discharge values for the 2023 flood event was conducted for the same 33 gauging stations (Figure 1 and Table 1) as the FFA. The gauging stations were classified into individual hydroclimatic types according to the climate classification of Slovenia [24]. Furthermore, ARSO classified the Slovenian gauging stations based on seasonal discharge characteristics (i.e., periods of high and low flows determined by average monthly discharge values) using historical data from 1961 to 1990 and clustering analysis [38]. Five discharge regimes were identified: the Mediterranean rain regime, the Pannonian rain–snow regime, the Dinaric rain–snow regime, the Alpine rain–snow regime, and the Alpine snow–rain regime. The discharge stations were classified into these regimes [38]. For this study, a comparison of Slovenian discharge regimes and hydroclimatic regions was conducted.
To provide a broader context for the specific discharge analysis, the Litija gauging station [18] on the Sava River catchment was selected as an additional case study. The goal was to investigate changes in land use and the water balance in the period from 1900 to 2010. The HILDA (HIstoric Land Dynamics Assessment) database [39,40] was used for historic land use information. Additionally, we used measured discharges for the Litija gauging station from ARSO. To estimate precipitation, we used Alpine gridded monthly precipitation from 1871 onwards [41], and for air temperature, we used data from source [42]. The objective was to examine decadal changes in runoff coefficients and land use in the Sava River catchment.
3. Results and Discussion
3.1. Flood Frequency Analysis (FFA)
FFA was performed for 33 gauging stations (Table 1) for two periods: 1961–2022 and 1961–2023. An example of the FFA results for the period 1961–2023 is shown in Figure 2. The best-fitting distribution was selected for each gauging station according to the calculated AIC value. Additionally, an approximate KS test was performed, and according to the results, none of the selected distributions were rejected. The best-fitting distribution for each individual station is presented in Table 2.
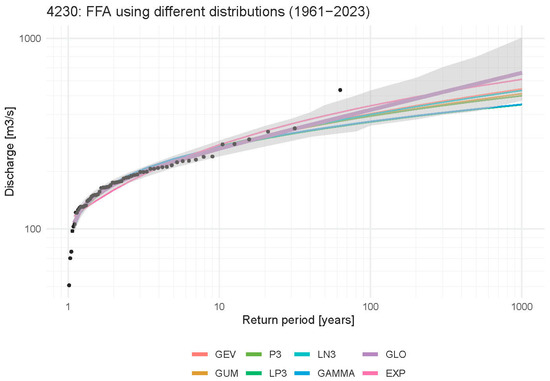
Figure 2.
An example of a graphical representation of the FFA results using different distributions for the gauging station Zminec on the Poljanska Sora River (ID 4230) for the period 1961–2023. The most appropriate distribution according to the AIC is in bold and the corresponding 5% and 95% confidence limits are shaded in gray.

Table 2.
Differences in design discharges between the periods from 1961 to 2023 and from 1961 to 2022, as well as the corresponding best-fitting distribution. Stations where the highest peaks in 2023 were measured in August are in bold.
For the large number of the gauging stations considered (Table 1), the maximum discharge measured fell within the range of discharges, with a return period between 100 and 500 years. The analysis results show that individual peak discharges (i.e., the August 2023 flood event) can significantly impact the FFA results (Table 2). This is consistent with the results of [21], who investigated the influence of the 2014 flood event in Slovenia on FFA results and demonstrated that, in some cases, individual peaks led to significant changes in the estimated design discharges values. In addition, the results of the study demonstrate that, for individual gauging stations, the most extreme events lie outside the FFA confidence intervals (Figure 2). It should be noted that the discharge values are associated with some uncertainties, such as rating curve uncertainty, changes in river cross-sections, or the impact of woody debris and sediment transport on the water level measurements [43]. Hence, in case of extrapolated rating curves and complex cross-sections, the uncertainty for high flows can exceed 40% [43]. However, quantifying the uncertainty requires detailed information about the cross-section and all the historical periodic discharge and water level measurements. ARSO conducts periodic discharge measurements to verify the existing rating curves, and also, during the flood forecasting process, discharge values are regularly verified to detect potentially problematic gauging stations with uncertain discharge estimations (e.g., either due to rating curves or cross-sections) [44,45].
In order to determine the impact of the 2023 flood peak on the FFA results, i.e., design discharges, FFA was performed with and without the 2023 peak. It should be noted that for some stations, the 2023 flood peak was not measured at the time of the August event, but rather in other months (e.g., May, October, November and December). The results of the comparison are presented in Table 2. Despite the aforementioned fact that the 2023 flood peak at some stations was not recorded in August, it can be concluded that the impact of the 2023 flood peak on the design discharge with a 100-year return period is due to an extreme event in August 2023 at almost all gauging stations where it is greater than 5%. The only exception is the Bača pri Modreju gauging station (ID 8500), where the difference in discharge with a 100-year return period is due to a flood event in October 2023. The results demonstrate that, at individual gauging stations, the 2023 event increases the design discharge with a 10-year return period by up to 9%, the discharge with a 100-year return period by up to 33%, and the discharge with a 500-year return period by up to 57%. The average increase was 2%, 5% and 7% for the 10-, 100- and 500-year return periods, respectively. When considering only the gauging stations most affected by the August 2023 flood event (i.e., stations in the Meža, Savinja and Sora River catchments), the average increases were 4%, 10% and 15% for the 10-, 100- and 500-year return periods, respectively (Table 2). The differences in design discharges between the periods from 1961 to 2023 and from 1961 to 2022 for return periods of 10, 100 and 500 years are shown in Figure 3, Figure 4 and Figure 5. This increase is particularly pronounced at the gauging stations in the river catchments most affected by the August 2023 flood, i.e., the Meža, Savinja and Sora River catchments. These gauging stations also experienced return periods greater than 100 years during the 2023 event. Relating the return period of the 2023 event to changes in Q100 reveals relatively strong linear correlation (i.e., R2 > 0.7). This indicates that for events with a return period greater than 50 years, changes in the design discharge values for a 100-year return period can exceed 5%. Therefore, we argue that the design discharge values should be recalculated for flood events with a return period of over 50 years.
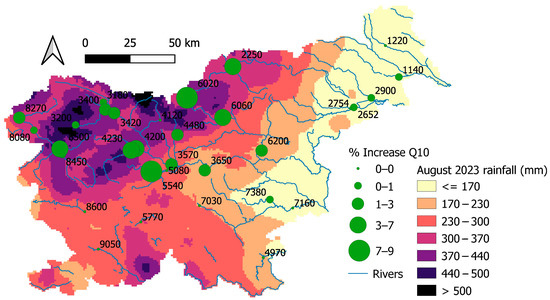
Figure 3.
The differences in the design discharges comparing the 1961–2023 and 1961–2022 periods for a return period of 10 years. Monthly rainfall totals for August 2023 are shown as the background.
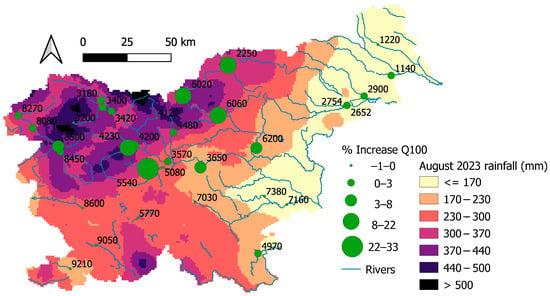
Figure 4.
The differences in the design discharges comparing the 1961–2023 and 1961–2022 periods for a return period of 100 years. Monthly rainfall totals for August 2023 are shown as the background.
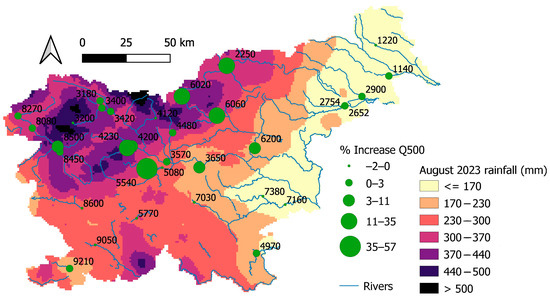
Figure 5.
The differences in the design discharges comparing the 1961–2023 and 1961–2022 periods for a return period of 500 years. Monthly rainfall totals for August 2023 are shown as the background.
3.2. Specific Discharge Values
Analyses of specific discharge values for the year 2023 were conducted for the 33 Slovenian Environment Agency (ARSO) gauging stations for which the FFA was also conducted. Figure 6 shows the results of the calculated specific discharge values of the 2023 flood peaks. Additionally, the envelope and median curves of extreme floods in Europe are also shown [28]. The specific discharge values of the individual gauging stations, according to their estimated hydroclimatic type, are compared to the median and maximum envelope curves [28].
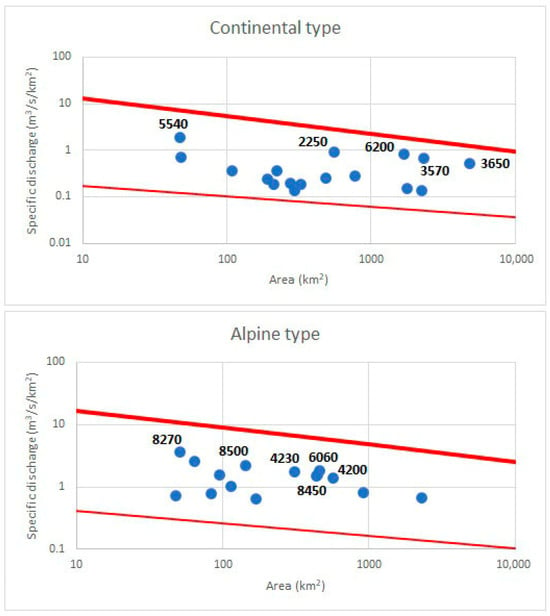
Figure 6.
Specific discharges of the 2023 flood event for gauging stations in two climatic regions, namely continental and Alpine. The regional envelope curves (thick lines) and median regional annual specific flood discharges (thin lines) estimated by [28] are shown in red. The IDs of the gauging stations with the highest specific discharges are added.
As can be seen from the results (Figure 6), the specific peak discharge values for all considered gauging stations fall within the envelope (but above the median) of curves estimated based on the previous extreme floods in similar European catchments of the same hydroclimatic type [28]. The results of the analyses indicate that a flood event larger than the August 2023 flood event may occur in Slovenia in the future, as the envelope for all hydroclimatic types is higher than the specific peak discharge values for the August 2023 flood. These results are consistent with those of [46], who compared the specific peak discharge values for the August 2023 event at selected gauging stations with empirically derived curves proposed by [47] and regional Mediterranean empirical curves developed by [48]. These results suggest that potential, more extreme flood events could occur in Slovenia in the future, indicating that care should be taken when estimating design discharge values, especially considering that the measured precipitation amounts in the most affected areas during the August 2023 event were much lower than the probable maximum precipitation (PMP). For example, the 24 h PMP for Slovenj Gradec (the Meža River catchment) is 410 mm; however, only 146 mm of precipitation fell in Šmartno near Slovenj Gradec during the 2023 flood event. [22].
Additional investigation of the water balance and land use changes at the Litija gauging station on the Sava River reveals that precipitation, discharge and runoff coefficient have all decreased over the past 100 years (Figure 7). On the other hand, an increase in air temperature (i.e., on average 0.13 °C per decade) and potential evapotranspiration has been detected, especially in recent decades [49]. In terms of the land use changes, it is evident that forest cover has increased, mostly due to a decrease in cropland areas (Figure 7). At the same time, an increase in settlement areas has been detected (Figure 7). These changes indicate that the average water availability in Slovenia is decreasing, but the extremes are not. Moreover, the increase in air temperature related to climate change can lead to increased sub-daily precipitation intensity [50], which can in combination with increasing urbanization generate more extreme flooding in the future. Hence, this information, together with empirical flood envelope curves, indicates that larger floods than the one in 2023 could theoretically occur in the future, especially as a result of extreme sub-daily precipitation. One possible solution is to consider the confidence intervals and select the upper-level confidence intervals for the design of the hydrotechnical structures and flood protection measures, especially for important structures such as dams or flood protection measures for cities. However, for less important structures, such as culverts on smaller roads, the use of confidence intervals is less meaningful from a cost perspective.
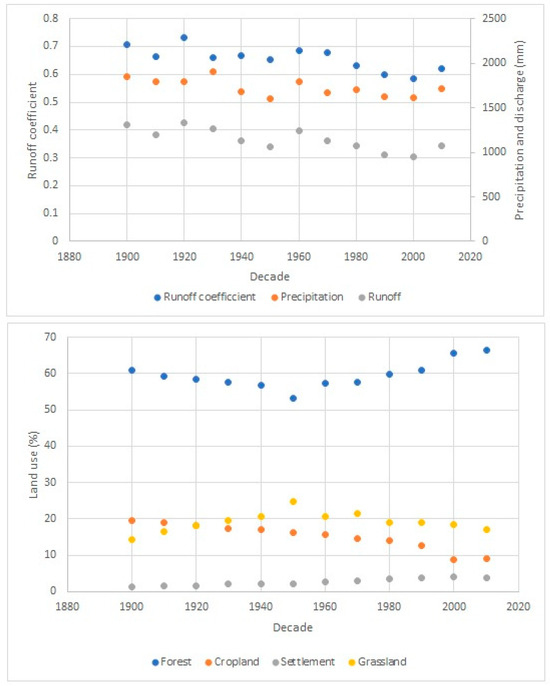
Figure 7.
Changes in the mean precipitation, discharge, and runoff coefficient (upper figure) and land use characteristics (lower figure) for the Litija gauging station on the Sava River.
4. Conclusions
The results of the study show that the impact of just one extreme flood event on the design discharge values can be significant. Therefore, it is necessary to recalculate the design discharge values after each extreme flood event, considering the newly measured discharge values. Therefore, design discharge estimates must be updated regularly, and results from older hydrologic studies should not be used. It would be reasonable to recalculate design discharge values after very wet years (i.e., a flood return period of over 50 years), as even one wet year can significantly impact the relationship between discharge and return period. Additionally, it is sometimes necessary to consider the climate change safety factor, which has not yet been considered in Slovenia.
The results of the study show that it would be reasonable to consider confidence intervals when defining and applying design discharges, especially for important hydrotechnical structures. In fact, for the 32 of the 33 water gauging stations considered, the design discharge values with 100- and 500-year return periods for the period 1961–2023 were within the corresponding confidence limits of the design discharges with 100- and 500-year return periods for the period 1961–2022. The only exception is the Zminec gauging station (ID 4230) on the Poljanska Sora River (Figure 2). This indicates that considering confidence intervals in the design of hydraulic engineering structures could account for extreme events like the one that occurred in Slovenia in August 2023. Additionally, due to the lack of data, the measurement uncertainty could not be quantified, and uncertainty in the high flow discharge values can be significant in some cases [43].
Moreover, analysis of the specific discharge values of the August 2023 flood event shows that the values for all the considered gauging stations fall below the regional envelope estimated by [28] from previous extreme floods in other, similar European catchments of the same hydroclimatic type. This means that the 2023 floods should not have been a surprise if approaches and data had been used across national boundaries (i.e., Europe-wide data). This is not only true for Slovenia; other countries have also been surprised by extreme flood events in the recent years, e.g., Greece in 2023 [9], Spain in 2024 [8], and Bosnia and Herzegovina in 2024 [51]. Moreover, analyses of the specific discharge values of the August 2023 flood event in Slovenia indicate that a larger flood event may occur in the future, as the measured peak discharges in 2023 were in general not even close to the empirical envelopes for the largest floods in Europe, as defined by [28].
Author Contributions
Conceptualization, M.Š. and N.B.; Data curation, M.Š. and N.B.; Formal analysis, M.Š. and N.B.; Investigation, M.Š. and N.B.; Methodology, M.Š. and N.B.; Resources, M.Š. and N.B.; Software, M.Š. and N.B.; Validation, M.Š. and N.B.; Writing—original draft, M.Š. and N.B.; Writing—review and editing, M.Š. and N.B. All authors have read and agreed to the published version of the manuscript.
Funding
This work was supported by the research program P2-0180: “Water Science and Technology and Geotechnical Engineering: Tools and Methods for Process Analyses and Simulations and Development of Technologies”, which is financially supported by the Slovenian Research and Innovation Agency (ARIS). The study was also financially supported by the Slovenian Water Agency and the Slovenian national committee of the IHP UNESCO research program (UNESCO IHP C3330-20-456010).
Data Availability Statement
The data is freely available on the web site of the Environmental Agency of the Republic of Slovenia (ARSO).
Acknowledgments
We wish to thank the Environmental Agency of the Republic of Slovenia (ARSO) for data provision. We thank two anonymous reviewers for their useful and critical comments, which greatly improved this work.
Conflicts of Interest
The authors declare no conflicts of interest.
References
- Fischer, S.; Dallan, E.; Fiori, A.; Grimaldi, S.; Kochanek, K.; Prieto, C.; Reis, D.S.; Volpi, E. Hydrologic Design in the HELPING Decade—Inspiring the Community to Innovate the Hydrologic Design Concept. Hydrol. Sci. J. 2025, 70, 375–389. [Google Scholar] [CrossRef]
- Steirou, E.; Gerlitz, L.; Apel, H.; Sun, X.; Merz, B. Climate Influences on Flood Probabilities across Europe. Hydrol. Earth Syst. Sci. 2019, 23, 1305–1322. [Google Scholar] [CrossRef]
- Šraj, M.; Bezak, N. Comparison of Time Trend- and Precipitation-Informed Models for Assessing Design Discharges in Variable Climate. J. Hydrol. 2020, 589, 125374. [Google Scholar] [CrossRef]
- Blöschl, G.; Gaál, L.; Hall, J.; Kiss, A.; Komma, J.; Nester, T.; Parajka, J.; Perdigão, R.A.P.; Plavcová, L.; Rogger, M.; et al. Increasing River Floods: Fiction or Reality? Wiley Interdiscip. Rev. Water 2015, 2, 329–344. [Google Scholar] [CrossRef] [PubMed]
- Blöschl, G.; Hall, J.; Viglione, A.; Perdigão, R.A.P.; Parajka, J.; Merz, B.; Lun, D.; Arheimer, B.; Aronica, G.T.; Bilibashi, A.; et al. Changing Climate Both Increases and Decreases European River Floods. Nature 2019, 573, 108–111. [Google Scholar] [CrossRef] [PubMed]
- Bonacci, O.; Žaknić-Ćatović, A.; Roje-Bonacci, T. Floods: Emerging Concepts and Persisting Challenges. Acta Hydrotech. 2024, 37, 127–141. [Google Scholar] [CrossRef]
- Gnjato, S.; Leščešen, I.; Basarin, B.; Popov, T. What Is Happening with Frequency and Occurrence of the Maximum River Discharges in Bosnia and Herzegovina? Acta Geogr. Slov. 2024, 64, 129–149. [Google Scholar] [CrossRef]
- WMO Devastating Rainfall Hits Spain in yet Another Flood-Related Disaster. Available online: https://wmo.int/media/news/devastating-rainfall-hits-spain-yet-another-flood-related-disaster (accessed on 7 November 2024).
- He, K.; Yang, Q.; Shen, X.; Dimitriou, E.; Mentzafou, A.; Papadaki, C.; Stoumboudi, M.; Anagnostou, E.N. Brief Communication: Storm Daniel Flood Impact in Greece in 2023: Mapping Crop and Livestock Exposure from Synthetic-Aperture Radar (SAR). Nat. Hazards Earth Syst. Sci. 2024, 24, 2375–2382. [Google Scholar] [CrossRef]
- Wang, Y.; Liu, M.; Xing, Z.; Liu, H.; Song, J.; Hou, Q.; Xu, Y. Study of Nonstationary Flood Frequency Analysis in Songhua River Basin. Water 2023, 15, 3443. [Google Scholar] [CrossRef]
- Arheimer, B.; Cudennec, C.; Castellarin, A.; Grimaldi, S.; Heal, K.V.; Lupton, C.; Sarkar, A.; Tian, F.; Kileshye Onema, J.M.; Archfield, S.; et al. The IAHS Science for Solutions Decade, with Hydrology Engaging Local People IN One Global World (HELPING). Hydrol. Sci. J. 2024, 69, 1417–1435. [Google Scholar] [CrossRef]
- Hrachowitz, M.; Savenije, H.H.G.; Blöschl, G.; McDonnell, J.J.; Sivapalan, M.; Pomeroy, J.W.; Arheimer, B.; Blume, T.; Clark, M.P.; Ehret, U.; et al. A Decade of Predictions in Ungauged Basins (PUB)-a Review. Hydrol. Sci. J. 2013, 58, 1198–1255. [Google Scholar] [CrossRef]
- Blöschl, G.; Sivapalan, M.; Wagener, T.; Viglione, A.; Savenije, H. Runoff Prediction in Ungauged Basins: Synthesis Across Processes, Places and Scales; Cambridge University Press (CUP): Cambridge, UK, 2013; ISBN 9781139235761. [Google Scholar]
- Sivapalan, M.; Takeuchi, K.; Franks, S.W.; Gupta, V.K.; Karambiri, H.; Lakshmi, V.; Liang, X.; Mcdonnell, J.J.; Mendiondo, E.M.; O’connell, P.E.; et al. IAHS Decade on Predictions in Ungauged Basins (PUB), 2003–2012: Shaping an Exciting Future for the Hydrological Sciences. Hydrol. Sci. J. 2003, 48, 857–880. [Google Scholar] [CrossRef]
- Kjeldsen, T.R.; Macdonald, N.; Lang, M.; Mediero, L.; Albuquerque, T.; Bogdanowicz, E.; Brázdil, R.; Castellarin, A.; David, V.; Fleig, A.; et al. Documentary Evidence of Past Floods in Europe and Their Utility in Flood Frequency Estimation. J. Hydrol. 2014, 517, 963–973. [Google Scholar] [CrossRef]
- Strupczewski, W.G.; Kochanek, K.; Bogdanowicz, E. Historical Floods in Flood Frequency Analysis: Is This Game Worth the Candle? J. Hydrol. 2017, 554, 800–816. [Google Scholar] [CrossRef]
- Anghel, C.G.; Ianculescu, D. An In-Depth Statistical Analysis of the Pearson Type III Distribution Behavior in Modeling Extreme and Rare Events. Water 2025, 17, 1539. [Google Scholar] [CrossRef]
- Bezak, N.; Brilly, M.; Šraj, M. Flood Frequency Analyses, Statistical Trends and Seasonality Analyses of Discharge Data: A Case Study of the Litija Station on the Sava River. J. Flood Risk Manag. 2016, 9, 154–168. [Google Scholar] [CrossRef]
- Leščešen, I.; Dolinaj, D. Regional Flood Frequency Analysis of the Pannonian Basin. Water 2019, 11, 193. [Google Scholar] [CrossRef]
- Petrović, A.M.; Leščešen, I.; Radevski, I. Unveiling Torrential Flood Dynamics: A Comprehensive Study of Spatio-Temporal Patterns in the Šumadija Region, Serbia. Water 2024, 16, 991. [Google Scholar] [CrossRef]
- Bezak, N.; Šraj, M.; Mikoš, M. Are high waters that appear every four years really a 100-year flood. Ujma 2015, 29, 318–323. [Google Scholar]
- Bezak, N.; Panagos, P.; Liakos, L.; Mikoš, M. Brief Communication: A First Hydrological Investigation of Extreme August 2023 Floods in Slovenia, Europe. Nat. Hazards Earth Syst. Sci. 2023, 23, 3885–3893. [Google Scholar] [CrossRef]
- Dolšak, D.; Bezak, N.; Šraj, M. Temporal Characteristics of Rainfall Events under Three Climate Types in Slovenia. J. Hydrol. 2016, 541, 1395–1405. [Google Scholar] [CrossRef]
- Ogrin, D.; Repe, B.; Štaut, L.; Svetlin, D.; Ogrin, M. Climate Classification of Slovenia Based on Data from the Period 1991–2020. Dela 2023, 2023, 5–89. [Google Scholar] [CrossRef]
- Oblak, J.; Kobold, M.; Šraj, M. The Influence of Climate Change on Discharge Fluctuations in Slovenian Rivers. Acta Geogr. Slov. 2021, 61, 155–169. [Google Scholar] [CrossRef]
- ARSO. Extreme Floods in Slovenia Between 4th and 8th of August 2023 (Izjemne Poplave v Sloveniji Med 4. in 8. Avgustom 2023); ARSO: Ljubljana, Slovenia, 2023. [Google Scholar]
- ARSO. Torrential Rain and Heavy Precipitation from 3 to 6 August 2023 (Nalivi in Obilne Padavine od 3. do 6. Avgusta 2023); ARSO: Ljubljana, Slovenia, 2023. [Google Scholar]
- Bertola, M.; Blöschl, G.; Bohac, M.; Borga, M.; Castellarin, A.; Chirico, G.B.; Claps, P.; Dallan, E.; Danilovich, I.; Ganora, D.; et al. Megafloods in Europe Can Be Anticipated from Observations in Hydrologically Similar Catchments. Nat. Geosci. 2023, 16, 982–988. [Google Scholar] [CrossRef]
- ARSO. Data on the Highest Annual Values of Discharges for the Gauging Stations in Slovenia. Personal Communication; ARSO: Ljubljana, Slovenia, 2025. [Google Scholar]
- Salinas, J.L.; Castellarin, A.; Viglione, A.; Kohnová, S.; Kjeldsen, T.R. Regional Parent Flood Frequency Distributions in Europe—Part 1: Is the GEV Model Suitable as a Pan-European Parent? Hydrol. Earth Syst. Sci. 2014, 18, 4381–4389. [Google Scholar] [CrossRef]
- Hosking, J.R.M.; Wallis, J.R. Regional Frequency Analysis: An Approach Based on L-Moments; Cambridge University Press: Cambridge, UK, 1997. [Google Scholar]
- Akaike, H. A New Look at the Statistical Model Identification. IEEE Trans. Autom. Contr. 1974, 19, 716–723. [Google Scholar] [CrossRef]
- Laio, F.; Di Baldassarre, G.; Montanari, A. Model Selection Techniques for the Frequency Analysis of Hydrological Extremes. Water Resour. Res. 2009, 45, 7416. [Google Scholar] [CrossRef]
- Schöniger, A.; Wöhling, T.; Samaniego, L.; Nowak, W. Model Selection on Solid Ground: Rigorous Comparison of Nine Ways to Evaluate Bayesian Model Evidence. Water Resour. Res. 2014, 50, 9484–9513. [Google Scholar] [CrossRef] [PubMed]
- R Core Team. R: A Language and Environment for Statistical Computing 2021; R Core Team: Vienna, Austria, 2021. [Google Scholar]
- Stephens, M.A. Tests Based on Edf Statistics. In Goodness-of-Fit Techniques; D’Agostino, R.B., Stephens, M.A., Eds.; Marcel Dekker: New York, NY, USA, 1986; pp. 97–194. [Google Scholar]
- Asquith, W. Package Lmomco 2024. Available online: https://cran.r-project.org/web/packages/lmomco/lmomco.pdf (accessed on 20 November 2024).
- Frantar, P.; Hrvatin, M. Discharge Regimes. In Water Balance of Slovenia 1971–2000; Frantar, P., Ed.; MOP-ARSO: Ljubljana, Slovenija, 2008; pp. 44–50. ISBN 978-961-6024-38-9. [Google Scholar]
- Fuchs, R.; Herold, M.; Verburg, P.H.; Clevers, J.G.P.W. A High-Resolution and Harmonized Model Approach for Reconstructing and Analysing Historic Land Changes in Europe. Biogeosciences 2013, 10, 1543–1559. [Google Scholar] [CrossRef]
- Fuchs, R.; Herold, M.; Verburg, P.H.; Clevers, J.G.P.W.; Eberle, J. Gross Changes in Reconstructions of Historic Land Cover/Use for Europe between 1900 and 2010. Glob. Change Biol. 2015, 21, 299–313. [Google Scholar] [CrossRef] [PubMed]
- Copernicus Climate Change Service, C. D. Store. Alpine Gridded Monthly Precipitation Data since 1871 Derived from In-Situ Observations. Copernicus Climate Change Service (C3S) Climate Data Store (CDS). Available online: https://cds.climate.copernicus.eu/datasets/insitu-gridded-observations-alpine-precipitation?tab=overview (accessed on 14 July 2025).
- HISTALP. Historical Instrumental Climatological Surface Time Series of the Greater Alpine Region. Available online: https://www.zamg.ac.at/histalp/dataset/grid/crsm.php (accessed on 14 July 2025).
- Kiang, J.E.; Gazoorian, C.; McMillan, H.; Coxon, G.; Le Coz, J.; Westerberg, I.K.; Belleville, A.; Sevrez, D.; Sikorska, A.E.; Petersen-Øverleir, A.; et al. A Comparison of Methods for Streamflow Uncertainty Estimation. Water Resour. Res. 2018, 54, 7149–7176. [Google Scholar] [CrossRef]
- Petan, S.; Golob, A.; Moderc, M. Hydrological Forecasting System of the Slovenian Environment Agency. Acta Hydrotech. 2015, 28, 119–131. [Google Scholar]
- Petan, S.; Koprivšek, M. Analysis of Regional River Flows in Slovenia. Acta Hydrotech. 2024, 37, 65–77. [Google Scholar] [CrossRef]
- Mikoš, M.; Bezak, N. Extreme August 2023 Floods in Slovenia—Reconstruction Efforts Explained. In Proceedings of the INTERPRAEVENT 2024: Conference Proceedings; Interpraevent: Vienna, Austria, 2024; pp. 988–992. [Google Scholar]
- Mikoš, M. Flood Hazard in Slovenia and Assessment of Extreme Design Floods. Acta Hydrotech. 2020, 33, 43–59. [Google Scholar] [CrossRef]
- Amponsah, W.; Ayral, P.-A.; Boudevillain, B.; Bouvier, C.; Braud, I.; Brunet, P.; Delrieu, G.; Didon-Lescot, J.-F.; Gaume, E.; Lebouc, L.; et al. Integrated High-Resolution Dataset of High-Intensity European and Mediterranean Flash Floods. Earth Syst. Sci. Data 2018, 10, 1783–1794. [Google Scholar] [CrossRef]
- Ogrin, D. Long-Term Air Temperature Changes in Ljubljana (Slovenia) in Comparison to Trieste (Italy) and Zagreb (Croatia). Maravian Geogr. Rep. 2015, 23, 17–26. [Google Scholar] [CrossRef]
- Guerreiro, S.B.; Fowler, H.J.; Barbero, R.; Westra, S.; Lenderink, G.; Blenkinsop, S.; Lewis, E.; Li, X.-F. Detection of Continental-Scale Intensification of Hourly Rainfall Extremes. Nat. Clim. Change 2018, 8, 803–807. [Google Scholar] [CrossRef]
- ERCC Bosnia and Herzegovina—UCPM Response to Floods. Available online: https://erccportal.jrc.ec.europa.eu/API/ERCC/Maps/DownloadPublicMap?fileN=MainFile&forceDownload=False&contentItemID=5027 (accessed on 7 November 2024).
Disclaimer/Publisher’s Note: The statements, opinions and data contained in all publications are solely those of the individual author(s) and contributor(s) and not of MDPI and/or the editor(s). MDPI and/or the editor(s) disclaim responsibility for any injury to people or property resulting from any ideas, methods, instructions or products referred to in the content. |
© 2025 by the authors. Licensee MDPI, Basel, Switzerland. This article is an open access article distributed under the terms and conditions of the Creative Commons Attribution (CC BY) license (https://creativecommons.org/licenses/by/4.0/).