Article

Hydrochemical Characteristics and Evolution of Underground Brine During Mining Process in Luobei Mining Area of Lop Nur, Northwestern China

1
Geological Institute of China Chemical Geology and Mine Bureau, Beijing 100101, China
2
SDIC Xinjiang Lop Nor Potash Co., Ltd., Hami 839000, China
3
Tianjin Academy of Eco-Environmental Sciences, Tianjin 300110, China
*
Authors to whom correspondence should be addressed.
Water 2025, 17(15), 2192; https://doi.org/10.3390/w17152192
Submission received: 7 June 2025 / Revised: 11 July 2025 / Accepted: 18 July 2025 / Published: 23 July 2025

Abstract

Underground brine as a liquid mineral resource available for development and utilization has attracted widespread attention. However, how the mining process affects the hydrochemical characteristics and evolution of underground brine has yet to be fully understood. Herein, 207 underground brine samples were collected from the Luobei mining area of the Lop Nur region during pre-exploitation (2006), exploitation (2019), and late exploitation (2023) to explore the dynamic change characteristics and evolution mechanisms of the underground brine hydrochemistry using the combination of statistical analysis, spatial interpolation, correlation analysis, and ion ratio analysis. The results indicated that Na+ and Cl were the dominant ionic components in the brine, and their concentrations remained relatively stable throughout the mining process. However, the content of Mg2+ increased gradually during the mining process (increased by 45.08% in the middle stage and 3.09% in the later stage). The elevation in Mg2+ concentration during the mining process could be attributed to the dissolution of Mg-bearing minerals, reverse cation exchange, and mixed recharge. This research furnishes a scientific foundation for a more in-depth comprehension of the disturbance mechanism of brine-mining activities on the groundwater chemical system in the mining area and for the sustainable exploitation of brine resources.

1. Introduction

As a crucial liquid mineral resource, continental underground salt brine has increasingly drawn significant attention in domestic and international research. This type of underground brine is characterized by abundant resources and is endowed with national strategic scarce elements such as potassium (K), magnesium (Mg), boron (B), lithium (Li), and bromine (Br). Consequently, it exhibits substantial development potential and economic advantages, holding broad prospects for development and utilization [1,2]. The study of the formation mechanism of underground brine, which serves as a fundamental theoretical basis for the exploration of brine deposits, has long been a focal point in the geoscience domain. Its investigation not only bears strong indicative value for comprehending the metallogenic regularities of brine and guiding prospecting efforts but also holds vital significance for the scientific assessment and comprehensive development and utilization of underground brine water resources [3].
Owing to their shallow burial depth and relatively recent formation time, the majority of continental underground salt brines have formed since the Quaternary period. The metallogenic mechanisms of continental buried salt brine deposits have been extensively explored by scholars both at home and abroad [4,5]. For example, there are intergranular or pore underground brines in the Chalkhan Salt Lake in the Qaidam Basin of China, the Lop Nur Salt Lake in the Tarim Basin of Xinjiang, the Zabuye Salt Lake in Tibet, the Uyuni Salt Lake in Bolivia, the Atacama Salt Lake in Chile, and the Utah Great Salt Lake in Yinfeng of the United States [6,7,8,9,10]. Several studies concluded that the distribution of terrestrial brine deposits is genetically associated with modern salt lakes or dry salt lakes [11,12]. The concentration of dissolved salts in subsurface brine systems might be influenced by occurrence conditions, runoff path, and its interaction with the surrounding environment [13]. In recent years, the continuous exploitation of underground brine has changed the groundwater flow and environment, further increasing the complexity of the geochemical evolution of regional underground brine [14].
As a highly typical terrestrial underground salt brine deposit, the Luobei depression in Lop Nur developed and formed a world-rare giant glauberite deposit. The intercrystalline brine of glauberite hosts abundant strategic mineral resources, particularly K and Li. At present, Lop Nur has built the world’s largest potassium sulfate (K2SO4) production base, and the brine in the mining area has undergone continuous exploitation [15]. Indeed, the problem of changes in the parameters of the brine storage layer in the Luobei mining area caused by mining has attracted widespread attention [16,17,18,19]. However, the impacts of mining activities on the salt sources and hydrochemical evolution of underground brines in the Luobei mining area remain poorly understood.
Thus, we selected the Luobei depression in the Lop Nur to study the response of underground brine hydrochemical evolution to mining processes from the perspective of the change in Mg2+ concentration based on the hydrochemical data during pre-exploitation (2006), exploitation (2019), and late exploitation (2023). The objectives of this study were to (a) explore the spatial variation of Mg2+ concentration; (b) identify the mechanism underlying the change in Mg2+ content in the brine of the mining area; (c) reveal the hydrochemical evolution of brine induced by mining. This study attempts to provide a scientific foundation for the extraction of underground brine in salt lakes and for the sustainable and efficient comprehensive development and utilization of brine resources.

2. Materials and Methods

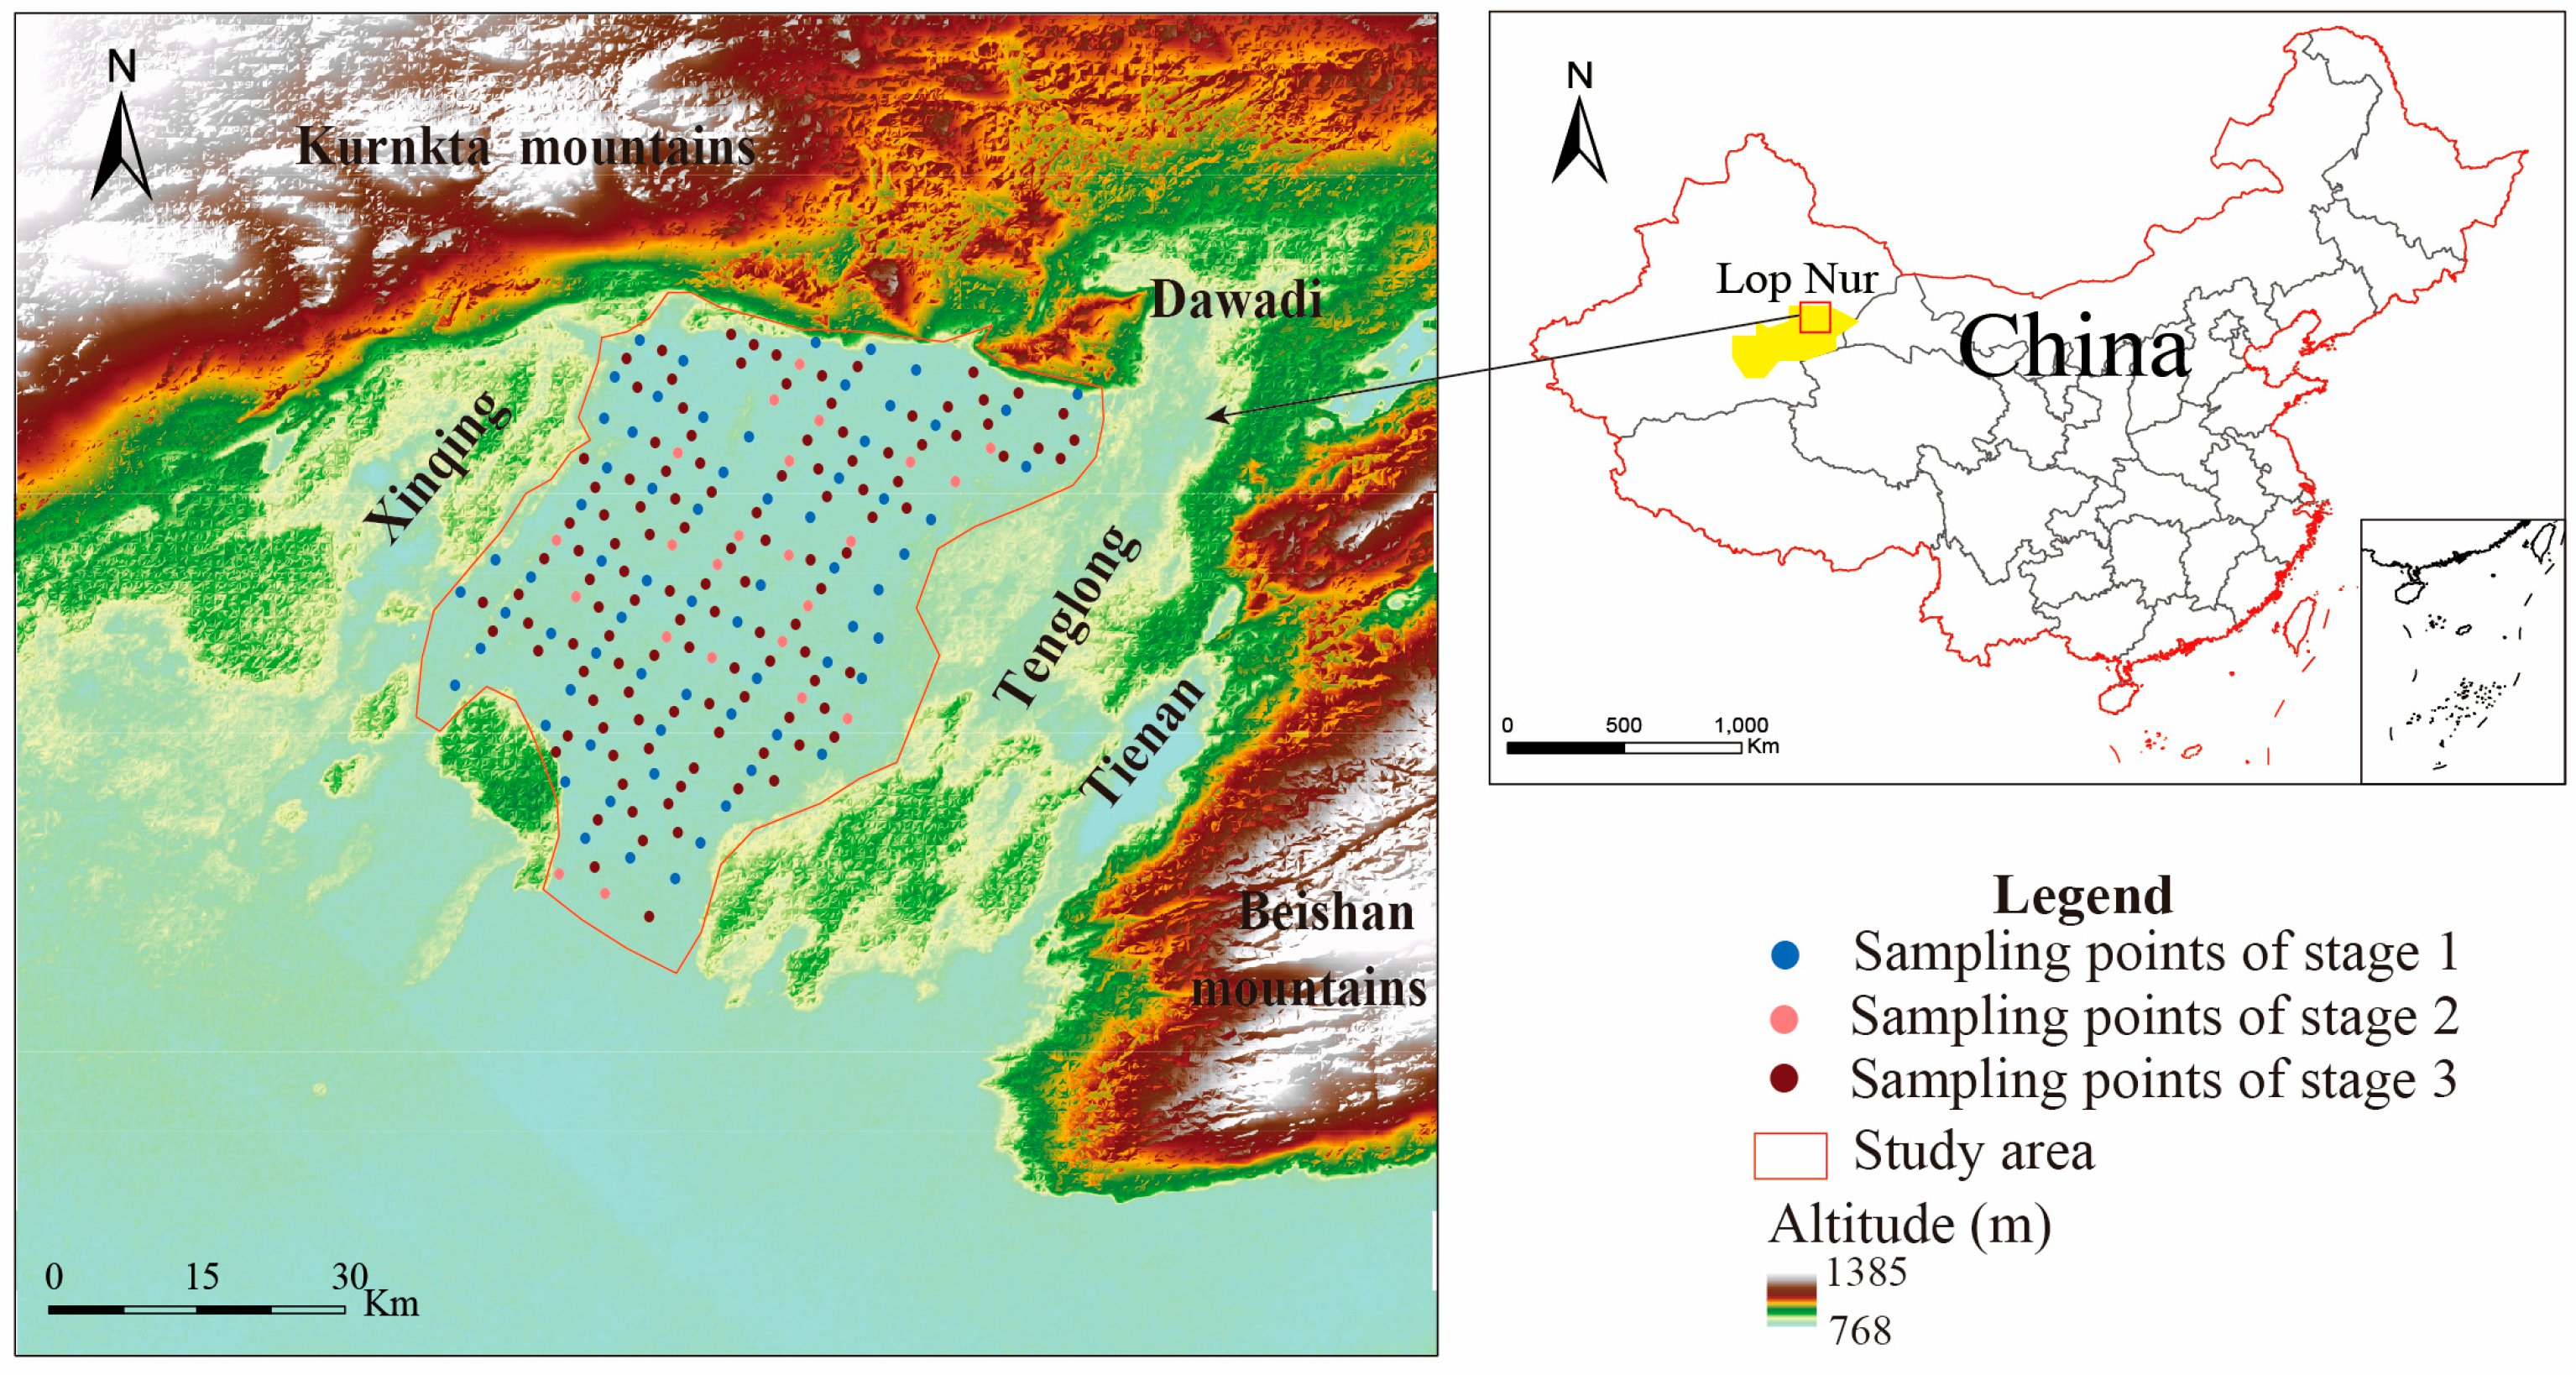
2.1. Overview of the Study Area

The Luobei depression is situated in the northern part of the Lop Nur dry Salt Lake. The overall terrain is flat, with an altitude ranging from 787.82 to 797.18 m, and it represents a lacustrine depression. Affected by tectonic movements, multiple faults have developed within the mining area (Figure S1). The F3 fault is located in the northern part of the Luobei depression, defining its northern boundary. To the north of F3 lies the low mountains and hilly region of the Kuruktag mountains, which extend nearly east–west with an elevation of 1000–1500 m. A series of structural fissures have developed along the F3 fault zone, serving as migration pathways for bedrock fissure water and pore water from the northern Kuruktag mountains into the area [20]. The F4 fault is distributed along the western side of the Luobei depression, marking the boundary between the Luobei depression and the Xinqing platform. It is a tensional normal fault. The F6 fault is distributed along the eastern side of the Luobei depression, defining the boundary between the Luobei depression and the Tenglong platform. The F4 fault exhibits downward movement of its eastern block and upward movement of its western block, while the F6 fault exhibits uplift of its eastern block and subsidence of its western block. This structural configuration has jointly shaped the formation of the Luobei depression, Xinqing platform, and Tenglong platform [21,22]. There are currently no surface water systems in the study area. Influenced by the F3, F4, and F6 faults, the Luobei mining area primarily receives groundwater recharge from bedrock fissure water originating in the Kuruktag mountains and Beishan mountains, as well as groundwater from the Xinqing and Tenglong platforms. The study area is characterized by a typical inland arid climate, with an average annual temperature of 12.5 °C, an average annual precipitation of 13.9 mm, and an average annual evaporation of 4048.00 mm [23].
The internal stratigraphic architecture of the Luobei depression is relatively intricate. The strata exposed in the Luobei mining area consist of Quaternary chemical salts and clastic deposits. The principal salt deposits consist of evaporites such as Glauberite, Gypsum, Halite, Carnallite, and Bloedite. Brine mainly occurs in the intercrystalline of salt substances, mainly intercrystalline brine, partly in fine sand and silt. In accordance with the sedimentary characteristics of the Lop Nur Salt Lake, the brine–bearing layer in the study area can be classified into a phreatic layer (W1) and six confined layers (W2–W7) [24]. The thickness of the unconfined aquifer is generally 5–30 m. The aquifer is mainly composed of glauberite, part of which are Gypsum, Bloedite, and Halite layer. The Glauberite layer of the aquifer has developed karst voids, and the porosity is generally 15–35%. The water abundance is moderately weak or extremely strong. Currently, brine mining encompasses the W1–W4 ore layers, with the W1 phreatic brine ore layer being the main target. Prior to mining, the average depth of the groundwater level in the study area was 1.75 m. As of 2023, the average depth of the groundwater level had reached 13.53 m, and a large–scale depression cone emerged within the study area.

2.2. Sampling and Testing

To investigate the dynamic characteristics of phreatic brine hydrochemistry during the mining process, hydrochemical data from three periods were selected for analysis: the early stage of phreatic brine extraction (2006), the mid–term of phreatic brine extraction (2019), and the late stage of phreatic brine extraction (2023), which were represented by stage 1, stage 2, and stage 3, respectively. There were 68, 23, and 116 hydrochemical data points in the three stages, respectively, with a total of 207 water chemistry data points. The distribution of sampling points is shown in Figure 1.
The hydrochemical data of groundwater in stage 1 were collected from the detailed investigation report of potassium salt mine in Luobei sag, Ruoqiang County, Xinjiang [25]. The remaining samples were collected by stratified and segmented water intake equipment. First, the connection between the lower aquifer and the diving was blocked by an inflatable packer, and then the fresh brine was pumped for 3–5 min to ensure the extraction of fresh brine. All sampling bottles were rinsed 3 to 4 times with the sampled brine. Then, 500 mL was collected for major cation analysis and another 500 mL for major anion analysis, with HNO3 added to the cation analysis samples. All samples were collected in polyethylene bottles without headspace, sealed with paraffin film. All samples were stored at 4 °C and transported to the Central Laboratory of Geology Institute of China Chemical Geology and Mines Bureau [26].
The ion content was determined according to the Analysis Method of Salt and Brine Water. The main cations such as K+, Na+, Ca2+, and Mg2+ and were determined by inductively coupled plasma atomic emission spectrometry (ICP–AES). Cl content was determined via silver nitrate titration, while SO42− content was measured using the barium sulfate gravimetric method. HCO3 was analyzed with an acid-base titration auto-analyzer. Total dissolved solids (TDS) was defined as the sum of ion mass concentrations. Laboratory quality-assurance (QA) and quality-control (QC) methods were used to ensure the quality of the analytical data. At least 2 blank analyses were performed for each batch of samples during the sample testing process. Continuous curve calibration was carried out. The relative deviation between the measured results and the actual concentration value was less than 3%. The relative deviation of parallel samples was analyzed (<10%), and the recovery rate of standard addition was strictly controlled (80–120%). Before analyzing the data, the reliability of the data was tested by the anion–cation equilibrium equation [27].
E ( % ) = Z m c a t i o n s Z m a n i o n s Z m c a t i o n s + Z m a n t i o n s × 100 %
where E denotes the charge balance error (CBE). m c a t i o n and m a n i o n are the molarity of cation and anion, respectively. Z is electric charge of ion. The analysis result is considered reliable if the CBE is within ±10% [28]. In the present study, the charge balance errors of all samples were within ±5%, which was considered an acceptable error for interpretation. The testing results are summarized in Table 1.

2.3. Data Analysis

In this research, the chemical evolution characteristics of the phreatic brine in the Luobei mining area were comprehensively investigated through descriptive analysis, spatial interpolation analysis, ion ratio analysis, and correlation analysis. SPSS 25.0 was employed to conduct statistical analyses on the hydrochemical data, calculating parameters such as the mean and standard deviation. The ion ratio diagrams and box plots were crafted using Origin2024. The ion spatial distribution map was generated by Surfer11 software using Kriging interpolation method. The Spearman correlation matrix diagrams were plotted using the R programming language, and the distribution map of sampling points in the Luobei depression was created with ArcGIS 10.8 software.

3. Results

3.1. Characteristics of Hydrochemical Components in the Luobei Depression

The summary statistics of hydrochemical parameters of groundwater samples in three stages were shown in Table 1. The total dissolved solid (TDS) values of underground brine widely range from 273.5 to 394.19 g/L, with an average content of 356.27 g/L. The main ions in brine samples from the three stages within the Luobei depression show the same abundance order. In terms of cation concentration, the decreasing order is Na+ > Mg2+ > K+ > Ca2+. Among anions, the concentration of Cl is higher than that of SO42−, and the concentration of SO42− is higher than that of HCO3. The concentration of K+ increased slightly from 2006 (9.40 mg/L) to 2019 (9.87 mg/L) and then remained stable in 2023 (9.79 mg/L). In contrast, Cl decreased from 2006 to 2019 (from 179.23 g/L to 170.26 g/L) and then remained stable in 2023 (171.88 g/L). Simultaneously, SO42− and Mg2+ underwent rapid accumulation from 2006 (35.32 g/L and 16.97 g/L) to 2019 (60.76 g/L and 24.62 g/L) and then increased gradually in 2023 (68.11 g/L and 25.38 g/L). Conversely, the contents of Na+ and Ca2+ demonstrated a decreasing trend from 2006 (98.24 g/L and 0.24 g/L) to 2019 (94.14 g/L and 0.15 g/L) and further to 2023 (92.78 g/L and 0.12 g/L).
The hydrochemical characteristics of underground brine in different stages are presented in Figure S2. All samples are located in the lower right corner of the cation triangle and the anion triangle. The brine in stage 1 has a high content of Na+ and Cl, at about 90%, respectively. The hydrochemical type is Cl-Na type. In stage 3, the Na+ content accounts for about 60−75%, the Mg2+ content accounts for about 20−40%, and the SO42− content accounts for about 10−30%, with the hydrochemical type being Cl•SO4-Na type. The sample points in stage 2 are distributed between stage 1 and stage 3, belonging to the transition zone.
The average values and standard deviations of Na+ and Cl in the brine samples were relatively large, while their coefficients of variation were relatively small. This indicates that Na+ and Cl are the dominant ions in the brine, yet their relative contents remain relatively stable. The coefficients of variation of Ca2+, Mg2+, and SO42− are relatively large, signifying that their contents in the brine vary significantly. The correlations among hydrochemical variables were investigated through the correlation analysis (Figure 2). During the mining process, the correlation between Mg2+ and TDS varied significantly across different stages. The correlation coefficient of Mg2+ increased from 0.43 in 2006 to 0.84 in 2019 and then decreased to 0.58 in 2023, indicating that Mg2+ was substantially influenced by brine mining activities and represents a sensitive factor within the brine system. Consequently, Mg2+ can be adopted as a key indicator for studying the evolution of brine in the mining area.

3.2. Temporal and Spatial Variation Characteristics of Mg2+ Concentration in the Luobei Depression

Figure 3 illustrated the changes in the spatial distribution of Mg2+ concentration in the underground brine of the Luobei depression at different stages. As depicted in the figure, the Mg2+ content in the phreatic brine of the study area was relatively low in stage 1, with the Mg2+ content in most areas being less than 18.50 g/L. Brine with Mg2+ concentration exceeding 18.50 g/L was primarily distributed in the eastern and southeastern regions of the study area. In stage 2, the Mg2+ concentration increased remarkably compared with stage 1. The spatial variations in the Mg2+ content were large, and the area with the highest Mg2+ values was found in the central–eastern part of the Luobei depression. The Mg2+ concentration of less than 20.00 mg/L was recorded close to the western boundary area in stage 3; the Mg2+ concentration in most areas ranged from 23.00 to 36.73 mg/L, and only the western boundary and the southeastern corner had concentrations of less than 18.5 g/L. When compared with stage 1 and stage 2, the high–value area of Mg2+ concentration demonstrated a tendency to expand from south to north and from east to west.
In order to test whether the Mg2+ values of different stages in Luobei depression have significant differences, Kruskal–Wallis test was performed on the Mg2+ values of stage 1, stage 2, and stage 3 in different seasons at the significance level of 0.05. As shown in Figure 3, the Mg2+ values of underground brine in stage 3 and stage 2 are significantly higher than those in stage 1 (p < 0.05), suggesting that the brine mining activities significantly affect the Mg2+ content in the phreatic brine.

4. Discussion

4.1. Salt Sources of Underground Brine

The hydrochemical characteristic coefficients serve as crucial tools for unveiling the closure of hydrogeological conditions, the intensity of water–rock interactions, and the evolution laws of formation water [29]. Specific coefficients such as (Na+/Cl), (1000 × K+/Cl), (Ca2+/Mg2+), and [100 × SO42−/(2 × Cl)] can be employed to determine the origin of formation water, the degree of concentration metamorphism, and hydrodynamic conditions [30,31,32].
If the underground brine in a sedimentary basin is sourced from the evaporation of residual seawater, the (Na+/Cl) coefficient is approximately 0.87. When the chemical composition of formation water is predominantly governed by the leaching of halite by meteoric water, the (Na+/Cl) coefficient ranges from 0.87 to 1 or is even higher. Only when the potassium–salt rock is leached, the coefficient value will be relatively low, even down to about 0.87, while dissolution of potassium salt minerals can drive the ratio down to approximately 0.70 [33,34]. The (1000 × K+/Cl) coefficient mainly reflects the enrichment of potassium and the concentration level of underground brine. When the (1000 × K+/Cl) coefficient is less than 75, it indicates that the brine is a leaching brine with a lower degree of concentration [32]. The Ca2+/Mg2+ and [100 × SO42−/(2 × Cl)] coefficients are utilized as significant parameters for characterizing the sealing properties of the formation and the redox environment of the brine. When the Ca2+/Mg2+ coefficient is lower than 3, it implies that the formation has a poor sealing effect and the brine is at a low degree of metamorphism. If the [100 × SO42−/(2 × Cl)] coefficient is close to or higher than 1, it indicates that the reducing capacity of the brine is weak [30].
The (Na+/Cl) coefficient values of the majority of samples were markedly lower than 0.87 (Figure 4a), while some samples exhibited values ranging from 0.87 to above 1. This indicates that the underground brine was influenced by the dissolution of rock salt and was concomitantly accompanied by a certain extent of potassium–salt mineral dissolution. Meanwhile, all the (1000 × K+/Cl) coefficients of the brine were less than 75 (Figure 4b). These values increased with the rise in total dissolved solids (TDS), suggesting that the hydrochemical component of the brine was predominantly governed by halite leaching.
Furthermore, the Ca2+/Mg2+ coefficients of all brine samples were less than 0.05, which decreased with the increase in TDS (Figure 4c), and stage 3 brines showed the lowest Ca2+/Mg2+ compared to stage 1 and stage 2, indicating lower brine metamorphism, possibly due to dissolution of Mg-bearing minerals. Meanwhile, the [100 × SO42−/(2 × Cl)] coefficients of brine were higher than 1.0, and increased with TDS (Figure 4d), the [100 × SO42−/(2 × Cl)] coefficients in stage 3 brines ranged from 4 to 12, suggesting poor formation sealing, implying dissolution of sulfate minerals (e.g., Bloedite) and low desulfurization during brine extraction. In summary, hydrochemical characteristic coefficients indicate that most underground brine in the study area was typical terrestrial-origin dissolved brine, which had undergone prolonged and intense water–rock interactions.

4.2. Water-Rock Interactions

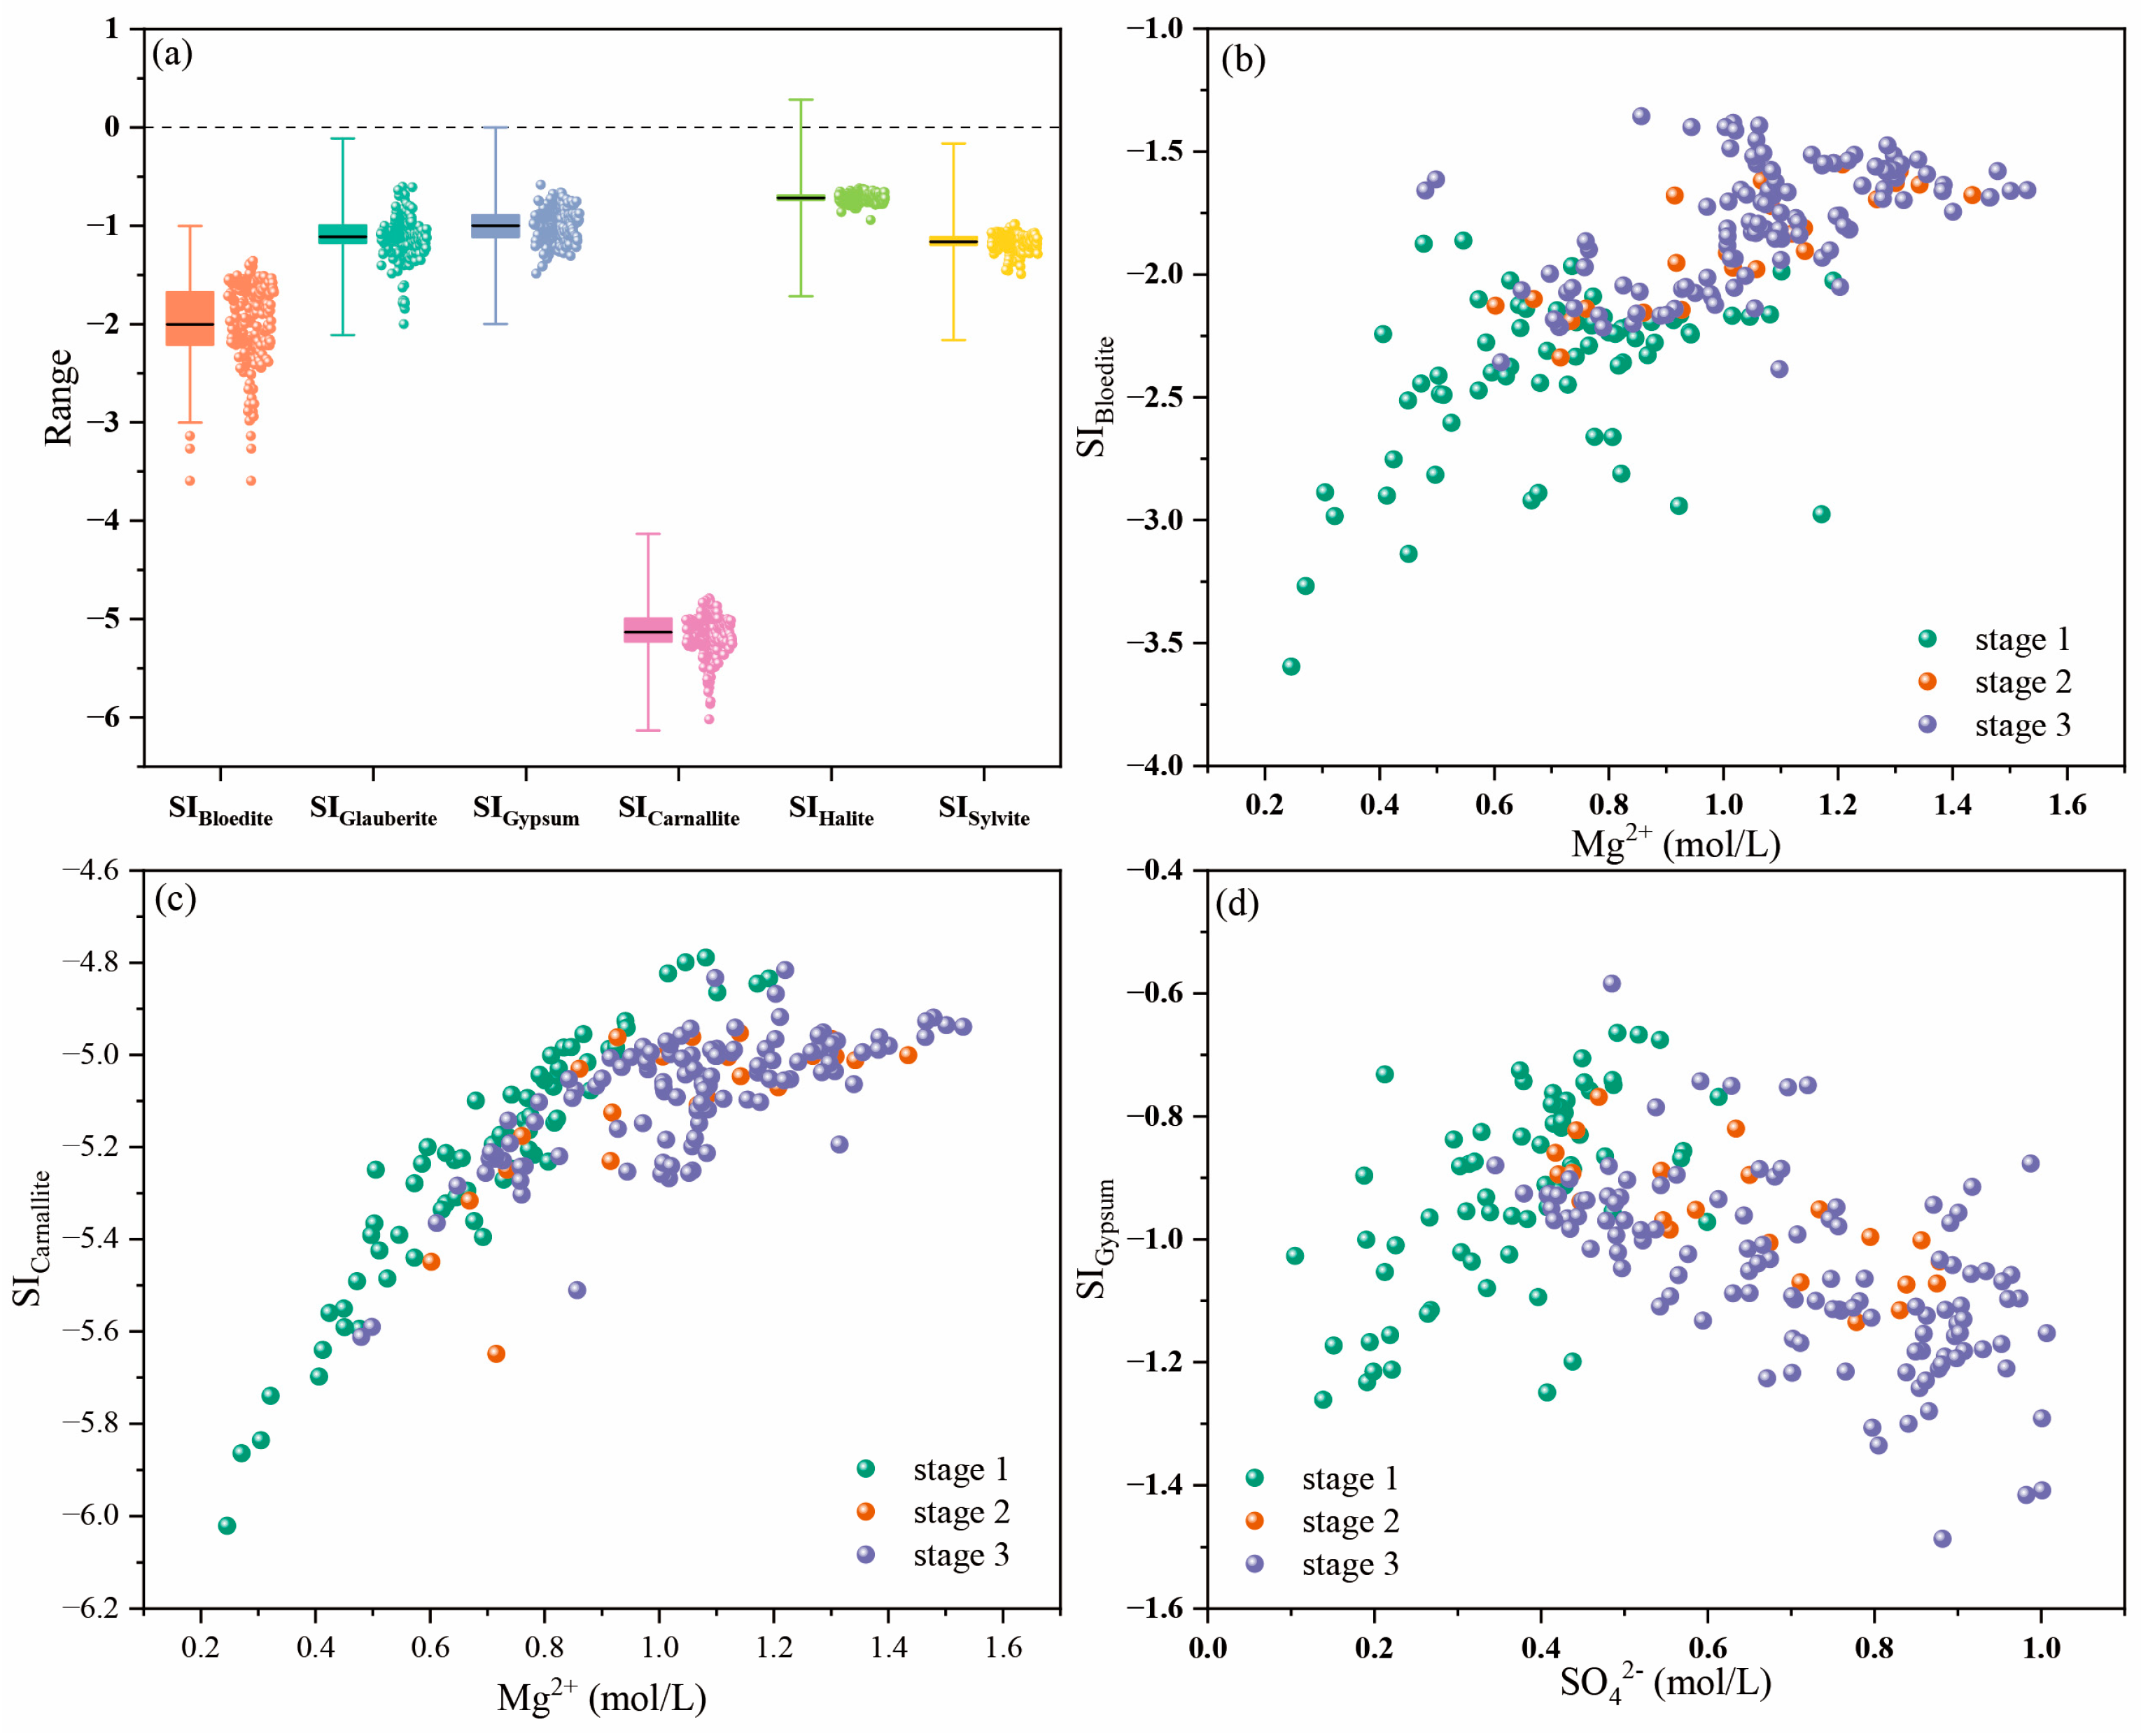
4.2.1. Saturation Index (SI) of Minerals

Mineral dissolution constitutes the primary source of salts during water–rock interactions. Figure 5a depicts the saturation indices (SIs) of the major minerals (Bloedite, Glauberite, Gypsum, Carnallite, Halite, and Sylvite) in the study area, which were calculated using the PHREEQC 3 software [35,36].
As presented in Figure 5a, the saturation indices (SIs) of diverse minerals, specifically Bloedite, Glauberite, Gypsum, Carnallite, Halite, and Sylvite, were all negative. This indicated that all underground brine samples were undersaturated with respect to these minerals, and the soluble components would continue to enter the underground brine through the dissolution of these minerals without being restricted by the mineral equilibrium. The shallow aquifer in the Luobei mining area was composed predominantly of Halite, Glauberite and Gypsum, with Bloedite and Carnallite usually occurring in association with Halite and Glauberite [37]. Figure 5b,c demonstrated that the SI values of Bloedite and Carnallite generally increased in concert with the Mg2+ concentration, reflecting that Mg2+ concentration was influenced by the dissolution of Bloedite and Carnallite. Notwithstanding this tendency, the SIs of Bloedite and Carnallite remained below zero, signifying that both still retained a certain degree of solubility. In terms of the temporal scale, from stage 1 to stage 3, the SI values of Bloedite and Carnallite were highest in stage 3, followed by stage 2, with stage 1 having the lowest values. This reflects that as brine exploitation continues in the mining area, the intensity of groundwater–rock interaction gradually intensifies.
In addition, the SI values of Gypsum for all samples were negative (Figure 5d). In stage 1, the SI values of Gypsum increased with the rising in SO42− content, suggesting that SO42− in the brine primarily derived from Gypsum dissolution. Notably, in stage 2 and stage 3, SI decreased as SO42− levels increased. If Gypsum were the sole or dominant sulfate mineral, elevated SO42− concentrations should have elevated the gypsum SI (approaching or achieving saturation). The observed decline in SI instead indicates that SO42− originated predominantly from dissolution of more soluble sulfate minerals (e.g., Bloedite and Carnallite) rather than Gypsum itself. Dissolution of evaporite minerals such as Bloedite and Carnallite concurrently releases SO42− and Mg2+, further demonstrating that the increase in underground brine Mg2+ content is governed by dissolution of these evaporite phases.

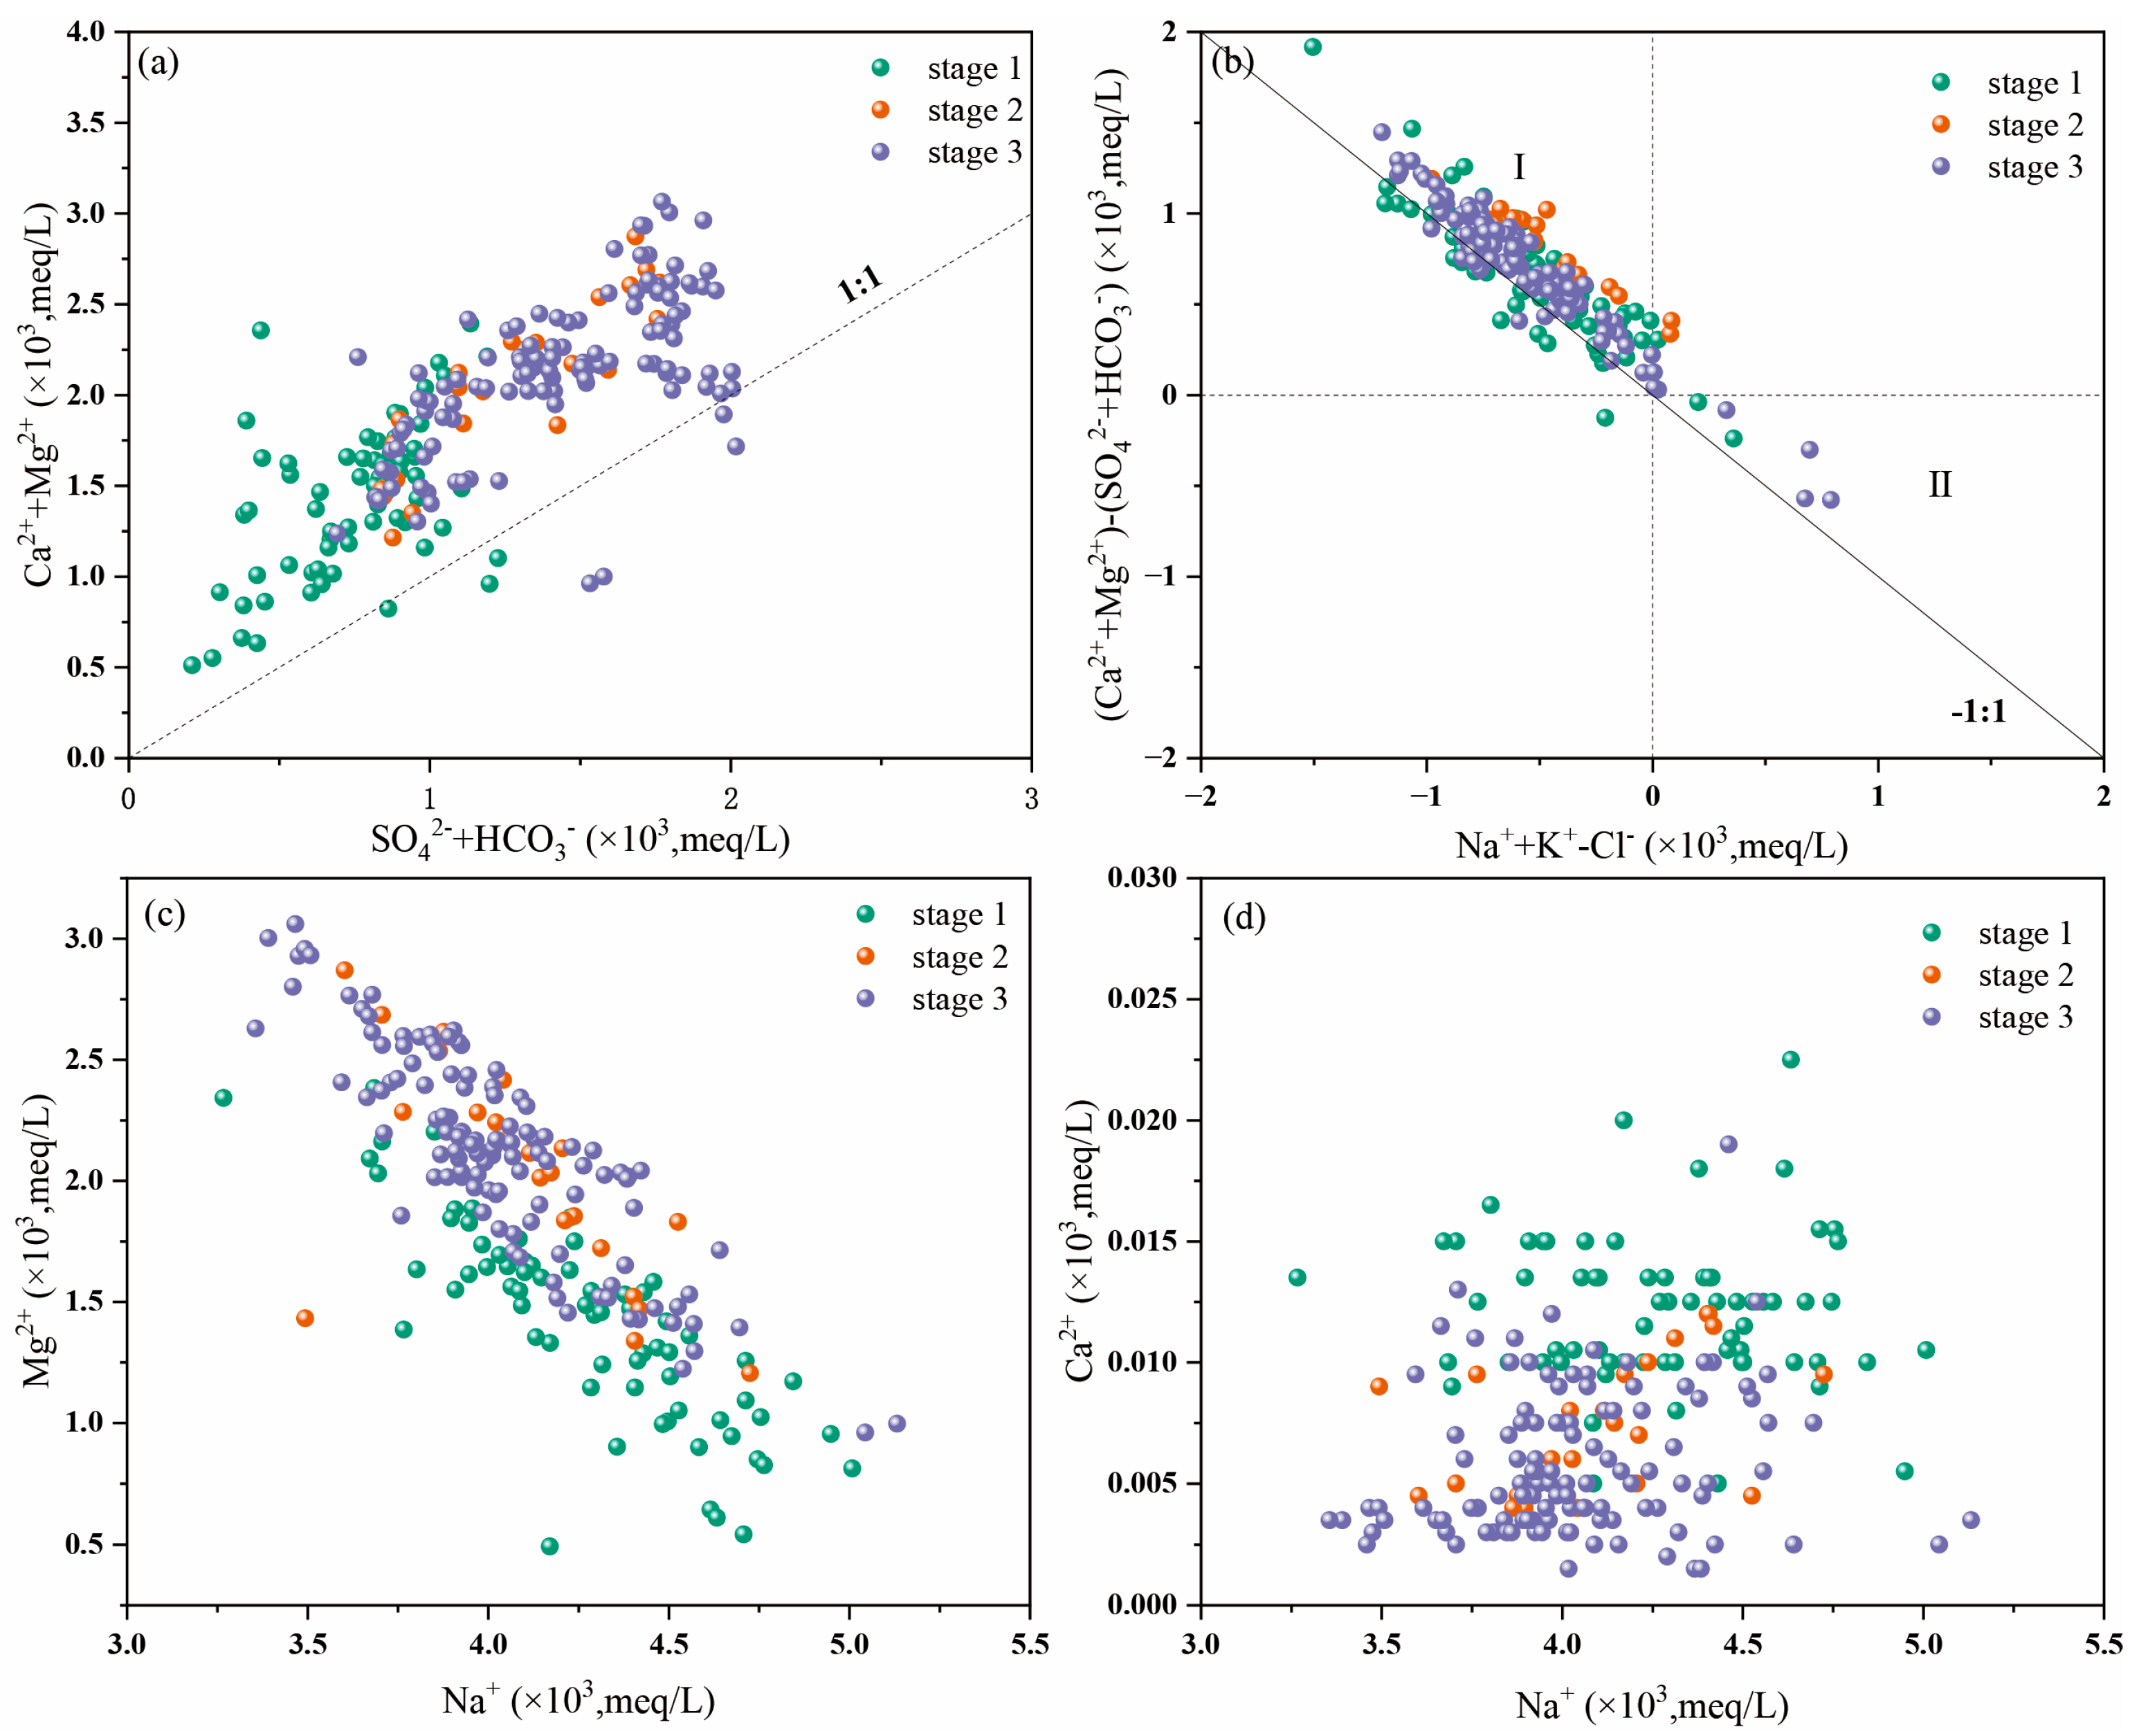
4.2.2. Ratios of Major Ions

The molar ratio of major cations to anions in aqueous systems has been widely employed as a diagnostic parameter for deciphering ion sources and tracking water chemistry evolution [38,39,40]. Specifically, the molar ratio (Ca2+ + Mg2+)/(HCO3 + SO42−) provides critical insights into the relative contributions of evaporite and carbonate lithologies [41]. As shown in Figure 6a, most sample points of (Ca2+ + Mg2+)/(SO42− + HCO3) ratio values at different stages were more than 1, only a few points in stages 1 and stage 3 fell near the 1:1 line, while all other sample points lay above 1:1 line, indicating an excess of (Ca2+ + Mg2+) relative to (SO42− + HCO3). The contents of Ca2+ and HCO3 were extremely low in the underground brines of the Luobei mining area, with their relative abundances accounting for less than 1%. Consequently, Mg2+ was in excess relative to SO42− in most underground brine samples, suggesting that Mg2+ in most underground brine had additional sources beyond the dissolution of evaporite minerals.
Mg2+ concentrations could be affected by reverse cation exchange processes, as described by the reaction: [Ca2+/Mg2+ (solid) + 2Na+/K+ (liquid) = Ca2+/Mg2+(liquid) + Na+/K+ (solid)] [42]. The scatter plot of (Na+ + K+ − Cl) vs. (Ca2+ + Mg2+ − HCO3 − SO42−) was commonly used to identify such exchange; data points near or along the −1:1 line indicated a strong exchange effect. Most points follow this pattern and lie in Area I, suggesting that Ca2+/Mg2+ in the aquifer medium displaces Na+/K+ in the brine (Figure 6b).
Meanwhile, we analyzed the proportional relationships among Mg2+, Ca2+, and Na+. As shown in Figure 6c,d, the molar ratios of Mg2+ to Na+ in the three stages underground brine samples demonstrated approximately consistent values. Overall, Mg2+ content gradually decreased with increasing Na+ concentration. The Ca2+ content in the brine remained relatively low and showed minimal variation across the analyzed Na+ concentration range. These observations indicated that ion exchange occurred between Na+ in the brine and Mg2+ adsorbed onto the main aquifer matrix, which contributed to the elevated Mg2+ concentrations observed during the brine extraction process.

4.2.3. Basinal Fluid Line for Diagenesis

Diagenetic processes such as dolomitization or albitization, along with other water-rock interactions (e.g., halite or gypsum dissolution, Ca-Mg mineral precipitation), can significantly affect the hydrochemical evolution of brine in sedimentary basins, altering the contents of Na+, Ca2+, and Mg2+ [43,44]. Davisson et al. established the linear relationship between Caexcess and Nadeficit in basinal brines in order to clarify significant fluid–rock interaction processes [45]. MacCaffrey et al. proposed to use of the Ca-excess versus Mg-deficit diagram to identify processes such as dolomitization, Mg ion precipitation, and the dissolution of calcite and gypsum [46]. The excess Ca, deficit Na and deficit Mg concentrations, with respect to seawater, were calculated using the following equations [47,48,49]:
Caexcess = [Cameas − (Ca/Cl)SW·Clmeas]·(2/40.08)
Nadeficit = [(Na/Cl)SW·Clmeas − Nameas]·(1/22.99)
Mgdeficit = [(Mg/Cl)SW·Clmeas − Mgmeas]·(2/24.3)
where SW (seawater) and meas (samples concentration) were in mg/L, and Caexcess, Nadeficit and Mgdeficit were in meq/L, respectively. As shown in Figure 7a, most Nadeficit and Caexcess data of the different stages brine in Luobei depression showed the trend of evaporation. Among them, samples with significant Na deficit characteristics in stage 3 displayed a more prominent evaporative trend. The Nadeficit and Caexcess data of intercrystalline brine in Mahai Lake and brine in Kunteyi Salt Lake and gravel-type brine in Mahai Lake revealed that the evolutionary processes of the brine were influenced by evaporative concentration and halite dissolution. Seawater evaporation will result in CaSO4 and CaCO3 attaining saturation. Further evaporation will result in a vertical descent as Ca is precipitated [50]. The Caexcess data of gravel-type brines in the Mahai Lake showed a decreasing trend and were close to the dolomitization zone, indicating that deep–seated water bodies and dolomitization also had an impact on the evolution of groundwater brines [51]. Different from the evolutionary characteristics of intercrystalline brines in the Mahai Salt Lake, the Caexcess of phreatic brines in the Luobei mining area remained stable above the zero horizontal line during the mining process, which suggested that the hydrochemical evolution of the brines was not only controlled by evaporative concentration but also affected by other mixed recharge or other water–rock interactions.
The Caexcess and Mgdeficit of brine were presented in Figure 7b, and most of the sample with Mg deficit were located in the area opposite to the Mg precipitation trend line. Only some data from stage 1 were located at the line of dolomitization or exhibited significant dolomitization trend. In addition, all of the data from stage 3 had lower Mgdeficit (less than 0), followed by stage 2, suggesting that the contents of Mg2+ in brine increased with mining. Combining the results with Figure 5 and Figure 6c, the excess Mg2+ might be caused by the inverse cation exchange adsorption or dissolution of Mg containing minerals in the long evolutionary process.

4.3. Mixing Effect

The contents and interrelationships of the stable isotopes (D and 18O) serve as effective tracers for identifying water origin and hydraulic connection. The isotopes D and 18O of the underground brine in the Tenglong platform and the Luobei mining area were collected (Figure S3) [52]. The δD and δ18O of the underground brine in Tenglong platform were both distributed below the right side of the global meteoric water line (GMWL), indicating that the brine in this area was mainly replenished by meteoric water and had undergone a certain degree of evaporation and concentration. The D and 18O of the underground brine in Luobei mining area were almost at the same horizontal line as those in Tenglong platform, showing an obvious oxygen drift phenomenon, suggesting that during the runoff and discharge process of underground brine from Tenglong platform to Luobei mining area, the underground brine had undergone oxygen isotope exchange reaction with surrounding rocks, leading to the enrichment of 18O in the underground brine of Luobei mining area. Additionally, 87Sr/86Sr was not fractionated by physical and chemical processes, which could effectively identify the material source [53,54]. The 87Sr/86Sr of underground brine in the Tenglong platform ranged from 0.70939 to 0.71051, and the average value was 0.71015. The 87Sr/86Sr of underground brines in Luobei mining area spanned 0.71044 to 0.7108, with an average of 0.71066. The 87Sr/86Sr of the Tenglong platform and Luobei mining area were relatively close, indicating that they had similar sources (Table S1) [55].
Following nearly 20 years of mining activities, the water table of the phreatic brine aquifer has experienced a continuous decline. The groundwater contour maps for different mining periods were plotted (Figure S4). During stage 1, the groundwater level in the Luobei mining area was relatively high, generally ranging from 785.81 to 787.17 m. The groundwater level showed a north–south gradient with a gentle hydraulic slope, and the groundwater flow direction was primarily from north to south with slow runoff. In stage 2, influenced by brine extraction in the mining area, the groundwater level generally decreased to 769–785 m, forming a drawdown cone in the central-eastern part of the mining area. The groundwater flow direction shifted to southwest–northeast. By stage 3, the groundwater level in the Luobei mining area continued to decline, ranging from 758 to 785 m, with the expansion of the drawdown cone area. Groundwater converged toward the center of the drawdown cone from all directions. As indicated in Figure 1, the Tenglong Platform was located in the eastern part of the Luobei mining area, close to the center of the drawdown cone. The groundwater recharge during brine extraction in the Luobei mining area mainly originated from the eastern part of the mining area (Tenglong platform and Tienan Fault depression). Furthermore, the underground brine in the Luobei mining area was exploited through commingled production. The brine production wells penetrated the phreatic aquifer, allowing the underlying confined brine to migrate into the phreatic aquifer via these production wells. Table 2 showed that the Mg2+ concentration in the groundwater of the Tenglong platform and Tienan Fault depression was relatively high [56]. Moreover, the spatial distribution of high Mg2+ concentration areas in the Luobei mining area coincided with the distribution of groundwater drawdown cones, indicating that the increase in Mg2+ concentration in the mining area’s underground brine was affected by the groundwater recharge from the Tenglong platform and Tienan Fault depression.

4.4. Evolution of Brine and Indicative Implications

Combined with the above results, the underground brine in the Luobei mining area was mainly affected by water–rock interaction (dissolution of evaporite minerals) and recharge from external water sources (groundwater with high Mg2+ and SO42− from the Tenglong Platform, Tienan Fault depression, and Confined brine in Luobei depression) during the exploitation process. A conceptual model for the dynamic evolution of underground brine in the Luobei mining area had been proposed (Figure 8). Continuous exploitation led to the formation of a large–scale depression cone in the phreatic water level of the Luobei mining area. The accelerated movement of underground brine, on one hand, promoted the migration of fine–grained materials in the aquifer, thereby increasing the effective porosity; on the other hand, it accelerated the breaking of the natural water–salt dynamic balance of the underground brine system, resulting in changes in the dissolution–precipitation process of salt minerals. Among them, the dissolution of some soluble salts (such as Halite and Bloedite) directly expanded the pore space of the reservoir, which caused obvious land subsidence near some brine production wells.
At present, the problem of changes in the parameters of the brine–bearing layer in the Luobei mining area caused by mining had attracted widespread attention. However, previous studies had paid little attention to the dynamic changes and evolution of the hydrochemistry of underground brine in the mining area caused by large–scale exploitation activities [57]. In fact, the changes in ion content in brine were of great significance to the industrial exploitation of brine. For example, the Mg/Li ratio was a key indicator for evaluating the economic efficiency of lithium extraction from brine. A high Mg/Li ratio would seriously affect the extraction of Li; at the same time, the content of Mg2+ in underground brine would also affect the flotation process of KCl in sulfate–type salt lakes. The increase in Mg2+ content in underground brine would directly lead to an increase in the cost of lithium and potassium extraction.
In view of this, this study, from the perspective of changes in Mg2+ concentration, revealed the response of the hydrochemical evolution of underground brine to the exploitation process, and analyzed the controlling factors of Mg2+ evolution in the underground brine of the Luobei mining area. The results of this study would help provide a scientific basis for the rational exploitation of underground brine in salt lakes and the sustainable, efficient, and comprehensive development and utilization of brine resources.

5. Conclusions

Over a period of nearly two decades of mining activities, the hydrochemical composition of the phreatic brine in the Luobei mining area has undergone substantial alterations. Relying on groundwater hydrochemical data from three distinct periods (2006, 2019, and 2023), this study utilized statistical analysis, correlation analysis, and ion ratio analysis to characterize the hydrochemical evolution under continuous large–scale mining, drawing the following conclusions.
  • The ionic composition of the Luobei phreatic brine was predominantly characterized by Na+ and Cl, with SO42−, Mg2+, and K+ following in sequence. During the mining process, the Mg2+ concentrations have been gradually increasing, and the correlation coefficient between Mg2+ and total dissolved solids (TDS) has changed significantly. This indicated that the content of Mg2+ has been markedly influenced by environmental changes. Consequently, Mg2+ was identified as a crucial indicator for analyzing hydrochemical evolution.
  • The findings regarding the spatial distribution characteristics of Mg2+ concentration reveal that from stage 1 to stage 3, the high-value area of Mg2+ concentration within the mining area has gradually migrated from its original southern location towards the east. Moreover, with the ongoing exploitation of brine, the high–value area of Mg2+ concentration has gradually expanded from the east towards the central part of the mining area.
  • There were three primary factors contributing to the increase in Mg2+ concentration within the mining area. Firstly, the brine in the mining area has undergone long–term dissolution and evaporation-concentration processes. The dissolution of magnesium–bearing minerals has augmented the Mg2+ content in the brine. Secondly, reverse cation exchange has occurred, where in Na+ in the brine displaces Mg2+ in the aquifer medium, leading to elevated Mg2+ levels. Thirdly, brine mining has accelerated the flow of groundwater in the mining area and simultaneously intensified the recharge of peripheral groundwater to the mining area. The mixed recharge of groundwater rich in Mg2+ from the Tenglong Platform, Tienan fault depression and confined brine in Luobei depression was also one of the contributing factors to the increase in Mg2+ content in the mining area.
  • The increase in Mg2+ content in underground brine significantly restricts the extraction processes of potassium (K) and lithium (Li) from the brine. In view of this, it is suggested that during the brine extraction operation, real-time dynamic monitoring of Mg2+ concentration in underground brine should be conducted, so as to provide scientific support for the rational and efficient utilization of underground brine resources.

Supplementary Materials

The following supporting information can be downloaded at: https://www.mdpi.com/article/10.3390/w17152192/s1, Figure S1: Simplified geological map of Lop Nur Basin; Figure S2: Piper triangle phase diagram of underground brine in the Luobei depression; Figure S3: Relationship between δD and δ18O values underground brine in the Luobei depression and Tenglong Platform; Figure S4: Groundwater contour map of Luobei mining area in different mining stages; Table S1: The 87Sr/86Sr of underground brines in Luobei mining and Tenglong platform.

Author Contributions

Conceptualization, X.H. and Y.D.; methodology, X.H. and L.W. (Lingfen Wang); software, X.H. and H.G.; validation, X.H. and L.Z.; formal analysis, X.H. and J.Z.; investigation, X.H., Z.Z., Z.L. and M.W.; resources, J.Z. and Y.D.; data curation, X.H.; writing—original draft preparation, X.H.; writing—review and editing, Y.D. and J.Z.; visualization, X.S.; supervision, Y.D.; project administration, L.W. (Lei Wang); funding acquisition, Y.D. All authors have read and agreed to the published version of the manuscript.

Funding

This research was funded by Young Elite Scientists Sponsorship Program by CAST (2023QNRC001), National Science and Technology Major Project (2024ZD1002004).

Data Availability Statement

The data presented in this study are available on request from the corresponding author.

Acknowledgments

The authors gratefully acknowledge the editor and anonymous reviewers for their valuable comments on this manuscript. The authors also appreciate the financial support from the different organizations.

Conflicts of Interest

Authors Liangliang Zhao and Zhongjian Liu were employed by SDIC Xinjiang Lop Nor Potash Co., Ltd. The remaining authors declare that the research was conducted in the absence of any commercial or financial relationships that could be construed as a potential conflict of interest.

References

  1. Jiang, W.J.; Sheng, Y.Z.; Wang, G.C.; Shi, Z.M.; Liu, F.T.; Zhang, J.; Chen, D.L. Cl, Br, B, Li, and noble gases isotopes to study the origin and evolution of deep groundwater in sedimentary basins, a review. Environ. Chem. Lett. 2022, 20, 1497–1528. [Google Scholar] [CrossRef]
  2. Fan, Q.S.; Lowenstein, T.K.; Wei, H.C.; Yuan, Q.; Qin, Z.J.; Shan, F.S.; Ma, H.Z. Sr isotope and major ion compositional evidence for formation of Qarhan salt lake, western China. Chem. Geol. 2018, 497, 128–145. [Google Scholar] [CrossRef]
  3. Zheng, M.P.; Zhang, Y.S.; Liu, X.F.; Qi, W.; Kong, F.J.; Nie, Z.; Pu, L.Z.; Hou, X.H.; Wang, H.L.; Zhang, Z.; et al. Progress and prospect of salt lake research in China. Acta Geol. Sin. 2016, 90, 2123–2166. [Google Scholar] [CrossRef]
  4. Zhang, X.R.; Fan, Q.S.; Li, Q.K.; Du, Y.S.; Qin, Z.; Wei, H.C.; Shan, F. The Source, Distribution, and Sedimentary Pattern of K-Rich Brines in the Qaidam Basin, Western China. Minerals 2019, 9, 655. [Google Scholar] [CrossRef]
  5. Liu, C.L.; Jiao, P.C.; Sun, X.H.; Lu, F.L.; Zhang, H. Research on potash forming and exploration progress in potash deposits in the Lop Nur Salt Lake. Acta Geol. Sin. 2018, 92, 1551–1570. [Google Scholar]
  6. Wang, K.; Zhang, Y.; Han, J.; Ma, L.; Zheng, M.; Wu, Y.; Yang, B. Distribution and Genesis of Potassium-Bearing Minerals in Lop Nor Playa, Xinjiang, China. Minerals 2023, 13, 560. [Google Scholar] [CrossRef]
  7. Liu, X.F.; Zheng, M.P.; Qi, W. Sources of Ore-Forming Materials of the Superlarge B and Li Deposit in Zabuye Salt Lake, Tibet, China. Acta Geol. Sin. 2007, 81, 1709–1715. [Google Scholar]
  8. Nie, Z.; Bu, L.Z.; Zheng, M.P. Lithium Resources Industrialization of Salt Lakes in China: A Case Study of the Xitaijinaier Salt Lake and the Zabuye Salt Lake. Acta Geosci. Sin. 2010, 31, 95–101. [Google Scholar]
  9. François, R.; Bertrand, F. Bromine geochemistry of salar de Uyuni and deeper salt crusts, Central Altiplano, Bolivia. Chem. Geol. 2000, 167, 373–392. [Google Scholar] [CrossRef]
  10. Oehlert, A.M. Physical, chemical, and microbial feedbacks controlling brine geochemistry and lake morphology in polyextreme salar environments. Sci. Total Environ. 2022, 836, 155378. [Google Scholar] [CrossRef] [PubMed]
  11. Sun, X.H.; Liu, C.L.; Jiao, P.C.; Yan, H.; Chen, Y.Z.; Ma, L.C.; Zhang, Y.M.; Wang, C.L.; Li, W.X. A further discussion on genesis of potassium-rich brine in Lop Nur: Evaporating experiments for brine in gypsum-bearing clastic strata. Miner. Depos. 2016, 35, 1190–1204. [Google Scholar]
  12. Liu, C.L.; Wang, M.L.; Jiao, P.C.; Chen, Y.Z. The probing of regularity and controlling factors of potash deposits distribution in Lop Nur salt lake, Xinjiang. Acta Geosci. Sin. 2009, 30, 796–802. [Google Scholar]
  13. Hu, S.; Zhao, Q.; Wang, G.; Zhang, J.; Feng, J. Hydrochemical Dynamic Characteristics and Evolution of Underground Brine in the Mahai Salt Lake of the Qaidam Basin Qinghai-Tibet Plateau. Acta Geol. Sin-Engl. 2018, 92, 1981–1990. [Google Scholar] [CrossRef]
  14. Zhao, Y.J.; Hu, S.Y.; Zhao, Q.S.; Li, B.; Lu, L.J. Hydrochemical evolution characteristics of underground brine in Mahai Salt Lake under mining conditions. World Geol. 2019, 39, 693–699. [Google Scholar]
  15. Zhang, H.; Jiao, P.C.; Liu, C.L.; Yan, H.; Zhang, F.K.; Li, W.X.; Yu, Y.M.; Wang, L.S.; Hu, Y.F.; Wang, L.C.; et al. Discovery of the Ca-Cl type brine in deep aquifers and implications for the shallow giant glauberite deposits in the Lop Nur playa, Tarim Basin, NW China. China Geol. 2021, 04, 364–366. [Google Scholar] [CrossRef]
  16. Li, W.X.; Zhao, L.L.; Ma, B.C. Study on dynamic characteristics and influencing factorsof potassium brine in Lop Nor salt lake. Geol. Chem. Miner. 2017, 39, 163–167. [Google Scholar]
  17. Han, G.; Han, J.B.; Liu, J.B.; Hou, X.H.; Chen, J.N.; Cao, Y.Z. Variation characteristics of LiCl deposit under condition of mining in East Taijnar Salt Lake, Qaidam Basin. Inorg. Chem. Ind. 2020, 12, 17–22. [Google Scholar]
  18. Ma, H.K.; Han, J.B.; Wang, J.P. Study on driving factors for changes in the subsidence funnel area of brine-bearing layers in the eastern mining area of the Qarhan salt lake. J. Salt Lake Res. 2025, 33, 29–34. [Google Scholar] [CrossRef]
  19. Kong, Z.H.; Wang, G.C.; Li, Q.Y.; Zhao, Q.S.; Hu, S.Y.; Lu, L.J. Dynamic characteristics and evolution laws of underground brine in Mahai salt lake of Qaidam Basin during mining process. Sci. Rep. 2024, 01, 10778. [Google Scholar] [CrossRef] [PubMed]
  20. Han, F.F.; Shi, D.Y.; Sun, Z.W. Brif Introduction on Structure and Water Control in Northern Lop Nur, Xinjiang. West-China Explor. Eng. 2013, 25, 174–176. [Google Scholar]
  21. Li, B.Y.; Zhang, F.K.; Deng, Y.F.; Yu, Y.M.; Dong, L.B.; Li, W.X.; Wang, L.F.; Ma, B.C. Geological Characteristics and Genesis of the Solid Potash Salt Deposit in the NO.3 Fault Depression Zone in Northwest Lop Nur. J. Salt Lake Res. 2022, 30, 63–71. [Google Scholar]
  22. Wang, K.; Sun, M.G.; Ma, L.C.; Tang, Q.F.; Yan, H.; Zhang, Y. Spatial variability in the geochemical characteristics of the k-rich brines in the Lop Nor. Acta Geol. Sin. 2020, 94, 1183–1191. [Google Scholar]
  23. Xu, H. Distribution Characteristics of the Main Ions in Luobei Area of Lop Nur Salt Lake. Master’s Thesis, Qingdao University, Qingdao, China, 2013. [Google Scholar]
  24. Ma, L.C.; Wang, K.; Zhang, Y.; Tang, Q.F.; Sun, M.G. Abnormal Enrichment Mechanism of Potassium-Rich Brine Deposit in Lop Nor Basin of Xinjiang. Earth Sci. Rev. 2022, 47, 72–81. [Google Scholar]
  25. Gu, X.L.; Bai, M.; Huang, F.X.; Li, M.; Lv, G.H.; Tang, P.H.; Han, F.F.; Ding, G.F.; Xu, M.; Bian, T.Z.; et al. Xinjiang Ruoqiang County Luobei Concave Potash Mine Detailed Investigation Report; Ruoqiang County Natural Resources Bureau, Bayingolin Mongol Autonomous Prefecture: Ruoqiang, China, 2006. [Google Scholar]
  26. Gao, Z.P.; Weng, H.C.; Guo, H.M. Unraveling influences of nitrogen cycling on arsenic enrichment in groundwater from the Hetao Basin using geochemical and multi-isotopic approaches. J. Hydrol. 2021, 595, 125981. [Google Scholar] [CrossRef]
  27. Nordstrom, D.K.; Ball, J.W.; Donahoe, R.J. Groundwater chemistry and water-rock interactions at Stripa. Geochim. Cosmochim. Acta 1989, 53, 1727–1740. [Google Scholar] [CrossRef]
  28. Mao, H.R.; Wang, G.C.; Rao, Z.; Liao, F.; Shi, Z.M.; Huang, X.J.; Chen, X.L.; Yang, Y. Deciphering spatial pattern of groundwater chemistry and nitrogen pollution in Poyang Lake Basin (eastern China) using self-organizing map and multivariate statistics. J. Clean. Prod. 2021, 329, 0959–6526. [Google Scholar] [CrossRef]
  29. Zhou, X.; Wang, X.C.; Han, J.J.; Cao, Q.; Jiang, C.L.; Guo, J.; Zhou, H.Y. Evolution of the Subsurface K-Rich Brines in the Triassic Carbonates in the Sichuan Basin of China. Groundwater 2018, 56, 832–843. [Google Scholar] [CrossRef] [PubMed]
  30. Jiang, W.J.; Sheng, Y.Z.; Shi, Z.M.; Guo, H.M.; Chen, X.L.; Mao, H.R.; Liu, F.T.; Ning, H.; Liu, N.N.; Wang, G.C. Hydrogeochemical characteristics and evolution of formation water in the continental sedimentary basin: A case study in the Qaidam Basin, China. Sci. Total Environ. 2024, 957, 177672. [Google Scholar] [CrossRef] [PubMed]
  31. Fan, Q.S.; Ma, H.Z.; Tan, H.B.; Xu, X.J.; Li, W.T. Characteristics and origin of brines in western aidam Basin. Geochimica 2007, 36, 633–637. [Google Scholar]
  32. Ma, Z.M. Geochemical Characteristics and Genesis of Brine from Hadahexiu Salt Lake. Master’s Thesis, University of Chinese Academy of Sciences, Beijing, China, 2020. [Google Scholar]
  33. Li, J.S.; Li, T.W.; Peng, X.M.; Han, Y.H.; Li, Z.P.; Ma, H.Z. Hydrogeochemical behaviors of oilfield water in the Tertiary in western Qaidam Basin. Oil Gas Geol. 2014, 35, 50–55. [Google Scholar]
  34. Han, X.; Zhang, F.K.; Li, B.Y.; Deng, Y.F.; Wang, L.F.; Yu, Y.M.; Li, W.X.; Li, X.N. Study on the spatial distribution and enrichment regularity of lithium and boron in potassium-rich brine in Luobei depression. J. Salt Lake Res. 2024, 32, 45–53. [Google Scholar]
  35. Qu, S.; Zhao, Y.Z.; Zhang, K.Y.; Wang, J.L.; Li, M.H.; Yang, X.; Ren, X.H.; Hao, Y.L.; Yu, R.H. Multi-isotopes (δD, δ18Owater, 87Sr/86Sr, δ34S and δ18Osulfate) as indicators for groundwater salinization genesis and evolution of a large agricultural drainage lake basin in Inner Mongolia, Northwest China. Sci. Total Environ. 2024, 946, 174181. [Google Scholar] [CrossRef] [PubMed]
  36. Lu, P.; Zhang, G.R.; Apps, J.; Zhu, C. Comparison of thermodynamic data files for PHREEQC. Earth-Sci. Rev. 2022, 225, 103888. [Google Scholar] [CrossRef]
  37. Bo, Y.; Liu, C.L.; Jiao, P.C.; Lü, F.L. Hydrochemical Characteristics and Evolution of Underground Brine in Lop Nur, Northwestern China. Acta Geol. Sin-Engl. 2024, 98, 786–800. [Google Scholar] [CrossRef]
  38. Chen, J.; Wu, X.; Zhao, J.; Liu, S.; Zhang, Y.; Liu, J.; Gao, Z. Hydrochemical Characteristics, Controlling Factors and Strontium Enrichment Sources of Groundwater in the Northwest Plain of Shandong Province, China. Water-Sui. 2024, 16, 550. [Google Scholar] [CrossRef]
  39. Zhang, Z.; Liu, F.; Jiang, W.; Chen, S.; Zhang, H.; Gao, Z.; Zhang, J.; Niu, X.; Cao, W.; Shan, Q. Quantifying the factors controlling groundwater fluoride and associated health risks in the coastal river delta, northern China. J. Asian Earth Sci. 2024, 259, 105929. [Google Scholar] [CrossRef]
  40. Jiang, W.J.; Sheng, Y.Z.; Liu, H.W.; Ma, Z.; Song, Y.X.; Liu, F.T.; Chen, S.M. Groundwater quality assessment and hydrogeochemical processes in typical watersheds in Zhangjiakou region, northern China. Environ. Sci. Pollut. Res. 2022, 29, 3521–3539. [Google Scholar] [CrossRef] [PubMed]
  41. Li, C.C.; Gao, X.B.; Wang, Y.X. Hydrogeochemistry of high-fluoride groundwater at Yuncheng Basin, northern China. Sci. Total Environ. 2015, 508, 155–165. [Google Scholar] [CrossRef] [PubMed]
  42. King, I.C.; Johnson, J.T.E.; Kuang, L.; Naylor, S.; Subak, T.; Koleszar, A.M.; Levy, J.S. Brine formation in cold desert, shallow groundwater systems: Antarctic Ca-Cl brine chemistry controlled by cation exchange, microclimate, and organic matter. GSAB. 2024, 136, 3591–3604. [Google Scholar] [CrossRef]
  43. Yu, H.T.; Ma, T.; Du, Y.; Chen, L.Z. Genesis of formation water in the northern sedimentary basin of South China Sea: Clues from hydrochemistry and stable isotopes (D, 18O, 37Cl and 81Br). J. Geochem. Explor. 2019, 196, 57–65. [Google Scholar] [CrossRef]
  44. Labotka, D.M.; Panno, S.V.; Locke, R.A.; Freiburg, J.T. Isotopic and geochemical characterization of fossil brines of the Cambrian Mt. Simon Sandstone and Ironton-Galesville Formation from the Illinois Basin, USA. Geochim. Cosmochim. Acta 2015, 165, 342–360. [Google Scholar] [CrossRef]
  45. Davisson, M.; Criss, R. Na-Ca-Cl relations in basinal fluids. Geochim. Cosmochim. Acta 1996, 60, 2743–2752. [Google Scholar] [CrossRef]
  46. MacCaffrey, M.A.; Lazar, B.; Holland, H.D. The evaporation path of seawater and the coprecipitation of Br and K+ with halite. J. Sediment. Petrol. 1987, 57, 928–937. [Google Scholar]
  47. Yu, X.C.; Wang, C.L.; Huang, H.; Yan, K. Origin of lithium in oilfield brines in continental petroliferous basin: Insights from Li and Sr isotopes in the Jianghan Basin, central China. Mar. Pet. Geol. 2024, 160, 106576. [Google Scholar] [CrossRef]
  48. Bagheri, R.; Nadri, A.; Raeisi, E.; Shariati, A.; Mirbagheri, M.; Bahadori, F. Chemical evolution of a gas-capped deep aquifer, southwest of Iran. Environ. Earth Sci. 2014, 71, 3171–3180. [Google Scholar] [CrossRef]
  49. Boschetti, T.; Toscani, L.; Shouakar, O.; Iacumin, P.; Venturelli, G.; Mucchino, C.; Frape, S.K. Salt Waters of the Northern Apennine Foredeep Basin (Italy): Originm and Evolution. Aquat. Geochem. 2011, 17, 71–108. [Google Scholar] [CrossRef]
  50. Boschetti, T.; Awadh, S.M.; Al-Mimar, H.S.; Iacumin, P.; Toscani, L.; Selmo, E.; Yaseen, Z.M. Chemical and isotope composition of the oilfield brines from Mishrif Formation (southern Iraq): Diagenesis and geothermometry. Mar. Pet. Geol. 2020, 122, 104637. [Google Scholar] [CrossRef]
  51. Yang, L. Study on Characteristics and Evolution of Underground Brine Chemical Field in Platform of TengLong, XinJiang Province. Master’s Thesis, China University of Geosciences, Wuhan, China, 2009. [Google Scholar]
  52. Feng, N.; Qin, X.W.; Ma, Y.L.; Pan, T.; Chen, J.Z.; Ding, C.W.; Jiang, Z.W.; Zhang, D.; Liu, C.L.; Li, Q.K.; et al. Origin and mineralization potential evaluation of intercrystalline brine formation of the Balun Mahai Basin, Qaidam. J. Lake Sci. 2025, 38, 1–23. [Google Scholar]
  53. Mahlknecht, J.; Merch´an, D.; Rosner, M.; Meixner, A.; Ledesma-Ruiz, R. Assessing seawater intrusion in an arid coastal aquifer under high anthropogenic influence using major constituents, Sr and B isotopes in groundwater. Sci. Total Environ. 2017, 587–588, 282–295. [Google Scholar] [CrossRef] [PubMed]
  54. Zhang, X.; Xu, Z.F.; Liu, W.J.; Moon, S.; Zhao, T.; Zhou, X.D.; Zhou, X.; Zhang, J.Y.; Wu, Y.; Jiang, H.; et al. Hydro-geochemical and Sr isotope characteristics of the Yalong River basin, eastern Tibetan plateau: Implications for chemical weathering and controlling factors. Geochem. Geophy. Geosy. 2019, 20, 1221–1239. [Google Scholar] [CrossRef]
  55. Liu, C.L.; Wang, M.L.; Jiao, P.C. Hydrogen, oxygen, strontium and sulfur isotope geochemistry and source of potassium ore-forming materials in Lop Nur Salt Lake, Xinjiang. Miner. Depos. 1999, 18, 268–276. [Google Scholar]
  56. Liu, C.L.; Jiao, P.C.; Wang, M.L.; Yan, H.; Chen, Y.Z.; Sun, X.H.; Bo, Y.; Xuan, Z.Q.; Lv, F.L.; Zhang, H.; et al. Formation Conditions and Laws of Potash Deposits in Lop Nur Salt Lake; Scientific Press: Beijing, China, 2020; pp. 123–134. [Google Scholar]
  57. Chen, B.; Yu, Y.; Su, Q.; Yang, L.; Fu, T.F.; Liu, W.Q.; Chen, G.Q.; Lyu, W.Z. The Study on the Genesis of Underground Brine in Laizhou Bay Based on Hydrochemical Data. Water 2023, 21, 3788. [Google Scholar] [CrossRef]
Figure 1. Sampling points distribution map of study area.
Water 17 02192 g001
Figure 2. Spearman correlation matrix between the hydrochemical parameters of brine during (a) stage 1, (b) stage 2, (c) stage 3 in the Luobei depression.
Water 17 02192 g002
Figure 3. The spatial distribution characteristics of Mg2+ concentration in different stages.
Water 17 02192 g003
Figure 4. Comparison of different hydrochemical characteristic coefficients in underground brine at different stages. (a) (Na+/Cl) (meq ratio) vs. TDS; (b) (1000 × K+/Cl) (mg ratio) vs. TDS; (c) (Ca2+)/(Mg2+) (meq ratio) vs. TDS; (d) [100 × SO42−/ (2 × Cl)] (mol ratio) vs. TDS.
Water 17 02192 g004
Figure 5. The diagrams of (a) saturation indices; (b) bloedite vs. Mg2+; (c) carnallite vs. Mg2+; (d) gypsum vs. SO42−.
Water 17 02192 g005
Figure 6. Relationship between major ion milligram equivalent ratios. (a) (Ca2+ + Mg2+) and (SO42− + HCO3); (b) (Ca2+ + Mg2+ − HCO3 − SO42−) and (Na+ + K+ − Cl); (c) Mg2+ and Na+; (d) Ca2+ and Na+.
Water 17 02192 g006
Figure 7. Caexcess vs. Nadeficit (a) and Mgdeficit (b) diagram for underground brine at different stages.
Water 17 02192 g007
Figure 8. Conceptual model of phreatic brine evolution in the Luobei depression.
Water 17 02192 g008
Table 1. Statistics of hydrochemical data of underground brine in Luobei depression.
K+
(g/L)
Na+
(g/L)
Ca2+
(g/L)
Mg2+
(g/L)
Cl
(g/L)
SO42−
(g/L)
HCO3
(g/L)
TDS
(g/L)
Stage 1 (2006) Number of samples: 68
Max13.35115.180.4528.60196.8058.840.42371.85
Minimum5.1475.140.105.90155.1410.060273.50
Mean9.4098.240.2416.97179.2335.320.19339.87
Standard deviation1.988.010.065.066.7411.100.1317.15
Coefficient of variation0.210.080.250.300.040.310.680.05
Stage 2 (2019) Number of samples: 23
Max11.88108.670.2434.43181.4784.310.48383.73
Minimum7.4780.340.0814.46137.5440.070.14283.62
Mean9.8794.140.1524.62170.2660.760.31360.52
Standard deviation1.146.960.065.559.2615.920.1020.83
Coefficient of variation0.120.070.400.230.050.260.320.06
Stage 3 (2023) Number of samples: 116
Max13.07118.040.3836.73184.5996.660.38394.19
Minimum7.1977.190.0311.52147.8333.140.08339.01
Mean9.7992.780.1225.38171.8868.110.20368.41
Standard deviation0.837.270.065.207.4917.580.0713.79
Coefficient of variation0.080.080.500.200.040.260.350.04
Table 2. Statistics of hydrochemical data of underground brine in recharge area.
K+
(g/L)
Na+
(g/L)
Ca2+
(g/L)
Mg2+(
g/L)
Cl
(g/L)
SO42−
(g/L)
TDS
(g/L)
Tenglong Platform9.6599.700.1222.78165.5567.25365.70
Tienan Fault Depression 9.4489.370.1322.18169.4056.67347.40
Confined brine in Luobei Depression9.8794.070.1326.73165.9674.32371.72
Disclaimer/Publisher’s Note: The statements, opinions and data contained in all publications are solely those of the individual author(s) and contributor(s) and not of MDPI and/or the editor(s). MDPI and/or the editor(s) disclaim responsibility for any injury to people or property resulting from any ideas, methods, instructions or products referred to in the content.

