Article

A New Monitoring Method for the Water-Filled Status of Check Dams Using Remote Sensing and Deep Learning Techniques

1
PowerChina Northwest Engineering Corporation Limited, Xi’an 710065, China
2
State Key Laboratory of Simulation and Regulation of Water Cycle in River Basin, China Institute of Water Resources and Hydropower Research, Beijing 100048, China
3
School of Engineering and Technology, China University of Geosciences (Beijing), Beijing 100083, China
4
XCMG Hanyun Technologies Co., Ltd., Xuzhou 221000, China
5
Shaanxi Union Research Center of University and Enterprise for River and Lake Ecosystems Protection and Restoration, Xi’an 710048, China
*
Author to whom correspondence should be addressed.
Water 2025, 17(15), 2185; https://doi.org/10.3390/w17152185
Submission received: 27 April 2025 / Revised: 13 July 2025 / Accepted: 15 July 2025 / Published: 22 July 2025
(This article belongs to the Section Soil and Water)

Abstract

China’s Loess Plateau is characterized by dense and widely distributed check dams. However, there has been a lack of large-scale and high-temporal-resolution monitoring for the water-filled status of check dams, which is strongly related to their safe operation. In this study, a deep learning-based remote sensing image interpretation technique was developed, which enables long-term, large-scale, and high-frequency monitoring of the water-filled status of check dams. Using object detection algorithms based on deep learning and YOLOv3, an object-detection model was constructed and optimized. Leveraging high spatial resolution optical remote sensing images, the water-filled status of check dams can be identified. The model prediction indicates that the average precision for the check dam and water-filled check dam detection models reached 90.27% and 91.89%, respectively. Case studies were conducted on the check dams in the Jiuyuangou and Xiwuselang small watersheds. The monitoring result based on remote sensing images in the year 2021 shows a good agreement with the actual number of check dams. The proposed monitoring method for the water-filled status of check dams was proven feasible. This provides a reliable and efficient technical approach for monitoring the water-filled status of check dams, which is promising for their daily management and safe operation.

1. Introduction

Soil erosion in China’s Loess Plateau region is both intense and widespread, severely hampering the ecological protection and high-quality development in the Yellow River Basin [1]. Check dams—key soil and water conservation structures in the region—play a critical role in mitigating erosion, reducing sediment entering the Yellow River, and fostering regional socioeconomic growth. Check dams also improve local livelihoods and enhance ecological resilience [2,3,4]. Check dams have been used throughout the world for a variety of purposes, including torrent control, water supply enhancement, agricultural land development, and watershed restoration [5]. At the end of 2019, the Loess Plateau had 58,776 check dams, including 18,000 large- or medium-sized check dams [6]. Despite their benefits, however, extreme rainfall events have repeatedly caused water-related damage to these dams [7,8]. Storing water in reservoirs during dry periods can reduce flood retention capacity in the flood season, heightening risks of overtopping and catastrophic failure [9,10]. Consequently, the Chinese government has mandated that check dams remain empty prior to flood seasons, accounting for their safe operation since 2020 [11,12,13,14,15]. This policy emphasizes risk assessments of existing dams, removal or reinforcement of aging structures, and modernization of maintenance protocols. It also advocates for cross-regional monitoring systems to enable real-time safety risk detection and early warnings. Dynamic monitoring of water levels in check dams is thus a cornerstone of this safety framework, ensuring flood control reliability. Nevertheless, challenges persist. The sheer number and geographic spread of check dams—many of which are small- or medium-sized—leave most without dedicated monitoring infrastructure [16]. Additionally, their frequent placement in remote, inaccessible areas complicates manual inspections, rendering real-time water status tracking impractical.
Over the past decade, numerous scholars have explored various methods to monitor the operational status of check dams, particularly their water levels. These approaches fall into three categories: ground-based monitoring, drone remote sensing, and satellite remote sensing. Ground-based monitoring relies on field surveys and localized technologies to collect data on dam conditions [17,18]. For example, Ma et al. [19] developed an automated system to track parameters such as rainfall, water level, and structural stress, enabling predictive safety alerts. Similarly, Yu et al. [20] created a risk management platform by integrating real-time inspections and breach warnings. While effective for small-scale monitoring, this method becomes resource-intensive for dams spanning over 0.5 km2 [21]. Drone remote sensing provides a cost-efficient alternative, capturing high-resolution spatial data and elevation models of dam-controlled areas. Li et al. [22] used oblique drone photography to assess structural features, while Wang et al. [23] applied low-altitude drones to track soil and water dynamics. Though drones surpass satellites in resolution, they lack the broad coverage and long-term monitoring capabilities of orbital systems. Satellite remote sensing leverages multi-source data (e.g., optical, NDVI, land-type) to identify check dam features across large regions. Mi et al. [24] combined TM imagery and GIS tools to map dam locations and water surface changes in the Huangfu River Basin, and Zhang et al. [25] analyzed dam resources in southwestern Shanxi using Sentinel-2 and WorldView-2 data. Despite its scalability, satellite imagery’s lower spatial resolution and reliance on manual interpretation hinder precise, efficient monitoring—a critical gap given the need for large-scale, long-term water status tracking. Recent advances in machine learning [26,27,28] and high-resolution satellite imagery [29,30,31,32] have improved reservoir monitoring, yet no studies have adapted these methods to assess water status in the data-scarce Loess Plateau check dams. Developing a timely, automated, and reliable monitoring system for these structures remains an urgent priority.
This study develops a YOLOv3-based object detection model for identifying the water-filled status of check dams using high-resolution remote sensing imagery. To address practical challenges in large-scale dam monitoring, the model incorporates three key optimizations: (i) adaptation for ultra-large remote sensing images, ensuring compatibility with expansive geographical coverage; (ii) refined coordinate transformation to enhance spatial accuracy in dam localization; and (iii) multi-model cascading detection, improving robustness in complex terrain and varying water conditions. The model was trained on two custom datasets: (i) a check dam detection dataset for general dam identification and (ii) a water-filled check dam dataset to distinguish operational water status (e.g., dry vs. flooded reservoirs). After training and validation, the framework was applied to the Jiuyuangou and Xiwuselang watersheds, which are two representative small watersheds on China’s Loess Plateau. The case studies demonstrated the model’s ability to automatically and reliably identify the water-filled status of check dams with minimal manual intervention. The prediction results confirmed the feasibility of leveraging high-resolution satellite data to address gaps in large-scale, real-time monitoring, particularly in data-scarce regions like China’s Loess Plateau.

2. Construction and Optimization of an Object Detection Model Based on the YOLOv3 Algorithm

Deep learning-based object detection methods fall into two categories: (i) one-stage detectors (e.g., YOLO [33], SSD [34], Swin Transformer-based model [35]), which directly regress object locations and classes, and (ii) two-stage detectors (e.g., R-CNN [36], Faster R-CNN [37]), which first generate region proposals and then classify and localize objects. This study employs YOLOv3—a widely used one-stage algorithm known for its speed, multi-scale feature detection, and accuracy with small objects [38,39]—to identify water-filled and non-water-filled check dams in remote sensing imagery. However, YOLOv3 faces the following limitations when applied to remote sensing: (i) input size constraints: the default input (416 × 416 pixels) is incompatible with the ultra-large images in this study, (ii) format limitations: poor support for TIFF (common in remote sensing) compared to JPG, and (iii) batch processing: the inability to process multiple images simultaneously [40]. To address these challenges, we optimized YOLOv3 via the following techniques: (i) adapting it to ultra-large image detection (e.g., tiling or dynamic resizing), (ii) implementing TIFF-to-JPG conversion pipelines without losing critical spatial data, (iii) enhancing spatial information mapping to preserve geolocation accuracy during preprocessing, and (iv) designing a cascaded multi-model workflow to improve detection reliability across scales. As shown in Figure 1, the optimized framework enables efficient, scalable water-status detection for check dams, overcoming traditional bottlenecks in remote sensing applications.

2.1. Optimization of Applicability for Large-Scale Remote Sensing Image Detection

The remote sensing images used in this study averaged 500 megabits per file and were stored in TIFF format. To address compatibility issues with the YOLOv3 framework, a preprocessing procedure was implemented as follows: (i) TIFF image handling: the tifffile library from Python 3.6 was used to read TIFF images, extracting both pixel data and spatial coordinate information. Spatial coordinates were stored in multidimensional arrays and linked to their original files via matching filenames, ensuring geospatial integrity. (ii) Format conversion: TIFF images were converted to JPG format using tifffile, preserving their original resolution (critical for detecting small check dams).
After the format conversion, the remote sensing images retained their original resolution but possibly exceeded the default image size accepted by the YOLOv3 model, making them unsuitable for direct input into the model. To address this issue, this study proposes a method for batch image segmentation and stitching reconstruction. Firstly, during image segmentation, JPG images were divided into 416 × 416 pixel tiles, calculated row by row and column by column. Tile indices (row/column positions) were embedded in filenames to guide post-detection stitching. Secondly, during edge handling, incomplete edge regions were padded with white backgrounds to maintain tile dimensions. Partially segmented check dams in edge tiles were explicitly labeled and included in the training data to enhance model robustness. Lastly, during reconstruction, detected tiles were reassembled into full-scale images using their indexed positions, producing cohesive detection results. This approach ensured seamless processing of ultra-large images while mitigating fragmentation risks.

2.2. Coordinate Transformation

The coordinate systems involved in remote sensing imagery include the geographic coordinate system, the projected coordinate system, the pixel coordinate system, based on image pixels, and the raster coordinate system, based on row and column indices of segmented sub-images. Original remote sensing images are provided in either the geographic coordinate system or the projected coordinate system. However, due to the loss of coordinate information after format conversion, only the pixel coordinates of each segmented sub-image can be retrieved. To determine the location coordinates of detected check dams, it is necessary to perform transformations among these different coordinate systems. In this study, coordinate transformations were conducted using the Python-based GDAL library. First, GDAL was employed to read the projection coordinates embedded in the TIFF-format remote sensing images and convert these projection coordinates into pixel coordinates [41,42]. Subsequently, during the segmentation of large-scale images into smaller images, a raster coordinate system was established, taking each segmented sub-image as a unit. For each sub-image, the row and column indices were used to calculate the pixel coordinates of its upper-left corner. When a check dam target was detected in a specific sub-image, a sub-pixel coordinate system was established for that sub-image to determine the bounding box and the center point of the predicted target within the sub-pixel coordinate system. Finally, the location of the check dam target in the total pixel coordinate system was determined through a mapping from the sub-pixel coordinates to the total pixel coordinates. The total pixel coordinates were then converted to projection coordinates using GDAL’s transformation interface. By storing the detected check dam location information and performing the above coordinate transformations, the actual geographic coordinates (i.e., longitude and latitude) of each detected check dam were determined. This process further enabled the identification of additional information about each check dam, such as its name.

2.3. Optimization of Multi-Model Sequential Detection

For multi-class target detection, two strategies can be adopted: multi-class detection and single-class detection. Multi-class detection requires creating a single dataset that includes all target categories, training a unified model with this dataset, and subsequently performing detection. In contrast, single-class detection requires creating separate datasets for each target category, training individual models for each dataset, and then performing detection independently for each class. In this study, experiments were conducted to compare and analyze these two strategies. The same training parameters were used for both strategies, including training epochs, initial learning rate, and batch size. The pre-training strategy based on the transfer learning method, i.e., pre-training the network on a different dataset (i.e., Microsoft Common Objects in Context) and then fine-tuning the network on the task dataset in the current study, was used. The pre-training strategy deals with the class imbalance problem, based on previous studies (e.g., [43]). Previous studies found that freezing the parameters during the training process will accelerate the model training [44]. In this study, 50 frozen training epochs followed by 50 unfrozen training epochs were used for each model training. The specific parameter settings are shown in Table 1. After training, the respective test sets of each dataset were used to evaluate and compare the detection performance of the two strategies, as shown in Table 2. Five evaluation metrics, i.e., precision (P), recall (R), F1-score, average precision (AP), and mean average precision (mAP), were used to assess detection accuracy. Based on the detection results of different strategies, the single-class detection strategy was selected as the optimal approach for this study. The definitions of precision (P), recall (R), F1-score, average precision (AP), and mean average precision (mAP) are as follows:
P = nTP/(nTP + nFP),
R = nTP/(nTP + nFN),
F1-score = 2PR/(P + R),
AP = 0 1 P r d r ,
mAP = 1 N 0 1 P r d r ,
where nTP is the number of true positives, nFP is the number of false positives, nFN is the number of false negatives, P(r) is the precision at recall level r, and N is the number of target-detected classes (e.g., N = 1 for single-class detection).
Based on the single-class detection strategy, the detection process for water-filled check dams was optimized. First, the input large-scale images were subjected to format conversion and batch segmentation, and the segmented sub-images were backed up. Next, each sub-image was analyzed for check dam detection, and the detection results, along with the visualized output images, were stored. Subsequently, the backup sub-images containing detected check dams were used for water-filled check dam detection. If a water-filled check dam was detected, the previously stored check dam detection result was updated to water-filled; if not, the detected check dam target was classified as non-water-filled. This process was repeated for each sub-image, and the detection results were stored accordingly. Once all sub-images were processed, the visualized results of the detection were stitched together to generate the final detection outcome.

3. Detection Model Training and Validation for Water-Filled Check Dams

3.1. Model Training

This study adopted the Pascal VOC format as the standard for constructing the check dam detection dataset from remote sensing images. To ensure the dataset’s generalization capability, images from regions with high check dam density were selected, including (i) Dalate Banner in Ordos City, Inner Mongolia Autonomous Region, (ii) Wulateqian Banner in Bayannur City, Inner Mongolia Autonomous Region, (iii) Yulin City in Shaanxi Province, and (iv) Guyuan City in Shaanxi Province. This diverse selection ensured that the trained model could accurately identify check dams across different geographical regions. The preprocessing phase involved format conversion, batch segmentation, and standardized filename modifications, resulting in 92,454 small images with dimensions of 416 × 416 pixels. Using the Python-based graphical image annotation tool, i.e., labelImg, we annotated the images to create two datasets: one for general check dam detection and another for water-filled check dam detection. The final datasets contained 1053 valid samples for check dam detection and 649 valid samples for water-filled check dam detection.
Two models were trained on their respective datasets: (i) the check dam detection model (CDDM) and (ii) the water-filled check dam detection model (WF-CDDM). After 2260 and 1980 training epochs for the CDDM and WF-CDDM, respectively, we evaluated their performances. The CDDM achieved an average precision (AP) of 90.27% on its test set, while the WF-CDDM achieved an AP of 91.89%. Detailed results are provided in Table 3.
The test results revealed that both models achieved high precision, demonstrating strong accuracy in identifying check dams and water-filled check dams among the detected targets. While the recall rates were slightly lower than the precision values, they remained relatively high, suggesting potential for further improvement in detecting all instances of check dams. These limitations probably stem from challenges in image quality, such as variable lighting conditions, limited resolution, and cloud cover. The models’ average precision (AP) scores, i.e., 90.27% for the check dam detection model (CDDM) and 91.89% for the water-filled check dam detection model (WF-CDDM), indicate robust training and comparable performance. When deployed together, the models can effectively identify check dams and assess their water-filled status in high-resolution remote sensing imagery. Examples of the test result visualization are provided in Figure 2 and Figure 3. Figure 2 illustrates detection results from the CDDM, while Figure 3 shows the WF-CDDM’s performance. In both figures, the blue boxes denote ground truth annotations (manual labels), green boxes represent correct predictions, and red boxes indicate incorrect predictions.

3.2. Model Validation: Case I

The Jiuyuangou small watershed is located approximately 5 km north of Suide County in Yulin City, Shaanxi Province, China. It passes through nine administrative villages, namely, Weijiayan, Xiyangou, Lijiazhai, Pujiaya, Linjiajian, Xiwa, Jiuyuangou, Wangjiagou, and Liujiawan villages. As a tributary on the left bank of the middle reaches of the Wuding River, the Jiuyuangou watershed covers an area of approximately 70.7 km2, with a main channel length of 18 km and an average channel slope of 1.15%. The watershed has 66 first-level tributaries, including 15 tributaries with an area of more than 1 km2. This region is characterized by a temperate continental semi-arid climate, with a long-term average annual temperature of 8 °C and an average annual rainfall of 475 mm. Rainfall shows significant interannual variability, predominantly occurring from July to September in the form of heavy rains. Based on the previous comprehensive field investigation and interpretation of remote sensing images, there are 209 check dams in the Jiuyuangou watershed. Excluding those that are silted up or breached, 91 check dams remain functional for sediment and flood retention. Among those, there are 45 small-sized dams, 22 medium-sized dams, and 24 large-sized dams. The spatial distribution of the check dams in the Jiuyuangou watershed is shown in Figure 4.
Twelve preprocessed high-resolution satellite remote sensing images of the Jiuyuangou watershed were selected to predict check dam locations and their water status. These images, captured monthly throughout 2021 (except October, for which an image on November 8 was substituted because of data unavailability), collectively cover the entire watershed spatially. Table 4 provides detailed metadata for these images, including acquisition dates, sensor specifications, and spatial resolution.
Using the trained target detection model for water-filled check dams, predictions were made on the twelve remote sensing images from Jiuyuangou in 2021. The detection results were compared to the actual total number of check dams, as shown in Figure 5. The figure shows that the number of check dams detected by the trained model closely matched the actual number in the Jiuyuangou watershed. From the monthly distribution of correctly detected water-filled and non-water-filled check dams in 2021, it is observed that the detection results remained relatively stable. Only one check dam, the Liujiaping large-sized check dam, consistently maintains a water-filled status throughout the year. This consistency aligns with the comprehensive governance of the Jiuyuangou watershed, which began in 1953, and its designation as a national demonstration area for soil erosion control.
Figure 6 provides a visualization of the detection results for the water-filled state of the Liujiaping large-sized check dam in 2021 (where water-filled check dams are marked with blue boxes). Based on this analysis, it can be inferred that modifications have been made to the dam’s water retention structure and drainage facilities.

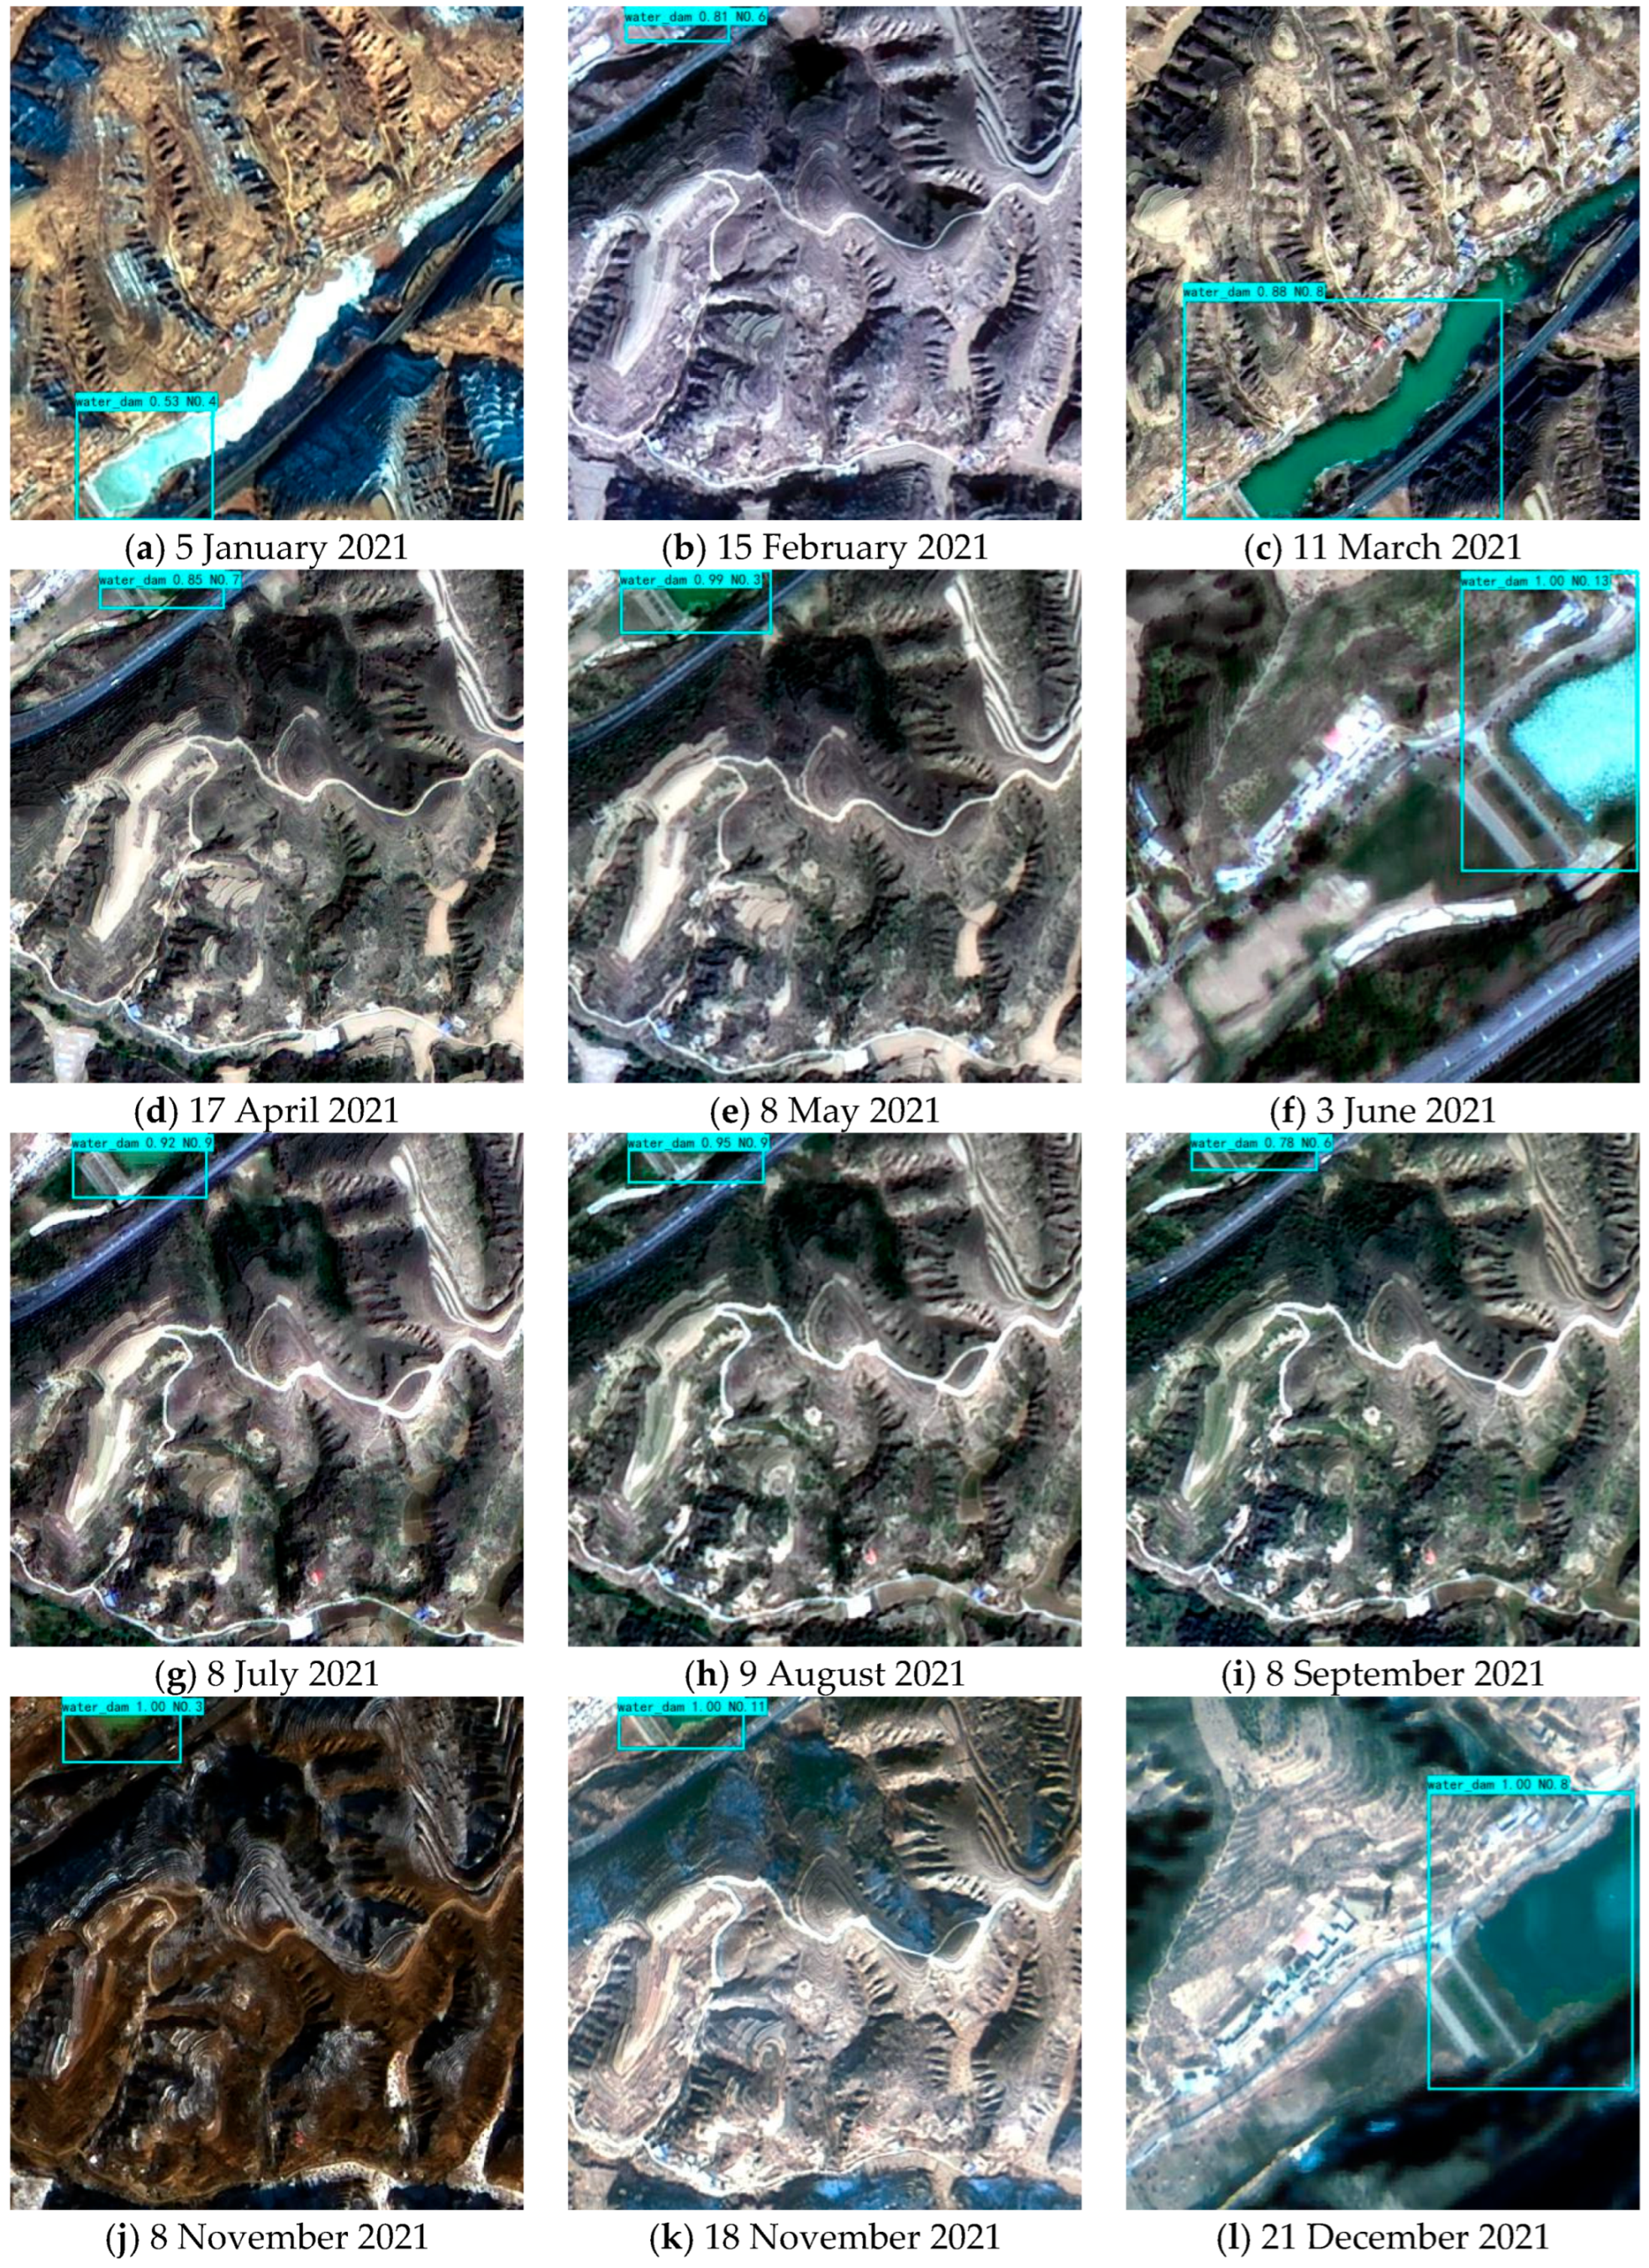
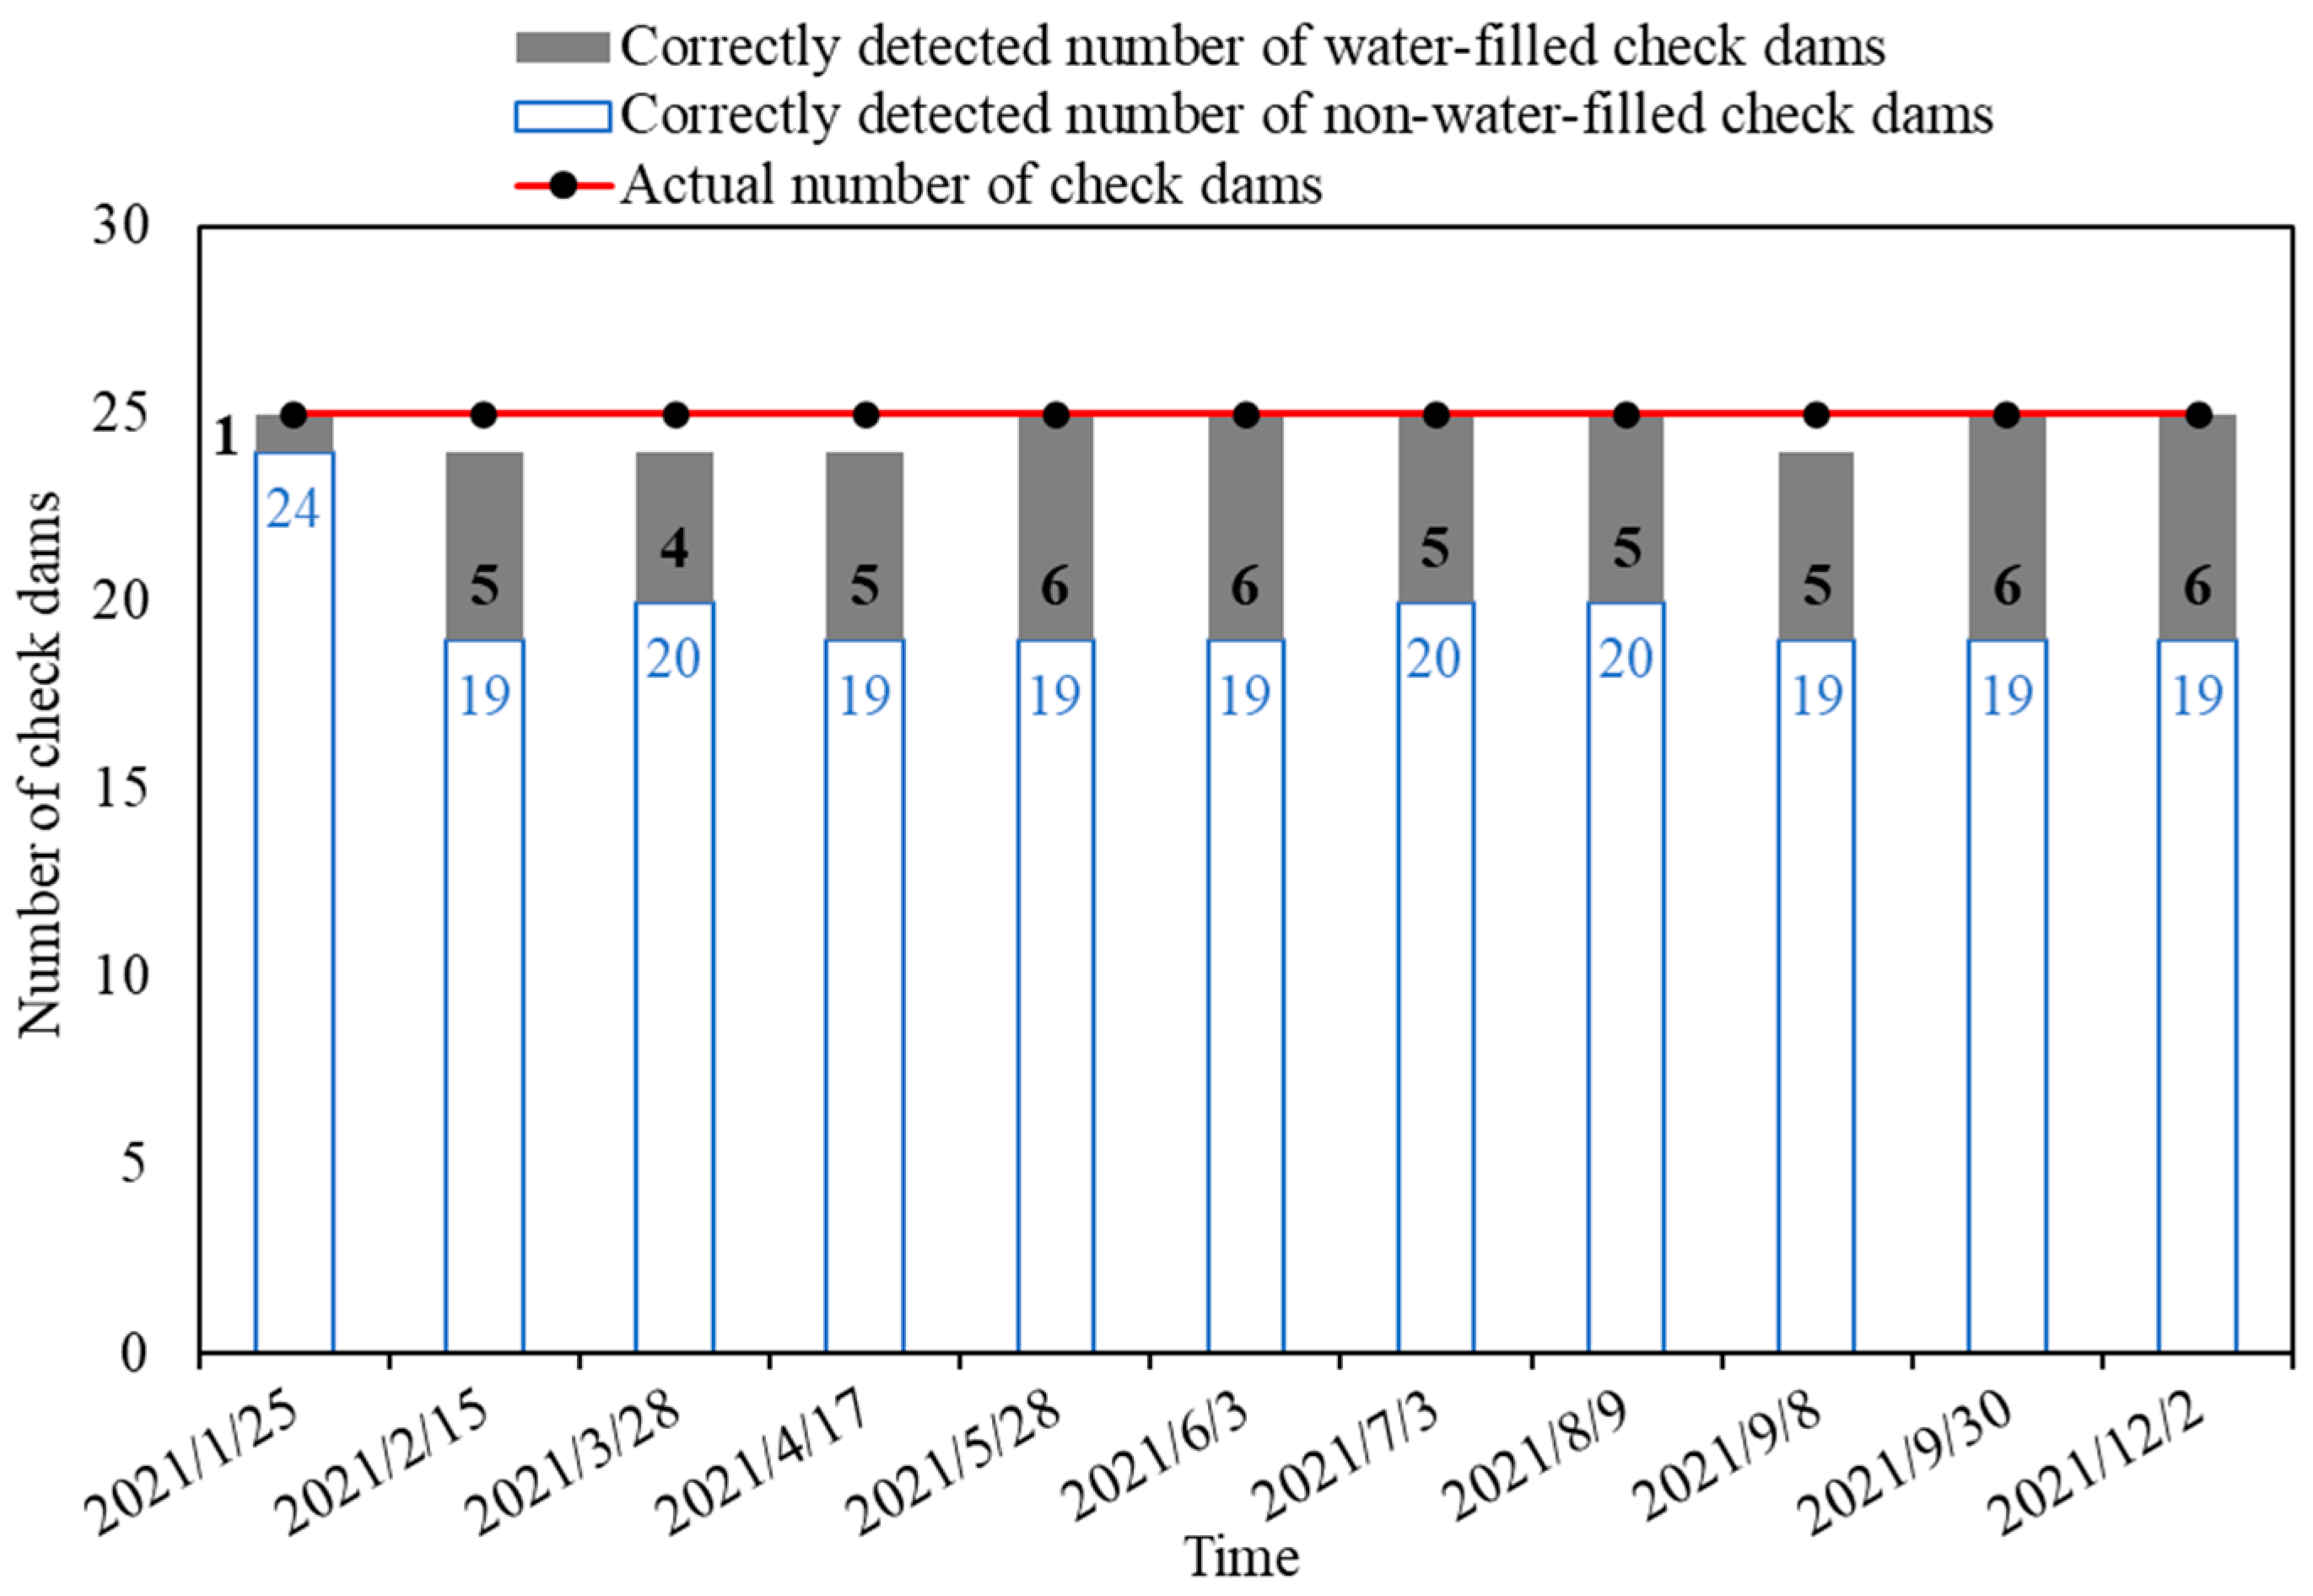
3.3. Model Validation: Case II

The Xiwuselang small watershed is located approximately 15 km away from Jungar Banner in Ordos City, Inner Mongolia Autonomous Region, China. It encompasses two administrative villages: Wusulang and Youfangta. As the first-order tributary of the Shilichangchuan River and the third-order tributary of the Yellow River, the Xiwuselang watershed covers an area of approximately 78 km2. The average annual precipitation in this region is 389.4 mm. Precipitation progressively decreases from the southeast to the northwest. The majority of annual rainfall occurs between April and September, with July and August being the peak period—these two months alone receive an average of 98.1 mm, accounting for 25.2% of the yearly total. During summer (i.e., from June to August), precipitation constitutes 63.5% of the annual amount. There are 15 small-sized check dams and 10 medium-sized check dams. The spatial distribution of the check dams in Xiwuselang is shown in Figure 7.
Eleven preprocessed high-resolution satellite remote sensing images of the Xiwuselang watershed were selected to predict the locations and water-filled status of check dams. These images, captured monthly throughout 2021 (except November), collectively cover the entire watershed spatially. Table 5 provides detailed metadata for those images, including acquisition dates, sensor specifications, and spatial resolution.
Using the trained target detection model for water-filled check dams, predictions were made on the eleven remote sensing images from the Xiwuselang watershed in 2021. The detection results were compared to the actual total number of check dams, as shown in Figure 8. The number of check dams detected by the model in the Xiwuselang watershed shows alignment with the ground-truthed number of check dams. It reveals that most check dams in the Xiwuselang watershed remained predominantly non-impounding in the year 2021, except for the flood season.
Figure 9 provides a visualization of the detection results for the water-filled status of the Hulumiaogou No.1 check dam in 2021 (where water-filled check dams and non-water-filled check dams are marked with blue boxes and red boxes, respectively). It can be inferred that, except for a few perennially impounded dams, most check dams remain dry throughout the year. Only during the flood season (i.e., from April to September) do some check dams accumulate non-drainable water.

4. Discussion

This study provides a reliable and efficient technique for monitoring the water-filled status of check dams, which is vital for their daily management and safe operation. However, there remain several limitations in this study. First, comparative studies need to be conducted, in which the detection precision of the YOLOv3 model will be compared with other commonly used target detection models for the specific target, i.e., check dams on China’s Loess Plateau. The performance of the proposed technique, e.g., quantitative evaluation metrics, can be improved in future work related to dam safety management. The transferability of the proposed technique needs to be justified using remote sensing images of check dams in other small watersheds. Second, while this research focuses on the rapid identification of whether a check dam is water-filled, further investigation is required to estimate the water storage volume and remaining reservoir capacity of water-filled check dams. Moreover, the monitored variation in water storage volume over time can provide valuable support for risk management of check dams, especially in the flood season.

5. Conclusions

This study proposes a remote sensing-based monitoring technique for the water-filled status of check dams using the YOLOv3 deep learning object detection model. The feasibility of this technique is validated by conducting two case studies on the check dams in the Jiuyuangou and Xiwuselang small watersheds. The main conclusions are as follows:
(1)
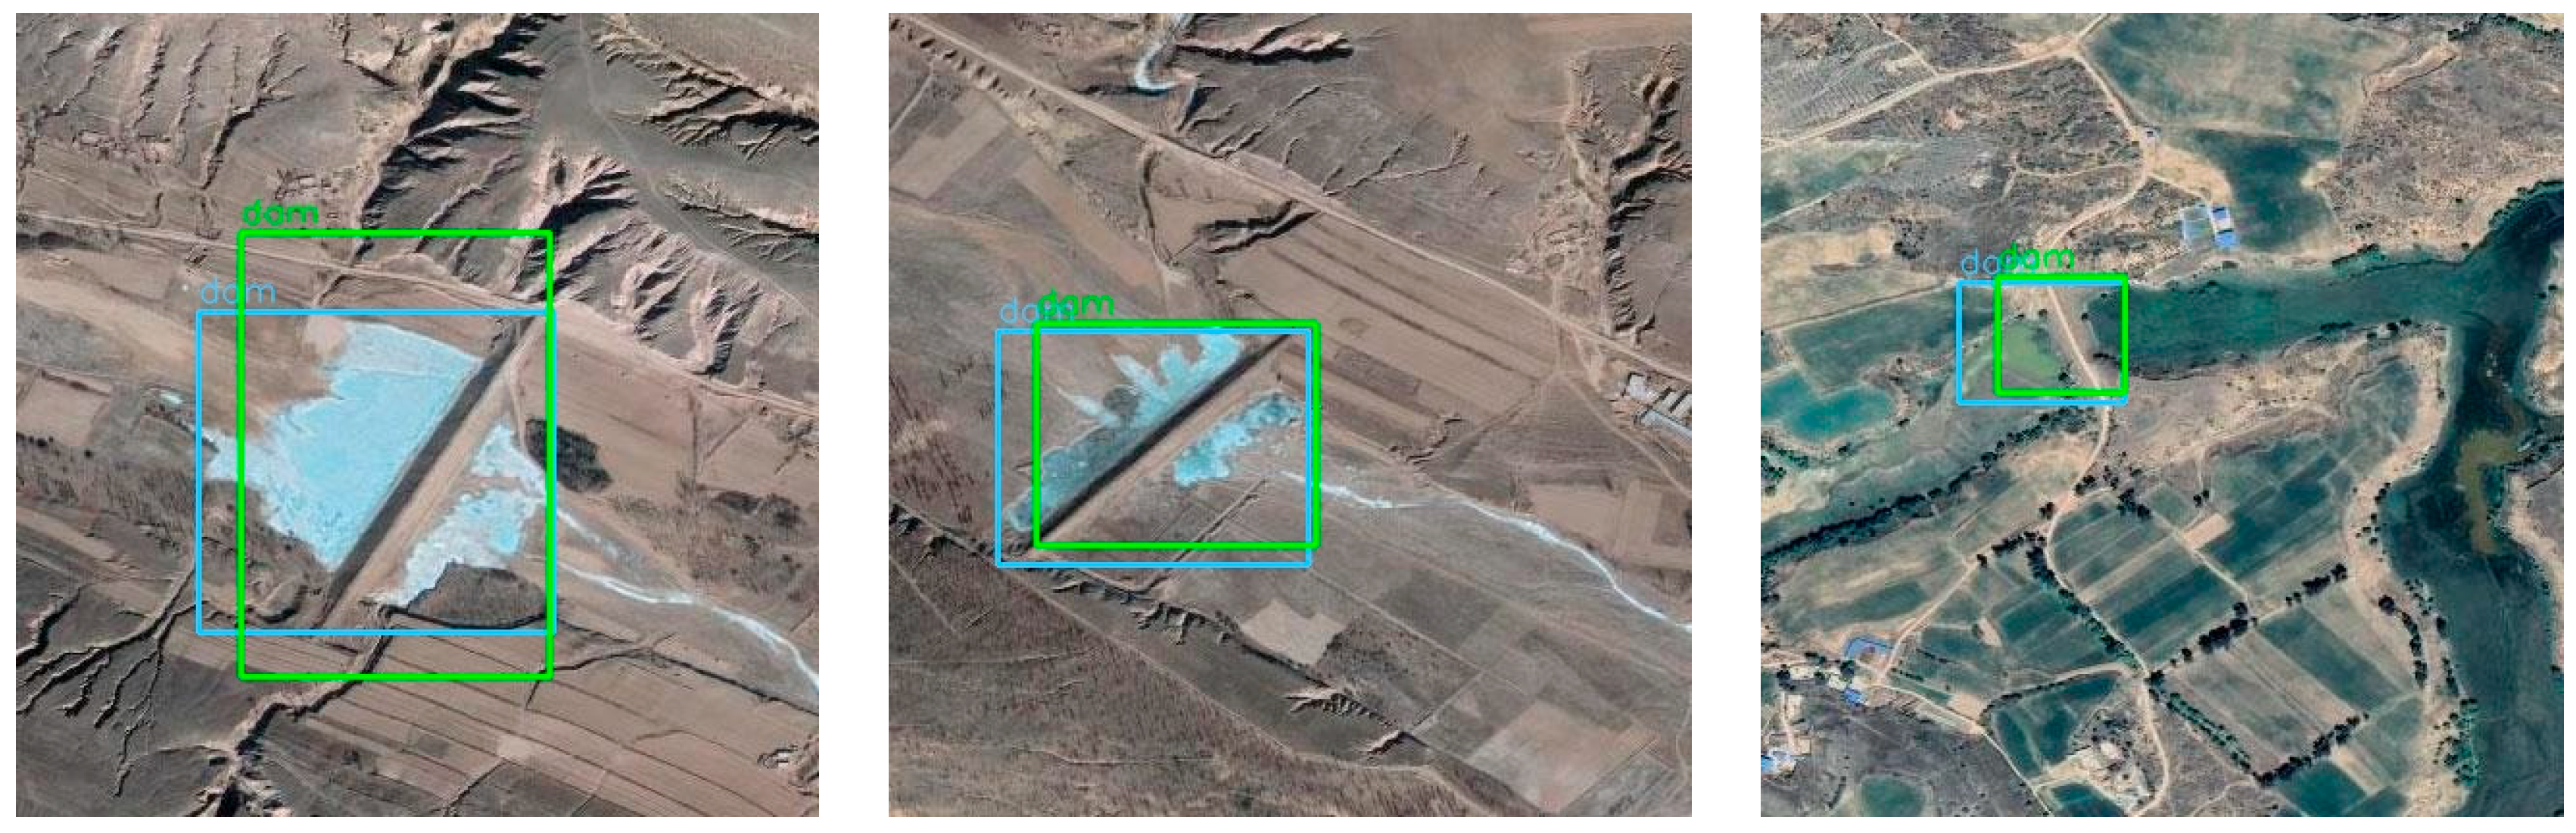
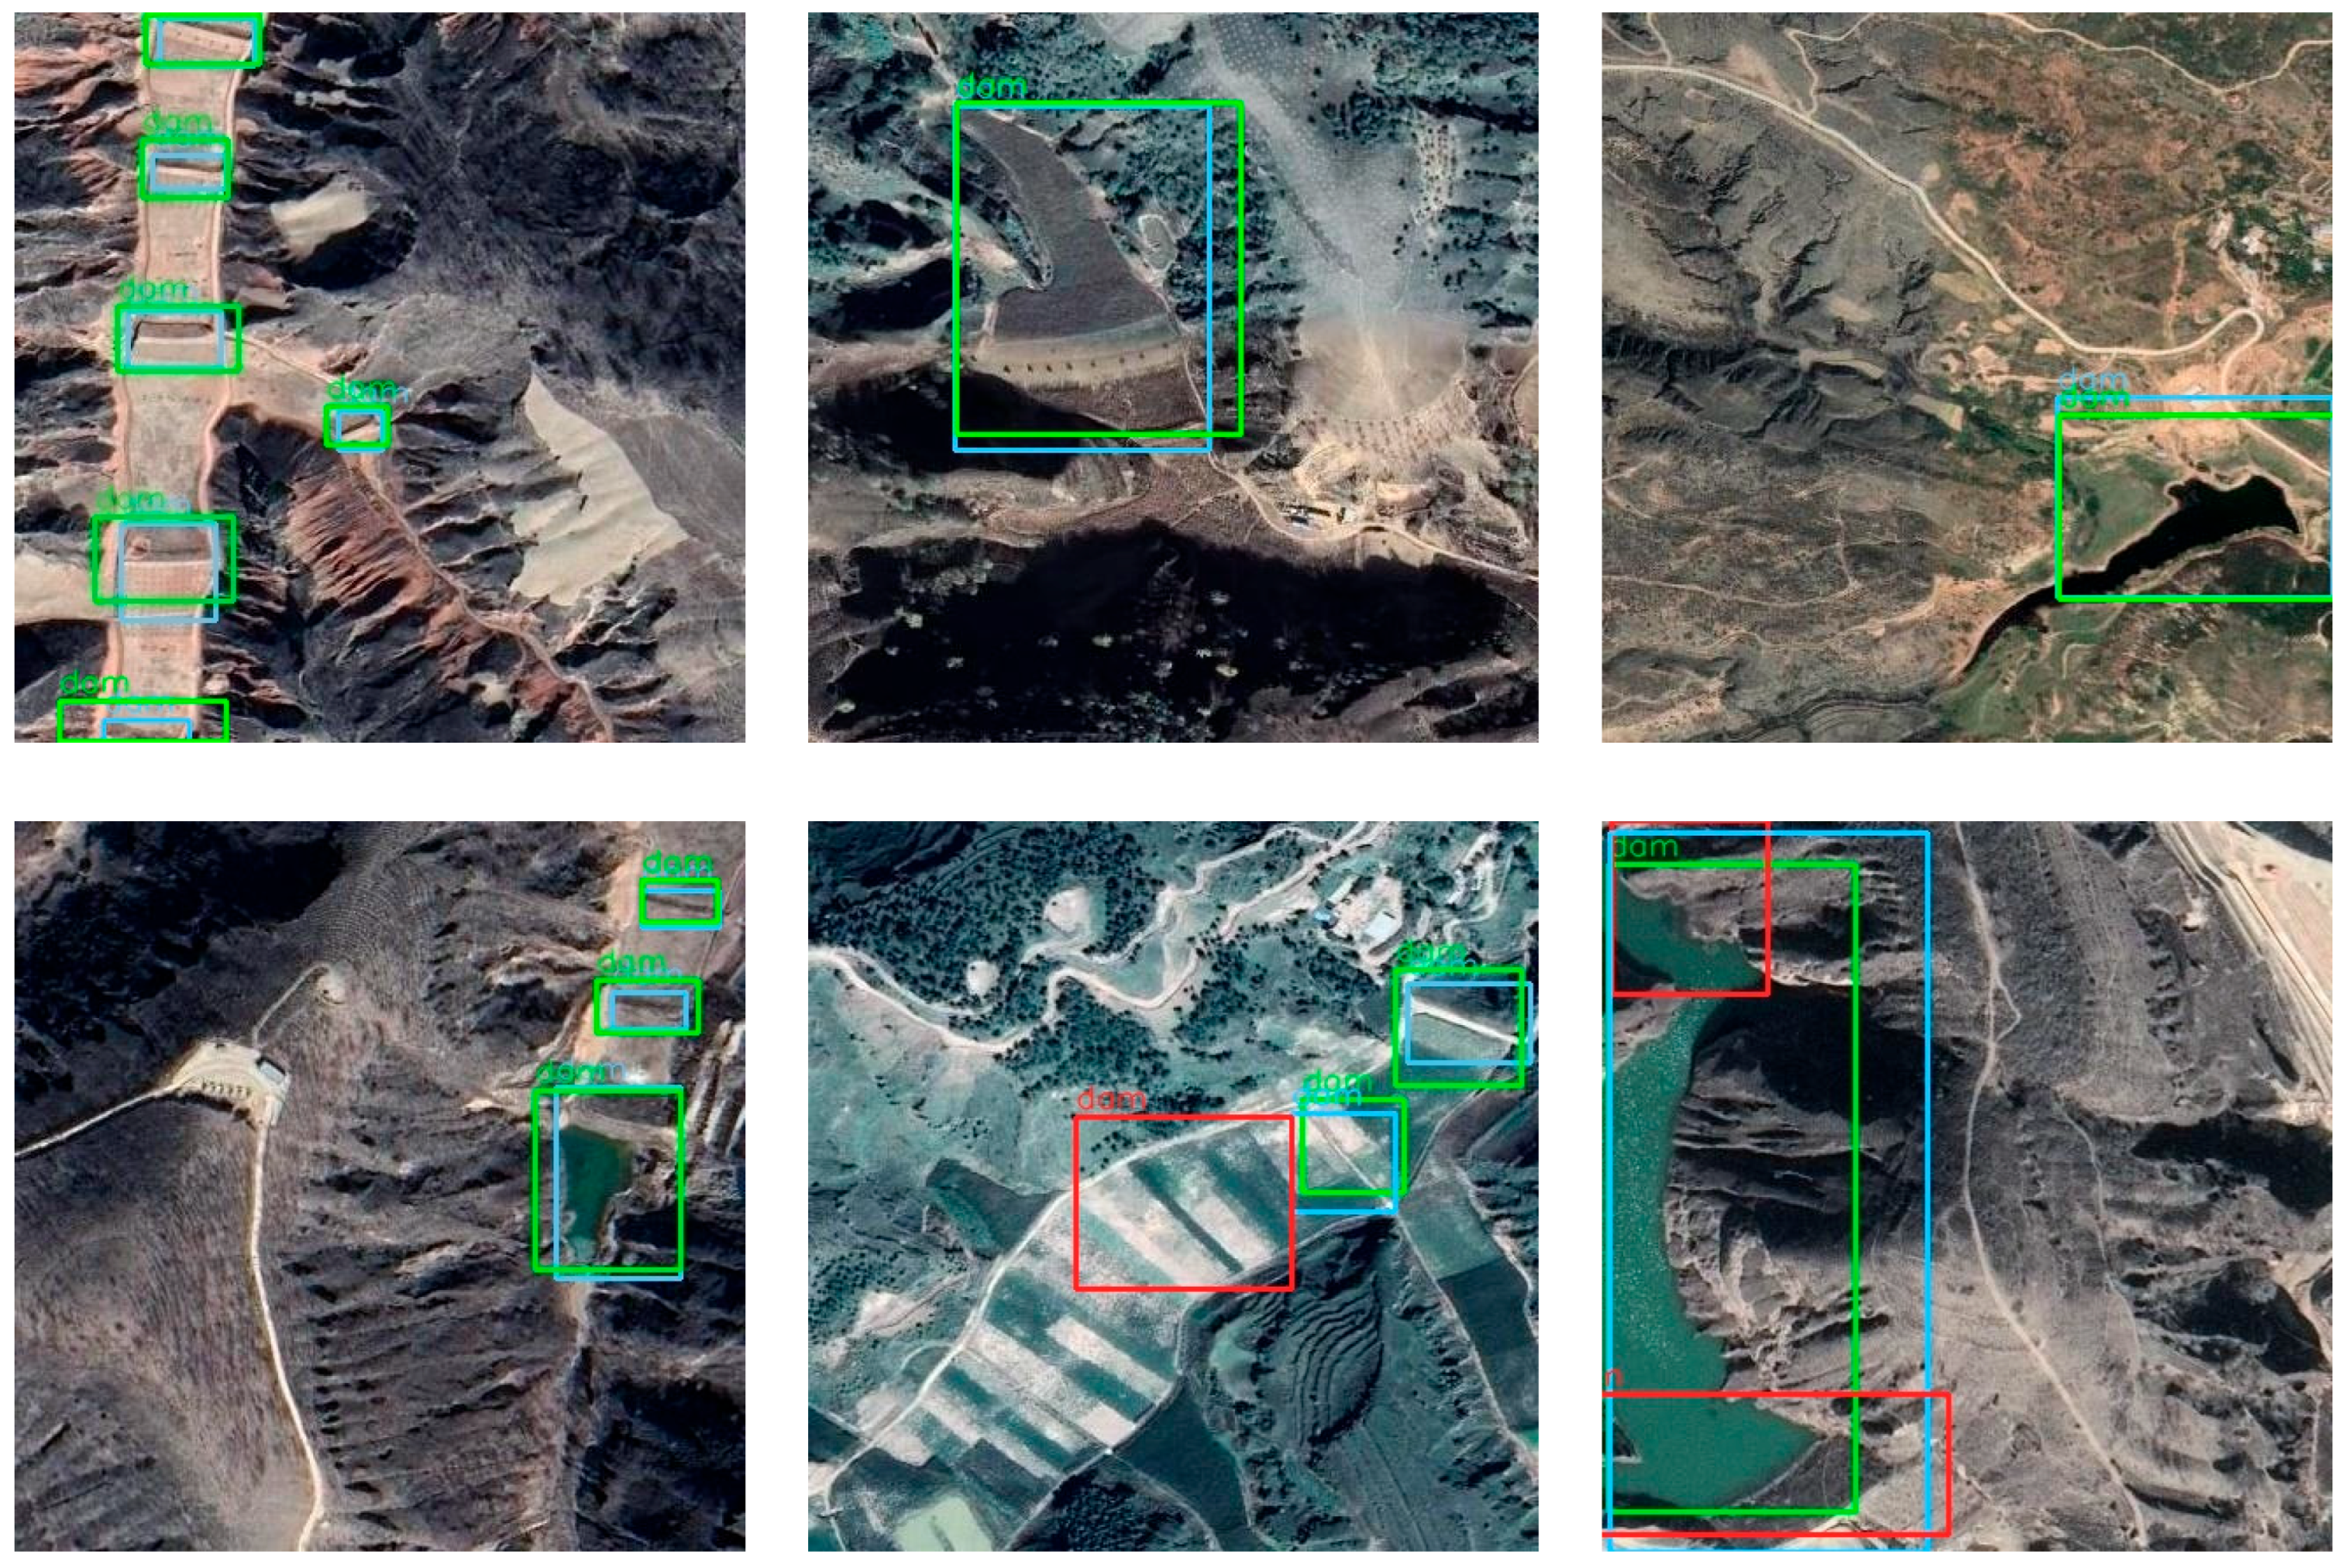
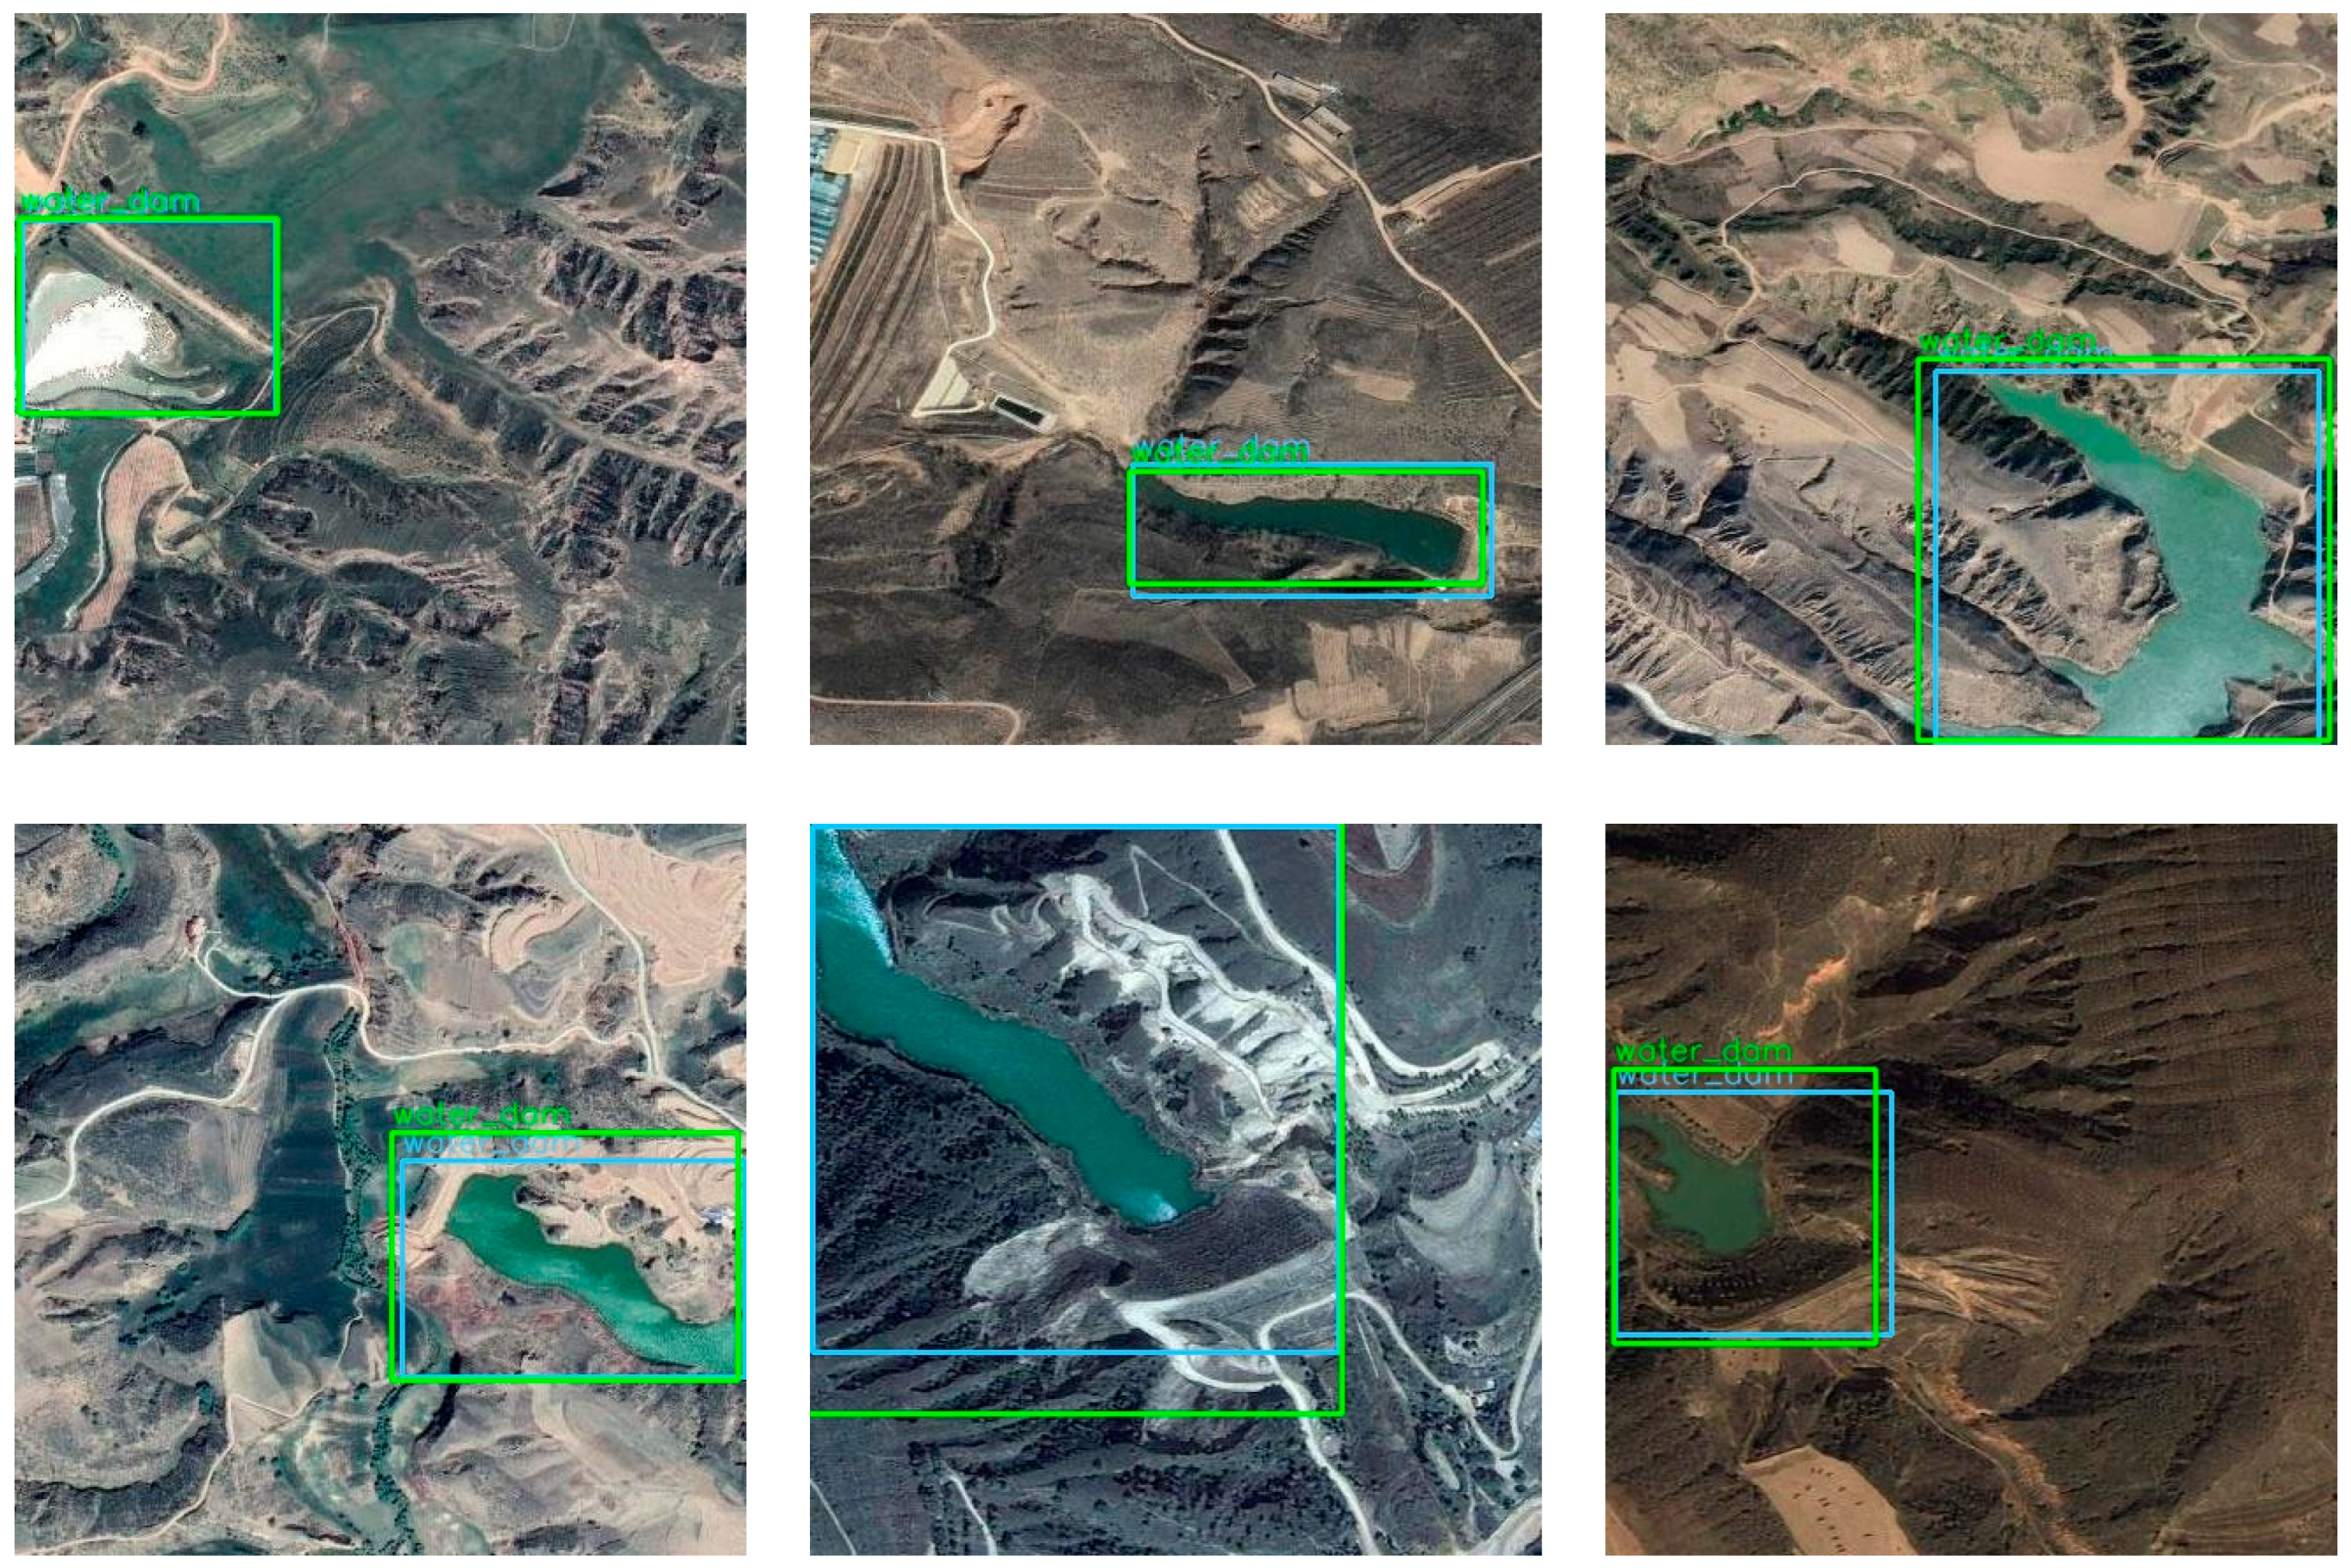
By constructing and optimizing the YOLOv3 object detection model, this study established a fully automated monitoring technique for the water-filled status of check dams using the high spatial resolution remote sensing imagery. After model training, the evaluation of the model test results using five metrics, i.e., precision, recall, average precision (AP), F1-score, and mean average precision (mAP), indicates that the average precision for the check dam and water-filled check dam detection models reached 90.27% and 91.89%, respectively.
(2)
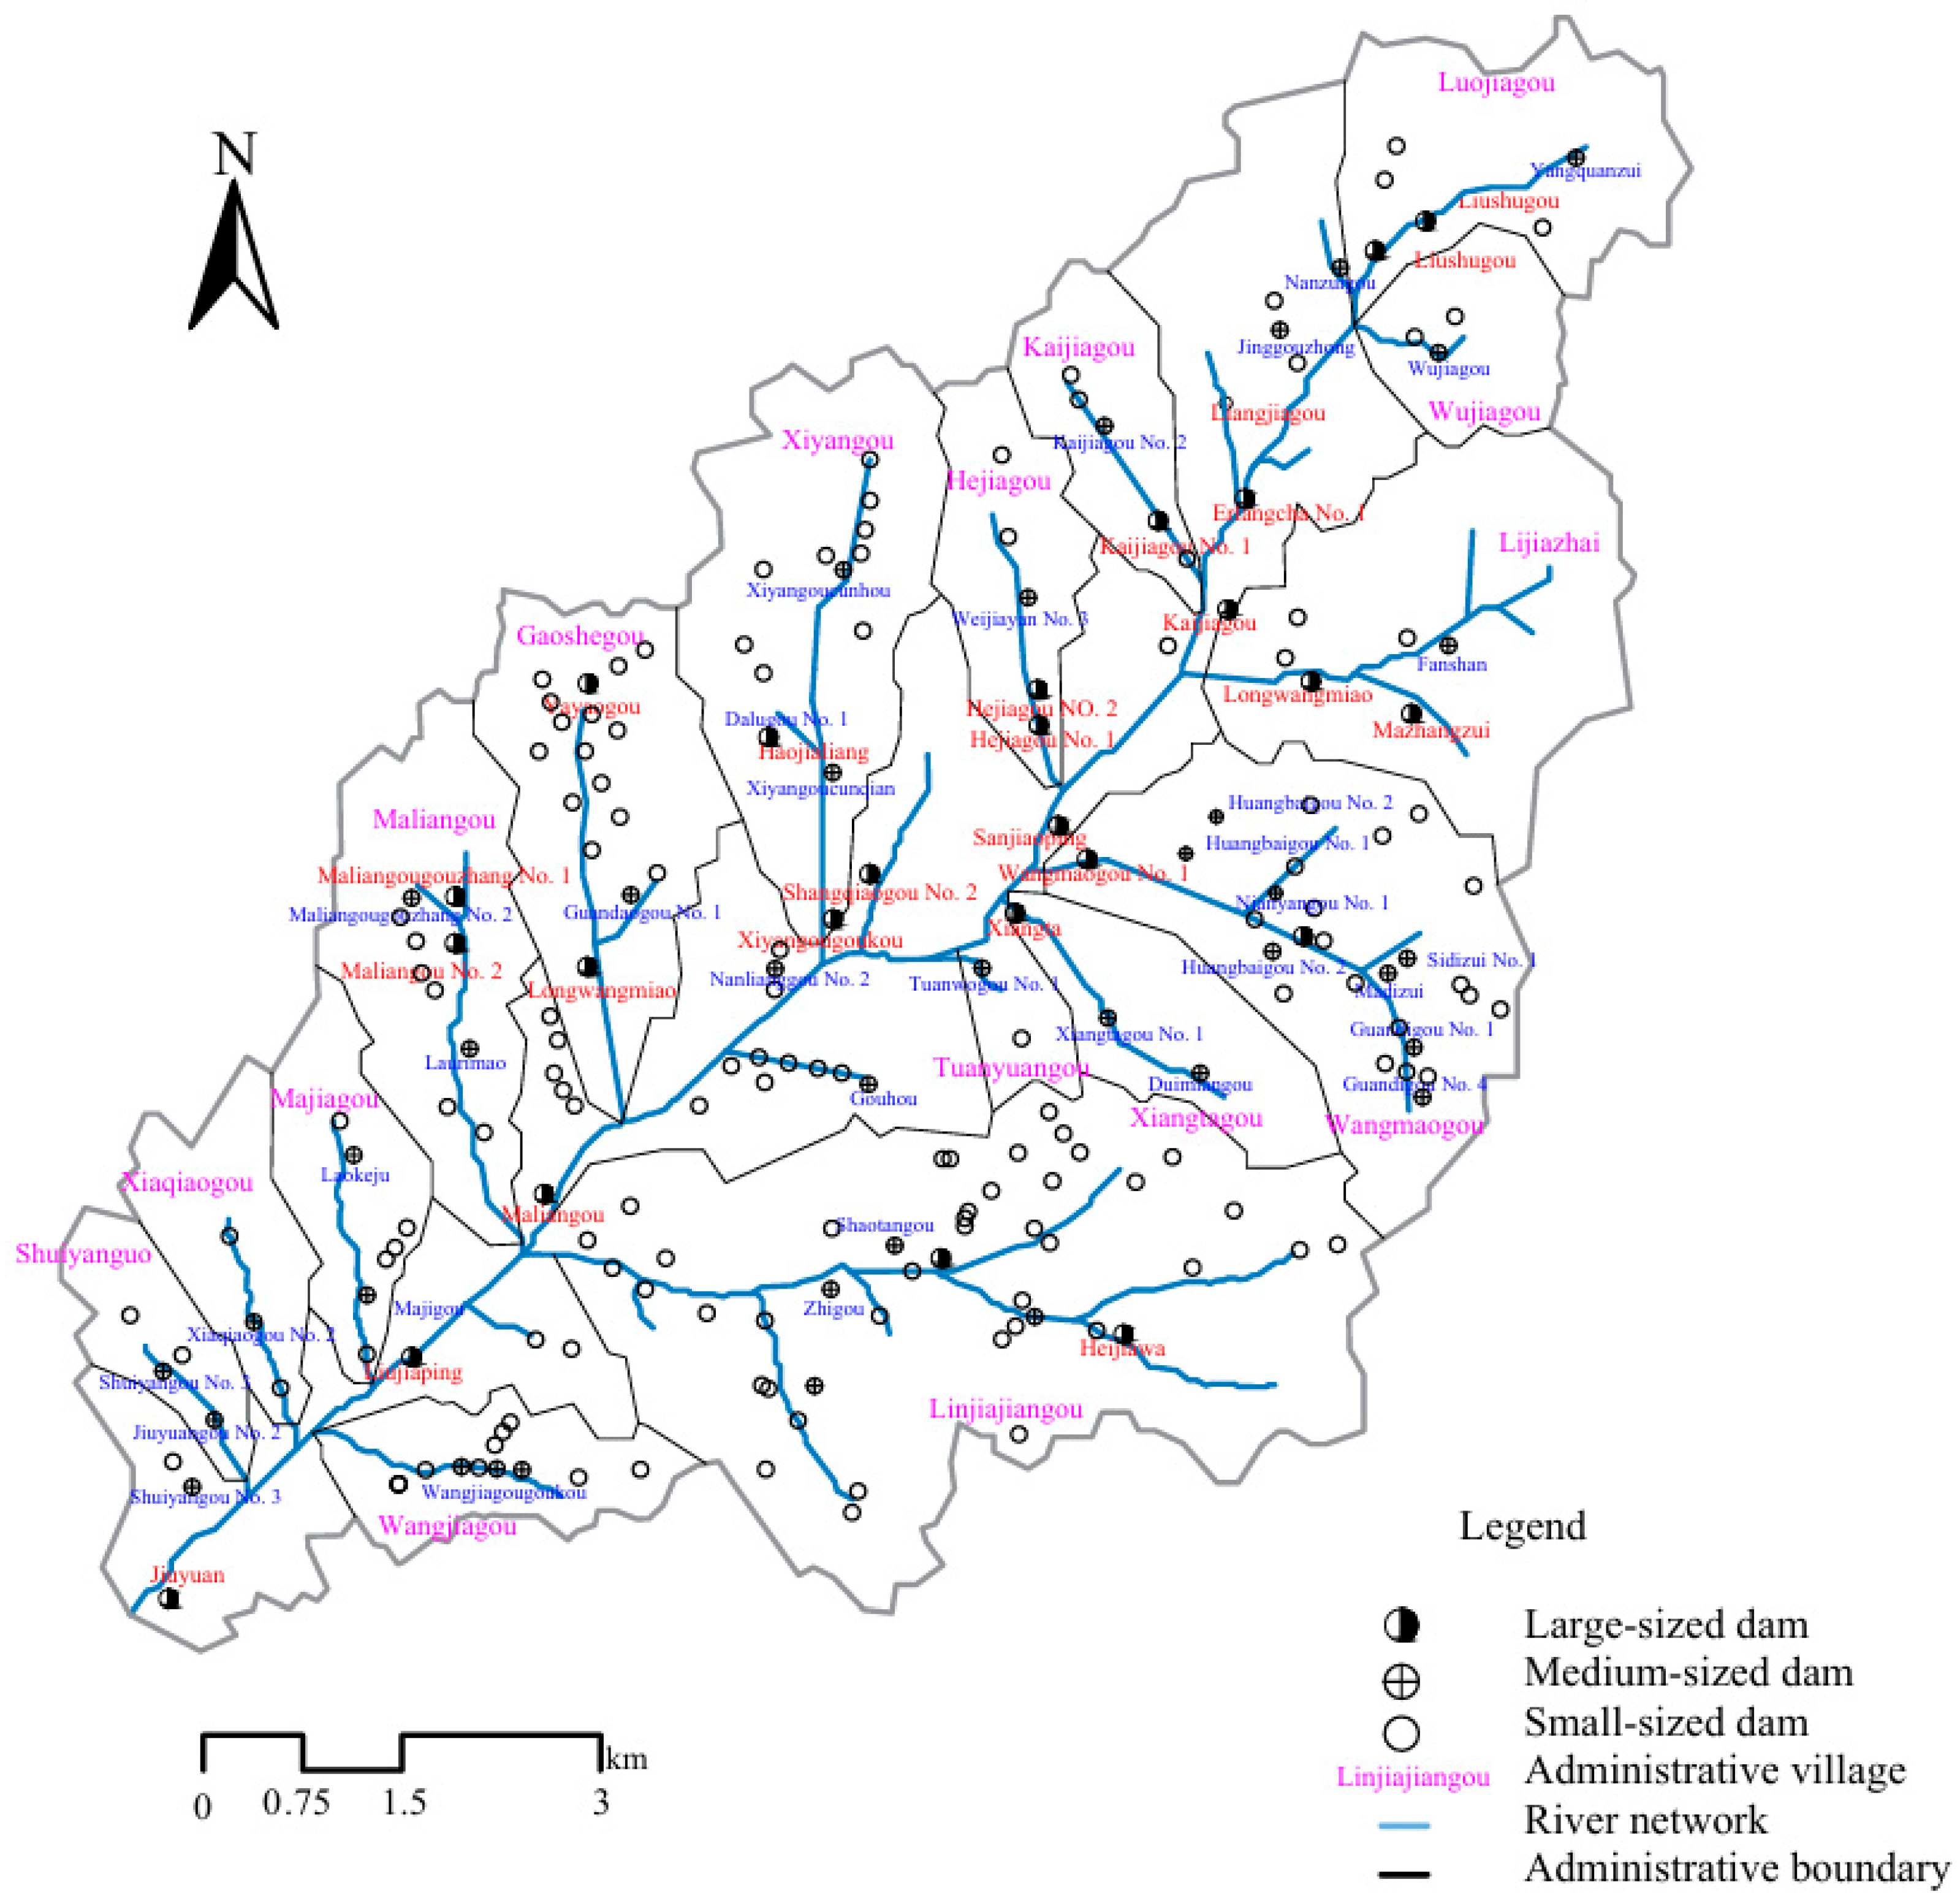
The check dams in the Jiuyuangou and Xiwuselang small watersheds were used as practical cases to validate the proposed monitoring technique for the water-filled status of check dams. The monitoring result based on remote sensing images in 2021 shows a good agreement with the actual number of check dams. This confirms the feasibility and reliability of the remote sensing-based monitoring technique for the water-filled status and safety management of check dams using the YOLOv3 algorithm and the optimized implementation procedure.

Author Contributions

Conceptualization, Z.X. and N.Z.; methodology, S.Y.; software, J.W.; validation, J.W. and F.Y.; formal analysis, Y.C.; investigation, Z.X.; resources, Z.X.; data curation, H.Z.; writing—original draft preparation, J.W. and S.Y.; writing—review and editing, S.Y.; visualization, Z.X.; supervision, S.Y.; project administration, S.Y. and N.Z.; funding acquisition, S.Y. All authors have read and agreed to the published version of the manuscript.

Funding

This research was funded by the National Natural Science Foundation of China, grant number U2443228; the National Natural Science Foundation of China, grant number 42330719; the Scientific and Technological Project of China Power Construction Co., Ltd., grant number DJ-ZDXM-2021-51; the Natural Science Basic Research Plan of Shaanxi Province, grant number 2022JQ-295; and the Major Scientific and Technological Project of the Ministry of Water Resources, grant number SKR-2022049. The APC was funded by the Scientific and Technological Project of China Power Construction Co., Ltd., grant number DJ-ZDXM-2021-51.

Data Availability Statement

The raw data supporting the conclusions of this article will be made available by the authors on request.

Conflicts of Interest

Authors Zhaohui Xia, Naichang Zhang, Yongxiang Cao, Fan Yue, and Heng Zhang were employed by the company PowerChina Northwest Engineering Corporation Limited. Author Jianqin Wang was employed by the company XCMG Hanyun Technologies Co., Ltd. The remaining authors declare that the research was conducted in the absence of any commercial or financial relationships that could be construed as a potential conflict of interest. The funders had no role in the design of this study; in the collection, analyses, or interpretation of data; in the writing of this manuscript; or in the decision to publish the results.

Abbreviations

The following abbreviations are used in this manuscript:
NDVINormalized difference vegetation index
TMThematic mapper
GISGeographic information system
YOLOv3You only look once version 3
YOLOYou only look once
SSDSingle-shot multibox detector
R-CNNRegion-based convolution neural network
TIFFTag image file format
JPGJoint photographic expert group
GDALGeospatial data abstraction library
VOCVisual object class
CDDMCheck dam detection model
WF-CDDMWater-filled check dam detection model
PMSPanchromatic/multi-spectral

References

  1. Niu, Y.G.; Wang, Y.; Li, Y.Q.; Zhang, H.X.; Peng, S.M. Research on water security layout and measures for ecological protection and high-quality development in the Yellow River Basin. Yellow River 2021, 43, 1–6. [Google Scholar]
  2. Cai, Q. Soil erosion and management on the Loess Plateau. J. Geogr. Sci. 2001, 11, 53–70. [Google Scholar] [CrossRef]
  3. Wei, X.; Li, Z.B.; Wu, J.H.; Li, B.B.; Du, Z. Discussion on several conceptual issues in the research of check dam damaged by floods. Res. Soil Water Conserv. 2007, 14, 154–156+159. [Google Scholar]
  4. Li, Z.G.; Cheng, H.; Fang, N.F.; Zeng, Y. Carbon sequestration, emission reduction, and capacity evaluation of check dams. J. Soil Water Conserv. 2023, 37, 1–6. [Google Scholar]
  5. Lucas-Borja, M.E.; Piton, G.; Yu, Y.; Castillo, C.; Zema, D.A. Check dams worldwide: Objectives, functions, effectiveness and undesired effects. Catena 2021, 204, 105390. [Google Scholar] [CrossRef]
  6. Liu, Y.L.; Wang, B.C. Strategic considerations for check dam construction in the Loess Plateau. China Soil Water Conserv. 2020, 2020, 48–52. [Google Scholar] [CrossRef]
  7. Wei, Y.H.; Wang, Z.J.; He, Z.; Yu, W.J.; Li, Y.J.; Jiao, J.Y. Investigation and evaluation of check dam damaged condition in the Yanhe River Basin during continuous rainstorms in July 2013. Bull. Soil Water Conserv. 2015, 35, 250–255. [Google Scholar]
  8. Wang, N.; Chen, Y.X.; Bai, L.C.; Wang, H.L.; Jiao, J.Y. Investigation of soil erosion in small watersheds caused by the “7·26” extreme rainstorm in Zizhou County, Northern Shaanxi Province. Bull. Soil Water Conserv. 2017, 37, 338–344. [Google Scholar]
  9. Zhang, Z.A.; Hou, J.M.; Liu, Z.Y.; Ma, L.P.; Li, Z.B.; Li, X.G. Numerical simulation on influence of check dam deposition on dam overtopping flood. J. Water Resour. Water Eng. 2019, 30, 148–153+158. [Google Scholar]
  10. Gong, X.H.; Zhang, Q.; Li, F. Application of fuzzy analytic hierarchy process in the risk assessment of check dams. J. Water Resour. Water Eng. 2022, 33, 131–137+147. [Google Scholar]
  11. Ministry of Water Resources of the People’s Republic of China. Notification on the issuance of construction and management methods for check dam projects in the Loess Plateau by the Ministry of Water Resources and the National Development and Reform Commission. Gazette Minist. Water Resour. People’s Repub. China 2022, 12–15. [Google Scholar]
  12. Xu, S.X. Deployment of the risk removal and reinforcement of dangerous check dams and engineering flood safety in the Loess Plateau region by the Ministry of Water Resources. China Soil Water Conserv. 2016, 409, 1-1. [Google Scholar] [CrossRef]
  13. SL/T 804-2020; Technical Specification for Check Dams. Ministry of Water Resources of the People’s Republic of China, China Water & Power Press: Beijing, China, 2021.
  14. Ministry of Water Resources of the People’s Republic of China. Notification on conducting risk and hazard investigations for medium and large check dams in the Loess Plateau region by the Ministry of Water Resources. Gazette Minist. Water Resour. People’s Repub. China 2021, 28–29. [Google Scholar]
  15. Central Committee of the Communist Party of China and the State Council. Guidelines for ecological protection and high-quality development in the Yellow River Basin. China Water Resour. 2021, 927, 3–16. [Google Scholar]
  16. Luo, X.C. Current status and development strategies for check dam construction in the Loess Plateau. China Soil Water Conserv. 2016, 414, 24–25. [Google Scholar] [CrossRef]
  17. Gao, Y.T.; Yang, S.J.; Dong, Y.L.; Ma, T.; Guo, J. Application of 3D laser scanning technology in the safety monitoring of gully banks of check dams. China Soil Water Conserv. 2021, 476, 62–64. [Google Scholar]
  18. Wang, Y.F.; Fu, B.J.; Hou, F.R.; Lv, Y.H.; Lu, X.P.; Song, C.J.; Luan, Y. Estimation of sediment volume trapped by check-dam based on differential GPS technique. Trans. Chin. Soc. Agric. Eng. 2009, 25, 79–83. [Google Scholar]
  19. Ma, S.Z.; Xu, J.Z.; He, M.Y.; Ding, L. Design and application of an automatic safety monitoring system for check dams in Henan Province. Bull. Soil Water Conserv. 2020, 40, 112–117. [Google Scholar]
  20. Yu, S.; Li, Y.Z.; Yao, X.F.; Wang, Z.J.; Yin, P.H.; Geng, S. Research and application of a risk warning and prevention platform for check dam systems. Bull. Soil Water Conserv. 2023, 43, 84–91. [Google Scholar]
  21. Li, Y.J.; Su, J.; Zhang, W. Monitoring practices in Yinzigou small watershed. China Soil Water Conserv. 2010, 341, 62–63. [Google Scholar]
  22. Li, B.Y.; Feng, Q.Y.; He, H.B.; Chen, L.; Chen, L.D. Extraction and analysis of feature information of typical small watershed check dams in the Loess Plateau gully region based on UAV tilt photogrammetry technology. J. Soil Water Conserv. 2023, 37, 91–96+103. [Google Scholar]
  23. Wang, Y.W.; Zhou, B.; Ma, T.; Tian, J.H.; Gao, Y.Y. Application of low-altitude UAV remote sensing technology in monitoring soil and water resources of check dams. China Soil Water Conserv. 2019, 10, 64–66. [Google Scholar]
  24. Mi, Z.J.; Mu, X.M.; Zhao, G.J. Extraction of check dam in the Huangfuchuan watershed based on multi-sources data. Arid Land Geogr. 2015, 38, 52–59. [Google Scholar]
  25. Zhang, Q.F.; Sun, C.J.; Xiang, Y.Y.; Li, J.; Liu, X.; Liang, J.R. Study on the characteristics of check dam land resources in soil erosion-sensitive areas of the middle reaches of the Yellow River based on remote sensing information. J. Earth Environ. 2022, 13, 357–368+379. [Google Scholar]
  26. Yang, X.; Xiang, Y.; Wang, Y.K.; Shen, G.Z. A dam safety state prediction and analysis method based on EMD-SSA-LSTM. Water 2024, 16, 395. [Google Scholar] [CrossRef]
  27. Hariri-Ardebili, M.A.; Mahdavi, G.; Nuss, L.K.; Lall, U. The role of artificial intelligence and digital technologies in dam engineering: Narrative review and outlook. Eng. Appl. Artif. Intell. 2023, 126 Pt A, 106813. [Google Scholar] [CrossRef]
  28. Skoulikaris, C.; Nagkoulis, N. A genetic algorithm’s novel rainfall distribution method for optimized hydrological modeling at basin scales. J. Hydroinform. 2024, 26, 1295–1312. [Google Scholar] [CrossRef]
  29. Li, Z.; Zheng, J.J.; Fu, Q.Y.; Li, Y. A Method for Extracting Water Level Inundation Lines of Large Reservoirs Based on Sub-Meter High-Resolution Remote Sensing Images. Patent CN111127405B, 4 August 2023. [Google Scholar]
  30. Zhang, J.L.; Fu, J.; Lei, T.J.; Li, X.Y.; Song, H.Q.; Chen, C.X. A Dynamic Monitoring System and Method for Reservoirs Based on Multi-Source Data. Patent CN112766146B, 29 November 2022. [Google Scholar]
  31. Yu, Y.F.; Li, Y.Q.; Wan, D.S.; Zhu, Y.L. A Method for Extracting Reservoir Water Bodies Based on Remote Sensing Images. Patent CN114821295A, 29 July 2022. [Google Scholar]
  32. Ozelkan, E. Water body detection analysis using NDWI indices derived from Landsat-8 OLI. Polish J. Environ. Stud. 2020, 29, 1759–1769. [Google Scholar] [CrossRef]
  33. Redmon, J.; Divvala, S.; Girshick, R.; Farhadi, A. You Only Look Once: Unified, real-time object detection. In Proceedings of the IEEE Conference on Computer Vision and Pattern Recognition, Las Vegas, NV, USA, 27–30 June 2016; pp. 779–788. [Google Scholar]
  34. Liu, W.; Anguelov, D.; Erhan, D.; Szegedy, C.; Reed, S.; Fu, C.Y.; Berg, A.C. SSD: Single shot multibox detector. In Proceedings of the European Conference on Computer Vision, Amsterdam, The Netherlands, 11–14 October 2016; Springer: Berlin/Heidelberg, Germany, 2016; pp. 21–37. [Google Scholar]
  35. Kim, T.Y.; Niaz, A.; Choi, J.S.; Choi, K.N. One-Stage Detection Model Based on Swin Transformer. IEEE Access 2024, 12, 60960–60972. [Google Scholar] [CrossRef]
  36. Girshick, R.; Donahue, J.; Darrell, T.; Malik, J. Rich feature hierarchies for accurate object detection and semantic segmentation. In Proceedings of the IEEE Conference on Computer Vision and Pattern Recognition, Columbus, OH, USA, 23–28 June 2014; pp. 580–587. [Google Scholar]
  37. Ren, S.; He, K.; Girshick, R.; Sun, J. Faster R-CNN: Towards real-time object detection with region proposal networks. IEEE Trans. Pattern Anal. Mach. Intell. 2017, 39, 1137–1149. [Google Scholar] [CrossRef]
  38. Redmon, J.; Farhadi, A. YOLOv3: An incremental improvement. arXiv 2018, arXiv:1804.02767. [Google Scholar]
  39. He, K.M.; Zhang, X.Y.; Ren, S.Q.; Su, J. Deep residual learning for image recognition. In Proceedings of the IEEE Conference on Computer Vision and Pattern Recognition, Las Vegas, NV, USA, 27–30 June 2016; pp. 770–778. [Google Scholar]
  40. Dong, W.X.; Liang, H.T.; Liu, G.Z.; Hu, Q.; Yu, X. Review of deep convolution applied to target detection algorithms. J. Front. Comput. Sci. Technol. 2022, 16, 1025–1042. [Google Scholar]
  41. Liu, Y.D.; Li, Q.Y.; Tan, H.; Qin, K.X. Application of the open-source GDAL library in image mosaicking. Digit. Technol. Appl. 2010, 2, 88–89. [Google Scholar]
  42. Zhao, Y.; Wang, S.Y.; Bi, H.Y.; Wang, H.; Yin, H. Key technologies for remote sensing image browsing based on GDAL. Comput. Eng. 2012, 38, 15–18+23. [Google Scholar]
  43. Ghosh, K.; Bellinger, C.; Corizzo, R.; Branco, P.; Krawczyk, B.; Japkowicz, N. The class imbalance problem in deep learning. Mach. Learn. 2024, 113, 4845–4901. [Google Scholar] [CrossRef]
  44. Tang, H.; Chen, J.; Zhang, W.; Guo, Z. Training acceleration method based on parameter freezing. Electronics 2024, 13, 2140. [Google Scholar] [CrossRef]
Figure 1. Flowchart of the buildup and optimization of the target detection model for the water status of check dams.
Water 17 02185 g001
Figure 2. Examples of detection and visualization results using the target detection model for check dams.
Water 17 02185 g002aWater 17 02185 g002b
Figure 3. Examples of detection and visualization results using the target detection model for water-filled check dams.
Water 17 02185 g003aWater 17 02185 g003b
Figure 4. Schematic illustration of the layout of clustered check dams in the Jiuyuangou watershed.
Water 17 02185 g004
Figure 5. Recognition results of the water-filled status of check dams in the Jiuyuangou watershed.
Water 17 02185 g005
Figure 6. Detection results of the water-filled status of the Liujiaping check dam.
Water 17 02185 g006
Figure 7. Schematic illustration of the layout of clustered check dams in the Xiwuselang watershed.
Water 17 02185 g007
Figure 8. Recognition results of the water-filled status of check dams in the Xiwuselang watershed.
Water 17 02185 g008
Figure 9. Detection results of the water-filled status of the Hulumiaogou No.1 check dam.
Water 17 02185 g009
Table 1. Parameters for tests.
ParameterMulti-Class StrategySingle Class Strategy
Training epochsFrozen training 5050
Unfrozen training5050
Initial learning rateFrozen training 0.00050.0005
Unfrozen training0.000050.00005
Batch sizeFrozen training 88
Unfrozen training44
DatasetsMulti-class target detection
dataset (categories include both water-filled and non-water-filled silt dams)
Single-class target detection dataset (category: check dams)
Single-class target detection dataset (category: water-filled check dams)
Table 2. Testing results using different training strategies.
ParameterMulti-Class StrategySingle Class Strategy
Precision (P)Water-filled check dams0.9474Check dams0.8989
Non-water-filled check dams0.8056Water-filled check dams0.9714
Recall (R)Water-filled check dams0.5806Check dams0.5839
Non-water-filled check dams0.4677Water-filled check dams0.4789
F1-Score Water-filled check dams0.72Check dams0.71
Non-water-filled check dams0.59Water-filled check dams0.64
Average Precision (AP)Water-filled check dams0.7424Check dams0.7735
Non-water-filled check dams0.5809Water-filled check dams0.7941
Mean Average Precision (mAP) 0.6616Check dams0.7735
Water-filled check dams0.7941
Table 3. Evaluation parameters for test results.
ParameterTraining Model
CDDMWF-CDDM
Precision (P)0.990.99
Recall (R)0.740.84
F1-Score0.840.91
Average Precision (AP)0.900.92
Mean Average Precision (mAP)0.900.92
Table 4. Related information on the remote sensing images of the Jiuyuangou small watershed.
No.Acquisition DateSatellite ModelSensorSpatial Resolution
15 January 2021GF1CMultispectral Camera PMS2 m
215 February 2021GF1CMultispectral Camera PMS2 m
311 March 2021GF1Multispectral Camera PMS22 m
417 April 2021GF1Multispectral Camera PMS22 m
58 May 2021GF1CMultispectral Camera PMS2 m
63 June 2021GF2Multispectral Camera PMS20.8 m
78 July 2021GF1Multispectral Camera PMS22 m
89 August 2021GF1BMultispectral Camera PMS2 m
98 September 2021GF1CMultispectral Camera PMS2 m
108 November 2021GF1Multispectral Camera PMS22 m
1118 November 2021GF1DMultispectral Camera PMS2 m
122 December 2021GF2Multispectral Camera PMS10.8 m
Table 5. Related information on the remote sensing images of the Xiwuselang small watershed.
No.Acquisition DateSatellite ModelSensorSpatial Resolution
125 January 2021GF1Multispectral Camera PMS22 m
215 February 2021GF1CMultispectral Camera PMS2 m
328 March 2021GF1DMultispectral Camera PMS2 m
417 April 2021GF1Multispectral Camera PMS22 m
528 May 2021GF1Multispectral Camera PMS22 m
63 June 2021GF2Multispectral Camera PMS1 and PMS20.8 m
73 July 2021GF1BMultispectral Camera PMS2 m
89 August 2021GF1BMultispectral Camera PMS2 m
98 September 2021GF1CMultispectral Camera PMS2 m
1030 September 2021GF6Multispectral Camera PMS2 m
112 December 2021GF2Multispectral Camera PMS10.8 m
Disclaimer/Publisher’s Note: The statements, opinions and data contained in all publications are solely those of the individual author(s) and contributor(s) and not of MDPI and/or the editor(s). MDPI and/or the editor(s) disclaim responsibility for any injury to people or property resulting from any ideas, methods, instructions or products referred to in the content.

