Article

Spatiotemporal Dynamics and Driving Factors of Phytoplankton Community Structure in the Liaoning Section of the Liao River Basin in 2010, 2015, and 2020

1
State Key Laboratory of Environmental Criteria and Risk Assessment, Chinese Research Academy of Environmental Sciences, Beijing 100012, China
2
Institute of Water Ecology and Environment, Chinese Research Academy of Environmental Sciences, Beijing 100012, China
3
School of Environmental Science, Liaoning University, Shenyang 110036, China
4
Key Laboratory of Ecological Restoration of Regional Contaminated Environment, Ministry of Education, College of Environment, Shenyang University, Shenyang 110044, China
*
Authors to whom correspondence should be addressed.
These two authors contributed equally to this work.
Water 2025, 17(15), 2182; https://doi.org/10.3390/w17152182
Submission received: 1 May 2025 / Revised: 16 July 2025 / Accepted: 17 July 2025 / Published: 22 July 2025
(This article belongs to the Special Issue Water Environment Pollution and Control, 4th Edition)

Abstract

This study aimed to analyse the spatiotemporal evolution of phytoplankton community dynamics and its underlying mechanisms in the Liaoning section of the Liao River Basin in 2010, 2015, and 2020. Phytoplankton species diversity increased significantly, with an increase from three phyla and 31 species in 2010 to six phyla and 74 species in 2020. Concurrent increases in α-diversity indicated continuous improvements in habitat heterogeneity. The community structure shifted from a diatom-dominated assemblage to a green algae–diatom co-dominated configuration, contributing to an enhanced water purification capacity. The upstream agricultural zone (Tieling section) had elevated biomass and low diversity, indicating persistent non-point-source pollution stress. The midstream urban–industrial zone (Shenyang–Anshan section) emerged as a phytoplankton diversity hotspot, likely due to expanding niche availability in response to point-source pollution control. The downstream wetland zone (Panjin section) exhibited significant biomass decline and delayed diversity recovery, shaped by the dual pressures of resource competition and habitat filtering. The driving mechanism of community succession shifted from nutrient-dominated factors (NH3-N, TN) to redox-sensitive factors (DO, pH). These findings support a ‘zoned–graded–staged’ ecological restoration strategy for the Liao River Basin and inform the use of phytoplankton as bioindicators in watershed monitoring networks.

1. Introduction

As key primary producers in aquatic ecosystems, phytoplankton are widely distributed in various water bodies globally [1]. Changes in their community structure and dynamics impact the health and function of aquatic ecosystems. Phytoplankton comprise a diverse array of species, predominantly including Bacillariophyta, Cyanobacteria, Chlorophyta, and Euglenophyta. These organisms are characterised by short life cycles and rapid reproductive rates, enabling them to promptly respond to environmental changes. Consequently, they are widely regarded as sensitive indicator organisms for variations in water environments [2,3,4]. Recent studies have shown that the spatiotemporal distribution of phytoplankton in large rivers displays pronounced gradient differentiation, with community succession being intricately linked to environmental factors via complex non-linear relationships. An in-depth analysis of such response mechanisms holds scientific importance in revealing the evolution of aquatic ecosystems and guiding ecological restoration [4,5].
The Liao River Basin, a typical composite pollution river in Northeast China, supports multiple overlapping land-use functions, including heavy industrial development zones (Shenyang–Anshan urban agglomeration), main grain production areas (Liao Plain irrigation district), and ecologically sensitive zones (Panjin Wetland). Although the overall water quality has improved through systematic management since establishing the Liao Protection Zone in 2010, point-source and non-point-source composite pollution still constantly stress the aquatic ecosystem. Previous studies on the basin have mainly focused on local areas such as estuaries and tributaries, and a systematic analysis of the 516 km continuous longitudinal gradient of the main stream is lacking [1,6,7]. Moreover, short-term monitoring has failed to capture the delayed ecological responses of phytoplankton communities to management interventions. This knowledge gap hinders the identification of region-specific ecological thresholds across different river sections (e.g., upstream agricultural non-point-source areas, middle industrial point-source areas, and downstream wetland buffer zones). Consequently, developing predictive response models that link phytoplankton community indicators with hydrological and water quality parameters remains a considerable challenge. These issues restrict the construction of a governance system for water quality, aquatic ecology, and water services at the basin scale.
In this study, we aimed to systematically analyse the spatiotemporal dynamics and driving factors of the evolution of phytoplankton communities in the Liaoning section of the Liao River Basin by integrating whole-basin gradient and long-term sequence analyses. We constructed a three-dimensional system to evaluate species diversity (Shannon–Wiener diversity index, Margalef’s richness index and Pielou’s evenness index) based on phytoplankton and water parameter data from 16 representative sections of the main stream of the Liao River from 2010 to 2020. We coupled redundancy analysis (RDA) with a variance decomposition model to explore variations in the community structure of phytoplankton and the impact of environmental factors. Our results provide theoretical support for formulating a ‘zoning–grading–phasing’ ecological restoration strategy in the Liao River Basin and a scientific basis for constructing an intelligent network to monitor the aquatic ecology of large rivers.

2. Materials and Methods
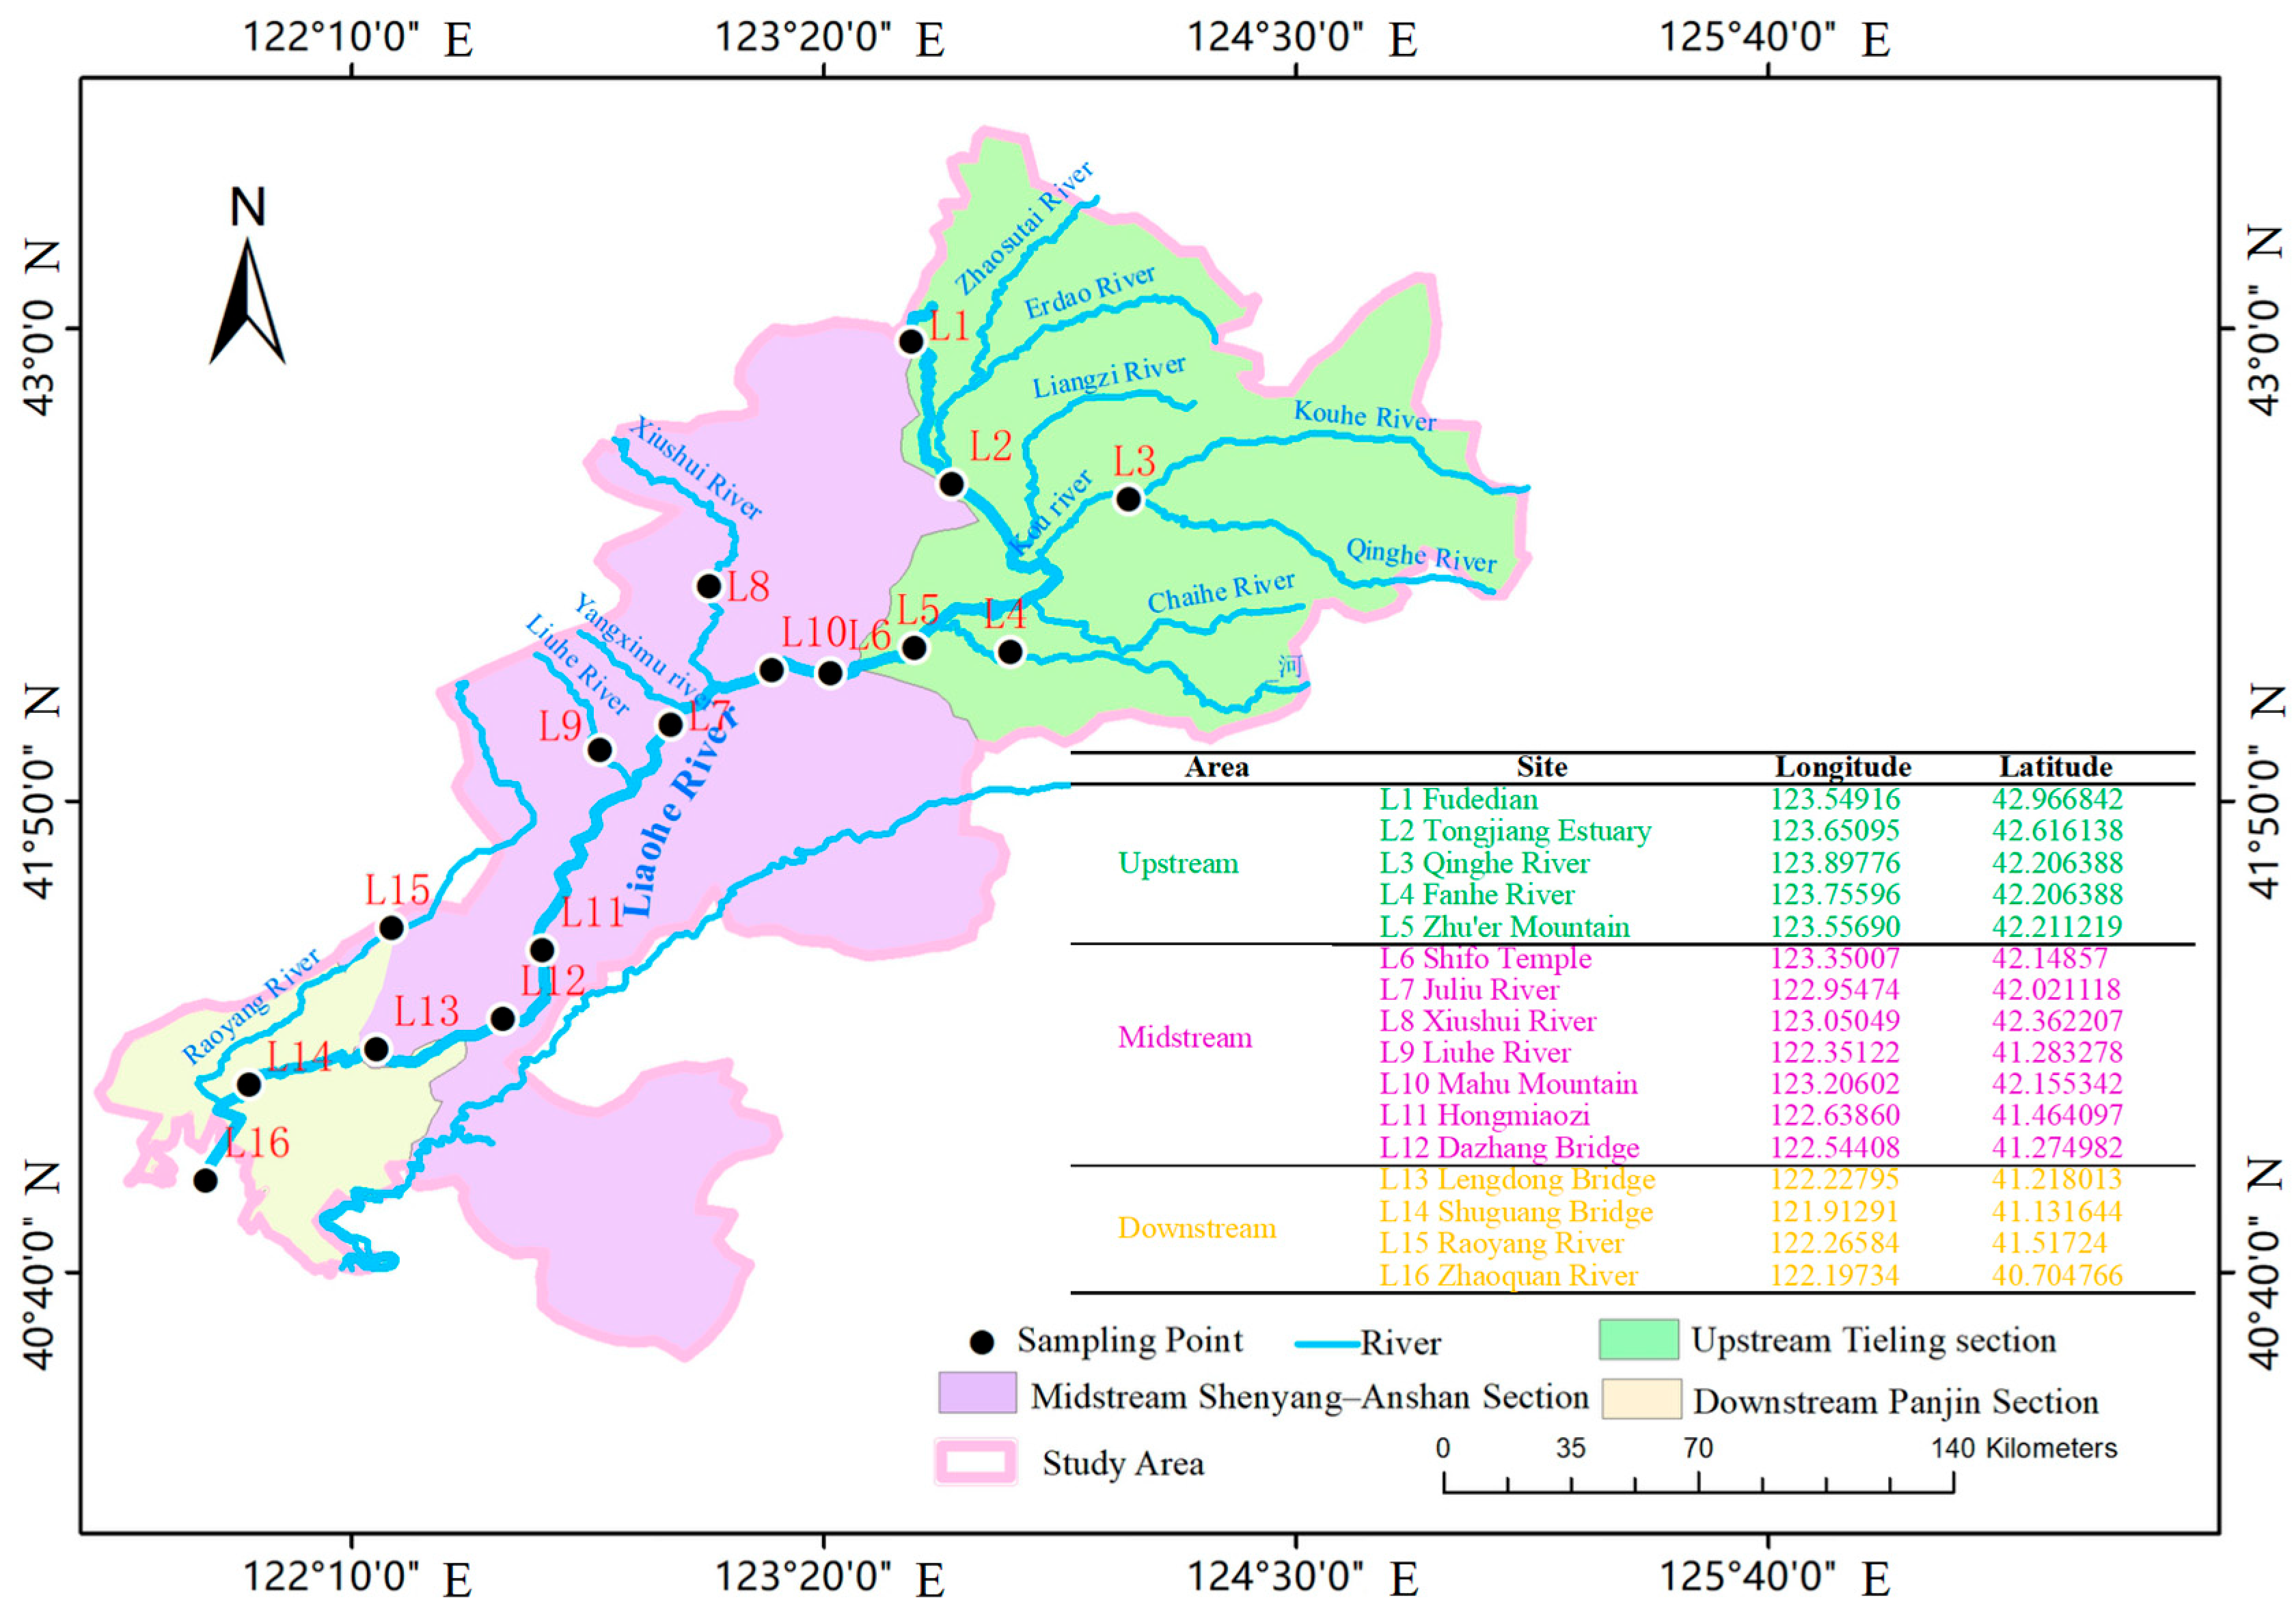
2.1. Study Area

The Liaoning section of the Liao River originates from the confluence of the East Liao and West Liao rivers at Fudedian Station in Changtu County, Liaoning Province. It flows through Tieling, Shenyang, Anshan, and Panjin, and finally empties into the Bohai Sea at the Liao Estuary in Panjin, with a total length of approximately 516 km [8]. Considering the spatial differentiation of physical geographical features and socioeconomic activities in the Liaoning section of the Liao River Basin, we identified 16 representative sampling sections along a longitudinal gradient (from upstream to downstream) using a combination of the systematic grid and key node methods (Figure 1). Five sampling sections were in the upstream Tieling section (Fudedian Station–Zhu’ershan region), which is dominated by agriculture and substantially affected by agricultural non-point-source pollution. Seven sections were in the midstream Shenyang–Anshan section (Shifo Temple–Dazhang Bridge region), which is dominated by industry and urban built-up areas and is mainly affected by point-source pollution from urban domestic sewage and industrial wastewater. Four sections were in the downstream Panjin section (Lengdong Bridge–Zhaoquan River region), which is dominated by agricultural activities and wetland ecosystems. Phytoplankton samples were continuously collected from the 16 sampling sections during the wet season (July) of 2010, 2015, and 2020, with an interval of no more than 7 d (Table S1) to ensure data representativeness and continuity [9,10,11]. Key water physicochemical indices were synchronously measured at the same points. Each sampling covered all 16 sections, with two samples collected from each section for averaging, resulting in 96 phytoplankton samples collected during the entire study period. We specifically chose July for sampling, as more than 80% of the annual phytoplankton biomass has historically accumulated by that period [12]. Sampling was carried out simultaneously during a hydraulic stationary period (flow rate: <1 m/s, water temperature: 22 ± 2 °C) to minimise the influence of transient hydrological disturbances [13,14].

2.2. Sample Collection and Analytical Methods

2.2.1. Collection and Identification of Phytoplankton

The sequence of sample collection was established as quantitative followed by qualitative to maintain the original state of the phytoplankton. For quantitative samples, a plexiglass water sampler (1 L capacity, Shanghai Kezhi Environment Technology Co., Ltd., Shanghai, China) was utilised to collect water samples at 0.5–1.0 m below the water surface. The samples were immediately fixed on-site by adding 1.5% Lugol’s iodine (Sinopharm Chemical Reagent Co., Ltd., Shanghai, China). The water samples were allowed to settle for 48 h, after which, they were syphoned and concentrated into 50 mL brown bottles, which were subsequently stored in refrigeration and shielded from light exposure. For identification, 0.1 mL of the concentrate was placed in a phytoplankton counting frame (0.1 mm depth) and examined under an Olympus CX43 light microscope (10 × 40 magnification; Olympus Corporation, Tokyo, Japan) for whole-slice identification. Species identification was based on the relevant literature [7,15,16,17]. Qualitative samples were collected using a No. 25 plankton net (mesh diameter: 64 µm; Beijing Purity Instrument Co., Ltd., Beijing, China), applying a figure eight-shaped movement in the water for 2–5 min. The samples were stored in 100 mL bottles, fixed in 10% methanol solution (methanol, ≥99.9%; Sinopharm Chemical Reagent Co., Ltd., Shanghai, China), and identified in the laboratory using an optical microscope (10 × 40 magnification; Olympus Corporation, Tokyo, Japan).

2.2.2. Determination of Physical and Chemical Indicators in Surface Water

A YSI6600 multi-parameter water quality detector (Yellow Springs Instruments, Yellow Springs, Ohio, USA) measured physicochemical parameters such as dissolved oxygen (DO) and pH on-site. Chemical oxygen demand (CODCr) was determined using the alkaline potassium permanganate method (GB11892-89), and the five-day biochemical oxygen demand (BOD5) was determined using the dilution and inoculation method (HJ 505-2009). We determined the NH3-N content using Nessler’s reagent colorimetry (GB7479-87), total nitrogen (TN) using alkaline potassium persulfate digestion–ultraviolet spectrophotometry (GB11894-89), and total phosphorus (TP) using ammonium molybdate spectrophotometry (GB11893-89).Flow velocity was measured using a flow meter (LS1206B, Chongqing Huazheng Hydrological Instrument Co., Ltd., Chongqing, China).

2.3. Data Processing and Analysis

2.3.1. Analysis of Community Diversity

To characterise the phytoplankton community structure, we calculated the Shannon–Wiener diversity (H′), Pielou’s evenness (J), Margalef’s richness (d), and the dominance (Y) indices using the following equations:
H = i = 1 S ( n i n ) l n n i n
J = H ln ( S )
d = S     1 ln ( N )
Y   = N i   ×   f i N
where S is the total number of phytoplankton species; n is the total number of phytoplankton individuals; ni is the number of individuals of the i-th phytoplankton species; N is the total number of individuals of all species; fi is the frequency of occurrence of species i at all sample sites; and Ni is the total number of species i in the sample. Species with Y ≥ 0.02 are considered dominant species [18,19,20,21,22].

2.3.2. Statistical Analysis

Independent sample t-tests were performed using SPSS 24.0 software to assess significant differences in phytoplankton community characteristics or environmental factors between sampling sites. Based on the data distribution requirements of the parametric tests, all environmental factors, except for pH, were log(x + 1)-transformed to satisfy normality and homogeneity of variance assumptions [23]. Additionally, we employed RDA to examine the relationships between environmental factors and phytoplankton community structure. As a direct gradient analysis method, RDA quantifies the explanatory power of environmental factors for species distribution through linear model ordination, thereby facilitating a clear understanding of their influence on phytoplankton community structure [24,25]. The proportion of variance in phytoplankton community structure explained by environmental factors was quantified via permutation tests. Canoco 5 software performed RDA-constrained ordination on a matrix of the main environmental factors and dominant phytoplankton species; this enabled us to visually present the distribution of the phytoplankton community structure along environmental factor gradients.

2.3.3. Evaluation Methodology

The phytoplankton diversity index is commonly used to determine the water quality status of rivers. The specific criteria are presented in Table 1 [24,26].

3. Results

3.1. Physical and Chemical Indicators of Surface Water Quality

The physicochemical parameters of water in the Liaoning section of the Liao River Basin exhibited considerable spatial and temporal differentiation from 2010 to 2020 (Figure 2 and Figure 3). The longitudinal analysis revealed that the overall pH was weakly alkaline (7.2–8.3). However, a decreasing trend was observed throughout the treatment process, with a reduction of 0.3–0.5 units in 2020 compared with the value in 2010. This decrease may be attributed to the decreased input of acidic pollutants into the watershed and alterations in the buffering system. The DO concentration increased from 6.5 mg/L (2010) to 7.9 mg/L (2020), reflecting the synergistic enhancement of the river’s self-purification ability and reoxygenation efficiency. The organic pollution load exhibited a characteristic progression of rapid reduction, local rebound, and systematic improvement. The average CODCr decreased from 30.56 mg/L (2010) to 20.7 mg/L (2020), with a reduction rate of 32.3%. In 2020, 18% of the measured CODCr concentrations exceeded the recommended threshold for surface water quality (20 mg/L). The BOD5 showed an inverted V-shaped fluctuation, with the CODCr decreasing from 5.18 mg/L (2010) to 3.12 mg/L (2020). Nitrogen pollution exhibited notable point-source-dominant characteristics, with NH3-N concentrations reaching a peak in 2015 (130% higher than in 2010). Meanwhile, TN and TP exhibited differential responses; by 2020, TP concentrations decreased to below 0.5 mg/L (the recommended threshold for eutrophication control) following systematic management. TN reduction remained insufficient, with concentrations consistently exceeding 1.0 mg/L [27].
The spatial heterogeneity of water physicochemical indices in the Tieling section of the Liao River Basin was driven by pollution sources (Figure 3). Based on the 16 sampling sections, pollution-sensitive indicators (CODCr, NH3-N, TN, and TP) exhibited a typical spatial pattern along the river: values were the highest in upstream sections and the lowest in midstream sections, and they fluctuated below the peak values in downstream sections. Other physicochemical parameters (e.g., pH and BOD5) showed no apparent spatial gradient. The core nutrient-enrichment zone is the upstream Tieling section (agricultural non-point-source area). Notably, at sampling point L2, NH3-N (2.44 mg/L), TN (6.66 mg/L), and TP (0.26 mg/L) reached basin-wide maxima, reflecting pollution characteristics driven by cropland fertilisation and surface runoff. Effective point-source pollution control in the midstream Shenyang–Anshan section (urban industrial zone) led to markedly lower nutrient concentrations than those in the upstream and downstream areas. Basin-wide minimum values for TN (0.51 mg/L) and NH3-N (0.70 mg/L) were recorded at site L11, primarily attributed to centralised sewage treatment and reduced industrial wastewater emissions. In the downstream Panjin section (agricultural–wetland system), organic pollution loads reached basin-wide peaks at L14, as indicated by the CODCr (32.38 mg/L) and BOD5 (6.68 mg/L) levels. These peaks coincided spatially with a DO valley (7.34 mg/L), indicating organic matter accumulation due to hydrological retention in wetlands. Additionally, downstream TN and TP levels decreased by 40–60% relative to upstream values, likely because wetland purification offset partial non-point-source inputs.

3.2. Changes in Phytoplankton Community Structure

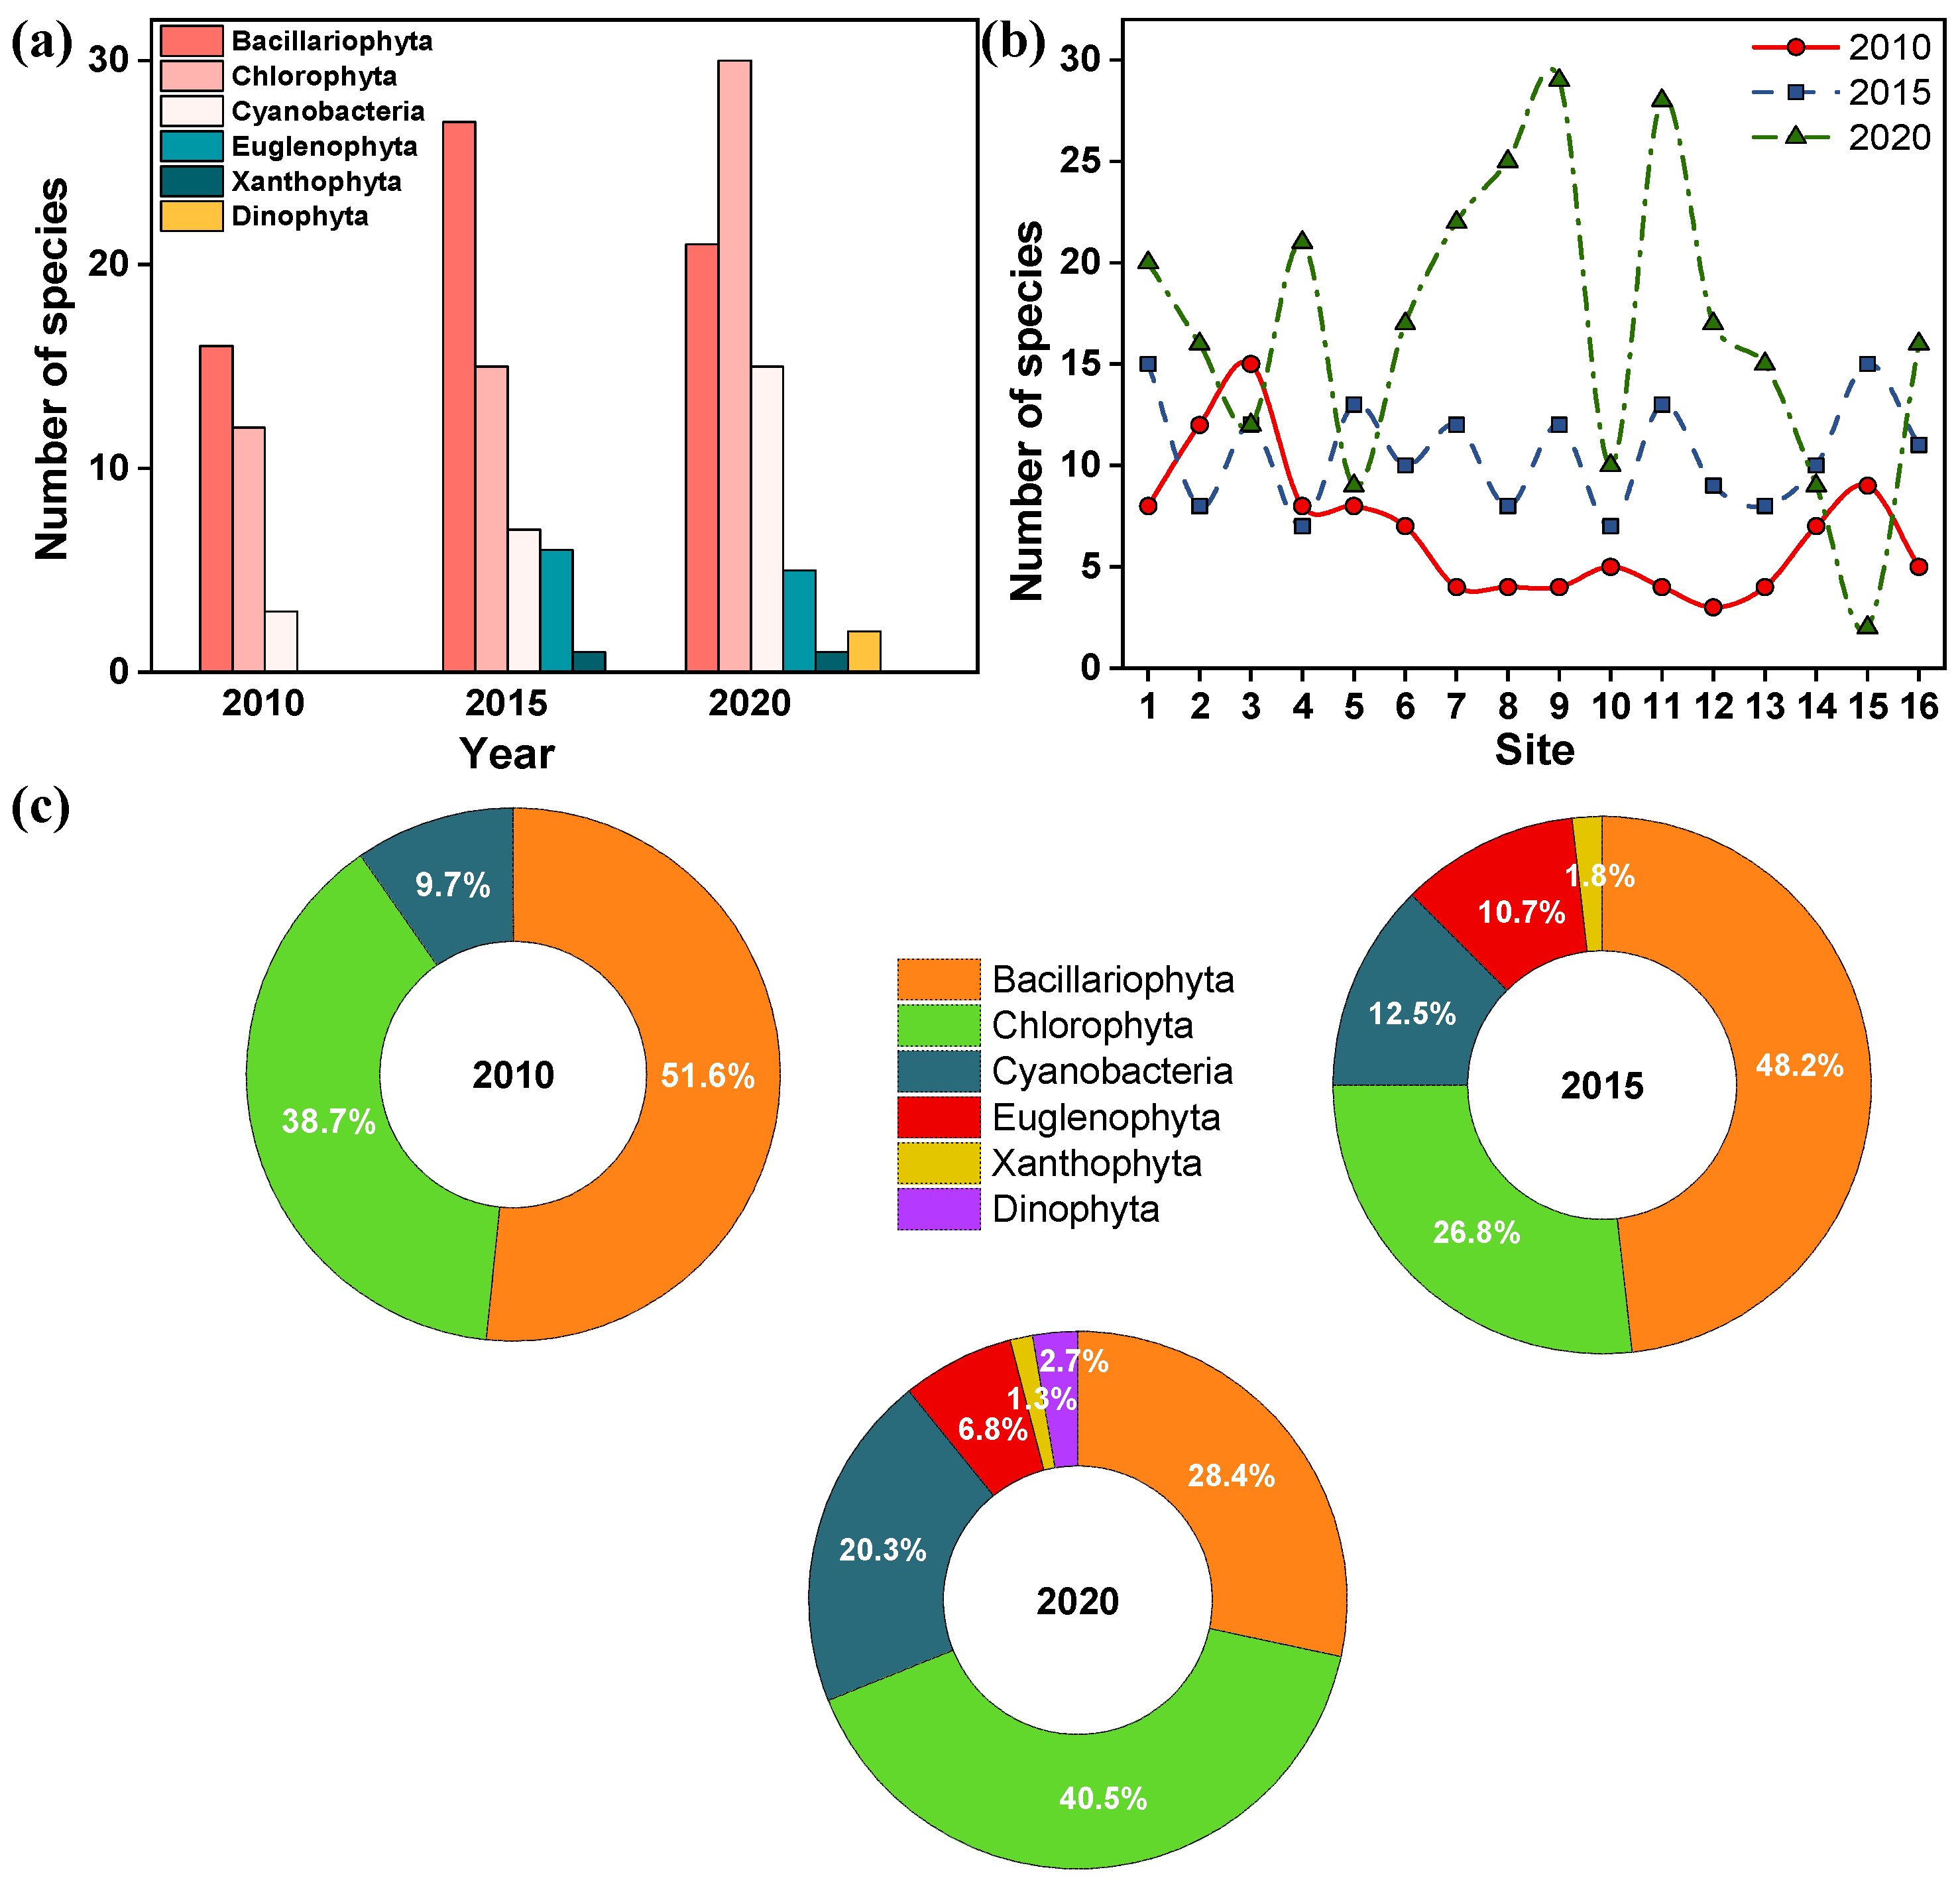
3.2.1. Species Composition

Analysing long-term ecological monitoring data from 16 monitoring transects in the Liaoning section of the Liao River Basin from 2010 to 2020 indicated a significant trend in biodiversity recovery and community reconstruction within the phytoplankton community (Figure 4a). We utilised the morphological–molecular marker association technique for species identification, revealing an increase in taxonomic units from three phyla, five orders, seven classes, 11 families, 22 genera, and 31 species (2010) to six phyla, eight orders, 12 classes, 22 families, 42 genera, and 74 species (2020) [28]. The average annual growth rate of species richness was 8.2%, indicating a continuous improvement in habitat heterogeneity within the basin. The succession of dominant taxa exhibited stage-specific characteristics, with Bacillariophyta demonstrating absolute dominance in the early stage, particularly represented by Stephanocyclus meneghinianus (Kützing) Kulikovskiy, Genkal & Kociolek. However, its dominance significantly declined during treatment (28.4% in 2020, a decrease of 44.9%). Occasional species displayed varying growth rates in 2015 and 2020, with their average species richness increasing by 9.3% (12.5% in 2010–2015, 5.7% in 2015–2020). The restoration of these species in 2015 and 2020 occurred to different degrees, indicating an important shift in the trophic structure of the water body. During the same period, the proportion of Cyanobacteria increased from 9.7% to 20.3% (with an average annual growth rate of 4.5%). Additionally, Chlorophyta surpassed Bacillariophyta as the dominant group in 2020, with a proportion of 40.5%. The phytoplankton community composition in the Liaoning section of Liao River Basin shifted from predominantly Bacillariophyta to co-dominant Chlorophyta and Bacillariophyta, indicating increased abundance and diversity within the community structure.
The spatial distribution pattern (Figure 4b) indicates that the recovery process of phytoplankton communities in the Liaoning section of the Liao River Basin was more efficient in the middle and lower reaches than in the upstream reaches, aligning closely with the predefined tripartite spatial framework. Based on quarterly sampling data from 2010, 2015, and 2020, the upper reaches (Tieling section; agricultural non-point-source area) exhibited suppressed recovery, with species richness remaining below 20; this reflects the impact of sustained stress from agricultural non-point-source pollution on sensitive algal taxa. The middle reaches (Shenyang–Anshan section) exhibited marked ecological recovery, with species richness increasing exponentially from a mean of 5 species (2010) to 17 species (2020). At key sites, such as L9 (Liuhe River) and L11 (Hongmiaozi), species counts reached 28–29, highlighting the effectiveness of point-source pollution control (e.g., industrial/urban wastewater) in expanding available ecological niches. The lower reaches (Panjin section; agricultural–wetland system) displayed more gradual recovery, with 23 species in 2020. At site L14 (Zhaoquanhe Wetland), 27 species were recorded, underscoring the critical role of wetlands in maintaining phytoplankton diversity.

3.2.2. Advantageous Species Change

From 2010 to 2020, the phytoplankton community in the Liao River Basin underwent a significant transition from a diatom-dominated community to a multi-phylum community (Table S2). In 2010, during the single-dominance period of Bacillariophyta, the phytoplankton community across the entire basin was dominated by Bacillariophyta (accounting for 51.6%), with S. meneghinianus (Y = 0.29) and U. acus (Y = 0.21) forming the only dominant species combination, indicating a highly simplified community structure. In 2015, Bacillariophyta maintained the dominant position, but interspecific competition intensified. The dominance of U. acus decreased to 0.17, while new dominant species emerged, including Ulnaria ulna (Nitzsch) Compère (Y = 0.22) and Diadesmis sp. (Y = 0.20), indicating ecological niche differentiation within the diatom community. In 2020, four phyla dominated: Bacillariophyta, Euglenophyta, Cyanobacteria, and Chlorophyta (H′ increased from 1 to 4). Dominant species included Aulacoseira granulata (Ehrenberg) Simonsen (Y = 0.02), Gymnodinium fuscum (Ehrenberg) F. Stein (Y = 0.03), Leptolyngbya tenuis (Gomont) Anagnostidis & Komárek (Y = 0.07), and Scenedesmus quadricauda (Turpin) Brébisson (Y = 0.03). However, the core species S. meneghinianus surged from 0.29 in 2010 to 0.53 in 2020, reflecting its strong environmental stress tolerance in the Liao River. Additionally, the emergence of new dominant phyla signifies a transition from the dominance of Bacillariophyta to a synergy of multiple functional phyla, which effectively enhanced the water-quality purification potential and ecosystem stability of the river.

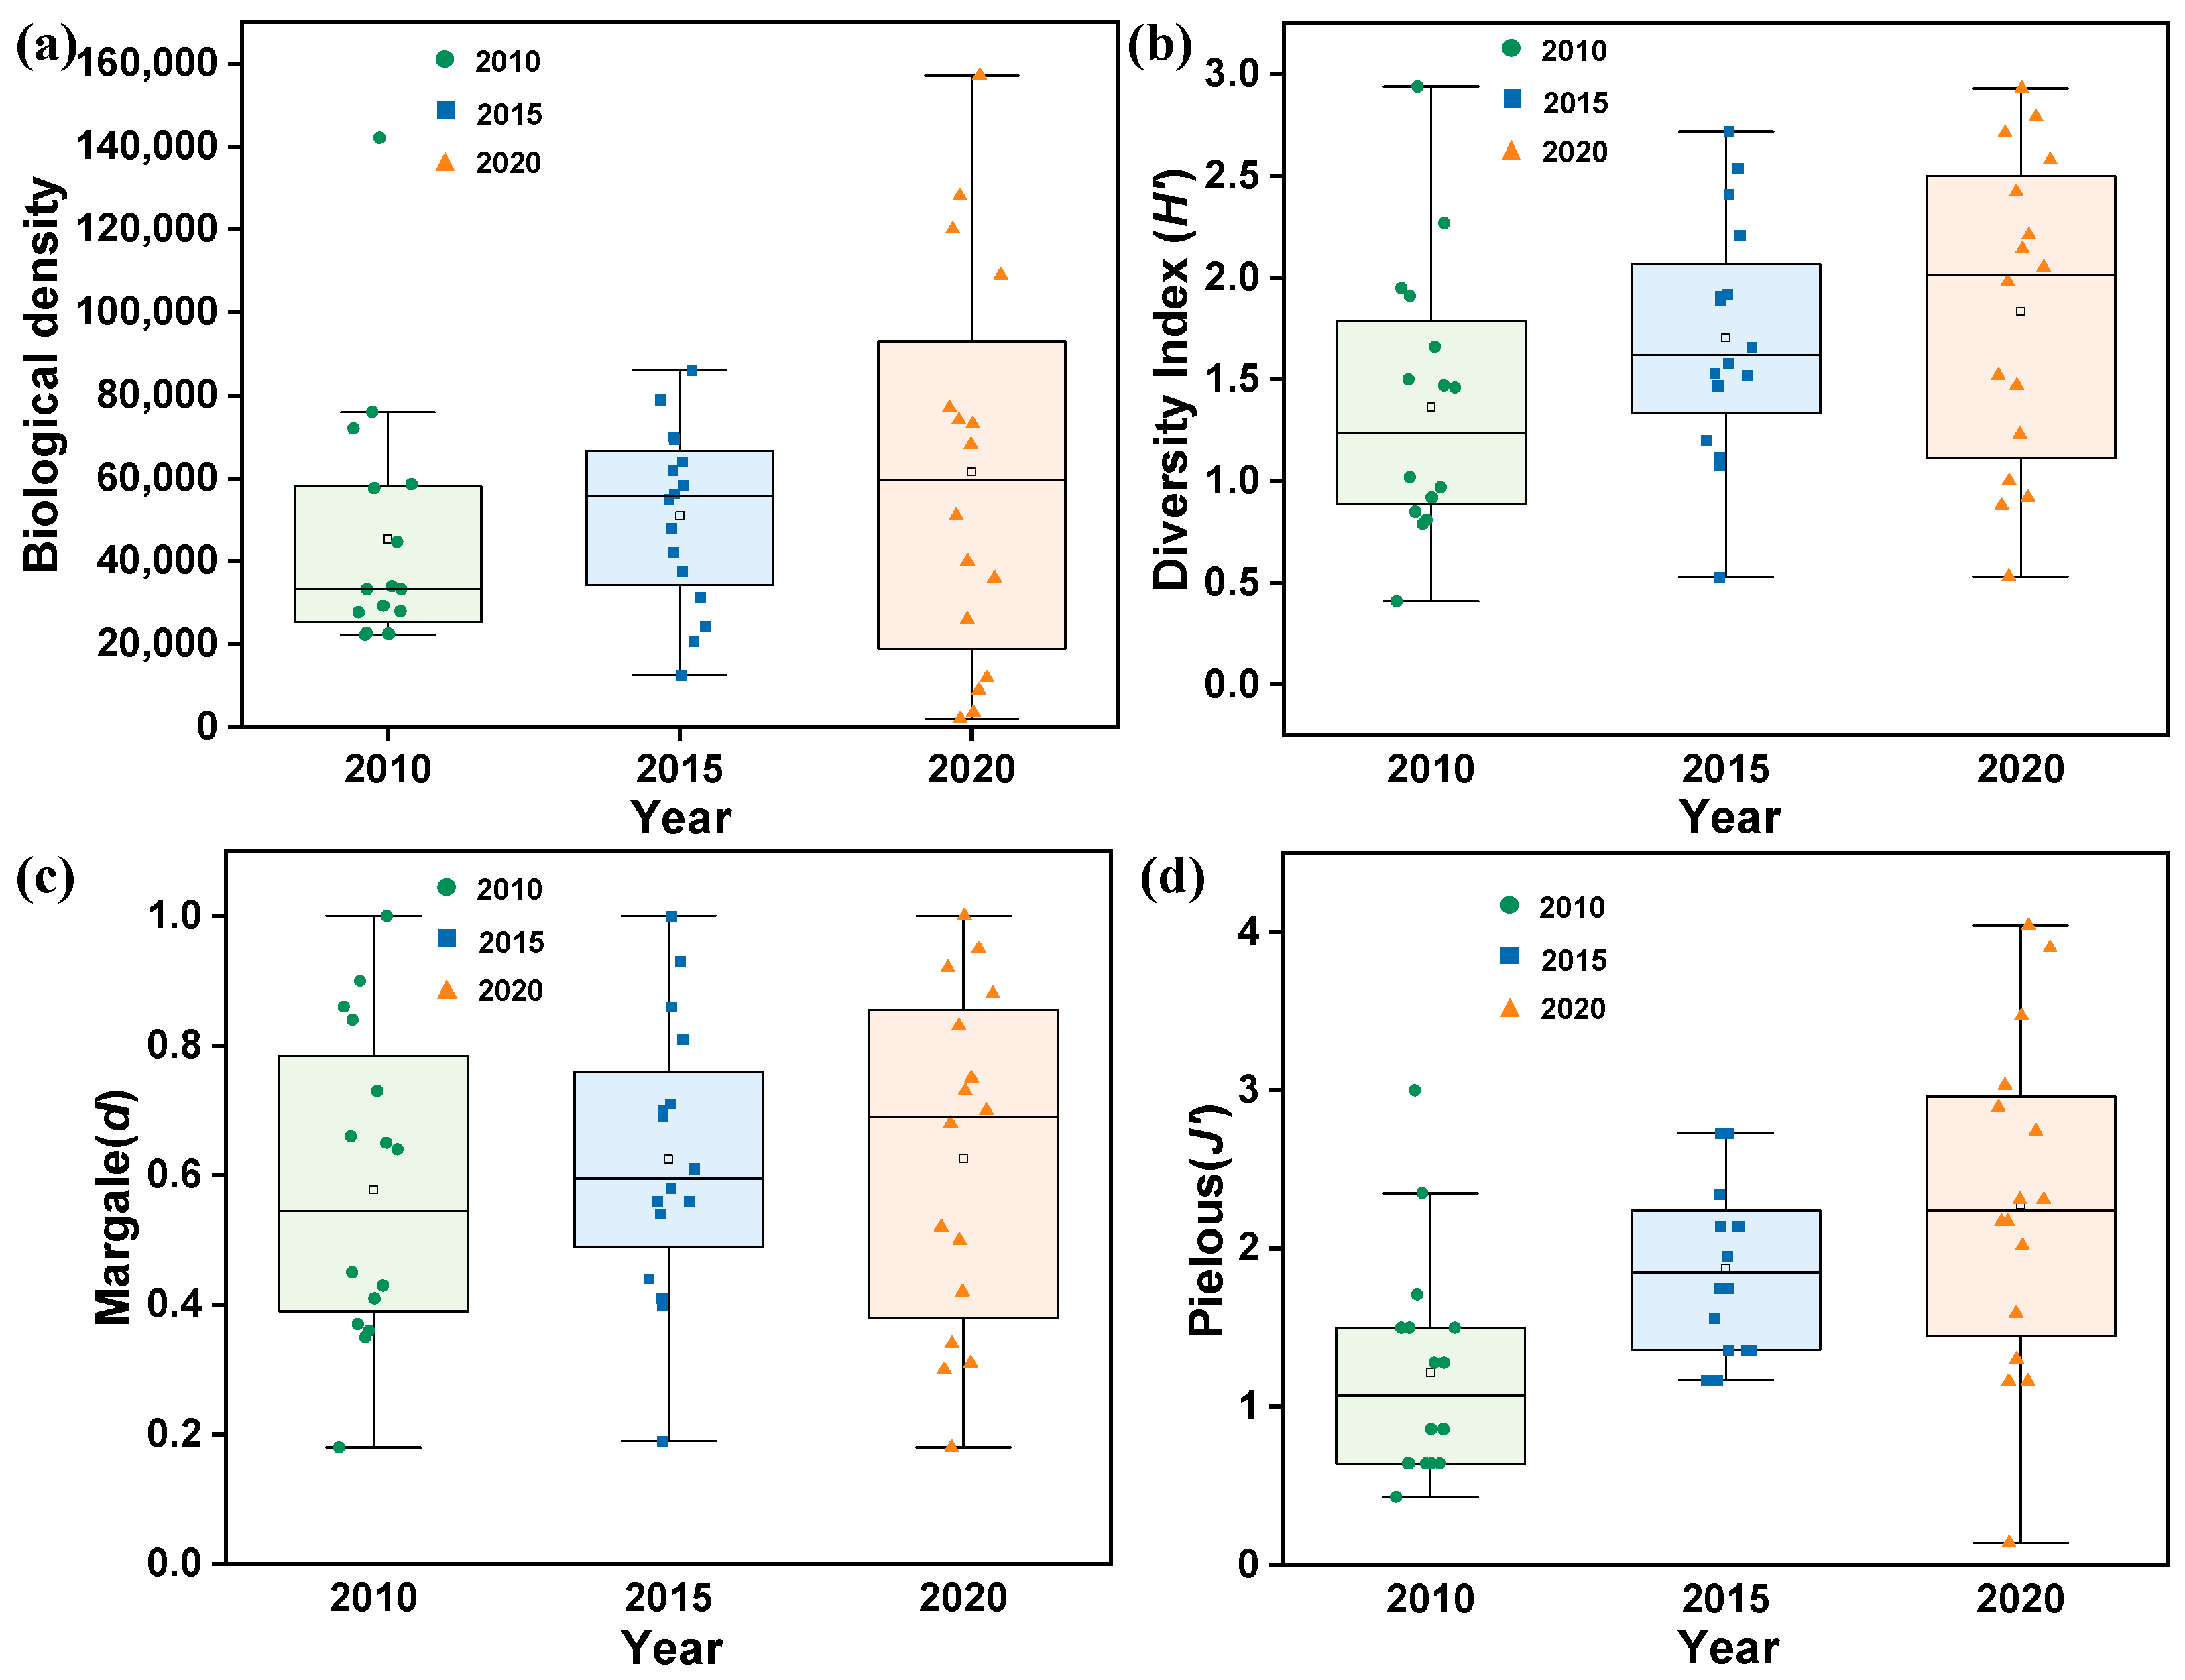
3.3. Changes in Biological Density and Diversity Indices

During the study period (2010–2020), the phytoplankton community in the main stream of the Liao River showed systematic structural-complexity and functional-consistency optimisation (Figure 5); this indicates a transition in the community structure from dominance by a single species to a stable state characterised by multi-species synergistic symbiosis. Biological density and diversity indicators (H′, d, and J′) showed a significant upward trend (p < 0.05). The phytoplankton density increased from 45, 406 to 61, 600 species/mL from 2010 to 2020, representing increases of 28.4% (2010–2015) and 5.6% (2015–2020); this suggests a transition in the community dynamics from quantity expansion to quality optimisation. Diversity increased from 1.30 ± 0.55 to 1.84 ± 0.77, with an average annual growth rate of 4.2%. Richness increased from 1.22 ± 0.71 to 2.27 ± 1.06, with Chlorophyta accounting for 32.6% of the newly added species. Evenness increased from 0.58 ± 0.24 to 0.63 ± 0.26, indicating the equalisation of resources and a transition from quantity expansion to quality optimisation.
The phytoplankton community in the Liaoning section of the Liao River displayed significant spatial gradient responses to key parameters (Figure 6). Spatial heterogeneity analysis indicated that the upstream Tieling section (agricultural non-point-source area) exhibited the highest biological density across the entire region (12.0 × 10⁴ cells/L in L2 in 2020). However, diversity remained low (H′ = 0.53–2.79), indicating that primary producers were dominant in the upstream region, while agricultural non-point-source pollution may have inhibited optimisation of the community structure. The Shenyang–Anshan section (urban–industrial zone) in the middle reaches was the core recovery zone, in which diversity significantly increased. In this section, Pielou’s evenness index increased from 1.08 in 2010 to 4.04 in 2020 (L9), and the Shannon–Wiener diversity index increased by 138% from 2010 to 2020, further confirming that the management of industrial and urban-domestic point sources of pollution created ecological-niche space. The downstream Panjin section (agricultural–wetland system) exhibited significant biomass reduction and delayed diversity recovery. In 2020, the average biomass density in the cross section (1.70 ± 1.41 × 10⁴ cells/L) was only 19.8% of that in the upstream section (t = 12.7, p < 0.01), and the number of species at L15 was the lowest across the entire region (two species). This pattern was associated with high organic loads (L14: CODCr = 32.38 mg/L) and wetland hydrological disturbances (e.g., tidal backwater causing habitat instability), indicating that both resource competition and habitat filtering challenge the phytoplankton community in this region.

3.4. Biodiversity Index Evaluation Analysis

Phytoplankton α-diversity indices, including the Shannon–Wiener diversity index (H′), Margalef’s richness index (d), and Pielou’s evenness index (J′), serve as important biological indicators characterising the ecological stability and environmental quality of water bodies [29]. The biological evaluation system for water quality (Table 2) indicated that the water quality of the Liaoning section of the Liao River Basin fluctuated at low values. As shown in Table S3,the diversity index (H′) increased from 1.30 ± 0.55 (2010) to 1.84 ± 0.77 (2020), reflecting a 41.5% increase. The mean H′ value remained below the clean water threshold (H′ < 2.0), indicating persistent medium pollution levels over a prolonged period. The richness index (d) increased from 1.22 ± 0.71 (2010) to 2.27 ± 1.06 (2020), representing an 86% increase. However, it remained below the lower limit for light pollution (d = 3). The evenness index (J′) ranged from 0.58 to 0.63, with a coefficient of variation of 8.7%; this indicated a lightly polluted status, implying that the competition dynamics among dominant phytoplankton species had not been fundamentally changed.

4. Discussion

4.1. Phytoplankton Community Structure and Its Drivers

We found a significant shift in the phytoplankton community structure in the mainstream of the Liao River; it transitioned from a diatom-dominated community to a green algae–diatom co-dominated community. This shift aligns closely with periodic changes in environmental pressures across the basin. This finding is consistent with that reported for other disturbed river systems worldwide [30,31]. Although multiple environmental factors drove phytoplankton community restructuring in the Liao River, the succession trajectory shows distinct regional characteristics.
Before 2015, the community was dominated by Bacillariophyta (e.g., S. meneghinianus and U. acus), which accounted for >51.6% of the assemblage in 2010. This dominance reflects the strong ecological adaptability of Bacillariophyta in the cold-water conditions typical of rivers in northern China [6,32]. Notably, the sustained dominance of diatom species in the Liao River (e.g., S. meneghinianus was widely distributed in 2020) was significantly higher than that in the tributaries of the Yangtze River [33] and Han River [34], implying a delayed ecological recovery in the Liao River ecosystem. The RDA results indicate that nutrients (NH3-N, TN, and TP) and organic pollution (as indicated by BOD5 and CODCr) were the key driving factors during this period (Figure 7a,b), highlighting the combined influence of industrial and agricultural pollution on the phytoplankton community structure [35,36]. Compared with the Pearl River Basin [4], Bacillariophyta in the Liao River exhibited stronger tolerance of high nitrogen loads, possibly due to suppressed cyanobacterial activity under low-temperature conditions [37].
The pH and DO dominated community restructuring after 2015 (Figure 7c). In response to increasing DO concentrations (7.9 mg/L in 2020) and decreasing variations in pH, the phytoplankton community experienced a decrease in the proportion of Bacillariophyta concomitant with a significant increase in the proportions of Chlorophyta (40.5% in 2020) and Cyanobacteria (20.3%). This phenomenon is similar to the succession patterns in the tributaries of the Three Gorges Reservoir [29] and Danjiangkou Reservoir [38], confirming the key role of redox status (i.e., DO and pH) in community restructuring. However, the Liao River is unique in that the increase in green algae, as opposed to the common cyanobacteria dominance in eutrophic waters [39], may benefit from a decrease in the TN/TP ratio and hydraulic regulation [40]. This results in the substitution of green algae rather than cyanobacterial blooms.

4.2. Phytoplankton Diversity and Its Drivers

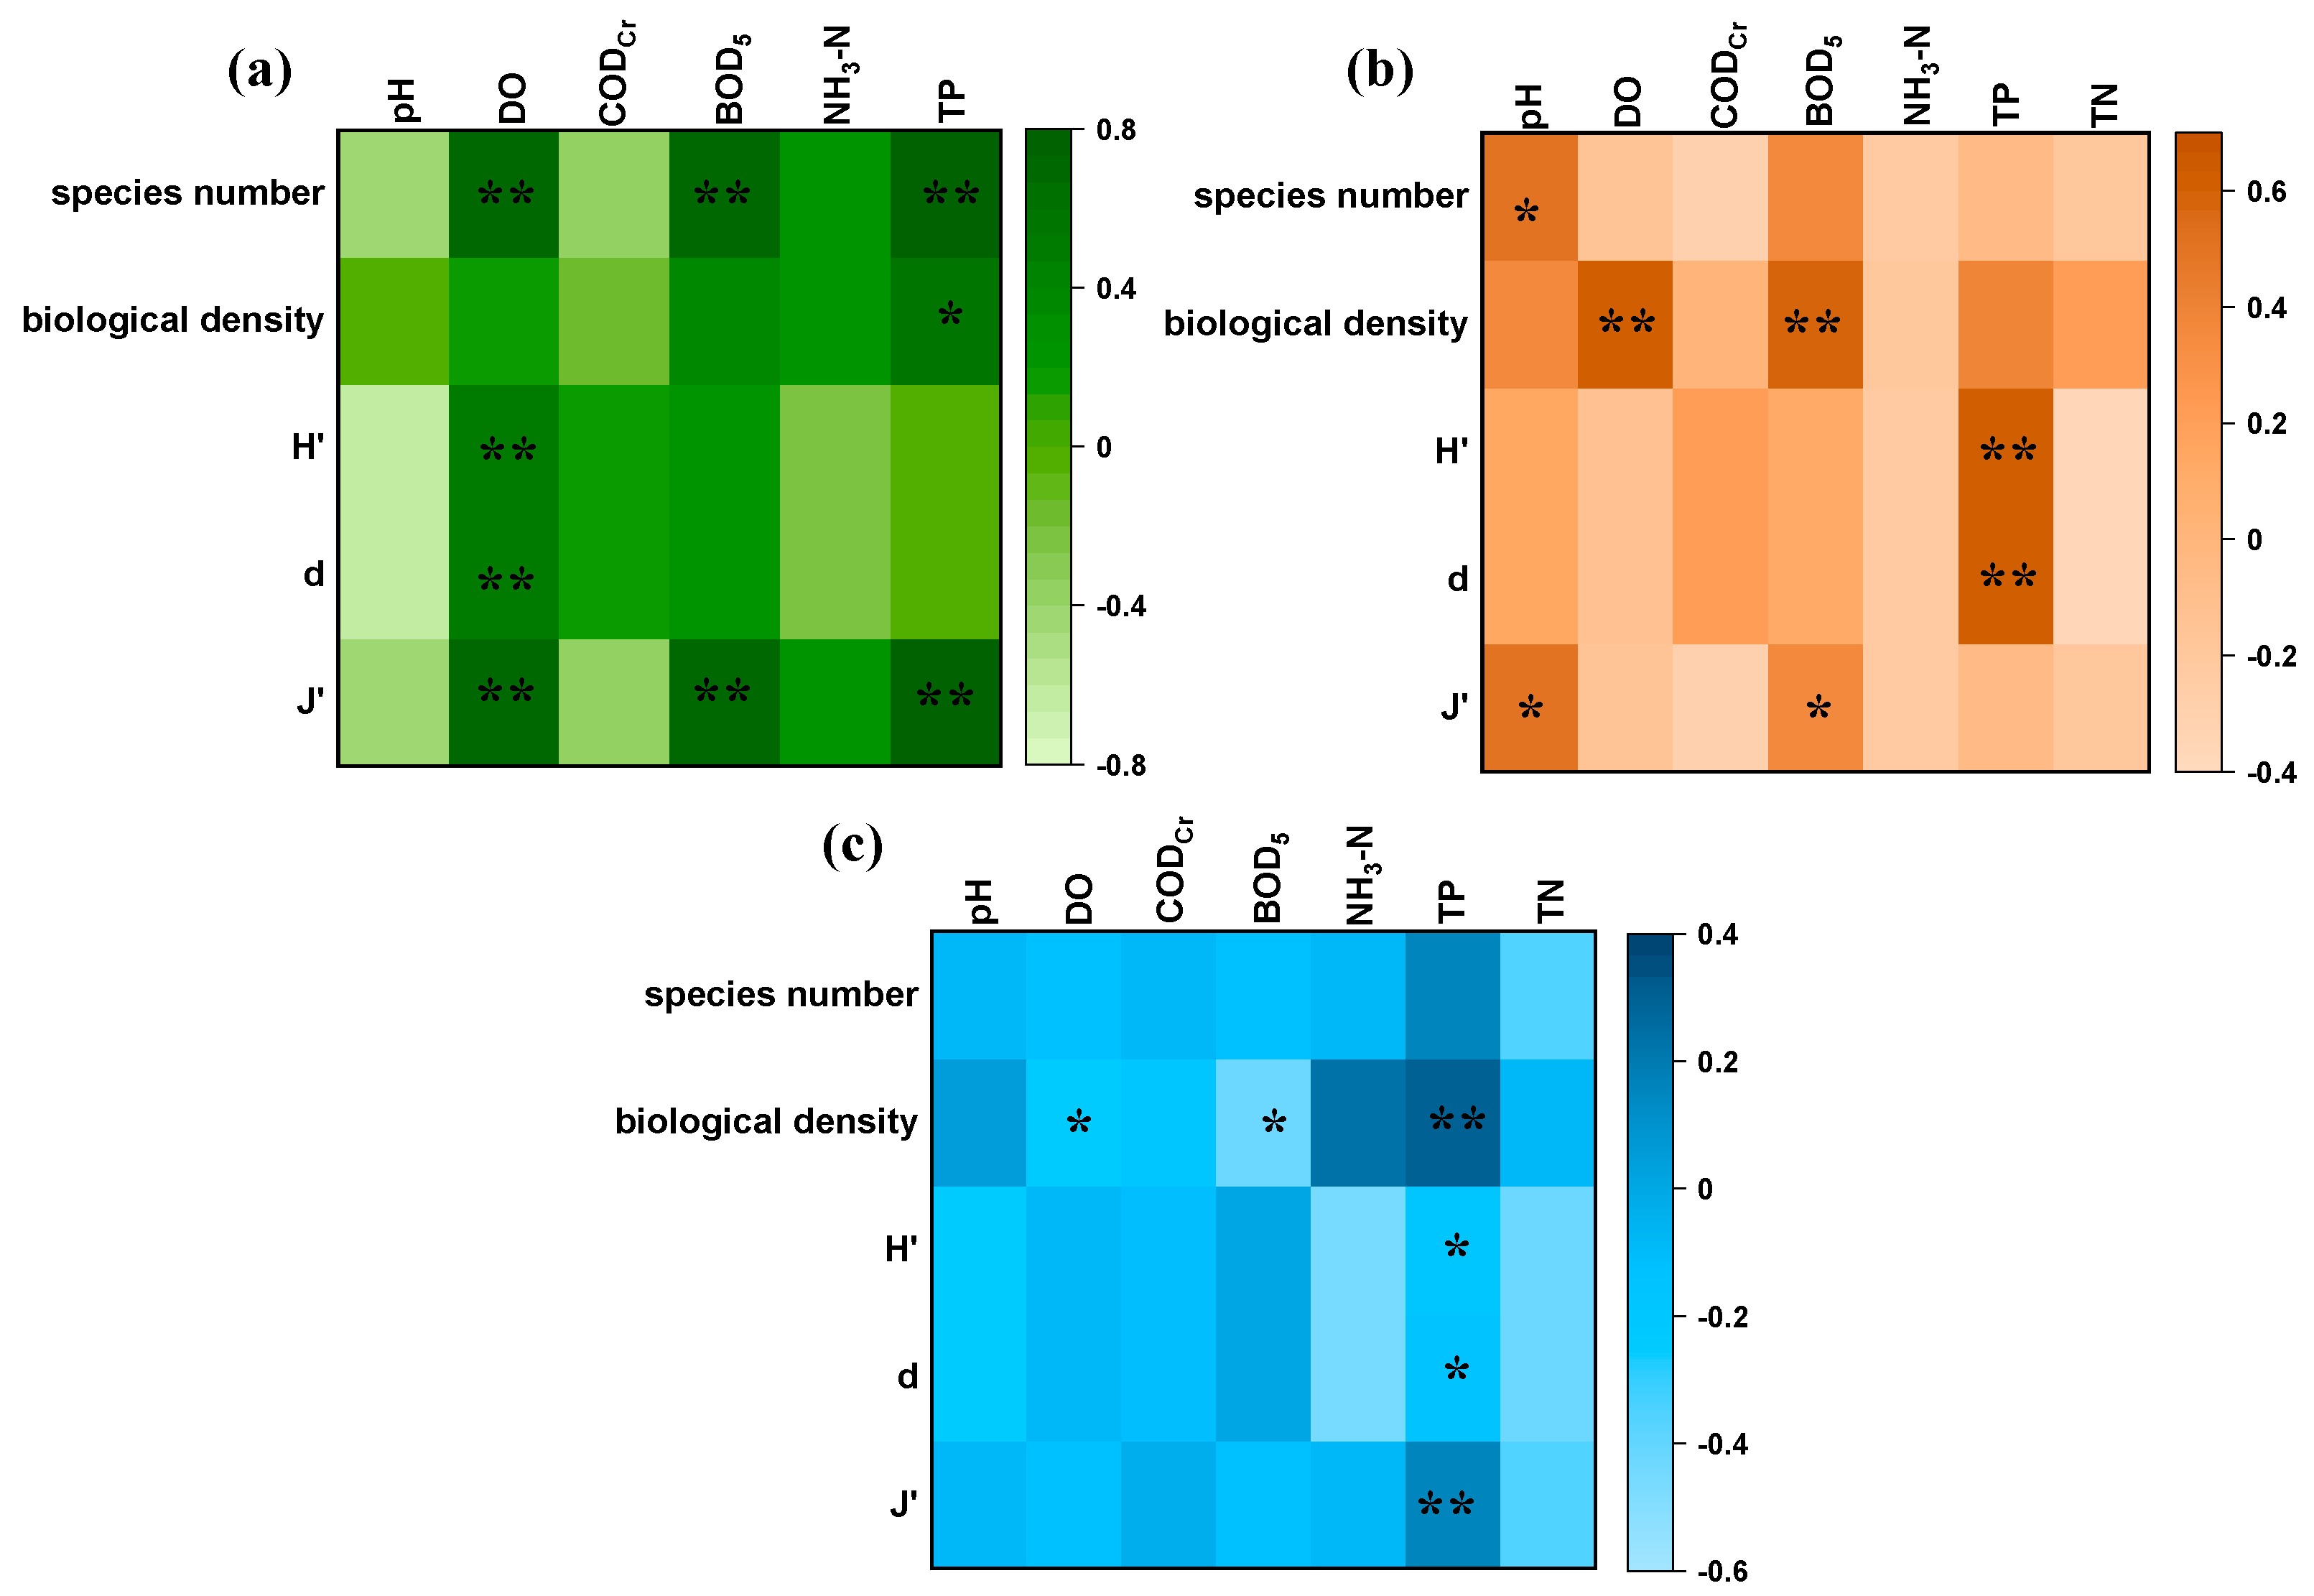
4.2.1. Driving Effects of Aquatic Environmental Factors

Phytoplankton diversity characteristics and environmental driving mechanisms in the Liaoning section of the Liao River Basin showed significant interannual variability (Figure 8), revealing the profound influence of water quality changes on community stability in the basin. The correlation heat map indicates that the number of species was positively correlated with DO (0.68, p < 0.01), BOD5 (0.67, p < 0.01), and TP (0.79, p < 0.01) in 2010. Additionally, phytoplankton biodensity was positively correlated with TP (0.59, p < 0.05). Pielou’s evenness index (J′) was positively correlated with both DO (0.68, p < 0.01) and TP (0.79, p < 0.01), whereas the Shannon–Wiener diversity index (H′) was negatively correlated with pH. In 2015, biodiversity was significantly positively correlated with DO (0.6, p < 0.05), indicating more species in environments with high DO levels. Meanwhile, H′ was significantly negatively correlated with TN and NH3-N, suggesting that elevated nitrogen levels may reduce diversity, whereas Margalef’s richness index (d) was significantly positively correlated (0.6, p < 0.05) with TP. In 2020, the synergistic enrichment of NH3-N and TP in the water column emerged as a critical environmental factor influencing biological communities. A significant positive correlation was observed between NH3-N and TP (r = 0.838, p = 0.007), indicating that nitrogen and phosphorus pollution might act as co-drivers of eutrophication. Species number was strongly positively correlated with H′ and d (r > 0.68, p < 0.01), indicating that species richness is critical for community diversity maintenance [41]. The direct effect of each environmental factor on the bioindicators was minimal (p > 0.05), likely due to the influence of other factors.

4.2.2. Driving Effects of Hydrological Factors

The linear regression analysis of different hydrodynamic parameters (water depth, discharge, and flow velocity) against the α-diversity indices (H′, d, and J′) revealed that hydrological factors in the Liaoning section of the Liao River Basin exhibited overall weak correlations with phytoplankton α-diversity indices, with considerable interannual variability (Table 3). Discharge exhibited limited explanatory power and interannual fluctuations; a significant negative correlation was only observed in 2010 between discharge and Margalef’s richness index (d) (r = −0.503, p = 0.047), accounting for 20% of the variance (R2 = 0.20). No significant correlations were found for other years or indices (H′ and J′) (p > 0.05), and in 2020, the absolute values of the correlation coefficients across all indices fell below 0.21 (Figure S1). Flow velocity showed no significant driving effects, as there were no statistically significant correlations between flow velocity and diversity indices during the study period (p = 0.160–0.793). The maximum correlation coefficient occurred for H′ in 2010 (r = −0.369, p = 0.160), with all explanatory rates remaining below 7.4% (R2 < 0.074), indicating minimal impacts of flow velocity changes on community structure (Figure S2). Water depth presented sporadic negative correlations; in 2015, marginally significant negative correlations were found with both J′ and H′ (p = 0.077–0.079, r ≈ −0.45) (Figure S3). However, the explanatory rates were less than 15% (R2 < 0.15). Correlations in other years were non-significant (p > 0.34), and correlation coefficient directions were inconsistent (e.g., for d, r = −0.398 in 2010 vs. r = −0.243 in 2020).

5. Conclusions

Based on systematic monitoring and analysis of the phytoplankton community structure in the Liaoning section of the Liao River Basin from 2010 to 2020, we found distinct temporal and spatial patterns in species diversity, community succession, biomass distribution, and their correlations with environmental factors. From 2010 to 2020, taxonomic units expanded from three phyla and 31 species to six phyla and 74 species, yielding an average annual growth rate of 8.2%. Concurrent increases in α-diversity indices (H′, d, and J′) confirmed enhanced community complexity and continuous improvements in habitat heterogeneity. The community composition shifted from diatom dominance (51.6% in 2010) to co-dominance between Bacillariophyta and Chlorophyta. The increased prevalence of Chlorophyta species, particularly S. quadricauda, significantly strengthened the water purification potential of the basin. However, the persistent dominance (Y = 0.53) of the tolerant diatom species S. meneghinianus revealed hysteresis in the ecological recovery of the heavily polluted northern rivers. This finding highlights the need for formulating region-specific restoration strategies. Although phytoplankton biomass and diversity indices exhibited upward trends, significant spatial heterogeneity emerged. This highlights ecological priorities for zonal management: The upper agricultural zone (Tieling) maintained high biomass (12.0 × 10⁴ cells/L) but had low diversity (H′ = 0.53–2.79), signalling persistent stress from non-point-source pollution. The middle urban–industrial zone (Shenyang–Anshan region) emerged as the core recovery area, as exemplified by a 138% increase in H′ at Site L9. This indicates that effective point-source pollution control can expand ecological niches. The lower wetland zone (Panjin) exhibited notable biomass decline and delayed diversity recovery. This suggests combined pressure by both resource competition and habitat filtering on the phytoplankton community. This spatial distribution provides clear ecological guidance for the zonal management of the basin. Pearson correlation and RDA revealed a shift in the primary drivers of phytoplankton community-structure and diversity dynamics from nutrient-related factors (NH3-N, TN, and TP) to redox-sensitive variables (DO and pH). This transition coincided with key adaptive community shifts, including niche differentiation within Bacillariophyta (2015), proliferation of Chlorophyta, and increased co-existence across multiple phyla (2020). Overall, these findings offer critical biological evidence supporting a ‘zoned–graded–staged’ restoration management strategy and provide a scientific foundation for developing intelligent river basin monitoring networks using phytoplankton as indicator organisms.

Supplementary Materials

The following supporting information can be downloaded at: https://www.mdpi.com/article/10.3390/w17152182/s1, Figure S1: The correlation diagram between flow and α diversity index; Figure S2: The correlation diagram between flow velocity and α diversity index; Figure S3: The correlation diagram between water depth and α diversity index; Table S1: Sampling schedule; Table S2: Phytoplankton Dominance; Table S3: Table of evaluation results for phytoplankton alpha diversity index.

Author Contributions

Conceptualization of this study was done by M.L. and L.L.; the investigation was carried out by L.L.; the methodology was prepared by M.L., K.P., Z.H. and R.P.; statistics and mapping were prepared by K.P., Z.H. and R.P.; the manuscript was written and edited by M.L., L.L., K.P., Z.H. and R.P. All authors have read and agreed to the published version of the manuscript.

Funding

This research was funded by “Joint Research Program for Ecological Conservation and High Quality Development of the Yellow River Basin (No. 2022-YRUC-01-0602)”.

Data Availability Statement

The data that support the findings of this study are available from the corresponding author upon reasonable request.

Acknowledgments

The authors express their gratitude to everyone who assisted them with the present study.

Conflicts of Interest

The authors declare no conflicts of interest.

References

  1. Zhang, M.; Li, Z.; Zhang, X. Analysis on Biological Evaluation of Regional Water Environment. Environ. Prot. Sci. 1996, 54–57, 7–78. [Google Scholar]
  2. Cardinale, B.J.; Palmer, M.A.; Collins, S.L. Species diversity enhances ecosystem functioning through interspecific facilitation. Nat. Chem. 2002, 415, 426–429. [Google Scholar] [CrossRef]
  3. Li, X.; Xu, Z.; Zhang, S.; Gao, W.; Dong, Q.; Guo, F.; Zhu, Z.; Yang, W.; Yang, Z. Eutrophication-Driven Changes in Plankton Trophic Interactions: Insights from Trade-Offs in Functional Traits. Environ. Sci. Technol. 2024, 59, 744–755. [Google Scholar] [CrossRef] [PubMed]
  4. Long, S.; Zhang, T.; Fan, J.; Li, C.; Xiong, K. Responses of phytoplankton functional groups to environmental factors in the Pearl River, South China. Environ. Sci. Pollut. Res. 2020, 27, 42242–42253. [Google Scholar] [CrossRef] [PubMed]
  5. Voulvoulis, N.; Arpon, K.D.; Giakoumis, T. The EU Water Framework Directive: From great expectations to problems with implementation. Sci. Total Environ. 2017, 575, 358–366. [Google Scholar] [CrossRef]
  6. Guo, Y.; Ding, Z. Research on Prediction of Main Water Quality Indicators in Liao River Basin Based on ARIMA Model. J. Green Sci. Technol. 2021, 23, 34–36. [Google Scholar]
  7. Li, Q.; Zhao, W.; Yin, X.; Zhang, W.; Meng, W. Study on the diversity of phytoplankton species in the Taizi River system of Liao River. J. Dalian Ocean. Univ. 2011, 26, 322–327. [Google Scholar]
  8. Zhao, C.; Zhu, Z.; Zhou, D. Rivers and Dams of the World; China Water & Power Press: Beijing, China, 2000. [Google Scholar]
  9. Reynolds, C.S.; Irish, A.E.; Elliott, J.A. The ecological basis for simulating phytoplankton responses to environmental change (PROTECH). Ecol. Model. 2001, 140, 271–291. [Google Scholar] [CrossRef]
  10. Hui, T.; Xie, P.; Guo, L.; Chu, Z.; Liu, M. Study on the Composition and Succession of Dominant Species of Phytoplankton in Yanghe Reservoir. Acta Hydrobiol. Hydrobiol. Sin. 2015, 39, 524–532. [Google Scholar]
  11. Huang, H.; Yang, Y.; Yang, L.; Zuo, G.; Zeng, R. Study on the Changes of Phytoplankton in the Ecological Monitoring Area of Bohai Bay from 2004 to 2015. Haiyang Xuebao 2018, 40, 14. [Google Scholar]
  12. Liu, D.; Morrison, R.J.; West, R.J. Phytoplankton Assemblages as an Indicator of Water Quality in Seven Temperate Estuarine Lakes in South-East Australia. In Eutrophication: Causes, Consequences and Control; Springer: Dordrecht, The Netherlands, 2014; Volume 2, pp. 191–202. [Google Scholar]
  13. Li, L.; Xia, R.; Xia, X.; Dou, M.; Ling, M.; Chen, Y.; Dou, J.; Zhang, K.; Jia, R.; Yang, C. Hydrological variability significantly influences aquatic biological integrity at the spatial scale in semi-arid watersheds. J. Hydrol. 2025, 660, 133359. [Google Scholar] [CrossRef]
  14. Bowes, M.J.; Gozzard, E.; Johnson, A.C.; Scarlett, P.M.; Roberts, C.; Read, D.S.; Armstrong, L.K.; Harman, S.A.; Wickhami, H.D. Spatial and temporal changes in chlorophyll-a concentrations in the River Thames basin, UK: Are phosphorus concentrations beginning to limit phytoplankton biomass? Sci. Total Environ. 2012, 426, 45–55. [Google Scholar] [CrossRef] [PubMed]
  15. Zhang, X.; Wang, P.; Feng, C.; Wen, R. Ecological study on phytoplankton in Liaohe Estuary. Mar. Environ. Sci. 2013, 32, 679–682. [Google Scholar]
  16. Han, M.; Shu, Y. Atlas of Freshwater Organisms in China; Ocean Press: Beijing, China, 1995. [Google Scholar]
  17. Hu, H.; Wei, Y. Freshwater Algae of China: Systematics, Taxonomy, and Ecology; Science Press: Beijing, China, 2006. [Google Scholar]
  18. Lampitt, R.S.; Wishner, K.F.; Turley, C.M.; Angel, M.V. Marine snow studies in the Northeast Atlantic Ocean: Distribution, composition and role as a food source for migrating plankton. Mar. Biol. 1993, 116, 689–702. [Google Scholar] [CrossRef]
  19. Liu, L.; Zhao, F. Investigation and protection strategy of plankton in the Harbin section of the Songhua River, China. Appl. Ecol. Environ. Res. 2024, 22, 5791. [Google Scholar] [CrossRef]
  20. Reynolds, C.S. The Ecology of Phytoplankton; Cambridge University Press: Cambridge, UK, 2011. [Google Scholar]
  21. Yang, D.; Zhou, X.; Chen, J.; Luo, H.; Li, J.; An, M.; Jiang, H.; Shao, J. Investigation and diversity analysis of plankton resources in the Beipanjiang Grand Canyon Basin. Genom. Appl. Biol. 2021, 40, 639–648. [Google Scholar]
  22. Lan, K.; Liu, B.; Peng, D.; Ren, X.; Yang, D. Investigation and diversity analysis of plankton resources in spring in Dumu River. Chin. J. Mt. Agric. Biol. 2021, 40, 15–22. [Google Scholar]
  23. Li, D.; Lu, W.; Zhang, L.; Zhang, Z. Phytoplankton Community in the East Liao River Basin: A Canonical Correspondence Analysis with Aquatic Environmental Factors. Water Resour. Hydropower Northeast. China 2013, 31, 2. [Google Scholar]
  24. Li, X.; Yu, H.; Wang, H.; Ma, C. Phytoplankton community structure in relation to environmental factors and ecological assessment of water quality in the upper reaches of the Genhe River in the Greater Hinggan Mountains. Environ. Sci. Pollut. Res. 2019, 26, 17512–17519. [Google Scholar] [CrossRef]
  25. Arhonditsis, G.B.; Winder, M.; Brett, M.T.; Schindler, D.E. Patterns and mechanisms of phytoplankton variability in Lake Washington (USA). Water Res. 2004, 38, 4013–4027. [Google Scholar] [CrossRef]
  26. Zhao, K.; Bai, X.; Dong, A.; Li, C.; Lu, H. A Study on the Correlation between the Spatial and Temporal Distribution of Phytoplankton Community and Environmental Factors in Changchun Section of the Yitong River. Pol. J. Environ. Stud. 2022, 31, 3955–3969. [Google Scholar] [CrossRef]
  27. GB 3838-2002; Environmental Quality Standards for Surface Water. Standards Press of China: Beijing, China, 2002.
  28. Li, F.; Dong, F.; Duan, M.; Wang, G.; Zhu, L. Characteristics of Phytoplankton Community Structure and Water Quality Assessment in the Daliao River System in Summer. Chin. J. Ecol. 2011, 30, 8. [Google Scholar]
  29. Cloern, J.E.; Foster, S.Q.; Kleckner, A.E. Phytoplankton primary production in the world’s estuarine-coastal ecosystems. Biogeosciences 2014, 11, 2477–2501. [Google Scholar] [CrossRef]
  30. Haque, M.A.; Jewel, M.A.S.; Akhi, M.M.; Atique, U.; Paul, A.K.; Iqbal, S.; Islam, M.S.; Das, S.K.; Alam, M.M. Seasonal dynamics of phytoplankton community and functional groups in a tropical river. Environ. Monit. Assess. 2021, 193, 1–16. [Google Scholar] [CrossRef]
  31. Wen, G.; Wang, R.; Wen, C.; Bai, Y.; Cap, R.; Si, F.; Li, K.; Huang, T. Research Progress on the Formation Causes and In-situ Control of Freshwater Dinoflagellate Blooms. China Environ. Sci. 2023, 43, 2239–2253. [Google Scholar]
  32. Song, G.; Zhang, Y.; Qiu, P.; Ruan, G.; Bi, Y. Structural Characteristics of the Phytoplankton Community and Its Influencing Factors in Lushui Reservoir. J. Hydroecol. 2024, 45, 49–57. [Google Scholar]
  33. Chen, F.; Wang, W.; He, T.; Zhou, H.; Qian, B. Analysis of the New Situation of Water Bloom Development and Governance Countermeasures in the Middle and Lower Reaches of the Hanjiang River. Yangtze River 2023, 54, 7–17. [Google Scholar]
  34. Wang, G.; Wang, L.; Wu, W. Evolutionary Trends of Ecological Security of Drinking Water Sources in the Main Stream of the Liao River Based on GIS. Chin. J. Appl. Ecol. 2007, 18, 6. [Google Scholar]
  35. Xing, Y.; Lu, Z.; Wang, T.; Xu, X.; Wang, L.; Zhang, W. Community Assembly Mechanisms and Driving Factors of Phytoplankton Functional Groups in the Urban River Network of Shanghai during Winter. J. Shanghai Ocean. Univ. 2025, 34, 56–68. [Google Scholar]
  36. Gu, X.; Li, H.; Mao, Z.; Chen, H.; Shen, R.; Zeng, Q. Research progress on ecological interaction between cyanobacteria bloom and freshwater fish. Chin. Sci. Bull. 2021, 66, 2649–2662. [Google Scholar] [CrossRef]
  37. Zhou, G.; Kuan, Q.; Hu, Z.; Cai, Q. Algae diversity evaluation and ‘bloom’ control of four tributaries in the Three Gorges Reservoir Area. China Environ. Sci. 2006, 3, 337–341. [Google Scholar]
  38. He, Y.; Zheng, Y.; Li, W.; Zhang, Z.; Ma, Y.; Zhao, T.; Ren, Y. Community Structure Characteristics of Eukaryotic Phytoplankton in Danjiangkou Reservoir in Early Spring and Their Relationships with Environmental Factors. Acta Sci. Circumstantiae 2021, 41, 9. [Google Scholar]
  39. Kuang, Q.; Ma, P.; Hu, Z.; Zhou, G. Research progress on algae biological evaluation and management of lake eutrophication. J. Saf. Environ. 2005, 5, 87–91. [Google Scholar]
  40. Yang, M.; Bi, Y.; Ai, Y.; Hu, J.; Zhu, K.; Hu, Z. Preliminary Study on the Impact of Water Flow Velocity on Phytoplankton in the Xiangxi River Bay under Artificial Control Conditions. Resour. Environ. Yangtze Basin 2012, 21, 220–224. [Google Scholar]
  41. Dong, Y.; Zhang, P.; Li, X.; Zheng, B. The Spatiotemporal Distribution of Macrophytes in Qionghai Lake and Causes of Degradation. J. Lake Sci. 2024, 36, 236–246. [Google Scholar]
Figure 1. Map of sampling sites in the Liaoning section of the Liao River Basin.
Water 17 02182 g001
Figure 2. Temporal variations in physical and chemical indicators across each water body in the Liao River Basin, Liaoning section. (a) pH; (b) DO; (c) CODCr; (d) BOD5; (e) NH3-N; (f) TP; (g) TN.
Water 17 02182 g002
Figure 3. Spatial distribution heat map illustrating the physical and chemical indices of water bodies in the Liaoning section of the Liao River Basin. (a) pH; (b) DO; (c) CODCr; (d) BOD5; (e) NH3-N; (f) TP; (g) TN.
Water 17 02182 g003
Figure 4. Variations in the number of phytoplankton species: (a) Number of species per year; (b) Number of species per section; (c) Proportion of species per year.
Water 17 02182 g004
Figure 5. Temporal variations in phytoplankton (a) biodensity and (bd) diversity indices in the Liaoning section of Liao River Basin.
Water 17 02182 g005
Figure 6. Spatial distributions of phytoplankton (a) biodensity and (bd) diversity indices in the Liaoning Section of Liao River Basin.
Water 17 02182 g006
Figure 7. Redundancy analysis ranking plot of dominant phytoplankton species against environmental factors. (a) 2010; (b) 2015; (c) 2020.
Water 17 02182 g007
Figure 8. Heat maps showing the correlations between phytoplankton community diversity and environmental factors: (a) 2010; (b) 2015; (c) 2020. * p < 0.05, ** p < 0.01.
Water 17 02182 g008
Table 1. Water quality evaluation standards of diversity indices.
Water Quality Evaluation StandardShannon–Wiener Diversity (H′)Pielou’s Evenness (J)Margalef’s Richness (d)
Clean>3.0>0.8>5.0
Light pollution2.0–3.00.5–0.83.0–5.0
Moderate pollution1.0–2.00.3–0.51.0–3.0
Heavy pollution0–1.00–0.30–1.0
Table 2. Results of water quality evaluation based on phytoplankton α-diversity indices in the Liaoning section of the Liao River Basin.
YearH′ Evaluation Resultsd Evaluation ResultsJ′ Evaluation Results
2010Moderate pollutionModerate pollutionLight pollution
2015Moderate pollutionModerate pollutionLight pollution
2020Moderate pollutionModerate pollutionLight pollution
Table 3. Correlation between hydrological factors and α-diversity indices.
Hydrological FactorsYearH′ (P)d (P)J′ (P)
Flow velocity20100.6180.0470.640
20150.0710.7540.071
20200.5290.4490.529
Flow rate20100.1600.2920.172
20150.3650.7530.376
20200.3480.7930.348
Water depth20100.5920.1270.835
20150.0790.7650.077
20200.3460.3640.346
Disclaimer/Publisher’s Note: The statements, opinions and data contained in all publications are solely those of the individual author(s) and contributor(s) and not of MDPI and/or the editor(s). MDPI and/or the editor(s) disclaim responsibility for any injury to people or property resulting from any ideas, methods, instructions or products referred to in the content.

