Abstract
Losses from floods and the wide range of impacts have been at the forefront of hazard-triggered disasters in China. Affected by large-scale human activities and the environmental evolution, China’s defense flood situation is undergoing significant changes. This paper constructs a comprehensive flood disaster risk assessment model through systematic analysis of four key factors—hazard (H), exposure (E), susceptibility/sensitivity (S), and disaster prevention capabilities (C)—and establishes an evaluation index system. Using the Analytic Hierarchy Process (AHP), we determined indicator weights and quantified flood risk via the following formula R = H × E × V × C. After we applied this model to 16 towns in coastal Zhejiang Province, the results reveal three distinct risk tiers: low (R < 0.04), medium (0.04 ≤ R ≤ 0.1), and high (R > 0.1). High-risk areas (e.g., Longxi and Shitang towns) are primarily constrained by natural hazards and socioeconomic vulnerability, while low-risk towns benefit from a robust disaster mitigation capacity. Risk typology analysis further classifies towns into natural, social–structural, capacity-driven, or mixed profiles, providing granular insights for targeted flood management. The spatial risk distribution offers a scientific basis for optimizing flood control planning and resource allocation in the district.
1. Introduction
While China faces multiple natural hazards, including earthquakes and heat waves, flood disasters remain one of the most frequent and destructive threats. Disasters triggered by natural hazards have been the enemy of mankind since ancient times. They destroy the ecological environment on which mankind depends, directly cause heavy losses of people’s lives and property, and seriously affect economic development and social progress [1,2]. It is one of the most serious problems facing mankind today. Flood disasters are one of the main hazards triggering disasters today [3]. China is one of the countries with the most frequent flooding disasters in the world. Two-thirds of the country’s land area, more than half of the population, 35% of arable land, and two-thirds of the total industrial and agricultural output value are seriously threatened by floods [4,5].
Recent assessments underscore that climate change is intensifying hydrological extremes, thereby exacerbating flood hazards worldwide. The IPCC Sixth Assessment Report Synthesis (2023) indicates that warming has increased the frequency and intensity of extreme precipitation events in many regions, raising flood risk under future warming scenarios [6]. Likewise, the UNDRR Global Assessment Report (GAR) 2025 highlights that without substantial investment in disaster risk reduction and resilient infrastructure, flood-related losses are projected to rise significantly in the coming decades [7]. These findings reinforce the necessity of integrating climate projections and resilience-building measures into flood risk assessment frameworks.
Current research on flood disaster management encompasses monitoring, forecasting, and risk assessment [8,9]. With the advancement of satellite remote sensing, flood monitoring has evolved beyond traditional hydrological stations, allowing for high temporal and high spatial resolution observations [10,11,12]. For instance, the United States has utilized Landsat data and hydrological models to assess flooding in the Black River Basin [13], while China has monitored the Liaohe and Hunhe River Basins using integrated remote sensing platforms [14]. Moreover, China’s real-time water resources monitoring system has successfully combined satellite data with ground observations since 2002.
Flood risk assessment methodologies vary widely in terms of data requirements, theoretical frameworks, and application scope. Empirical-statistical models, machine learning approaches, and physically based hydrodynamic models are increasingly used to simulate flood hazards. However, such models often demand high-quality spatiotemporal data, which may not be consistently available across regions. In contrast, multi-criteria decision-making (MCDM) approaches, such as the Analytic Hierarchy Process (AHP), offer a structured yet interpretable means of integrating expert judgment and diverse indicators to assess composite risk. AHP has been widely adopted due to its simplicity, flexibility, and ability to accommodate both qualitative and quantitative inputs. Nonetheless, it is often criticized for subjectivity in weight assignments and lack of sensitivity analysis [15,16,17].
This paper adopts the AHP method not merely as a decision tool, but it integrates it with spatial data and flood frequency analysis to produce a hybrid flood risk assessment model. The novelty lies in tailoring the AHP framework to local hazard–exposure–vulnerability conditions in Zhejiang Province while incorporating historical flood loss records for calibration. Unlike many previous studies that rely solely on expert scoring, this study introduces a data-informed correction mechanism to reduce subjective bias in the weight determination process.
In summary, this paper constructs a flood risk evaluation index system based on four dimensions. hazard, exposure, vulnerability, and disaster prevention and mitigation capacity. It applies the refined AHP model to a case study in Zhejiang Province, quantifies flood losses under various recurrence intervals, and maps flood risk across the towns in the study area. The unique contribution of this research is the development of a regionally adapted, semi-quantitative flood risk assessment model that combines AHP with empirical data adjustment, offering both methodological enhancement and practical relevance for regional flood management.
2. Literature Review
Early flood risk assessment research primarily employed multi-criteria decision-making methods, especially the Analytic Hierarchy Process (AHP), often within GIS platforms to map hazard, exposure, and vulnerability [18,19]. For example, Zhang et al. (2020) used a GIS-based multi-index model for the Yangtze River Basin, while Wu et al. (2022) improved objectivity by integrating D-number AHP with self-organizing maps in urban flood modeling [20,21]. Advances in remote sensing and GIS, such as the use of Sentinel-1 and cloud platforms like Google Earth Engine, have further enhanced flood monitoring and laid the foundation for data-driven approaches [22].
In recent years, machine learning (ML) and artificial intelligence (AI) methods have significantly advanced flood modeling. Nguyen et al. (2022) combined SVM with fish fry optimization for susceptibility mapping in Vietnam, while Chen et al. (2021) found GBDT to be the most effective among several ML models in the Pearl River Delta [23,24]. Bayesian networks have also been used to explore causal relationships and manage uncertainty, as demonstrated by Huang et al. (2021) in Jingdezhen [25].
However, several challenges remain. Many models depend on static socioeconomic data, limiting real-time adaptability [26]. Climate projections are insufficiently integrated, despite IPCC findings on changing flood patterns [27]. Vulnerability assessments often overlook social and health dimensions such as age and healthcare access [28,29]. Moreover, adaptive capacity indicators are oversimplified, and emerging technologies like real-time sensors and cloud analytics are underutilized [30,31]. Addressing these gaps is crucial for developing dynamic and inclusive flood risk assessment frameworks.
3. Materials and Methods
3.1. Overview of the Study Area
The study area (Figure 1) is located in the central coastal region of Taizhou City, Zhejiang Province, and includes 16 representative towns. Geographically, the area under jurisdiction features a long, narrow terrain that slopes from high elevations in the west to low-lying plains in the east. The central and eastern regions belong to the “Wenhuang Plain”, a typical alluvial area. The region experiences a mild, humid subtropical monsoon climate, with four distinct seasons, an average annual temperature of 17 °C, approximately 250 frost-free days per year, and an average annual precipitation of 1676 mm.
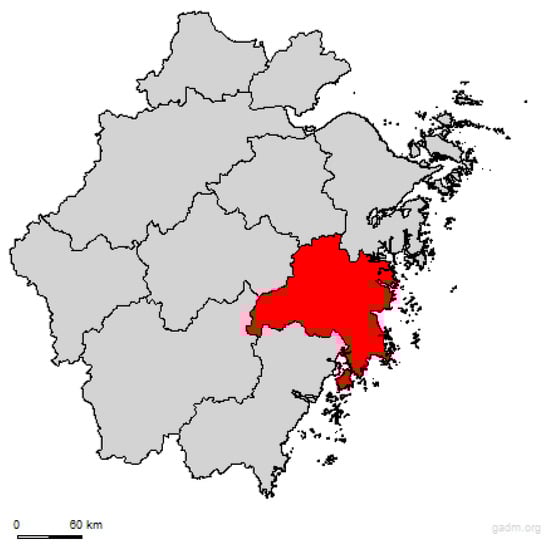
Figure 1.
The study area location map (highlight as red)—Central Coastal Region of Taizhou City, Zhejiang Province (The administrative boundary data of Taizhou City used in this study was obtained from the GADM database [32]).
Flood disasters in this area primarily result from a combination of natural and anthropogenic factors. First, tributaries in the upstream mountainous regions have steep gradients and rapid currents. When floodwaters descend into the flatter plains downstream, the slope decreases and flow velocity slows, making these areas prone to waterlogging. Second, following reservoir construction, the sediment transport capacity of rivers has significantly declined. Tidal sediment deposition has led to severe siltation and channel narrowing, reducing the flood discharge capacity to just 70 m3/s. As a result, towns in this region frequently experience serious flooding during typhoon-induced heavy rainfall.
The flood risk assessment model proposed in this study integrates multi-source data to improve both accuracy and comprehensiveness. Geographic data inputs include remote sensing imagery from meteorological and earth observation satellites. These datasets offer both high temporal resolution (e.g., meteorological satellites) and high spatial resolution (e.g., 30-m Landsat imagery), with the most recent data spanning 2021–2022. These sources are used to monitor flood extent and impact.
Topographic indicators—such as relative elevation, slope, and river network density—are derived from digital elevation models (DEMs). Specifically, SRTM data provide elevation data at 30 or 90 m resolution, while ASTER GDEM offers 30 m resolution, facilitating flood path simulation and risk zoning.
For the socioeconomic dimension, the model utilizes recent annual data from a spatial socioeconomic database developed in MapInfo. These data help quantify the impacts of flooding on human systems and include indicators such as population density and the distribution of residential assets.
Recent studies using precipitation isotope datasets [33] have identified significant deviations in moisture transport patterns affecting East Asian rainfall regimes. The isotopic composition of precipitation (δ18O) in coastal China now shows 3‰ greater variability compared to 20th-century baselines, indicating fundamental shifts in atmospheric water cycles. These changes stem from altered moisture source contributions, where Pacific-originating precipitation has decreased by approximately 15% relative to continental sources since 2000 [34]. Such shifts are particularly pronounced in mountainous regions, where modified altitude effects on precipitation isotopes reveal complex interactions between changing evaporation–precipitation balances and atmospheric moisture recycling rates. These abnormal patterns have directly contributed to a documented 12–18% intensification of extreme rainfall events across southeastern China, with particularly strong impacts on typhoon-related precipitation systems that affect our study area.
The primary flood mechanisms in the study area result from synergistic interactions between these climatic changes and local geomorphology. First, mountainous upstream tributaries with steep slopes (average gradient > 15°) generate rapid runoff during intensified rainfall events. Second, reservoir-induced sedimentation has reduced the riverbed capacity by approximately 40% since 1990, with current discharge capacity limited to 70 m3/s. Third, typhoon rainfall intensity has increased by 15% since 2000, as measured by the Taizhou Hydrological Bureau’s gauge network. These factors collectively elevate flood risks beyond historical levels, necessitating the updated risk assessment framework developed in this study.
3.2. Analysis of the Flood Disaster Evaluation Index
A regional flood disaster risk assessment typically involves four key dimensions: hazard, exposure, vulnerability, and disaster prevention and mitigation capacity [35]. In this framework, hazard refers to both the natural triggering events (e.g., extreme rainfall, river overflow) and the environmental conditions that contribute to flooding. The concept of “hazard-bearing bodies”, commonly used in Chinese literature, is more accurately expressed in international contexts as exposed elements or elements at risk. These are further divided into two components: exposure, which reflects the spatial distribution and concentration of people, property, and infrastructure within flood-prone areas, and vulnerability, which characterizes the susceptibility of these elements to damage or disruption caused by floods.
Disaster prevention and mitigation capacity represents the ability of a region to minimize flood-related losses through preparedness, infrastructure, response systems, and institutional resilience.
Flood risk assessment is inherently multidisciplinary, involving environmental, social, and economic dimensions. Selecting appropriate indicators is a prerequisite for meaningful analysis. Based on the conceptual framework of disaster risk, this study adheres to the principles of relevance, systematic design, scientific rigor, and practical operability in constructing the indicator system. Taking into account the regional context and data availability, the assessment index system is structured into three hierarchical layers: factor layer, sub-factor layer, and indicator layer. Seventeen indicators (listed in Table 1) were selected under the four main dimensions—hazard, exposure, vulnerability, and disaster prevention and mitigation capacity—to comprehensively evaluate flood disaster risk in the study area.

Table 1.
The flood disaster risk assessment index system.
Table 1 shows the index system of flood disaster risk assessment, which systematically divides flood disaster risk assessment into four main factor layers: hazard (H), exposure (E), susceptibility/sensitivity (S), and disaster prevention and mitigation capabilities (C), and each factor layer is further subdivided into sub-factor layers and specific index layers.
Hazard (H) includes rainstorm intensity (H1) (H1 is selected as a key hazard indicator due to its direct role in flood generation under Zhejiang’s subtropical monsoon climate. Data from 32 years (1990–2022) across 15 Taizhou rain gauges were used, focusing on daily maxima and 24 h typhoon-season storms (July–October), validated against ERA5-Land reanalysis data. Extreme value analysis followed the Pearson Type III distribution per national standards, with intensity thresholds identified for 5-, 10-, 20-, and 50-year return periods (e.g., 240 mm for 5-year events). Mann–Kendall tests revealed a 15% rise in typhoon-related rainfall intensity since 2000 (p < 0.01), particularly along coastal towns like Shitang due to orographic effects (Figure 1). Rainfall intensity was prioritized over total precipitation based on infrastructure stress, stronger correlation with flood losses (r = 0.82 vs. r = 0.41), and alignment with IPCC projections. It accounted for 16% of the total hazard weight in the risk model, relative height and slope (H2), river network density (H3), and coverage rate of vegetation (H4). These indicators are used to measure the natural conditions and environment that lead to floods.
Exposure (E) is divided into population exposure (such as population density E1) and economic exposure, such as resident property (E2), industrial output value (E3), agriculture, forestry, animal husbandry, and fish production value (E4). This part is mainly concerned with the population and economic losses that may be affected by the flood.
Susceptibility/Sensitivity (S) is divided into population vulnerability and economic vulnerability. Population vulnerability includes age structure (S1), health status (S2), population structure (S3), and education level (S4). S2 was operationalized through age-standardized chronic disease prevalence, sourced from municipal health records. This metric directly impacts evacuation capacity and post-disaster recovery, with higher prevalence amplifying vulnerability. Values were normalized to [0, 1] using
where lower health status yields higher vulnerability scores. Economic vulnerability includes the proportion of small enterprises (S5) and the proportion of farmland vulnerable to flooding (S6). Vulnerability index reflects the characteristics of the affected body and the possibility of damage during the flood.
Disaster prevention and mitigation capabilities (C) include two aspects: disaster resistance and disaster relief and recovery capabilities. The specific indicators are flood control standard (C1), mechanical power per capita (C2), and GDP per capita (C3). This part emphasizes the prevention and response ability of the region in the face of flood disasters.
In this study, risk (R) is conceptually distinguished from susceptibility. Specifically, susceptibility (S) is represented as vulnerability, which captures the inherent characteristics of the exposed population and infrastructure that affect their capacity to withstand and recover from flood impacts. This includes factors such as age distribution, public health indicators, building density, and socioeconomic conditions. In contrast, hazard (H) quantifies the physical and environmental conditions that contribute to flood occurrence and intensity. These include meteorological, topographic, hydrological, and ecological factors.
The hazard component of the model integrates four sub-indicators. rainfall intensity (H1), terrain features (H2), river network density (H3), and vegetation cover (H4). For H1, 32 years (1990–2022) of daily rainfall data from 15 rain gauges operated by the Taizhou Hydrological Bureau were analyzed. Extreme precipitation events during the typhoon season (July–October) were fitted to a Pearson Type III distribution following guidelines from the Ministry of Water Resources of China. This facilitated the derivation of rainfall intensity thresholds corresponding to key return periods (e.g., 5-year, 10-year, 20-year, and 50-year events). For H2, terrain analysis was conducted using the Shuttle Radar Topography Mission (SRTM) digital elevation model (DEM) data. Slope and relative elevation were extracted to evaluate topographic susceptibility to water accumulation and runoff concentration.
H3, river density, was derived through hydrological modeling of the DEM using flow accumulation and stream order analysis, which was subsequently validated through field inspections in selected watersheds. Finally, H4, vegetation cover, was assessed using Normalized Difference Vegetation Index (NDVI) values obtained from cloud-free Landsat imagery. NDVI classification provided spatial differentiation of surface permeability and interception potential, both of which influence flood runoff behavior.
This multidimensional hazard mapping approach enables a more nuanced and spatially resolved estimation of flood-generating potential, forming the hazard layer of the overall flood risk assessment model.
3.3. Analytic Hierarchy Process
The multi-level flood risk assessment index system developed in this study enables a comprehensive analysis of flood disaster risks in the target region, thereby providing a scientific basis for formulating effective flood control and disaster mitigation strategies. Each indicator within the hierarchical structure serves a specific function, and their collective integration ensures a robust evaluation of flood impacts. To reflect the relative importance of each indicator, weights were calculated using the Analytic Hierarchy Process (AHP).
AHP is a structured decision-making method that decomposes complex problems into manageable components and quantifies expert judgment through pairwise comparisons. In this study, domain experts were invited to construct a judgment matrix based on the relative importance of each indicator to flood risk. These comparisons incorporated both theoretical knowledge and the specific conditions of the study area. To ensure reliability and minimize subjective bias, the consistency of expert evaluations was tested using the consistency ratio (CR). Only matrices with CR values below 0.1 were accepted, indicating adequate internal consistency.
Once validated, the judgment matrices were used to calculate the weight of each indicator, representing its contribution to the overall flood risk assessment. To improve the accuracy and reliability of the weighting process, multiple rounds of expert consultation and feedback were conducted, allowing for refinement and consensus-building.
Given the interdisciplinary nature of flood risk, particular attention was paid to the diversity of expert backgrounds, including specialists in hydrology, meteorology, geology, and socioeconomics. This ensured that a wide range of influencing factors was considered.
By integrating qualitative expert judgment with quantitative analysis, this approach enhances both the theoretical soundness and practical applicability of the flood risk assessment model. The resulting framework offers strong predictive capability and serves as a reliable tool for risk-informed planning and disaster resilience.
3.3.1. Expert Panel Composition
A diverse group of 12 experts was carefully selected to minimize bias and ensure comprehensive coverage of flood risk factors. The panel consisted of four hydrologists specializing in flood modeling and rainfall analysis, three civil engineers with expertise in infrastructure resilience and flood control standards, two environmental scientists focusing on vegetation cover and ecological impacts, two economists analyzing socioeconomic vulnerability and GDP impacts, and one emergency management specialist with experience in disaster response.
The selection criteria for experts included a minimum of 10 years of field experience in flood-related research or practice, affiliation with reputable academic institutions or government agencies such as China’s Ministry of Water Resources or international bodies like the UNDRR, and demonstrated familiarity with the flood risks specific to Zhejiang Province. This rigorous selection process ensured that the expert panel represented a balanced and authoritative perspective on flood risk assessment.
3.3.2. Data Collection Process
The data collection process involved structured surveys where experts performed pairwise comparisons of all 17 indicators listed in Table 1, using Saaty’s 9-point scale. For example, experts compared the relative importance of “Rainstorm Intensity (H1)” versus “River Network Density (H3)” in contributing to flood hazard. To resolve discrepancies and achieve consensus, the Delphi method was employed, involving two iterative rounds of feedback. Each expert’s judgments were subjected to consistency checks, and only matrices with a consistency ratio (CR) of less than 0.1 were accepted, ensuring the reliability of the inputs.
3.3.3. Weight Calculation Steps
The weight calculation process began with the construction of judgment matrices for each expert, covering all factor layers (hazard, exposure, vulnerability, and disaster prevention and mitigation capacity) and their sub-factors. The principal eigenvector of each matrix was calculated using specialized software such as SuperDecisions(v3.2.0) or MATLAB R2023b to derive the initial weights. These individual weights were then aggregated using the geometric mean to form a consolidated group decision matrix. The final weights, as presented in Table 2, were normalized to sum to 1 for each factor layer, ensuring their applicability in the risk assessment model.
Table 2.
The aggregated pairwise comparison matrix for the hazard (H) indicators.
To ensure the robustness of the weights, a sensitivity analysis was conducted by testing extreme scenarios, such as doubling the rainfall intensity, and observing the impact on the overall risk assessment.
3.3.4. Validation and Transparency
The AHP methodology underwent rigorous peer review by independent flood risk modelers to validate its appropriateness and accuracy. While the study acknowledges potential biases inherent in expert subjectivity, these were mitigated through the diverse composition of the expert panel and the iterative Delphi process.
The weights derived from this process were integral to the flood disaster risk assessment model and were applied to Equation (1) (R = H × E × V × C) to compute the comprehensive risk index. This approach aligns with established methodologies, ensuring the scientific rigor and practical applicability of the study’s findings.
3.4. Flood Disaster Risk Assessment Model
To enhance the clarity of data integration, the following schematic illustrates the workflow for combining remote sensing data, socioeconomic data, and elevation models to generate the final flood disaster risk map. This process is visualized in Figure 2.
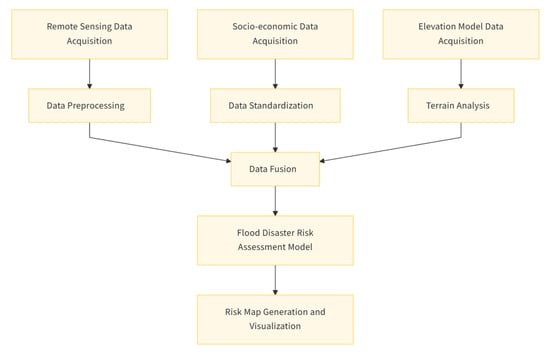
Figure 2.
The flood disaster risk assessment framework. A multi-source data integration approach.
3.4.1. Data Preprocessing
According to the risk concept framework and natural disaster risk calculation formula, this paper uses the fuzzy comprehensive scoring method, the analytic hierarchy process, and the constructed flood disaster risk evaluation index system to establish the following flood disaster risk evaluation model.
In Formulas (2)–(5), the terms , , , represent the normalized or scaled values of indicator iii within the four respective dimensions: hazard (H), exposure (E), susceptibility (or sensitivity, S), and capacity (or coping capacity, C). Each dimension is calculated as a weighted sum of its indicators, where , , , denote the corresponding weights. The formulas are given as follows.
Among them, R is the flood disaster risk index, which represents the degree of flood disaster risk. The larger the value, the greater the risk of a flood disaster. H, E, V, and C are the risk, exposure, vulnerability, and disaster prevention and mitigation capacity of flood disasters, W is the weight coefficient of each evaluation index, and A is the quantitative value of each evaluation index [36,37,38,39].
Since the various indicators in the indicator system may be very different, it is inconvenient to conduct a comprehensive evaluation. Thus, it is necessary to standardize the indicator data. Standardization is also dimensionless. With the help of a certain evaluation function, the influence of the physical dimension of the index characteristic is eliminated, and the index characteristic value is transformed into a dimensionless value. This dimensionless value is a measure of the degree of membership of the evaluation factor to the superior. The greater the degree of superiority of the evaluation factor, the better the evaluation factor.
The standardized formula for the bigger the better index [40,41,42].
The following formula is used for positive indicators, where higher values of indicate a greater risk or a stronger contribution to the respective dimension (e.g., higher population density increases exposure).
The standardized formula for the smaller the better index [43,44,45].
In contrast, the standardized formula below is applied to negative indicators, where higher values imply lower risk or a mitigating effect on vulnerability (e.g., better healthcare reduces vulnerability).
After obtaining the index value and weight of the risk factor, it can be calculated and evaluated according to the risk assessment model. For the calculated results, the greater the risk index value, the higher the degree of risk, that is, the higher the sensitivity to flood disasters. Due to the complexity of flood disasters, they can be divided into several levels according to specific conditions for comparison and decision-making.
Remote Sensing Data. Landsat satellite imagery (2021–2022) was used. The images underwent radiometric correction and geometric correction to eliminate atmospheric and sensor noise effects. Subsequently, supervised classification was applied to extract flood-inundated areas and vegetation distribution information.
Socioeconomic Data. The socioeconomic database was based on 2022 spatial distribution data from MapInfo. Population density and economic asset distribution data were normalized using Formulas (6) and (7) to eliminate dimensional differences.
Elevation Model Data. The SRTM DEM with 30 m resolution was used to calculate terrain slope and relative height. Hydrological analysis tools were employed to derive river network density and flood pathways.
3.4.2. Data Fusion and Data Source
After preprocessing, remote sensing data provided hazard-related indicators such as flood inundation extent and vegetation coverage; socioeconomic data offered exposure and vulnerability indicators like population density and economic assets; elevation model data supplied terrain-related hazard indicators. All data were integrated into a geographic information system (GIS) environment and overlaid with administrative boundaries to ensure spatial consistency.
Table 3 below lists the data sources, acquisition years, and spatial resolutions.
Table 3.
Data sources and processing methods for flood risk assessment.
4. Results
4.1. Assessment of Flood Damage
The weight coefficient of the evaluation index is calculated by AHP, and the specific results are shown in Table 4 and Appendix A.
Table 4.
Weight coefficients of the flood disaster evaluation index.
Table 4 presents the weight coefficients assigned to each indicator in the flood risk assessment system, which are critical for calculating the overall flood risk index. The indicators are grouped into four main dimensions: hazard (H), exposure (E), susceptibility/sensitivity (S), and coping capacity (C). Within each dimension, the weights are normalized such that their sum equals 1. This hierarchical normalization ensures a balanced evaluation across all subsystems.
Since the overall risk index is calculated by multiplying the scores of H, E, S, and C (Formula (1)), global normalization is not required. The use of locally normalized weights is a standard practice and does not affect the model’s validity.
Within the hazard category, key indicators include Rainstorm Intensity (H1), Elevation and Slope (H2), River Network Density (H3), and Vegetation Coverage (H4). The exposure dimension incorporates indicators such as Population Density (E1) and Economic Exposure, while the vulnerability dimension includes measures of both population and economic susceptibility. The final dimension, disaster prevention and mitigation capacity, evaluates institutional and infrastructural readiness.
The weight coefficients, calculated using the Analytic Hierarchy Process (AHP), represent the relative importance of each indicator in contributing to flood risk. For instance, Rainstorm Intensity (H1) has a weight of 0.16, emphasizing its significant influence on hazard assessment. Population Density (E1), with a weight of 0.75, reflects its dominant role in determining exposure levels.
By assigning these weights, the model captures the relative contribution of diverse factors to flood risk, enabling the calculation of a composite flood risk index (R). This index supports informed decision-making by helping prioritize interventions, allocate resources effectively, and enhance the overall resilience of at-risk communities.
Flood conditions under different frequencies (Table 5) were derived from historical rainfall records (1990–2022) provided by the Taizhou Hydrological Bureau, combined with hydrodynamic modeling (HEC-RAS) simulating submerged depth and water accumulation time. The frequency analysis followed the Pearson Type III distribution, a standard method for flood risk assessment in China from the Ministry of Water Resources. Based on flood events of varying return periods and the region’s flood control and drainage capacity, this study delineates inundation extents for each flood frequency. Corresponding socioeconomic data are sourced from a spatially distributed database developed using MapInfo, ensuring alignment between flood impact zones and affected populations and assets.
Table 5.
Flooding conditions at different frequencies.
Accurate estimation of flood-related losses hinges on the reliable determination of property loss rates. In this study, loss rates for different flood frequencies are primarily derived from average water depth and duration of inundation. Table 5 provides detailed data on floodwater depth and accumulation time across frequency categories, forming the basis for calculating flood loss rates.
Rice thrives in humid climates and requires continuous water retention in paddy fields during its growing season. Although rice exhibits strong regenerative capacity—allowing submerged seedlings to recover as long as the roots remain viable—its tolerance to flooding is limited. Experimental observations indicate that rice can generally endure flooding for 3–5 days without significant yield reduction, provided the water depth does not exceed 20 cm. This threshold is considered the crop’s critical water depth. Accordingly, 3–5 days is set as the flooding tolerance period for rice. Estimated rice loss rates under 20%, 10%, 5%, and 2% annual flood probabilities are 0.46, 0.73, 1.05, and 1.08, respectively. In this region, rice is cultivated from late June to early November, with an average yield of 450 kg per mu and a market price of 1.4–1.8 yuan/kg. Based on these values, rice loss estimates can be calculated accordingly.
Flood disasters pose multifaceted risks to human populations. These include direct threats such as casualties and waterborne disease outbreaks, as well as indirect impacts like economic losses, infrastructure damage, and interruptions in essential services. Long-term consequences may include challenges in economic recovery, disruptions to education and healthcare services, and broader threats to social stability. Thus, comprehensive risk assessment and effective disaster management are vital to safeguarding lives, property, and community resilience.
In terms of property damage, household losses vary by building type. Field surveys indicate that most homes in the region are either reinforced concrete buildings or brick structures, with minimal representation of more vulnerable brick-earth or earthen houses. The flood resistance of buildings and brick structures significantly reduces structural collapse and helps protect household belongings. Estimated housing loss rates under 20%, 10%, 5%, and 2% flood probabilities are 0.013, 0.019, 0.035, and 0.073, respectively.
Household property loss rates are influenced by flood depth, duration, flow velocity, structural integrity of housing, and the nature and flood resilience of personal belongings. Buildings with stronger structural resistance not only suffer less damage but can also retain certain flood-tolerant items, minimizing losses from displacement. The estimated household property loss rates for 20%, 10%, 5%, and 2% flood frequencies are 0.23, 0.35, 0.53, and 0.66, respectively. Detailed loss rates for each indicator are presented in Figure 3.
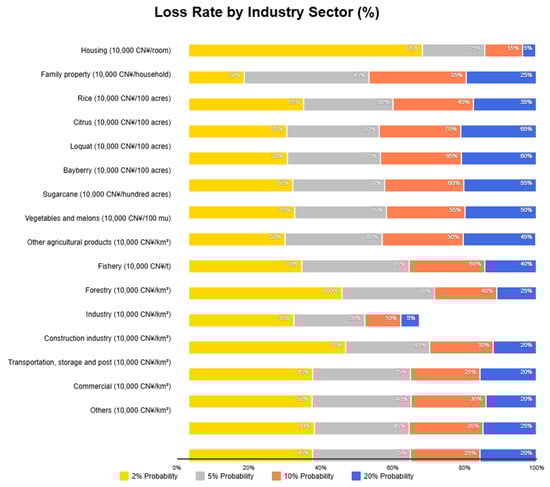
Figure 3.
The loss rate of different items [Source. PICC Typhoon Catastrophe Model Report (2023)].
Based on a typical survey in this region, the average household property value is approximately 45,400 yuan. Using this figure, total household property losses can be estimated. Figure 4 presents the direct flood loss calculations aggregated by flood frequency categories. Indirect losses are estimated as 20% of the direct flood losses, yielding the total flood losses for the area. (Note. A–P correspond to specific towns listed below.)
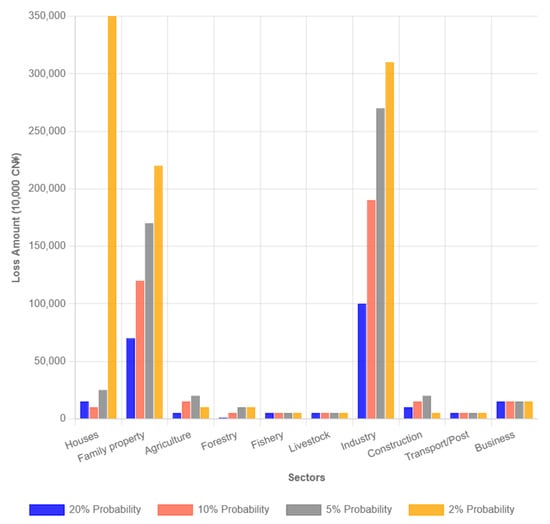
Figure 4.
Flood loss of various frequency floods (CNY 10,000).
4.2. Risk Assessment Results
According to the flood disaster risk index values shown in Figure 5 and the local flood history, flood disaster risk assessment criteria were established (see Table 6). By analyzing historical flood events and their impacts, risk index thresholds were correlated with actual damage levels. This enables more accurate prediction of future flood disaster impacts. Additionally, expert input and practical flood risk management experience were incorporated to formulate response measures and resource allocation strategies tailored to different risk levels, ensuring the criteria are both scientifically sound and operationally feasible.
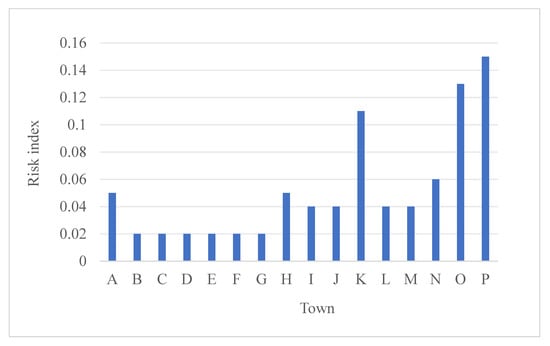
Figure 5.
The risk assessment index of each town in the district. (Notes: A. Shiqiaotou Town, B. Ruoheng Town, C. Pengjie Town, D. Xinhe Town, E. Wugen Town, F. Xinqiao Town, G. Zeguo Town, H. Chumen Town, I. Lupu Town, J. Chengnan Town, K. Longxi Town, L. Qinggang Town, M. Binhai Town, N. Songmen Town, O. Ganjiang Town, P. Shitang Town).
Table 6.
Risk evaluation criteria.
According to this standard, the urban water shortage risk is divided into low risk, medium risk, and high risk. According to the contribution rate of each evaluation index in the comprehensive evaluation, the flood disaster risk is divided into four types: natural type, social structure type, capability type, and mixed type—the sum of hazard, exposure and vulnerability, and disaster prevention and mitigation capabilities type. Among these four factors, the risk greater than 0.6 can be defined as a natural type, and the product of exposure and vulnerability greater than 0.2 can be defined as a social structure type. The disaster prevention and mitigation capabilities greater than 0.6 can be defined as a capacity type. Those who meet two or three of the above conditions are defined as mixed, and the analysis results are shown in Table 7.
Table 7.
A degree and type of flood disaster risk in the area.
Most towns, including B, C, D, and others, are classified as low risk. This likely reflects favorable terrain, lower population density, or stronger disaster prevention and mitigation capabilities. Medium-risk areas such as A, H, and M may face some risk factors (e.g., severe rainstorms or challenging terrain) but retain sufficient disaster resistance and economic capacity to manage these risks. High-risk towns, including K and P, exhibit elevated vulnerability due to factors such as proximity to rivers, low-lying terrain, high population density, or economic fragility.
Figure 6 compares the contribution rates of different risk factors to the overall risk. Towns like B, C, D, E, and F are primarily constrained by disaster prevention and mitigation factors, indicating potential weaknesses in flood control infrastructure and emergency response systems that should be strengthened. In contrast, towns such as N, O, and P are mainly limited by hazard and vulnerability factors, necessitating targeted mitigation strategies addressing natural conditions (e.g., topography, rainfall) and socioeconomic vulnerabilities.
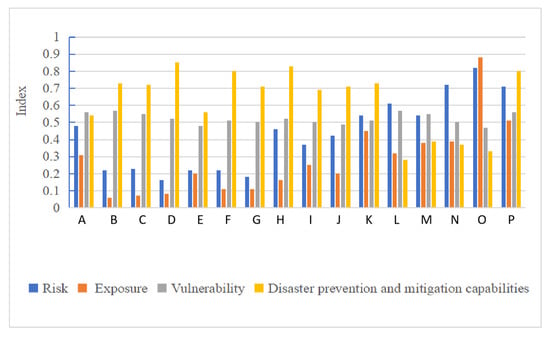
Figure 6.
A comparison of the contribution rate of risk evaluation indicators in this area. (Notes: A. Shiqiaotou Town, B. Ruoheng Town, C. Pengjie Town, D. Xinhe Town, E. Wugen Town, F. Xinqiao Town, G. Zeguo Town, H. Chumen Town, I. Lupu Town, J. Chengnan Town, K. Longxi Town, L. Qinggang Town, M. Binhai Town, N. Songmen Town, O. Ganjiang Town, P. Shitang Town).
In flood disaster years, household property loss rates were 0.23, 0.35, 0.53, and 0.66 for 20%, 10%, 5%, and 2% frequency floods, respectively. The spatial variation in loss factors highlights the importance of tailored interventions according to local risk profiles.
5. Discussion
This study presents a comprehensive flood risk assessment across 16 towns in Taizhou, Zhejiang Province, highlighting spatial disparities in risk driven by hazard intensity, exposure, vulnerability, and disaster prevention capacity. High-risk towns such as Longxi and Shitang (R > 0.1) require urgent infrastructure improvements, including elevated levees, expanded drainage systems, and flood retention basins. Revising land-use regulations and integrating IoT-based real-time monitoring can further enhance preparedness.
Medium-risk areas like Shiqiaotou and Binhai (0.04 ≤ R ≤ 0.1) demand social interventions. Strengthening public health infrastructure, enforcing flood-resilient construction standards, and supporting vulnerable populations—particularly the elderly and economically disadvantaged—are essential for reducing risk.
Low-risk towns such as Ruoheng and Pengjie (R < 0.04) reflect strong disaster prevention capabilities. These towns can serve as models for risk governance, though ongoing maintenance of existing defenses remains crucial amid intensifying climate risks.
Taizhou’s experience, especially during Typhoon Muifa (2022), illustrates the compounded risks faced by coastal cities amid rapid urbanization and climate change. The combined AHP and spatial mapping approach used here offers a replicable framework for similar regions in East Asia.
By classifying risk into natural, social–structural, capacity-based, or mixed types, the model supports targeted policy responses. Natural hazard zones may prioritize engineering solutions, while areas driven by social vulnerability require inclusive planning and economic support. This typology aids local governments in aligning risk reduction efforts with development planning.
This study relies on static socioeconomic data, which may not reflect real-time dynamics during floods. Future models should incorporate mobile and sensor data to improve temporal accuracy. Additionally, integrating regional climate projections would better account for long-term changes in flood patterns.
While AHP provides structured evaluation, combining it with machine learning could improve indicator weighting based on historical flood impacts. Finally, stronger collaboration with planners and local stakeholders is needed to bridge risk assessment with practical action, enhancing policy uptake and community resilience.
6. Conclusions
This study established a comprehensive flood disaster risk assessment model through a systematic analysis of hazard, exposure, vulnerability, and disaster prevention capabilities. Applying the Analytic Hierarchy Process (AHP), we determined indicator weights and developed a quantifiable risk index (R = H × E × V × C). The model was successfully implemented across 16 towns in coastal Zhejiang Province, revealing distinct risk levels. Most towns exhibited low risk, while specific areas like Longxi and Shitang faced high risk due to pronounced natural hazards and socioeconomic vulnerability. Risk typology analysis further classified towns into natural, social–structural, capacity-driven, or mixed risk profiles, providing granular insights into dominant risk drivers.
The research offers significant contributions to policy, practice, and scientific literature. For policymakers, the spatially explicit risk classification (low/medium/high) enables prioritized resource allocation for flood control infrastructure and emergency planning in high-risk zones. Practitioners benefit from the validated indicator system and AHP weighting methodology, which can be adapted to other flood-prone regions globally. Scientifically, this work advances integrated risk modeling by harmonizing physical drivers (e.g., rainfall intensity, terrain) with socioeconomic factors (e.g., population density, economic resilience), addressing gaps in holistic flood risk assessment frameworks.
Several limitations warrant future research. The AHP weight determination, while rigorous, remains subjective to expert judgment; incorporating machine learning for dynamic weight calibration could enhance objectivity. The model’s reliance on static socioeconomic data also limits real-time applicability—integrating IoT sensor networks for live exposure monitoring would improve responsiveness. Further studies should explore climate projection integration to assess long-term risk evolution under scenarios like intensified typhoons or sea-level rise, particularly for coastal regions such as our study area in Taizhou.
Author Contributions
Conceptualization, Y.Y. and T.Z.; methodology, Y.Y.; software, Y.Y.; validation, Y.Y. and T.Z.; formal analysis, Y.Y.; investigation, Y.Y.; resources, Y.Y.; data curation, Y.Y.; writing—original draft preparation, Y.Y.; writing—review and editing, Y.Y.; visualization, Y.Y.; supervision, T.Z.; project administration, T.Z.; funding acquisition, T.Z. All authors have read and agreed to the published version of the manuscript.
Funding
This work was supported by Key Special Topics for Intergovernmental International Cooperation in Science, Technology and Innovation under the National Key R&D Programme (2019YFE0115702).
Data Availability Statement
The figures used to support the findings of this study are included in the article.
Acknowledgments
The authors would like to express sincere thanks to those who have contributed to this research.
Conflicts of Interest
The authors declare that they have no conflicts of interest.
Appendix A
Table A1.
Indicator definition.
Table A1.
Indicator definition.
| Indicator Name | Unit | Description | Positive/Negative Nature | Data Source |
|---|---|---|---|---|
| Rainstorm Intensity (H1) | mm | Daily maximum rainfall and 24 h typhoon-season rainfall from 15 Taizhou rain gauges over 32 years (1990–2022), fitted to a Pearson Type III distribution to determine intensity thresholds for 5-, 10-, 20-, and 50-year return periods | Positive | Taizhou Hydrological Bureau |
| Relative Height and Slope (H2) | Dimensionless | Slope and relative elevation derived from SRTM DEM data, assessing terrain susceptibility to water accumulation and runoff concentration | Positive | SRTM DEM |
| River Network Density (H3) | Dimensionless | Derived from hydrological modeling of DEM using flow accumulation and stream order analysis, indicating the density of river distribution within the region | Positive | SRTM DEM |
| Vegetation Coverage Rate (H4) | % | Assessed using NDVI values from cloud-free Landsat imagery, reflecting surface permeability and interception potential | Negative | Landsat Satellite Imagery |
| Population Density (E1) | persons/km2 | Spatial distribution data from 2022, representing the number of people per unit area | Positive | MapInfo Database |
| Resident Property (E2) | CNY | Total value of resident property within the region | Positive | MapInfo Database |
| Industrial Output Value (E3) | CNY | Industrial Gross Output Value of the region | Positive | MapInfo Database |
| Agriculture, Forestry, Animal Husbandry, and Fish Production Value (E4) | CNY | Gross output value of agriculture, forestry, animal husbandry, and fishery in the region | Positive | MapInfo Database |
| Age Structure (S1) | Dimensionless | Age distribution of the population affecting the emergency response capacity of affected groups | Positive | Municipal Health Records |
| Health Status (S2) | Dimensionless | Measured by age-standardized chronic disease prevalence, with lower values indicating better health status | Negative | Municipal Health Records |
| Population Structure (S3) | Dimensionless | Characteristics of population composition, such as gender ratio and family size | Positive | Municipal Health Records |
| Education Level (S4) | Years | Average years of education of the population | Negative | Municipal Health Records |
| Proportion of Small Businesses (S5) | % | Ratio of small enterprises to the total number of enterprises in the region | Positive | Municipal Economic Statistics |
| Proportion of Farmland Vulnerable to Flooding (S6) | % | Ratio of farmland susceptible to flooding to the total farmland in the region | Positive | Municipal Agricultural Statistics |
| Flood Control Standard (C1) | Year recurrence interval | Indicating the flood frequency that flood control engineering can resist | Negative | Taizhou Hydrological Bureau |
| Mechanical Power per Capita (C2) | Kilowatts/person | Average mechanical power per person, reflecting rescue and recovery capabilities | Negative | Regional Economic Statistics |
References
- Angelakis, A.N.; Valipour, M.; Ahmed, A.T.; Tzanakakis, V.; Paranychianakis, N.V.; Krasilnikoff, J.; Drusiani, R.; Mays, L.; El Gohary, F.; Koutsoyiannis, D.; et al. Water conflicts: From ancient to modern times and in the future. Sustainability 2021, 13, 4237. [Google Scholar] [CrossRef]
- Turdimovich, A.T.; Khasanovich, S.M. Threats posing a danger to civilization and humanity. Eur. Sch. J. 2021, 2, 181–184. [Google Scholar]
- Glago, F.J. Flood disaster hazards; causes, impacts and management: A state-of-the-art review. In Natural Hazards-Impacts, Adjustments and Resilience; IntechOpen: London, UK, 2021; pp. 29–37. [Google Scholar]
- Kong, F. Rising to the Climate Challenge: Better Understanding the Rural Rainstorm Flooding Disaster Risk Management Using Practical Insights from China. Nat. Hazards Rev. 2024, 25, 04024002. [Google Scholar] [CrossRef]
- Song, M.; Du, Q. Analysis and exploration of damage-reduction measures for flood disasters in China. Ann. Oper. Res. 2019, 283, 795–810. [Google Scholar] [CrossRef]
- IPCC. Climate Change 2023: Synthesis Report of the IPCC Sixth Assessment Report; Intergovernmental Panel on Climate Change: Geneva, Switzerland, 2023; Available online: https://www.ipcc.ch/report/ar6/syr/ (accessed on 7 July 2025).
- UNDRR. Global Assessment Report (GAR) 2025: Resilience Pays: Financing and Investing for Our Future; United Nations Office for Disaster Risk Reduction: Geneva, Switzerland, 2025; Available online: https://www.undrr.org/gar/gar2025 (accessed on 7 July 2025).
- Lei, T.; Wang, J.; Li, X.; Wang, W.; Shao, C.; Liu, B. Flood disaster monitoring and emergency assessment based on multi-source remote sensing observations. Water 2022, 14, 2207. [Google Scholar] [CrossRef]
- Munawar, H.S.; Hammad, A.W.; Waller, S.T. Remote sensing methods for flood prediction. A review. Sensors 2022, 22, 960. [Google Scholar] [CrossRef] [PubMed]
- Sharma, T.P.P.; Zhang, J.; Koju, U.A.; Zhang, S.; Bai, Y.; Suwal, M.K. Review of flood disaster studies in Nepal: A remote sensing perspective. Int. J. Disaster Risk Reduct. 2019, 34, 18–27. [Google Scholar] [CrossRef]
- Liu, J.; Cho, H.S.; Osman, S.; Jeong, H.G.; Lee, K. Review of the status of urban flood monitoring and forecasting in TC region. Trop. Cyclone Res. Rev. 2022, 11, 103–119. [Google Scholar] [CrossRef]
- Lopez, T.; Al Bitar, A.; Biancamaria, S.; Güntner, A.; Jäggi, A. On the use of satellite remote sensing to detect floods and droughts at large scales. Surv. Geophys. 2020, 41, 1461–1487. [Google Scholar] [CrossRef]
- Rosenzweig, B.; Montalto, F.A.; Orton, P.; Kaatz, J.; Maher, N.; Kleyman, J.; Chen, Z.; Sanderson, E.; Adhikari, N.; McPhearson, T.; et al. NPCC4: Climate change and New York City’s flood risk. Ann. N. Y. Acad. Sci. 2024, 1539, 127–184. [Google Scholar] [CrossRef] [PubMed]
- Chen, Z.; Zhang, X.; Chen, J. Monitoring terrestrial water storage changes with the Tongji-Grace2018 model in the nine major river basins of the Chinese Mainland. Remote Sens. 2021, 13, 1851. [Google Scholar] [CrossRef]
- Li, F.; Jia, Z.; Zhou, X. Establishing Natural Resources Monitoring Systems in China: Situation, Problem and Suggestion. Int. Arch. Photogramm. Remote Sens. Spat. Inf. Sci. 2024, 48, 599–606. [Google Scholar] [CrossRef]
- Peng, L.; Wang, Y.; Yang, L.; Garchagen, M.; Deng, X. A comparative analysis on flood risk assessment and management performances between Beijing and Munich. Environ. Impact Assess. Rev. 2024, 104, 107319. [Google Scholar] [CrossRef]
- Zhang, J.; Chen, Y. Risk assessment of flood disaster induced by typhoon rainstorms in Guangdong province, China. Sustainability 2019, 11, 2738. [Google Scholar] [CrossRef]
- Sun, R.; Gong, Z.; Guo, W.; Shah, A.A.; Wu, J.; Xu, H. Flood disaster risk assessment of and countermeasures toward Yangtze River Delta by considering index interaction. Nat. Hazards 2022, 112, 475–500. [Google Scholar] [CrossRef]
- Zhu, Z.; Zhang, Y. Flood disaster risk assessment based on random forest algorithm. Neural Comput. Appl. 2022, 24, 3443–3455. [Google Scholar] [CrossRef]
- Zhang, D.; Shi, X.; Xu, H.; Jing, Q.; Pan, X.; Liu, T.; Wang, H.; Hou, H. A GIS-based spatial multi-index model for flood risk assessment in the Yangtze River Basin, China. Environ. Impact Assess. Rev. 2020, 83, 106397. [Google Scholar] [CrossRef]
- Wu, Z.; Xue, W.; Xu, H.; Yan, D.; Wang, H.; Qi, W. Urban Flood Risk Assessment in Zhengzhou, China, Based on a D-Number-Improved Analytic Hierarchy Process and a Self-Organizing Map Algorithm. Remote Sens. 2022, 14, 4777. [Google Scholar] [CrossRef]
- Zhu, X.; Guo, H.; Huang, J.J. Urban flood susceptibility mapping using remote sensing, social sensing and an ensemble machine learning model. Sustainable Cities and Society 2024, 108, 105508. [Google Scholar] [CrossRef]
- Nguyen, H.D. GIS-based hybrid machine learning for flood susceptibility prediction in the Nhat Le–Kien Giang watershed, Vietnam. Earth Sci. Inform. 2022, 15, 2369–2386. [Google Scholar] [CrossRef]
- Pham, B.T.; Luu, C.; Van Phong, T.; Trinh, P.T.; Shirzadi, A.; Renoud, S.; Asadi, S.; Van Le, H.; von Meding, J.; Clague, J.J. Can deep learning algorithms outperform benchmark machine learning algorithms in flood susceptibility modeling? J. Hydrol. 2021, 592, 125615. [Google Scholar] [CrossRef]
- Huang, S.; Wang, H.; Xu, Y.; She, J.; Huang, J. Key Disaster-Causing Factors Chains on Urban Flood Risk Based on Bayesian Network. Land 2021, 10, 210. [Google Scholar] [CrossRef]
- Chen, F.; Li, Q.; Wang, H.; Deng, M. Assessing flood risk and investigating the potential mechanism based on machine learning models. A case study of the Pearl River Delta. Sci. Total Environ. 2021, 796, 148944. [Google Scholar]
- IPCC. Climate Change 2022: Impacts, Adaptation and Vulnerability. Contribution of Working Group II to the Sixth Assessment Report of the Intergovernmental Panel on Climate Change; Cambridge University Press: Cambridge, UK, 2022. [Google Scholar]
- Islam, T.; Zeleke, E.B.; Afroz, M.; Melesse, A.M. A Systematic Review of Urban Flood Susceptibility Mapping: Remote Sensing, Machine Learning, and Other Modeling Approaches. Remote Sens. 2025, 17, 524. [Google Scholar] [CrossRef]
- Asl, S.R.; Rahman, A.; Tate, E.; Lehman, W.; Wing, O. Social vulnerability correlates of flood risk to crops and buildings. Nat. Hazards 2025, 121, 8137–8158. [Google Scholar] [CrossRef]
- Tabasi, N.; Fereshtehpour, M.; Roghani, B. A Review on Flood Risk Conceptual Frameworks and Development of Hierarchical Structures for Assessment Criteria. Nat. Hazards Earth Syst. Sci. 2024; preprint. [Google Scholar]
- Yuan, F.; Fan, C.; Farahmand, H.; Coleman, N.; Esmalian, A.; Lee, C.-C.; Patrascu, F.I.; Zhang, C.; Dong, S.; Mostafavi, A. Smart Flood Resilience: Harnessing Community-Scale Big Data for Predictive Flood Risk Monitoring, Rapid Impact Assessment, and Situational Awareness. arXiv 2021, arXiv:2111.06461. [Google Scholar]
- GADM. Global Administrative Areas Database. Version 4.1. 2023. Available online: https://gadm.org (accessed on 7 July 2025).
- Chen, L.; Wang, Q.; Zhu, G.; Lin, X.; Qiu, D.; Jiao, Y.; Lu, S.; Li, R.; Meng, G.; Wang, Y. Dataset of stable isotopes of precipitation in the Eurasian continent. Earth Syst. Sci. Data Discuss. 2023, 2023, 1–24. [Google Scholar] [CrossRef]
- Chen, L.; Zhu, G.; Lin, X.; Li, R.; Lu, S.; Jiao, Y.; Qiu, D.; Meng, G.; Wang, Q. The complexity of moisture sources affects the altitude effect of stable isotopes of precipitation in inland mountainous regions. Water Resour. Res. 2024, 60, e2023WR036084. [Google Scholar] [CrossRef]
- Saaty, T.L. The analytic hierarchy process (AHP). J. Oper. Res. Soc. 1980, 41, 1073–1076. [Google Scholar]
- Zou, Q.; Zhou, J.; Zhou, C.; Song, L.; Guo, J. Comprehensive flood risk assessment based on set pair analysis-variable fuzzy sets model and fuzzy AHP. Stoch. Environ. Res. Risk Assess. 2013, 27, 525–546. [Google Scholar] [CrossRef]
- Wang, Z.; Lai, C.; Chen, X.; Yang, B.; Zhao, S.; Bai, X. Flood hazard risk assessment model based on random forest. J. Hydrol. 2015, 527, 1130–1141. [Google Scholar] [CrossRef]
- Xu, H.; Ma, C.; Lian, J.; Xu, K.; Chaima, E. Urban flooding risk assessment based on an integrated k-means cluster algorithm and improved entropy weight method in the region of Haikou, China. J. Hydrol. 2018, 563, 975–986. [Google Scholar] [CrossRef]
- Li, C.; Sun, N.; Lu, Y.; Guo, B.; Wang, Y.; Sun, X.; Yao, Y. Review on urban flood risk assessment. Sustainability 2022, 15, 765. [Google Scholar] [CrossRef]
- Chen, W.; Li, Y.; Xue, W.; Shahabi, H.; Li, S.; Hong, H.; Wang, X.; Bian, H.; Zhang, S.; Pradhan, B.; et al. Modeling flood susceptibility using data-driven approaches of naïve bayes tree, alternating decision tree, and random forest methods. Sci. Total Environ. 2020, 701, 134979. [Google Scholar] [CrossRef] [PubMed]
- Chen, Y.; Liu, R.; Barrett, D.; Gao, L.; Zhou, M.; Renzullo, L.; Emelyanova, I. A spatial assessment framework for evaluating flood risk under extreme climates. Sci. Total Environ. 2015, 538, 512–523. [Google Scholar] [CrossRef] [PubMed]
- Joo, H.; Choi, C.; Kim, J.; Kim, D.; Kim, S.; Kim, H.S. A Bayesian network-based integrated for flood risk assessment (InFRA). Sustainability 2019, 11, 3733. [Google Scholar] [CrossRef]
- Pham, B.T.; Luu, C.; Van Dao, D.; Van Phong, T.; Nguyen, H.D.; Van Le, H.; von Meding, J.; Prakash, I. Flood risk assessment using deep learning integrated with multi-criteria decision analysis. Knowl.-Based Syst. 2021, 219, 106899. [Google Scholar] [CrossRef]
- Malekian, A.; Azarnivand, A. Application of integrated Shannon’s entropy and VIKOR techniques in prioritization of flood risk in the Shemshak watershed, Iran. Water Resour. Manag. 2016, 30, 409–425. [Google Scholar] [CrossRef]
- Cai, T.; Li, X.; Ding, X.; Wang, J.; Zhan, J. Flood risk assessment based on hydrodynamic model and fuzzy comprehensive evaluation with GIS technique. Int. J. Disaster Risk Reduct. 2019, 35, 101077. [Google Scholar] [CrossRef]
Disclaimer/Publisher’s Note: The statements, opinions and data contained in all publications are solely those of the individual author(s) and contributor(s) and not of MDPI and/or the editor(s). MDPI and/or the editor(s) disclaim responsibility for any injury to people or property resulting from any ideas, methods, instructions or products referred to in the content. |
© 2025 by the authors. Licensee MDPI, Basel, Switzerland. This article is an open access article distributed under the terms and conditions of the Creative Commons Attribution (CC BY) license (https://creativecommons.org/licenses/by/4.0/).