Article

Experimental Measurements on the Influence of Inlet Pipe Configuration on Hydrodynamics and Dissolved Oxygen Distribution in Circular Aquaculture Tank

1
Beijing Key Laboratory of Fishery Biotechnology, Fisheries Science Institute, Beijing Academy of Agriculture and Forestry Sciences, Beijing 100068, China
2
National Engineering Research Center for Marine Aquaculture, Zhejiang Ocean University, Zhoushan 316022, China
3
Qinghai Key Laboratory of Qinghai-Lake Naked Carps Breeding and Conservation, The Rescue and Rehabilitation Center of Naked Carps of Qinghai Lake, Xining 810016, China
*
Authors to whom correspondence should be addressed.
These authors contributed equally to this work.
Water 2025, 17(15), 2172; https://doi.org/10.3390/w17152172
Submission received: 17 March 2025 / Revised: 24 May 2025 / Accepted: 26 June 2025 / Published: 22 July 2025
(This article belongs to the Section Water, Agriculture and Aquaculture)

Abstract

Optimizing hydrodynamic performance and dissolved oxygen (DO) distribution is essential for improving water quality management in industrial recirculating aquaculture systems. This study combines experimental measurements and data analysis to evaluate the effects of the inlet pipe flow rate (Q), deployment distance ratio (d/r), deployment angle (θ), inlet pipe structure on hydrodynamics and the dissolved oxygen distribution across various tank layers. The flow field distribution in the tanks was measured using Acoustic Doppler Velocimetry (ADV), and the hydrodynamic characteristics, including average velocity (vavg) and the velocity uniformity coefficient (DU50), were quantitatively analyzed. The dissolved oxygen content at different tank layers was recorded using an Aquameter GPS portable multi-parameter water quality analyzer. The findings indicate that average velocity (vavg) and the velocity uniformity coefficient (DU50) are key determinants of the hydrodynamic characteristic of circular aquaculture tanks. Optimal hydrodynamic performance occurs for the vertical single-pipe porous configuration at Q = 9 L/s, d/r = 1/4, and θ = 45°,the average velocity reached 0.0669 m/s, and the uniformity coefficients attained a maximum value of 40.4282. In a vertical single-pipe porous structure, the tank exhibits higher dissolved oxygen levels compared to a horizontal single-pipe single-hole structure. Under identical water inflow rates and deployment distance ratios, dissolved oxygen levels in the surface layer of the circular aquaculture tank are significantly greater than that in the bottom layer. The results of this study provide valuable insights for optimizing the engineering design of industrial circular aquaculture tanks and addressing the dissolved oxygen distribution across different water layers.

1. Introduction

The industrial recirculating aquaculture system (RAS) is a significant advancement in aquaculture, which has seen rapid global development in recent years. According to the China Fishery Statistical Yearbook [1], the coverage of seawater aquaculture reached 207,4420 hectares, reflecting a 2.41% increase from the previous year, with industrialized seawater aquaculture accounting for 43,194,026 m3. Industrial aquaculture represents an emerging paradigm that incorporates advanced equipment, information technology, engineering, aquaculture science, and related fields. This model offers several advantages, including the conservation of water and land resources, enhanced biosecurity and production efficiency, greater environmental control, and improved aquatic product quality and safety. It aligns with the principles of ecological sustainability and the concept of sustainable development, positioning itself as a strategic avenue for the future development of China’s aquaculture sector [2,3].
The efficient and prompt removal of solid waste from aquaculture tanks is crucial for sustaining environmental stability and safeguarding the well-being of cultivated species [4,5]. Aquaculture tanks function as primary habitats for organisms during their entire life cycle, and optimizing their self-cleaning mechanisms for solid waste removal represents a key research focus [6,7]. In high-density aquaculture systems, stocking densities and feeding rates are significantly elevated. If aquatic waste products such as uneaten feed, feces, and metabolites are not efficiently removed, their accumulation on the tank substrate leads to a depletion of dissolved oxygen in the benthic layer. During decomposition, these materials release nitrosamines and ammoniacal nitrogen, leading to water quality degradation and adverse effects on aquatic organism health and growth, particularly during disease outbreaks. Researchers globally have employed physical experiments [8] and numerical simulations [9,10] to analyze the hydrodynamic characteristics of aquaculture tanks. For example, Davidson and Oca et al. [11,12] analyzed the effects of bottom drainage flow and inlet structure on rotational velocity and dissolved oxygen concentration within large Cornell-type double-drainage circular aquaculture tanks. Oca and Masaló [13] employed Particle Image Velocimetry (PIV) to assess the influence of the length-to-width (L/W) ratio on flow velocity distribution in rectangular aquaculture tanks, demonstrating that elevated velocities are critical for improving self-cleaning performance. Gorle et al. [14] analyzed the hydrodynamic characteristics of a recirculating aquaculture tank using the Lagrangian particle tracking method within Open FOAM simulations, assessing the impact of inlet and outlet configurations on velocity, vorticity, and turbulence. Duarte et al. [15] explored the effects of tank shape and velocity on fish distribution through image analysis, introducing the Fish Distribution Uniformity Coefficient (FCU) as a quantitative metric for spatial uniformity. Hu et al. [16] evaluated solid waste removal efficiency by quantifying residual mass, removal time, average velocity, and flow rate distribution uniformity and investigated the role of inlet position on waste removal within octagonal aquaculture tanks. Dissolved oxygen (DO), a critical factor for aquatic organism survival [17], is pivotal in aquaculture operations [18], with its dynamics predominantly governed by aerator design and system architecture. In summary, existing research has predominantly utilized physical model tests and numerical simulations to assess the hydrodynamic characteristics [6,19] of large-scale circular aquaculture tanks and dissolved oxygen levels [18,20] across different water layers. However, experimental measurements on large-scale circular aquaculture tanks are scarce, hindering the development of a robust reference framework or systematic empirical basis for optimizing their engineering design.
This study is structured as follows: Section 2 describes the experimental setup for the study of the hydrodynamic characteristics of different water layers in a recirculating aquaculture tank. Section 3, grounded in experimental measurements, analyses the effects of the inlet pipe flow rate (Q), deployment distance ratio (d/r), deployment angle (θ), and inlet structure on the hydrodynamic characteristics and dissolved oxygen distribution within a recirculating aquaculture tank. These findings offer a framework for optimizing the design of large-scale industrial recirculating aquaculture tanks. Section 4 comprehensively discusses the implications of these results and proposes recommendations for future research directions.

2. Materials and Methods

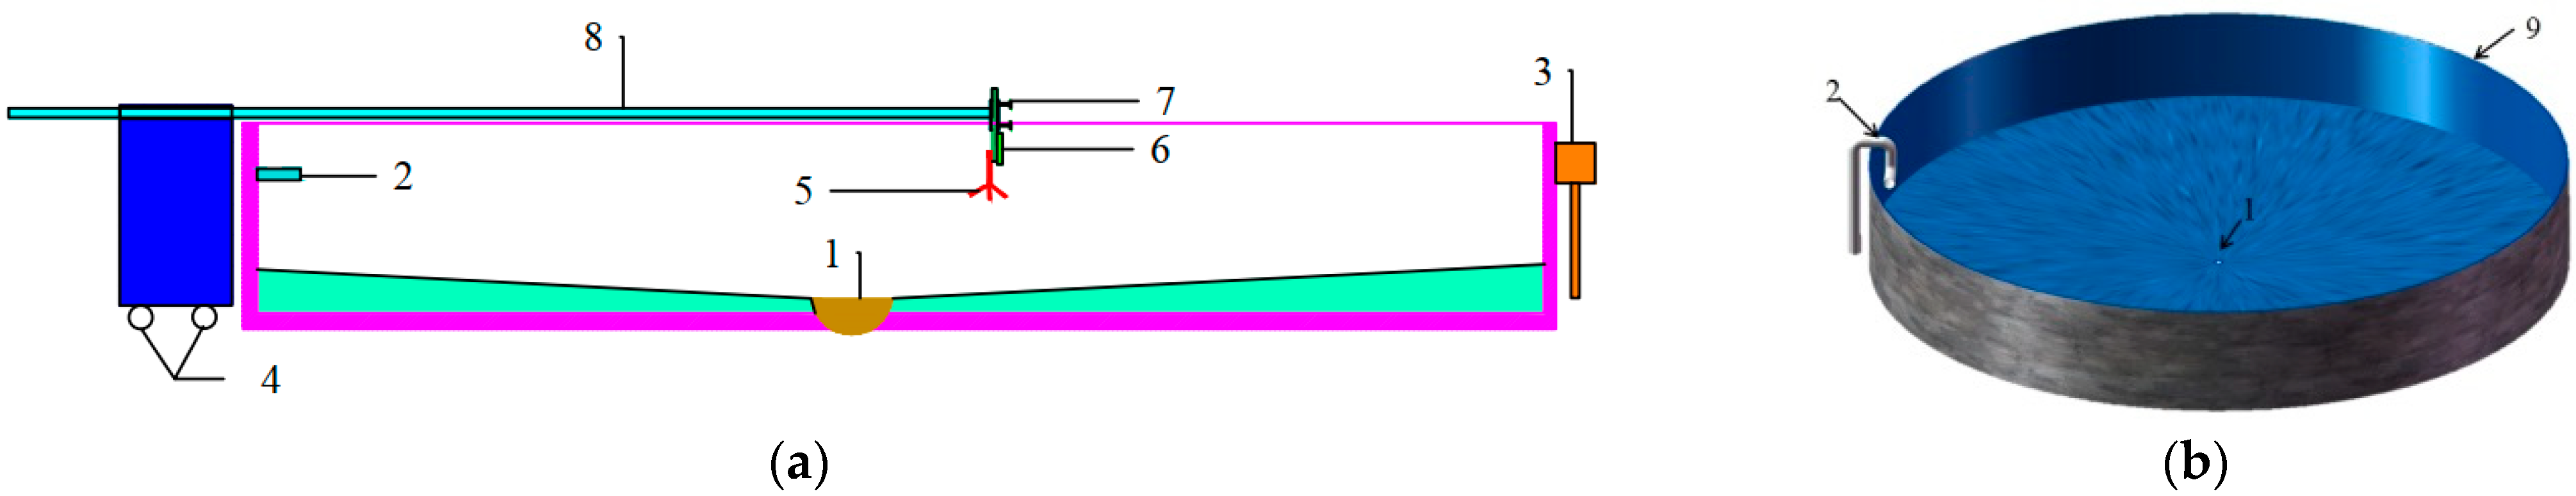
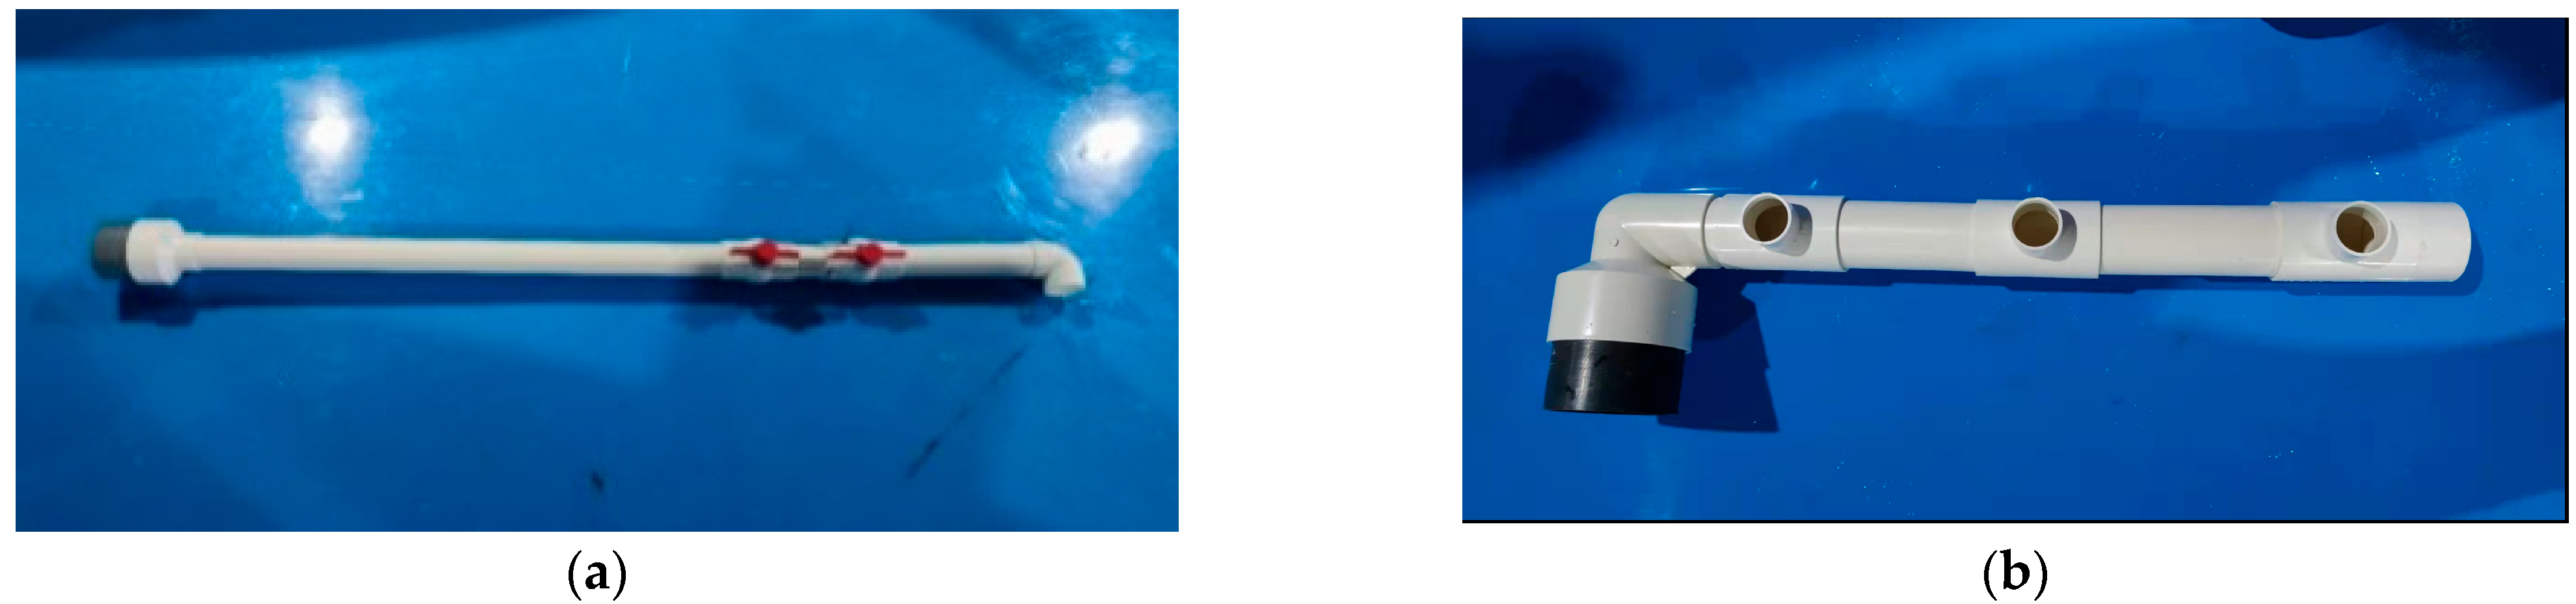
2.1. Experimental Device

The study was performed at the industrial recirculating aquaculture system (RAS) facility of the Rescue and Rehabilitation Center for Naked Carps (Gymnocypris przewalskii) at Qinghai Lake, China. Figure 1 depicts the experimental setup, featuring circular tanks (100 cm height, 700 cm diameter) with a 15° conical slope and a central drainage outlet (20 cm radius). The base structural design inlet pipe (110 mm diameter) operated at a flow rate of 9 L/s and was positioned at θ = 45°. Sustained hydrodynamic circulation was achieved through high flow rates. The experimental objective was to achieve optimal flow dynamics while minimizing energy consumption and enhancing biofilter efficiency, without structural alterations to the existing circular aquaculture tanks. Modifications were implemented in accordance with the tank’s original structural design [21]. Subsequently, two inlet configurations were evaluated (Figure 2): (a) the horizontal single-pipe single-hole inlet pipe (75 mm diameter) and (b) the vertical single-pipe porous inlet pipe (40 mm diameter) with a submerged depth of 60 cm. Inlet pipe angles were precisely measured using a stainless steel digital angle ruler (Foshan Nanhai Oude Metal Products Co., Ltd., Foshan, Guangdong, China). The inlet angle (θ) was defined as the acute angle between the inlet pipe’s discharge direction and the tank’s tangential plane. Surface flow velocities were quantified using Acoustic Doppler Velocimetry (ADV) (Nortek AS, Oslo, Norway), and dissolved oxygen (DO) concentrations across stratified depth zones were documented with a Aquameter GPS portable multi-parameter analyzer (Aquaread Company, London, United Kingdom).

2.2. Experimental Design

2.2.1. Experimental Scheme

Based on the arrangement within the circular aquaculture tank, inlet pipe structures are categorized as: (1) a horizontal single-pipe single-hole configuration (63 mm diameter) and (2) a vertical single-pipe porous configuration (40 mm diameter). Based on previous studies on indoor model sewage collection [22], the experimental design was shown in Table 1. The experimental conditions covered various inlet pipe configurations, such as the horizontal single-pipe single-hole inlet mode with a deployment angle (θ) of 0° and the vertical single-pipe porous inlet mode with deployment angles (θ) of 0° and 45°. The deployment distance ratio (d/r) is defined as the ratio of the distance (d) between the inlet and the tank wall to the tank radius (r). To accommodate variations in inlet diameter, the deployment distance (d) was fixed at 20 cm for one experimental condition, so d/r = 20/350 = 2/35. Three d/r ratios were set at: 2/35, 1/4, and 1/2. The flow rate (Q) was set at two levels: 5 L/s (low flow) and 9 L/s (high flow). These conditions comprised six experimental configurations in the horizontal single-pipe single-hole inlet mode and twelve in the vertical single-pipe porous inlet mode, totaling eighteen experimental configurations. The dissolved oxygen content at various tank layers was recorded using an Aquameter GPS portable multi-parameter water quality analyzer, yielding thirty-six distinct experimental scenarios.

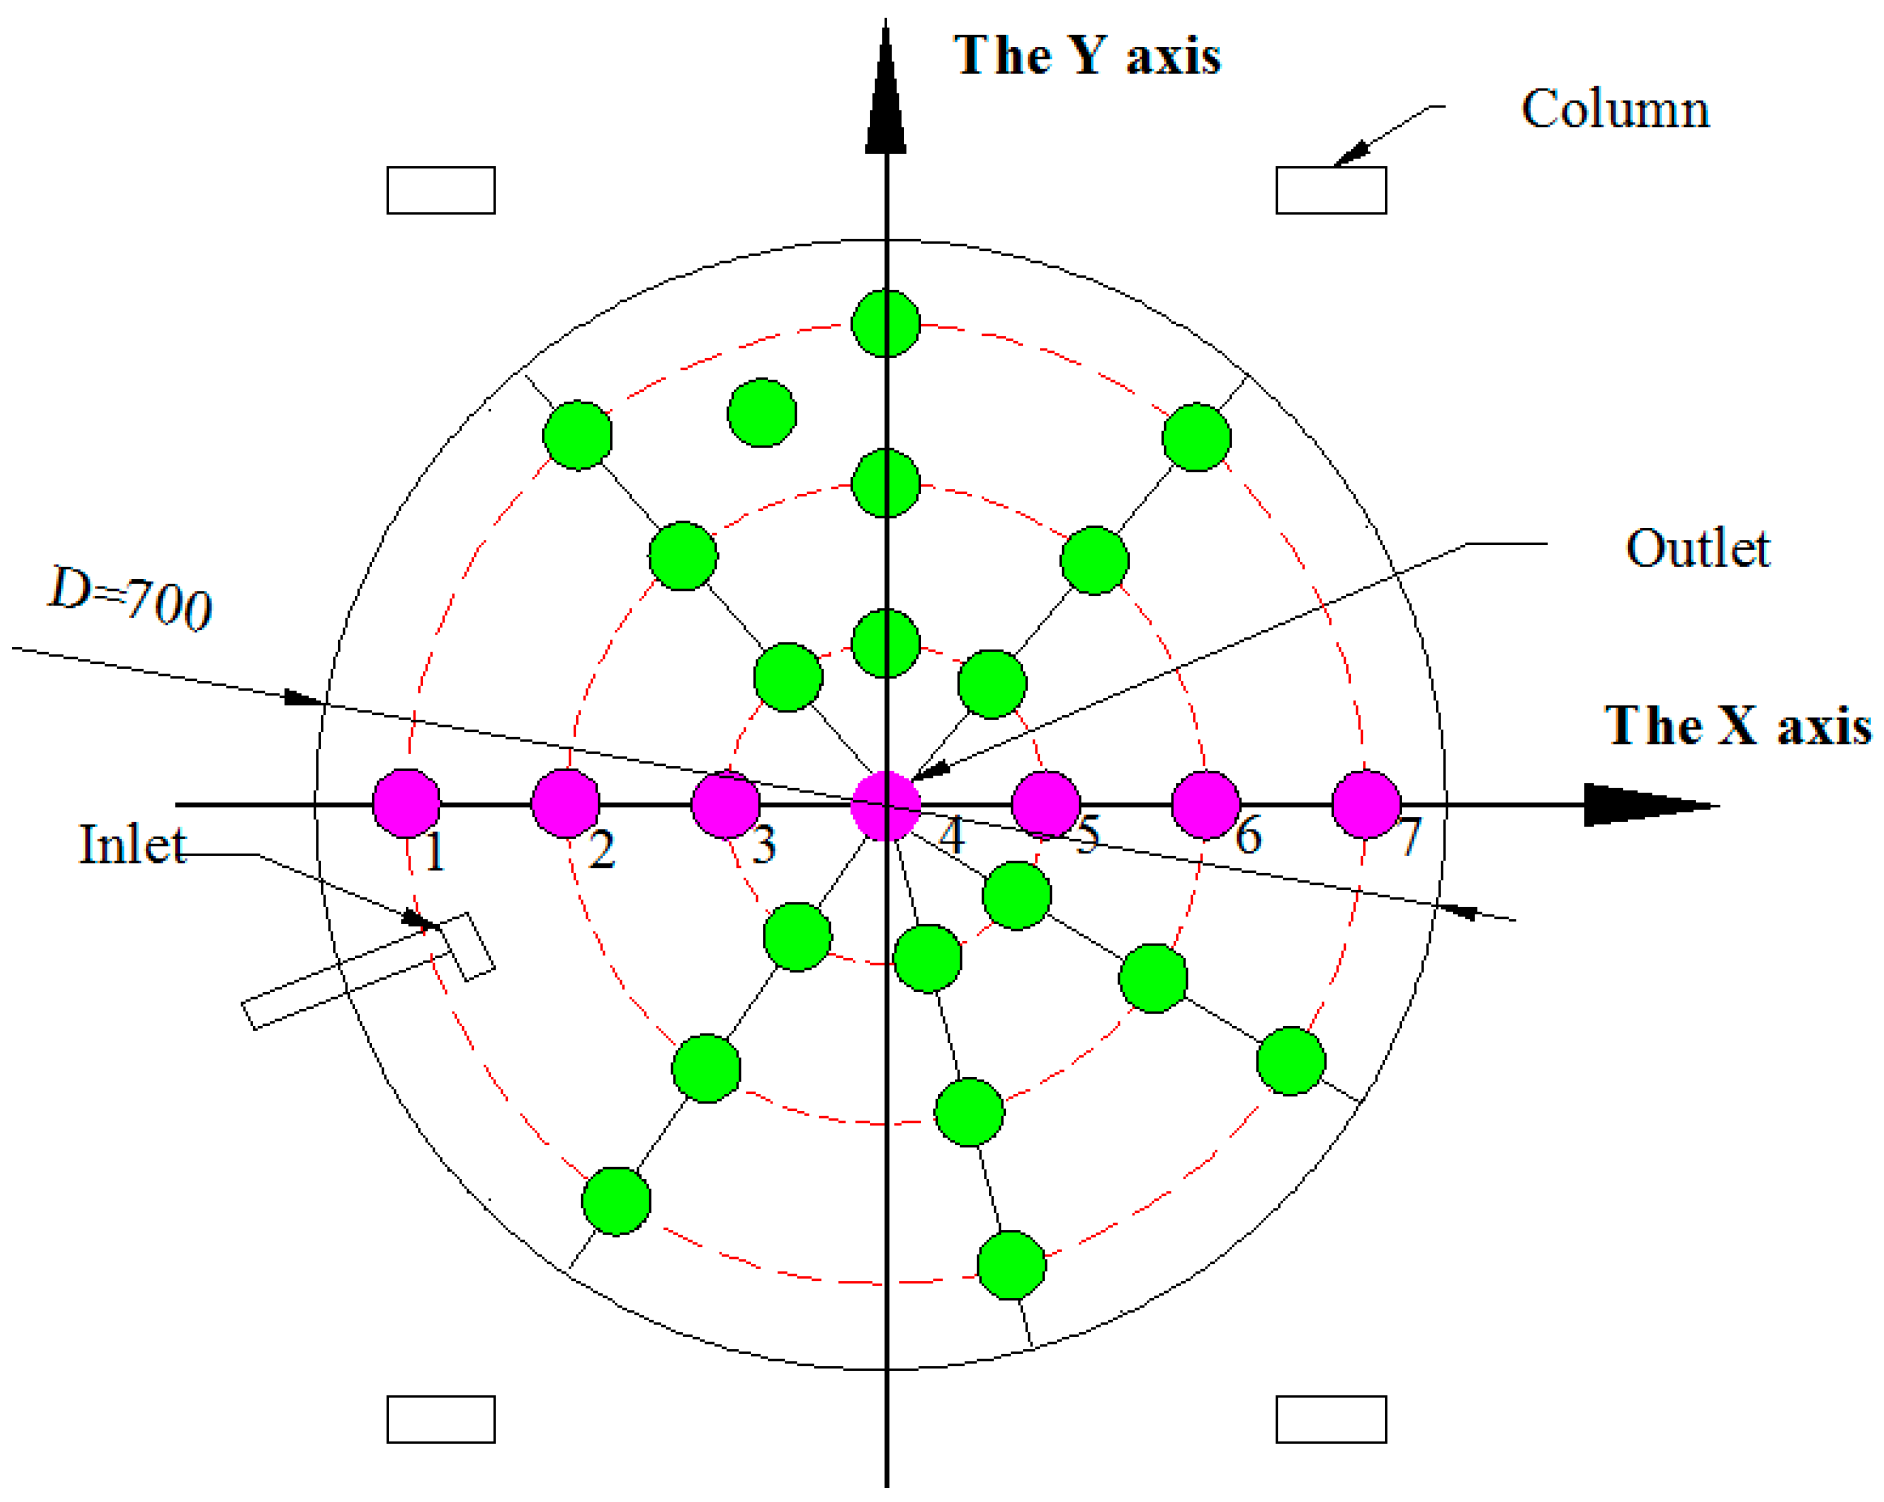
2.2.2. Velocity Measurements

An Acoustic Doppler Velocimetry (ADV) system was employed to quantify flow velocities of microscale water clusters at a depth of 5 cm below the water surface. Flow field measurements followed the grid marked in Figure 3, ensuring comprehensive characterization of surface velocity profiles. Measurement points were distributed across horizontal and vertical axes, covering four cross-sectional planes to map three-dimensional flow dynamics. Twenty-five measurement points were strategically selected to ensure representative spatial sampling. ADV probes were positioned 15 cm from the water surface during surface velocity measurements. Data acquisition operated at 60 Hz, with 30 s sampling intervals per point, generating 1800 velocity data points per location.
To comprehensively investigate flow velocity distribution along the diameter (X-axis) of the circular aquaculture tank, seven monitoring points were established along the central diameter (X-axis). The coordinates of monitoring points along the tank’s diameter (X-axis) under varying operational conditions are detailed in Table 2. Velocity measurements were also conducted along concentric circumferential paths at radii of 1 m, 2 m, and 3 m.

2.2.3. Dissolved Oxygen Measurements

Dissolved oxygen (DO) concentrations across stratified depth zones in the aquaculture tank were monitored using a Aquameter GPS portable multi-parameter water quality analyzer. The system comprises two modules: the Aquameter and AquaProbes sensors, selected based on target parameters. DO and flow-rate measurement points were co-located at stratified depths. For the surface layer, the probe was positioned 15 cm below the water surface; for the bottom layer, it was maintained 15 cm above the tank substrate. Prior to measurements, the DO sensor was calibrated through immersion in a standard solution to ensure accuracy and minimize experimental error.

2.3. Data Processing

To quantitatively describe and compare the hydrodynamic characteristics of circular aquaculture tanks under various operational conditions, this study utilized two key hydrodynamic parameters: the average velocity (vavg) and the velocity uniformity coefficient (DU50) [8,23].
v a v g = i = 1 n v i r i i = 1 n r i
D U 50 = v 50 v × 100
In this context, vavg represents the weighted average velocity, which is a calculation that assigns varying degrees of importance to different velocities based on their respective distances from the tank center. Here, vi denotes the velocity at the monitoring location (measured in m/s), ri indicates the radial distance from the tank center (measured in m), and the velocity distribution uniformity coefficient, DU50, quantifies spatial flow homogeneity within the aquaculture tank. DU50 values approaching 100% indicate increasing uniformity in flow velocity distribution. v50 denotes the weighted mean velocity of the first 50% of monitoring points (m/s), derived by sorting velocity data and applying radial position-weighted averaging.

3. Results

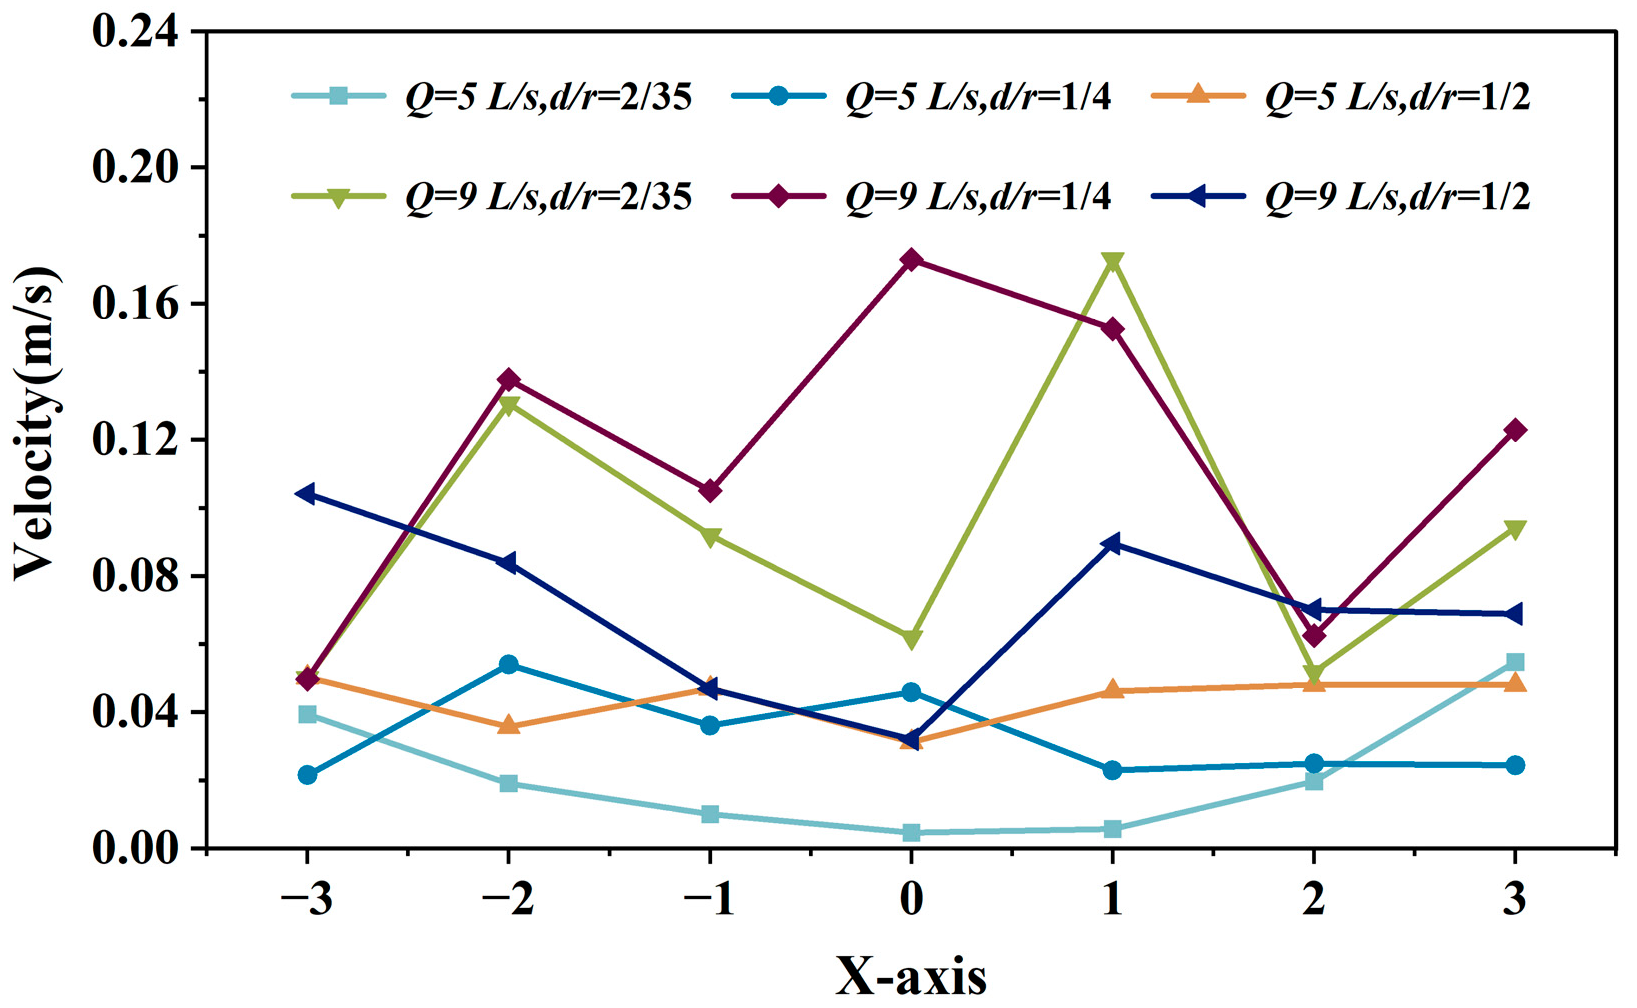
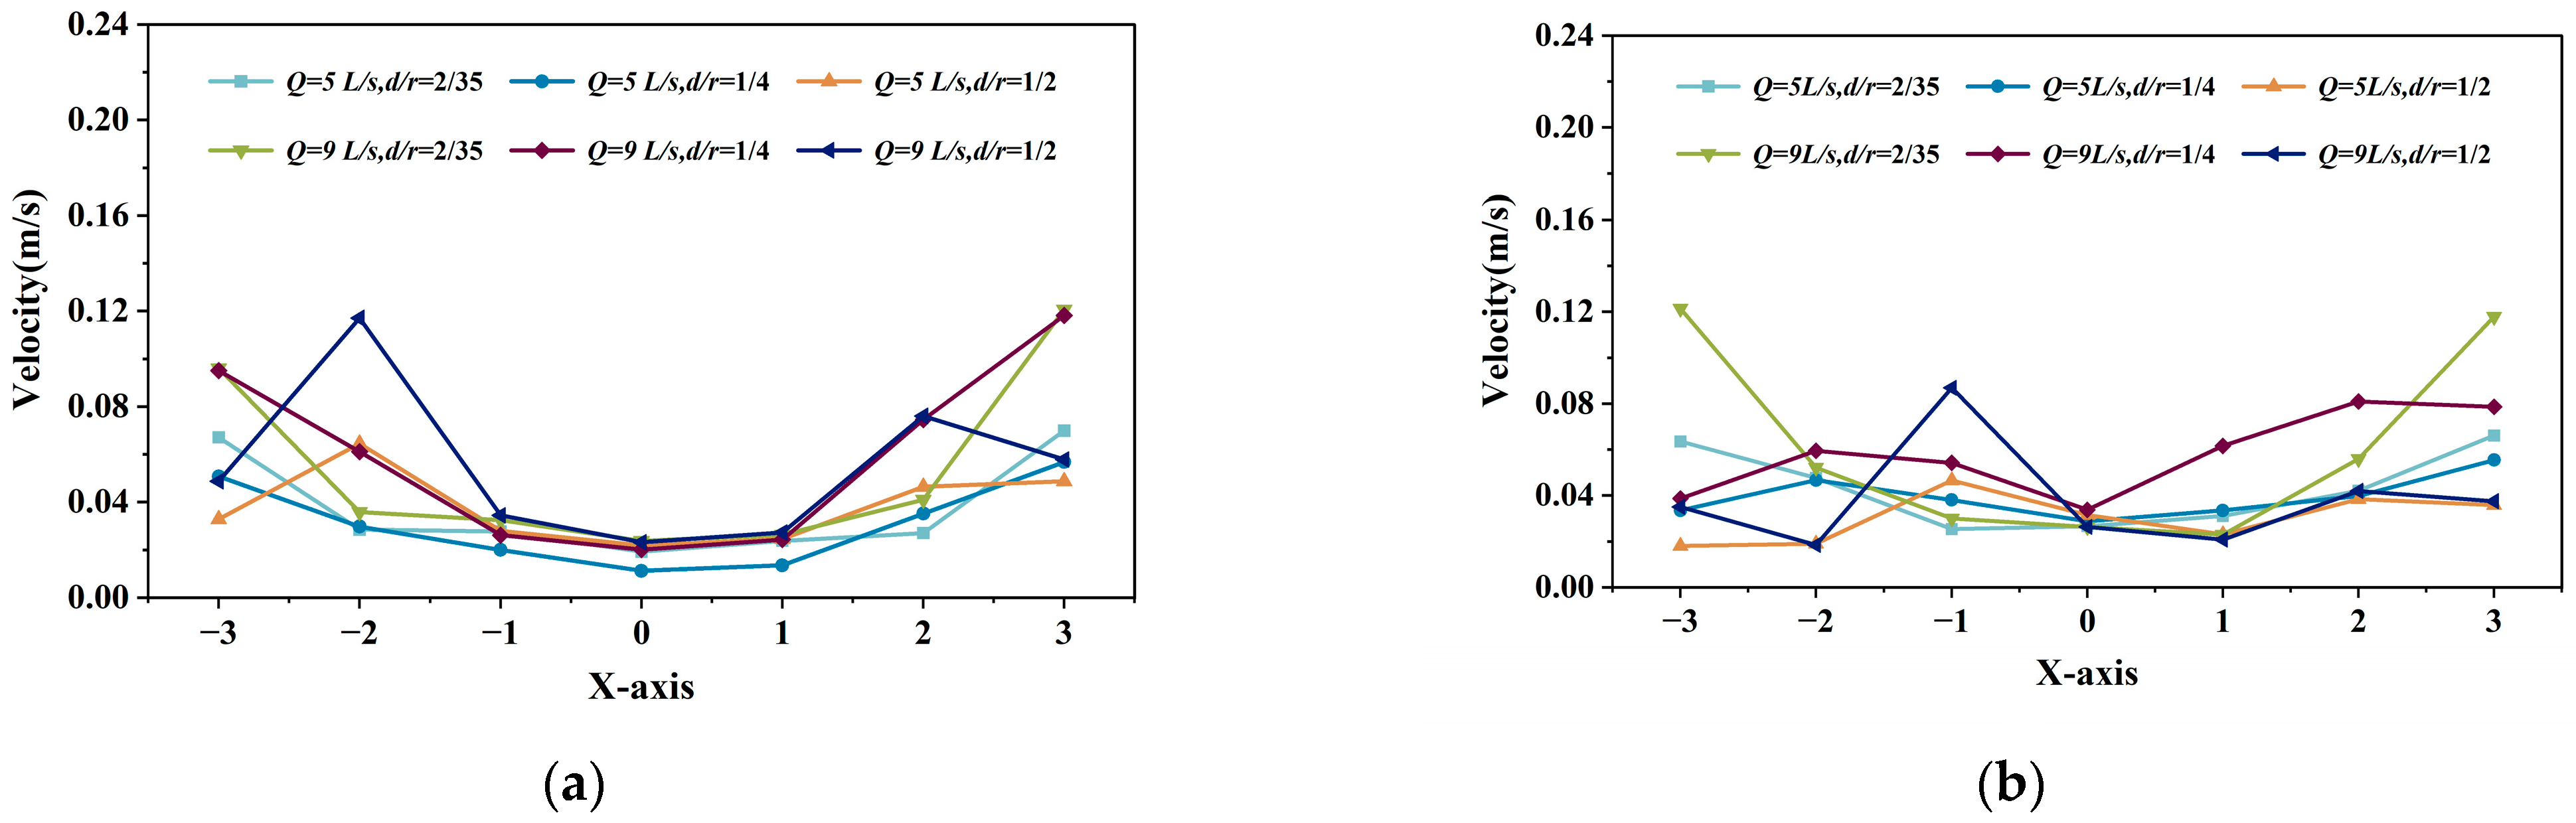
3.1. Influence of Inlet Structure on Velocity Distribution Along the Aquaculture Tank X-Axis

3.1.1. Influence of Horizontal Single-Pipe Single-Hole Inlet on Flow Velocity Variation Along the Aquaculture Tank X-Axis

The changes in flow velocity along the x-axis of the circular aquaculture tank (the red dots in Figure 3) with horizontal single-pipe single-hole inlets under various conditions are depicted in Figure 4, The x-coordinate ranges from −3 to 3. It is observed that when the outlet valve is set to a high flow rate of 9 L/s, the magnitude of the velocity vector along the aquaculture tank x-axis is higher than at the low flow rate of 5 L/s. Additionally, when the flow rate (Q) is 5 L/s, the flow velocity at each point varies between 0.0046 and 0.0547 m/s. Especially when the flow rate is 5 L/s and the deployment distance ratio is 2/35, the flow velocity on the diameter decreases first with the x-coordinate and then increases, forming a “V” shape as a whole. At a flow rate (Q) of 9 L/s, the flow rate at each point fluctuates between 0.05 and 0.20 m/s. At a flow rate (Q) of 9 L/s and a setup distance ratio of 2/35, the maximum flow velocity along the diameter is 0.1730 m/s.

3.1.2. Influence of Vertical Single-Pipe Porous Inlet on Flow Velocity Variation Along the Aquaculture Tank X-Axis

As shown in Figure 5a, at a deployment angle of θ = 0°, the flow conditions of various vertical single-pipe porous inlets along the aquaculture tank x-axis of the flow velocity initially decrease and then increase. Whether the outlet valve is set to a high flow rate of Q = 9 L/s or Q = 5 L/s, the lowest flow velocity is observed near the center of the basin, close to the sewage collection outlet, fluctuating between 0.1118 and 0.2369 m/s. At both flow rates (Q) of 5 L/s and 9 L/s, and with a deployment distance ratio (d/r) of 1/2, the maximum flow velocity is observed at point 2, with velocities of 0.0644 and 0.1171 m/s, respectively. This is likely due to the deployment distance ratio (d/r) of the inlet pipe being 1/2, caused by drains in close proximity to the water circulation system.
As shown in Figure 5b, at a deployment angle of θ = 45°, when the deployment distance ratio (d/r) is 2/35, the flow conditions generated by the vertical single-pipe porous inlet do vary along the x-axis of Figure 3, showing first a decrease and then an increase in flow velocity, exhibiting a “V”-shaped trend. When the outlet valve is set to a high flow rate of Q = 9 L/s and the deployment distance ratio (d/r) is 2/35, intense water collisions with the tank wall result in larger velocities, with values of 0.1214 m/s at point 1 and 0.1179 m/s at point 7.

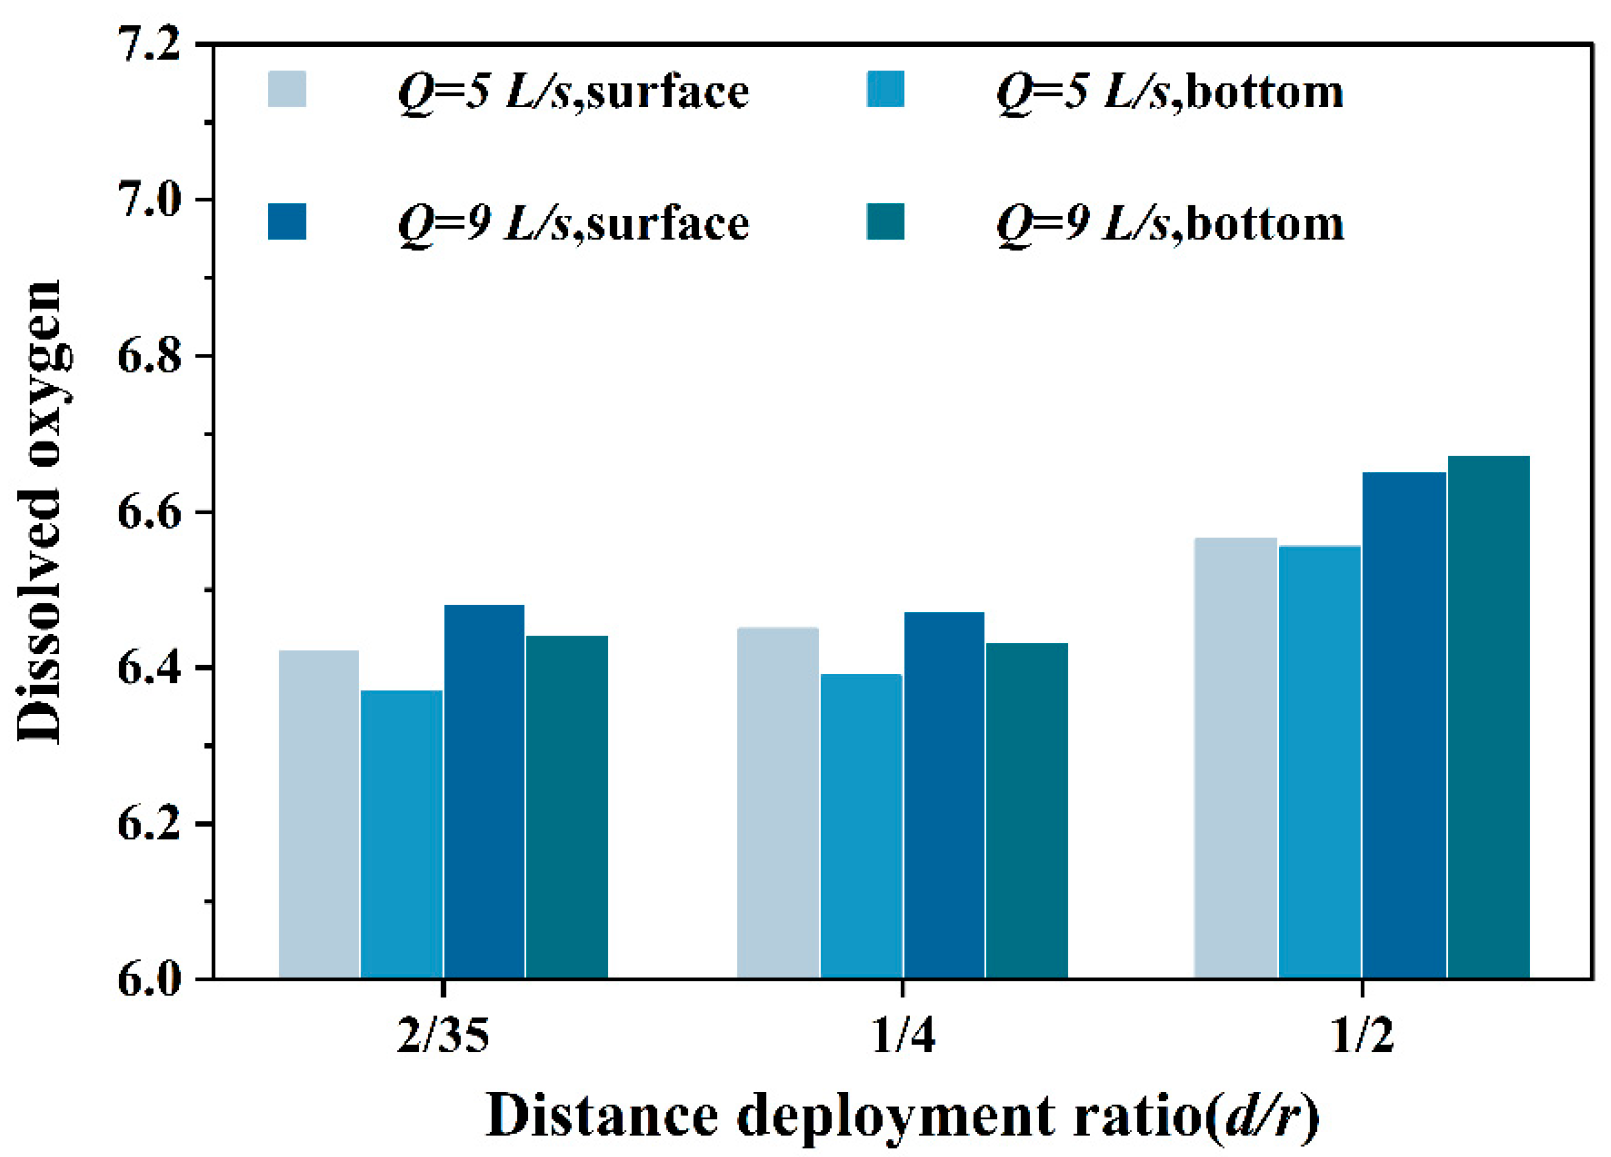
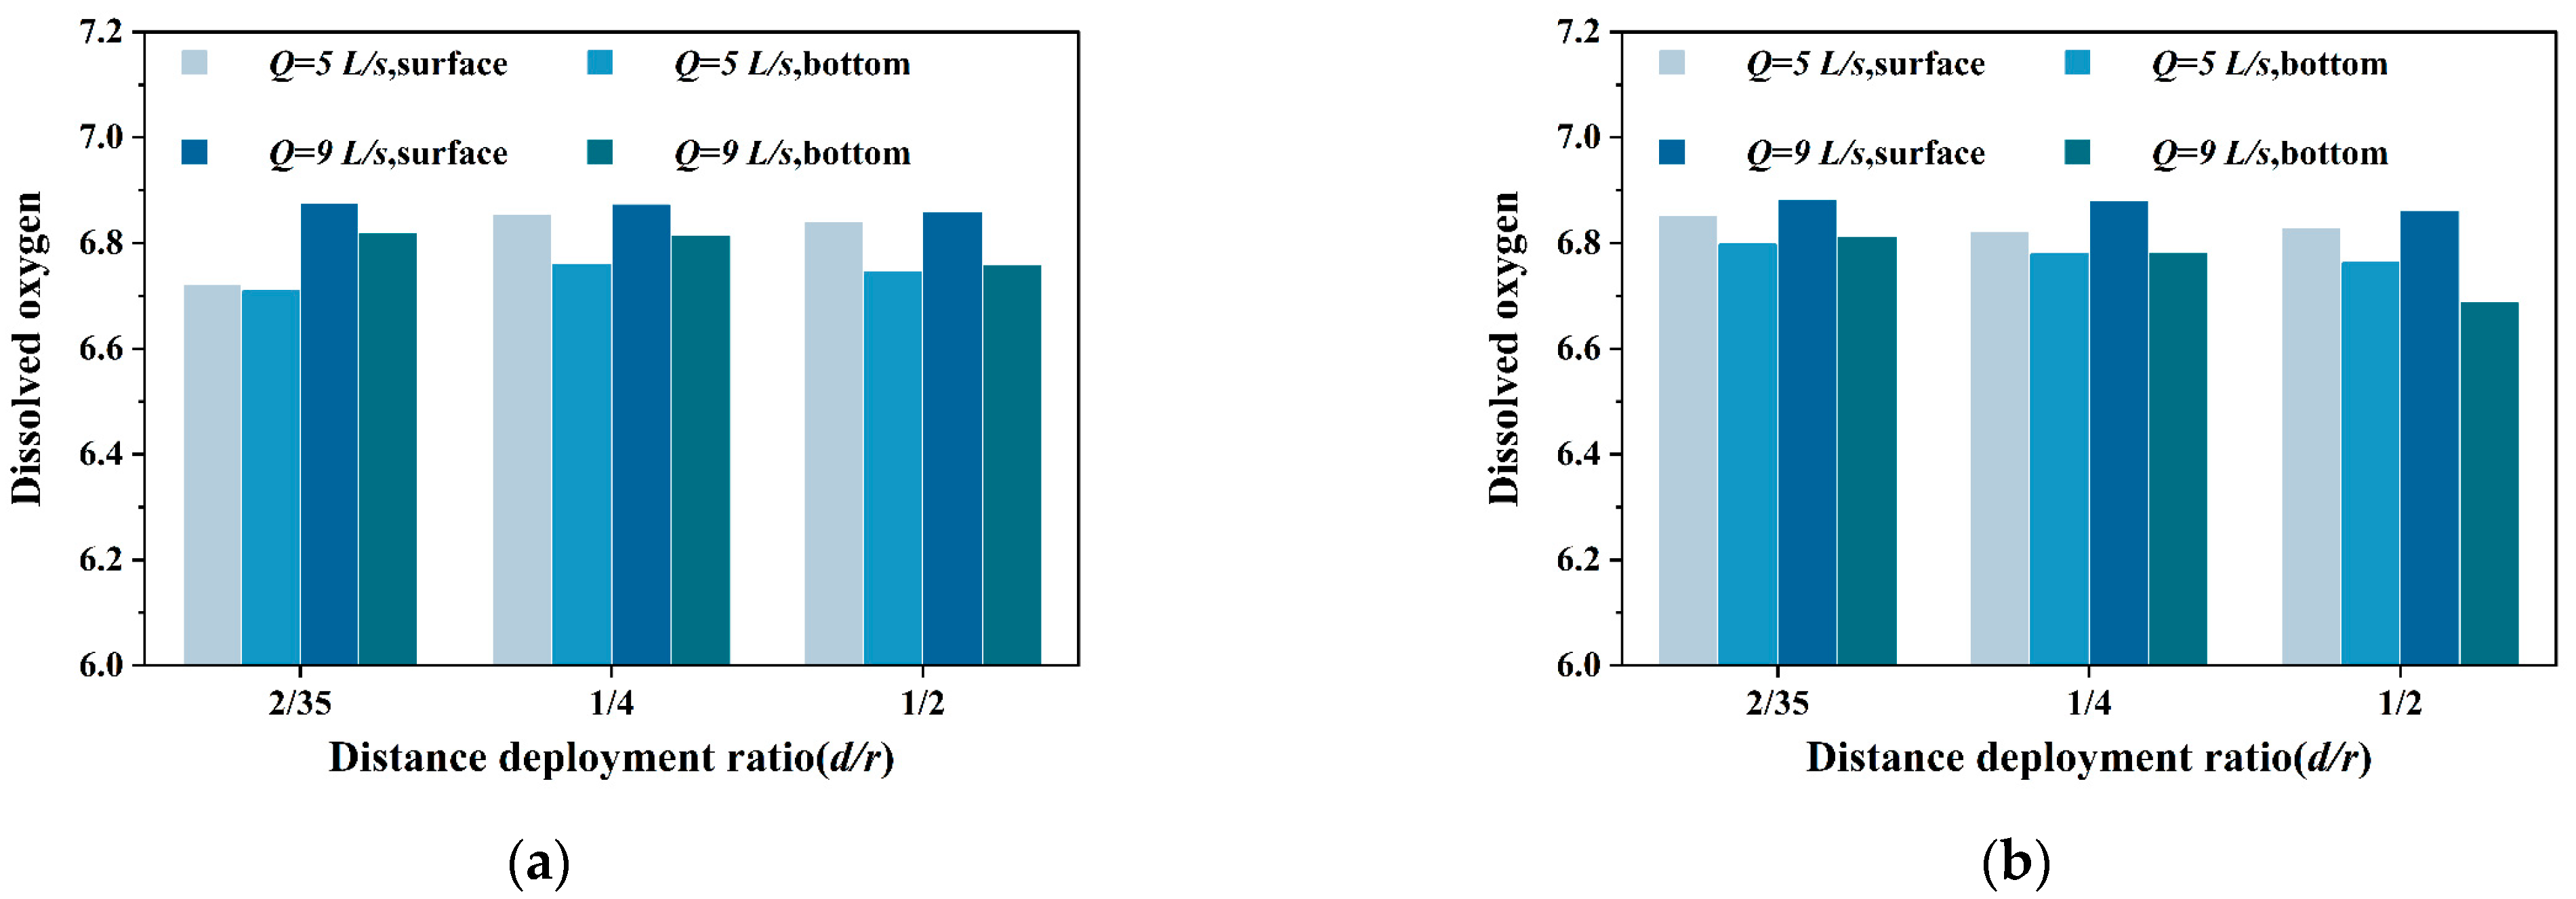
3.2. Influence of Inlet Structure on Dissolved Oxygen in Different Water Layers

3.2.1. Influence of Horizontal Single-Pipe Single-Hole Inlet on Dissolved Oxygen in Different Water Layers

Figure 6 illustrates the influence of flow rate on dissolved oxygen levels at two different water depths within the tank, For the horizontal single-pipe single-hole configuration, a 5 L/s inlet flow rate results in marginally higher dissolved oxygen (DO) concentrations at the tank’s surface layer than at the bottom layer, irrespective of the deployment distance ratio (d/r) being 2/35, 1/4, or 1/2. Specifically, when the flow rate is 5 L/s and the deployment distance ratio (d/r) is 2/35, the lowest dissolved oxygen concentration is observed in the bottom layer, at 6.37 mg/L. In contrast, the dissolved oxygen concentration in the surface layer exhibits a positive correlation with the deployment distance ratio (d/r), increasing as d/r increases from 2/35 to 1/2. At a higher flow rate of 9 L/s, the dissolved oxygen concentration in the surface layer shows a tendency to initially decrease and then increase as the deployment distance ratio (d/r) increases from 2/35 to 1/2. When the flow rate is 9 L/s and the deployment distance ratio (d/r) is 1/2, the dissolved oxygen concentrations in both the surface and bottom layers shows minimal difference, with a value of approximately 6.65 mg/L.

3.2.2. Influence of Vertical Single-Pipe Porous Inlet on Dissolved Oxygen in Different Water Layers

Figure 7a illustrates the effect of the vertical single-pipe porous inlet mode on dissolved oxygen levels in different water layers of the tank, under a deployment angle (θ) of 0°. Under the same influent flow rate and deployment distance ratio, the dissolved oxygen concentration in the surface layer of the circular aquaculture tank is consistently higher than that in the bottom layer. When the deployment distance ratio and water layer are fixed, the dissolved oxygen concentrations in both the surface and bottom layers increase as the influent flow rate increases. Figure 7b illustrates the impact of the vertical single-pipe porous inlet mode on dissolved oxygen in different water layers, under a deployment angle (θ) of 45°. In the surface layer, with a fixed deployment distance ratio, the dissolved oxygen concentration increases with a higher inlet flow rate of the inlet pipe in the circular aquaculture tank. In the bottom layer, the dissolved oxygen concentration exhibits a trend of decreasing as the deployment distance ratio (d/r) increases from 2/35 to 1/2. The maximum dissolved oxygen concentration in the surface layer is 6.88 mg/L when the inlet flow rate set at 9 L/s, the deployment angle (θ) is 45° and the deployment distance ratio (d/r) is 2/35.

3.3. Influence of Inlet Structure on Hydrodynamic Characteristics in Circular Aquaculture Tanks

3.3.1. Average Velocity in Circular Aquaculture Tanks

Hydrodynamic characteristic quantities were quantified using flow velocity data acquired via Acoustic Doppler Velocimetry (ADV), consistent with Equation (1). Table 3 presents the average velocity (vavg) within the aquaculture tank for varying flow rates and inlet configurations. The data indicate that at constant deployment distance ratios (d/r), average velocity increased as flow rates rose from 5 to 9 L/s. For the horizontal single-pipe single-hole inlet at Q = 9 L/s and d/r = 1/4, average velocity reached a maximum of 0.1040 m/s. For the single-pipe porous inlet at d/r = 2/35, average velocity was higher at a 45° jet angle than at a 0° jet angle for both Q = 5 L/s and Q = 9 L/s. At θ = 45°, average velocity decreased with increasing d/r, for both Q = 5 L/s and Q = 9 L/s. At Q = 9 L/s and θ = 45°, d/r = 2/35, average velocity reached its maximum value of 0.0816 m/s.

3.3.2. Uniformity Coefficient of the Velocity Field in Circular Aquaculture Tanks

As indicated in Table 4, for the horizontal single-pipe single-hole inlet pipe, the flow field uniformity coefficient in the circular aquaculture tank gradually increases as the deployment distance ratio (d/r) increases from 2/35 to 1/2. Specifically, when the inlet flow rate is Q = 9 L/s, the flow field uniformity coefficient is lower than that observed at Q = 5 L/s. For the vertical single-pole porous inlet pipe, when the deployment angle (θ) is 0° and the inlet flow rate is Q = 5 L/s, the flow field uniformity coefficient (DU50) first decreases and then increases with increasing deployment distance ratio (d/r). In contrast, when the deployment angle (θ) is 0° and the inlet flow rate is Q = 9 L/s, the flow field uniformity coefficient (DU50) consistently increases as the deployment distance ratio (d/r) increases. When the deployment angle (θ) is 45° and the inlet flow rate is either Q = 9 L/s or Q = 5 L/s, the uniformity coefficient of the flow field first increases and then decreases as the deployment distance ratio (d/r) increases from 2/35 to 1/2. Based on the principle that a higher average flow rate leads to a larger flow field uniformity coefficient, it is more advantageous for solid waste collection and discharge in the aquaculture tank when the flow rate (Q) is 9 L/s, the deployment angle (θ) is 45°, and the deployment distance ratio is set to 1/4. At this configuration, average reached 0.0669 m/s and flow uniformity coefficients attained a maximum value of 40.4282, suggesting optimized hydrodynamic characteristics.

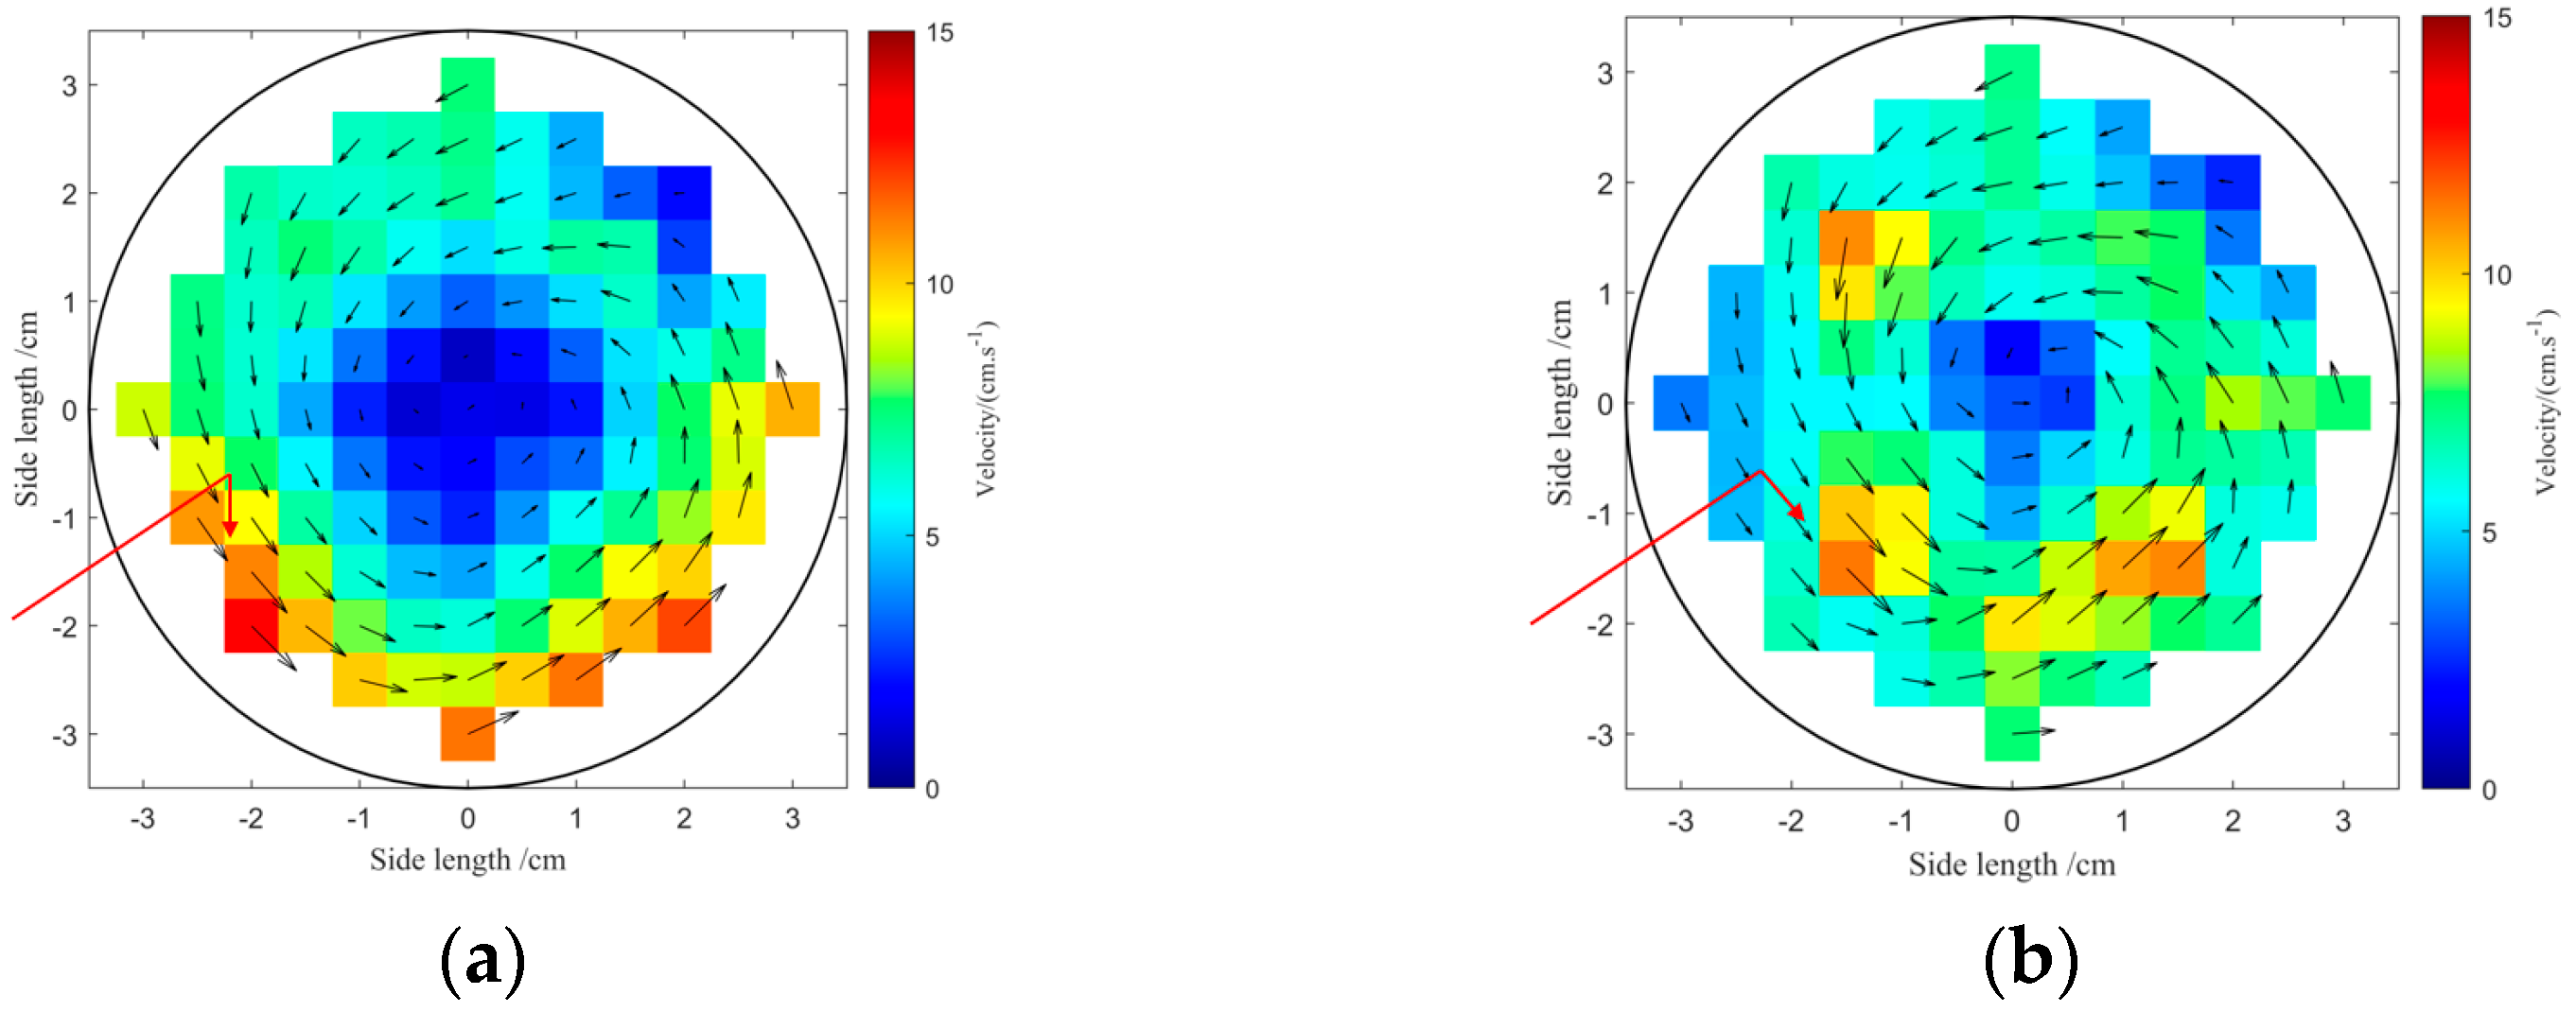
3.4. Influence of Inlet Structure on Flow Field Distribution Characteristics in Circular Aquaculture Tanks

Figure 8 and Figure 9 illustrate the distribution of the flow field within the aquaculture tank. As shown in Figure 8, a noticeable trend is observed where, as the inlet structure changes, the low-velocity area at the center of the tank progressively decreases. Specifically, when a vertical single-pipe porous inlet pipe is employed, the high-velocity area is primarily located near the inlet pipe (the red arrow in the figure indicates the direction of the inlet pipe), with the velocity increasing along the tank walls. Moreover, when the inlet flow rate is Q = 5 L/s and the deployment distance ratio (d/r) is 2/35, regardless of the inlet structure, the flow velocity along the tank walls remains low, hindering the formation of a favorable flow field. Consequently, the tank fails to generate a high-velocity zone that is effective for sewage collection.
Building on this analysis, we further examine the influence of different jet angles on the flow field distribution characteristics within the circular aquaculture tank under the vertical single-pipe porous inlet pipe structure. This examination is based on two key factors—average velocity (Table 3) and flow field uniformity coefficients (Table 4)—and is illustrated by comparing two typical conditions. As shown in Figure 9, When the inlet pipe adopts vertical single-pipe porous deployment, the high-velocity area and low-velocity area are clearly divided within the circular tank, which appears to facilitate the aggregation of sewage in the circulating flow area. As the inlet pipe angle increases from 0° to 45°, the flow velocity near the tank wall gradually decreases, with the high-speed circulating flow moving away from the wall. At an inlet pipe angle of 45°, a well-distributed flow is achieved within the circular tank. Under these conditions, the circular aquaculture tank exhibits optimal flow characteristics, with a minimized low-velocity area at the center. This improvement is attributed to a reduction in kinetic energy loss, which results from the change in inlet pipe angle, the inlet flow rate, and the interaction of the flow with the tank wall. Additionally, as the inlet pipe angle increases, the high-speed flow area gradually diminishes, suggesting that the inlet pipe distance is adequate to minimize flow collisions.

4. Discussion

In industrial recirculating aquaculture systems, the aquaculture tank plays a critical role in supporting the survival and development of aquatic organisms throughout their life cycle. It serves as both the primary infrastructure for fish growth and development and the initial stage in reducing the burden on water treatment systems. In these systems, high stocking densities and feed inputs, particularly following feeding events, lead to the accumulation of residual feed and feces. If these materials are not promptly removed, they can stagnate at the bottom of the aquaculture tank. The decomposition of organic waste results in the production of substances such as ammonia, nitrogen, and nitrites, which can adversely affect water quality. As water quality in the aquaculture tank directly influences the health of the aquatic organisms and the overall system environment [24], poor water conditions can lead to disease outbreaks, severely impeding the growth and development of organisms within the system. Consequently, the self-cleaning performance of the aquaculture tank, which ensures the efficient removal of residual feed, feces, and other solid waste, is essential for maintaining optimal levels of dissolved oxygen and improving the overall water quality.
In aquaculture systems, regardless of whether a horizontal single-pipe single-hole or vertical single-pipe porous inlet pipe structure is employed, an increase in the flow rate at the outlet valve induces higher flow velocities at monitoring points distributed along the tank’s diameter. This occurs due to the enhancement of the water’s kinetic energy associated with higher flow rates, leading to increased flow velocity. The flow velocity gradually decreases from the tank wall to the center of the tank along the diameter direction, reaching a minimum at the outlet at the center of the tank. Oca and Masalo [25] employed Acoustic Doppler Velocimetry to investigate the velocity distribution and the effects of various flow rates, inlet velocities, and water depths along the diameter axis of a circular tank with a tangential inlet and central outlet at the bottom. Their study revealed a consistent decrease in velocity from the edge of the tank to its center, with the lowest velocity occurring at the central radius. Similarly, Yanfei Wu et al. [26] utilized an Acoustic Doppler Current Profiler (ADCP) system mounted on an unmanned vessel to assess the flow field distribution characteristics of a submersible pusher across different water layers. Their findings showed that circular tanks exhibited a distinct flow-field-zoning effect: as the distance from the edge of the tank to the center increases, the flow velocity gradually decreases. In the present study, the horizontal single-pipe single-hole flow velocity within the circular tank decreased from the center to the edge, forming a high-velocity zone near the tank wall. In contrast, the flow velocity near the wastewater collection outlet at the center was extremely low. This reduction in velocity is attributed to significant energy losses due to collisions with the tank wall, resulting in high-speed circulation primarily driven by wall interactions. The water capacity of the circular tank is approximately 30 m3, and the low power of the inlet pipe contributes to the decreasing flow velocity from the tank’s edge toward the center.
The implementation of the vertical single-pipe porous structure results in a higher dissolved oxygen concentration within the tank relative to the horizontal single-pipe single-hole structure. Moreover, the dissolved oxygen in the surface layer of the circular aquaculture tank was significantly higher than in the bottom layer at the same inlet flow rate and deployment distance ratio. As both the deployment distance ratio and water layer were fixed, the dissolved oxygen concentrations in both layers increased with the rise in inlet flow rate. Davidson and Summerfelt [11] studied the effects of bottom outlet flow and inlet structure on self-purification, water mixing, and velocity in two different sizes of Cornell double-drainage tanks (10 m3 and 150 m3). They pointed out that the direction of the inlet pipe jet and the bottom outlet can regulate the rotational velocity of water throughout the circular tank. Tvinnereim and Skybakmoen [27] compared the effects of four water intake methods and suggested that the side-jet pipe inlet method should be used in practical production. They also provided a formula for calculating the average flow velocity in the aquaculture tank. In conclusion, vertical single-pipe porous inlet pipe structural deployment outperforms horizontal single-pipe single-hole inlet pipe design in terms of dissolved oxygen concentration. Almansa et al. [28] also investigated the impact of hydrodynamic characteristics on vertical oxygen stratification in flounder through numerical simulation, calculating water flow velocity, boundary layer thickness, and the Reynolds number. Their findings indicated lower dissolved oxygen concentrations at the bottom. Similarly, Cheng et al. [29] studied the effect of circulating water flow rates on sediment accumulation in aquaculture tanks, highlighting that dissolved oxygen concentrations and levels significantly increased in the flow rate group compared to the hydrostatic group. This finding aligns with the results of the current study, which shows that, when the inlet pipe structure, deployment distance ratio, and water layer are fixed, dissolved oxygen concentrations in both the surface and bottom layers increase with the rise in inlet flow rate. In general, for a given inlet pipe, higher inlet flow rates and flow velocities enhance the dissolved oxygen concentration, positively influencing the decomposition and removal of residual feed, feces, and other waste materials.
During testing of the vertical single-pipe porous flow field distribution, at a flow rate (Q) of 9 L/s, a deployment angle (θ) of 45°, and a deployment ratio (d/r) of 1/4, the mean flow velocity reached 0.0669 m/s, and the uniformity coefficients reached their maximum values 40.4282. This represents the optimal flow field uniformity compared to the θ = 0° condition. The average velocity and flow field uniformity are key factors influencing the hydrodynamic characteristics of the tank. As shown in Table 3, when the deployment distance ratio is fixed, a higher inlet flow rate results in a larger average flow velocity. A comparative analysis of the two water inlet types reveals that, with the lateral single-pipe single-hole system at d/r = 2/35, the high-speed flow from the inlet pipe collides with the tank wall, causing significant energy loss and resulting in a low average flow rate. This leads to poor performance in sewage collection. when the deployment distance ratio increases to d/r = 1/2, the collision between the high-speed jet flow and the tank wall is reduced, significantly minimizing energy loss. Sin et al. [30] found that the self-cleaning performance of a culture tank with a single inlet pipe is optimal at the golden mean point, which closely aligns with the results of this study, where hydrodynamic parameters are improved at d/r = 1/4. Venegas et al. [31] conducted field experiments to examine the effects of jet mixing on the hydrodynamics of circular aquaculture tanks. Their findings demonstrated improved tangential velocity, homogeneity, mixing time, and time to remove the solid phase when the jet direction was set at 45°. These results are consistent with the flow field distribution observed in this study under high-flow conditions with a 45° deployment angle, confirming the validity of the current findings. Appropriate hydraulic driving equipment can facilitate the formation of an optimal circulation pattern in the tank, leading to better self-cleaning performance [32]. The uniformity coefficient of the velocity field in circular tanks results are summarized in Table 4. Considering the economic advantages of single-pipe inlet pipe deployment and practical operational conditions, the vertical single-pipe porous inlet method, with a flow rate of Q = 9 L/s, a deployment distance ratio of d/r = 1/4, and a deployment angle of θ = 45°, offers improved solid pollutant collection and reduced energy consumption by optimizing the flow rate. As industrialized farming operations, such as breeding, are also required in aquaculture workshops, field trials were conducted using siphoning through the sewage collection device after the first fouling aggregation tests. It should be noted that this study does not consider the solid concentrations near the center of the tank compared to the circumference area.

5. Conclusions

This study investigated the hydrodynamic characteristics and dissolved oxygen distribution across distinct water layers in circular aquaculture tanks under controlled variations in flow rate (Q), deployment distance ratio (d/r), deployment angle (θ), and inlet pipe configuration, focusing on industrial recirculating aquaculture system. The principal findings are summarized as follows:
The average velocity and flow field uniformity coefficient are critical factors influencing the hydrodynamic performance of the aquaculture tank. Implementation of the vertical single-pipe porous structure yields optimal hydrodynamic performance in circular aquaculture tanks under the following conditions: a flow rate of (Q) = 9 L/s, a deployment distance ratio of (d/r) = 1/4, and a deployment angle of (θ) = 45°, the average velocity reached 0.0669 m/s, and the uniformity coefficients attained a maximum value of 40.4282. The vertical single-pipe porous structure yields better dissolved oxygen levels compared to the horizontal single-pipe single-hole structure. Under the same inlet flow rate and deployment distance ratio, the dissolved oxygen concentration in the surface layer of the circular aquaculture tank is significantly higher than in the bottom layer.
Despite the extensive study of hydrodynamic characteristics and pollutant collection performance through field measurements and inlet pipe configurations, certain areas still require improvement due to time and technical constraints. Specifically, the effect of cultured organisms (such as naked carp in Qinghai Lake) on the hydrodynamic characteristics and dissolved oxygen levels within the circular aquaculture tanks was not considered in this study. Furthermore, given the field measurement constraints and the diversity of pond types in actual industrial farming settings, the next step will involve conducting numerical simulation to comprehensively analyze the hydrodynamic characteristic of aquaculture tanks under the influence of inlet pipe systems, as well as the characteristics of pollutant aggregation. This simulation will provide reliable technical support for optimizing real-world aquaculture production systems.

Author Contributions

Conceptualization, Q.Z., Y.W. (Yanfei Wu), F.G. and J.C.; methodology, Q.Z. and Y.W. (Yanfei Wu); formal analysis, Q.Z.; data curation, H.Q.; investigation, Y.W. (Yang Wang), Y.L. and Y.W. (Yanhong Wu); writing—original draft preparation, Y.W. (Yanfei Wu); writing—review and editing, Y.W. (Yanfei Wu) and J.C.; visualization, J.C. and Y.W. (Yanfei Wu).; supervision, Y.W. (Yanfei Wu)., F.G., D.F. and Q.Z.; funding acquisition, Q.Z. and Y.W. (Yanfei Wu). All authors have read and agreed to the published version of the manuscript.

Funding

This research was supported by the Special Project for Building Scientific and Technological Innovation Capacity of Beijing Academy of Agricultural and Forestry Sciences (KJCX20251205, KJCX20240504); National Natural Science Foundation of China (Grant No. 32273189); Director Fund Project of Fisheries Science Institute, Beijing Academy of Agriculture and Forestry Sciences (JJPY-2025-05); Hebei Province Key R&D Programme Project (22326701D,19226703D); Beijing Fishery Innovation Team of the Modern Agricultural Industrial Technology System (BAIC07-2025-07, BAIC07-2024-07); and Zhou Finance and Agriculture [2024] No. 15 Research and Demonstration on High-Efficiency Facility-Based Cultivation of Shrimps; Zhejiang Provincial Regional Test Station Project (2024QYSC02).

Data Availability Statement

The data presented in this study are available on request from the corresponding author due to privacy.

Acknowledgments

We greatly appreciate the careful works and constructive suggestions of the editor and all anonymous reviewers.

Conflicts of Interest

Authors declare no conflict of interest.

References

  1. Fisheries and Fishery Administration Bureau of the Ministry of Agriculture and Rural Zones; National Aquatic Technology Promotion Center; China Fisheries Association. China Fishery Statistical Yearbook; China Agriculture Press: Beijing, China, 2023. [Google Scholar]
  2. Zhang, J.; Zhang, Z.; Che, X.; Chen, C.; Gao, Y.; Zhang, N.; Maidaibieke, D.; Zhu, X.; Chen, Z. Hydrodynamics of waste collection in a recirculating aquaculture tank with different numbers of inlet pipes. Aquac. Eng. 2023, 101, 102324. [Google Scholar] [CrossRef]
  3. Zhao, Y.; Xue, B.; Bi, C.; Ren, X.; Liu, Y. Influence mechanisms of macro-infrastructure on micro-environments in the recirculating aquaculture system and biofloc technology system. Rev. Aquac. 2022, 15, 991–1009. [Google Scholar] [CrossRef]
  4. López-Rebollar, B.M.; Salinas-Tapia, H.; García-Pulido, D.; Durán-García, M.D.; Gallego-Alarcón, I.; Fonseca-Ortiz, C.R.; García-Aragón, J.A.; Díaz-Delgado, C. Performance study of annular settler with gratings in circular aquaculture tank using computational fluid dynamics. Aquac. Eng. 2021, 92, 102143. [Google Scholar] [CrossRef]
  5. López-Rebollar, B.M.; García-Pulido, D.; Diaz-Delgado, C.; Gallego-Alarcón, I.; García-Aragón, J.A.; Salinas-Tapia, H. Sedimentation efficiency evaluation of an aquaculture tank through experimental floc characterization and CFD simulation. Aquac. Eng. 2023, 102, 102343. [Google Scholar] [CrossRef]
  6. Zhang, J.; Jia, G.; Wang, M.; Cao, S.; Mkumbuzi, S.G. Hydrodynamics of recirculating aquaculture tanks with different spatial utilization. Aquac. Eng. 2022, 96, 102217. [Google Scholar] [CrossRef]
  7. Zhang, J.; Zhang, N.; Wang, M.; Chen, C.; Gao, Y.; Cao, S.; Liu, X.; Hu, Q.; Zhang, Z. Hydrodynamics of waste collection in a recirculating aquaculture tank with different flow-guide discs. Aquac. Eng. 2024, 106, 102395. [Google Scholar] [CrossRef]
  8. Zhang, Y.; Yang, X.; Hu, J.; Qu, X.; Feng, D.; Gui, F.; Zhu, F. Effect of inlet pipe design on self-cleaning ability of a circular tank in RAS. Front. Mar. Sci. 2023, 10, 1120205. [Google Scholar] [CrossRef]
  9. Liu, H.; Ren, X.; Xue, B.; Bi, C.; Zhao, Y.; Liu, Y. Systematic optimization of the square arc angle aquaculture tank combining CFD methodology and multi-objective genetic algorithm. Aquac. Eng. 2023, 101, 102326. [Google Scholar] [CrossRef]
  10. Labatut, R.A.; Ebeling, J.M.; Bhaskaran, R.; Timmons, M.B. Modeling hydrodynamics and path/residence time of aquaculture-like particles in a mixed-cell raceway (MCR) using 3D computational fluid dynamics (CFD). Aquac. Eng. 2015, 67, 39–52. [Google Scholar] [CrossRef]
  11. Davidson, J.; Summerfelt, S. Solids flushing, mixing, and water velocity profiles within large (10 and 150 m3) circular ‘Cornell-type’ dual-drain tanks. Aquac. Eng. 2004, 32, 245–271. [Google Scholar] [CrossRef]
  12. Oca, J.; Masaló, I.; Reig, L. Comparative analysis of flow patterns in aquaculture rectangular tanks with different water inlet characteristics. Aquac. Eng. 2004, 31, 221–236. [Google Scholar] [CrossRef]
  13. Oca, J.; Masaló, I. Design criteria for rotating flow cells in rectangular aquaculture tanks. Aquac. Eng. 2007, 36, 36–44. [Google Scholar] [CrossRef]
  14. Gorle, J.M.R.; Terjesen, B.F.; Summerfelt, S.T. Influence of inlet and outlet placement on the hydrodynamics of culture tanks for Atlantic salmon. Int. J. Mech. Sci. 2020, 188, 105944. [Google Scholar] [CrossRef]
  15. Duarte, S.; Reig, L.; Masaló, I.; Blanco, M.; Oca, J. Influence of tank geometry and flow pattern in fish distribution. Aquac. Eng. 2011, 44, 48–54. [Google Scholar] [CrossRef]
  16. Hu, J.; Zhang, H.; Wu, L.; Zhu, F.; Zhang, X.; Gui, F.; Qu, X.; Feng, D. Investigation of the inlet layout effect on the solid waste removal in an octagonal aquaculture tank. Front. Mar. Sci. 2022, 9, 1035794. [Google Scholar] [CrossRef]
  17. Green, B.W.; Rawles, S.D.; Beck, B.H. Response of channel×blue hybrid catfish to chronic diurnal hypoxia. Aquaculture 2012, 350–353, 183–191. [Google Scholar] [CrossRef]
  18. Tong, C.; He, K.; Hu, H. Design and Application of New Aeration Device Based on Recirculating Aquaculture System. Appl. Sci. 2024, 14, 3401. [Google Scholar] [CrossRef]
  19. Zhang, J.; Gao, Y.; Chen, C.; Zhang, N.; Liu, X.; Gao, X.; Hu, Q.; Zhang, Z. Hydrodynamic characteristics of industrialized recirculating aquaculture systems: A comprehensive review. J. Shanghai Ocean. Univ. 2023, 32, 903–910. [Google Scholar] [CrossRef]
  20. Yin, G.; Ong, M.C.; Lee, J.; Kim, T. Numerical simulation of oxygen transport in land-based aquaculture tank. Aquaculture 2021, 543, 736973. [Google Scholar] [CrossRef]
  21. Gorle, J.M.R.; Terjesen, B.F.; Summerfelt, S.T. Hydrodynamics of Atlantic salmon culture tank: Effect of inlet nozzle angle on the velocity field. Comput. Electron. Agric. 2019, 158, 79–91. [Google Scholar] [CrossRef]
  22. Zhu, F.; Hu, J.; Kong, J.; Gui, F.; Pan, X.; Feng, D. Flow field of circular recirculating aquaculture tank based on PIV. Trans. Chin. Soc. Agric. Eng. 2021, 37, 296–300. [Google Scholar]
  23. Gorle, J.M.R.; Terjesen, B.F.; Mota, V.C.; Summerfelt, S. Water velocity in commercial RAS culture tanks for Atlantic salmon smolt production. Aquac. Eng. 2018, 81, 89–100. [Google Scholar] [CrossRef]
  24. Summerfelt, S.T.; Mathisen, F.; Holan, A.B.; Terjesen, B.F. Survey of large circular and octagonal tanks operated at Norwegian commercial smolt and post-smolt sites. Aquac. Eng. 2016, 74, 105–110. [Google Scholar] [CrossRef]
  25. Oca, J.; Masalo, I. Flow pattern in aquaculture circular tanks: Influence of flow rate, water depth, and water inlet & outlet features. Aquac. Eng. 2013, 52, 65–72. [Google Scholar] [CrossRef]
  26. Wu, Y.; Feng, D.; Qu, J.; Jia, C.; Gui, F.; Zhang, Q. Characteristics of flow field in a large-scale circular aquaculture tank under action of submersible thrusters. J. Dalian Fish. Univ. 2024, 39, 289–297. [Google Scholar]
  27. Tvinnereim, K.; Skybakmoen, S. Water Exchange and Self-Cleaning in Fish Rearing Tanks. In Aquaculture: A Biotechnology in Progress; De Pauw, N., Jaspers, E., Ackefors, H., Wilkens, N., Eds.; European Aquaculture Society: Bredene, Belgium, 1989; pp. 1041–1047. [Google Scholar]
  28. Almansa, C.; Masaló, I.; Reig, L.; Piedrahita, R.; Oca, J. Influence of tank hydrodynamics on vertical oxygen stratification in flatfish tanks. Aquac. Eng. 2014, 63, 1–8. [Google Scholar] [CrossRef]
  29. Cheng, X.; Zhu, D.; Wang, X.; Yu, D.; Xie, J. Effects of Nonaerated Circulation Water Velocity on Nutrient Release from Aquaculture Pond Sediments. Water 2017, 9, 6. [Google Scholar] [CrossRef]
  30. Sin, M.-G.; An, C.-H.; Cha, S.-J.; Kim, M.-J.; Kim, H.-N. A method for minimizing the zone of low water flow velocity in a bottom center drain circular aquaculture tank. J. World Aquac. Soc. 2021, 52, 1221–1233. [Google Scholar] [CrossRef]
  31. Venegas, P.A.; Narváez, A.L.; Arriagada, A.E.; Llancaleo, K.A. Hydrodynamic effects of use of eductors (Jet-Mixing Eductor) for water inlet on circular tank fish culture. Aquac. Eng. 2014, 59, 13–22. [Google Scholar] [CrossRef]
  32. Xue, B.; Zhao, Y.; Bi, C.; Chen, Y.; Ren, X.; Liu, Y. Investigation of flow field and pollutant particle distribution in the aquaculture tank for fish farming based on computational fluid dynamics. Comput. Electron. Agric. 2022, 200, 107243. [Google Scholar] [CrossRef]
Figure 1. Diagram of experimental setup; (a) system structure diagram; (b) circular aquaculture tank. (1) Sewage collection exit. (2) Inlet. (3) Overflow outlet. (4) Universal wheel. (5) Acoustic Doppler Velocimetry. (6) Dissolved Oxygen Meter (7) Support structure. (8) Steel bracket. (9) Aquaculture tank.
Water 17 02172 g001
Figure 2. Physical photo of the inlet pipe: (a) horizontal single-pipe single-hole inlet and (b) vertical single-pipe porous inlet.
Water 17 02172 g002
Figure 3. Deployment of flow velocity measurement points (unit: cm). Note: green markers denote flow velocity measurement points, while red markers indicate monitoring points along the central diameter (X-axis) of the tank.
Water 17 02172 g003
Figure 4. Flow velocity distribution along the x-axis (Figure 3) under varying conditions in the horizontal single-pipe single-hole inlet.
Water 17 02172 g004
Figure 5. Flow velocity distribution along the x-axis (Figure 3) under varying conditions for the vertical single-pipe porous inlet: (a) θ = 0° and (b) θ = 45°.
Water 17 02172 g005
Figure 6. Distribution of dissolved oxygen across water layers in aquaculture tank for the horizontal single-pipe single-hole inlet.
Water 17 02172 g006
Figure 7. Distribution of dissolved oxygen across water layers in aquaculture tank for the vertical single-pipe porous inlet: (a) θ = 0° and (b) θ = 45°.
Water 17 02172 g007
Figure 8. Distribution of flow field under different structures in the aquaculture tank (Q = 5 L/s d/r = 2/35): (a) Horizontal single-pipe single-hole inlet; (b) Vertical single-pipe porous inlet (θ = 0°); and (c) Vertical single-pipe porous inlet (θ = 45°). The red arrows indicate water rotation direction.
Water 17 02172 g008
Figure 9. Distribution of flow field under different inlet angles in the aquaculture tank for the vertical single-pipe porous inlet (Q = 9 L/s d/r = 1/4): (a) θ = 0° and (b) θ = 45°. The red arrows indicate water rotation direction.
Water 17 02172 g009
Table 1. Experimental design.
Inlet StructureDeployment Distance Ratio (d/r)Flow Rate Q (L/s)
Horizontal single-pipe single-hole inlet2/3559
1/459
1/259
Vertical single-pipe porous inlet (0°)2/3559
1/459
1/259
Vertical single-pipe porous inlet (45°)2/3559
1/459
1/259
Table 2. Spatial coordinates of diametral (X-axis) monitoring points in the aquaculture tanks.
Point1234567
X-axis−3−2−10123
Y-axis0000000
Table 3. Average velocity in aquaculture tanks under different deployment distance ratios (d/r) conditions.
Inlet StructureDeployment Distance Ratio (d/r)Average Velocity (m/s)
Q = 5 L/sQ = 9 L/s
Horizontal single-pipe single-hole inlet 2/350.03110.0925
1/40.02510.1040
1/20.04740.0712
Vertical single-pipe porous inlet (0°)2/350.04770.0717
1/40.04020.0715
1/20.04130.0585
Vertical single-pipe porous inlet (45°)2/350.06060.0816
1/40.04340.0669
1/20.03400.0444
Table 4. Uniformity coefficient of the velocity field under different deployment distance ratio (d/r) conditions.
Inlet StructureDeployment Distance Ratio (d/r)Uniformity Coefficient
Q = 5 L/sQ = 9 L/s
Horizontal single-pipe single-hole inlet2/3527.739025.5979
1/437.445428.5124
1/248.537936.9456
Vertical single-pipe porous inlet (0°)2/3542.541335.4940
1/442.149439.9972
1/247.833743.5822
Vertical single-pipe porous inlet (45°)2/3541.297837.7932
1/446.108440.4282
1/227.741233.8592
Disclaimer/Publisher’s Note: The statements, opinions and data contained in all publications are solely those of the individual author(s) and contributor(s) and not of MDPI and/or the editor(s). MDPI and/or the editor(s) disclaim responsibility for any injury to people or property resulting from any ideas, methods, instructions or products referred to in the content.

