Abstract
Cracks and seepage in dam structures pose a serious risk to their safety, yet traditional inspection methods often fall short when it comes to detecting shallow or early-stage fractures. This study proposes a new approach that uses spectral response analysis to quickly identify signs of seepage in concrete dams. Researchers developed a three-layer model—representing the concrete, a seepage zone, and water—to better understand how cracks affect the way electrical signals behave, thereby inverting the state of the dam based on how electrical signals behave in actual engineering measurements. Through computer simulations and lab experiments, the team explored how changes in the resistivity and thickness of the seepage layer, along with the resistivity of surrounding water, influence key indicators like impedance and signal angle. The results show that the “spectrum-based method” can effectively detect seepage in concrete cracks of dams, and the measurement method of the “spectral quadrupole method” based on the “spectrum-based method” is highly sensitive to these variations, making it a promising tool for spotting early seepage. Field tests backed up the lab findings, confirming that this method is significantly better than traditional techniques at detecting cracks less than a meter deep and identifying early signs of water intrusion. It could provide dam inspectors with a more reliable way to monitor structural health and prevent potential failures.
1. Introduction
Dams are vital components of hydraulic infrastructure, central to national efforts in water resource management, flood control, power generation, and agricultural irrigation [1]. Ensuring their structural integrity is of utmost importance, as design flaws or lapses in maintenance can lead to catastrophic failures with far-reaching social and economic consequences—including loss of life and extensive damage [2,3,4]. Among the various threats to dam stability, the formation of cracks and subsequent seepage are among the most critical, serving as key mechanisms of structural deterioration [5,6,7]. When cracks develop in a dam, they often become easy pathways for water to seep through. This infiltration speeds up internal erosion by washing away small particles inside the structure, gradually weakening its stability [8]. At the same time, the pressure from seeping water can reduce the strength of the dam’s materials and increase internal water pressure, raising the risk of slope failure or even a catastrophic collapse [9]. That is why regular monitoring of cracks and prompt action to control seepage are essential for keeping dams safe over the long term.
Current dam crack monitoring methodologies predominantly employ established technical approaches with defined operational limitations. Infrared thermography converts radiative heat signatures into quantifiable electrical signals through focal plane array detectors, generating thermal profiles that delineate surface temperature gradients. These thermograms enable discontinuity detection by identifying anomalous thermal patterns associated with subsurface crack formations [10]. Distributed fiber optic sensing systems provide real-time monitoring of crack propagation dynamics through continuous strain field measurements, simultaneously capturing coupled stress–seepage interactions across dam structures [11]. Advanced predictive analytics, particularly wavelet-embedded neural networks, demonstrate capability in forecasting crack aperture evolution under multifactorial loading conditions [12]. While these conventional techniques exhibit satisfactory performance in characterizing mature cracks (typically exceeding 1.5 m depth with prolonged development histories), they present critical limitations in early-stage defect detection. Initial crack manifestations (1–1.5 m depth range) often evade timely identification due to insufficient sensitivity thresholds [13,14]. Moreover, the detection ranges of these methods are relatively small. For large hydropower stations, the detection time of these methods is long and the workload is large.
To address these operational limitations in early-stage crack detection and large-scale monitoring efficiency, this study introduces a spectral decomposition-based monitoring framework for integrated crack–seepage analysis. Building upon established spectral applications in power system anomaly detection [15,16], the proposed methodology extends frequency-domain interrogation techniques to dam health monitoring, enabling simultaneous quantification of structural deterioration mechanisms and their hydrodynamic drivers [17]. In this study, combined with the influence of seepage after dam cracks, an equivalent three-layer structure model of seepage in dam cracks is established. By setting different values of resistivity and the thickness of the intermediate layer structure, the amount of seepage and the depth of seepage are simulated, and the feasibility of detecting seepage in dam cracks by using the spectral method is studied.
2. Simulation Model Construction and Measurement Principle
In hydropower infrastructure, the emergence of localized cracks and seepage phenomena in dam foundations induces measurable variations in the moisture content of concrete dam structures. Based on hydrodynamic seepage characteristics, the dam foundation structure under seepage conditions is stratified into three distinct geological layers: the left stratum constitutes the concrete matrix, the central stratum represents the permeable seepage zone, and the right stratum corresponds to the fluvial water body. Given the structural complexity inherent in dam systems, selective model simplification focusing on critical dam components is implemented. Typical dam structures comprise reinforced concrete matrices with embedded steel reinforcement frameworks, where grounding down-conductors from electrical installations interface with subaqueous grounding grids through the dam body. To simplify the model, the grounding conductor and the steel bar, which are natural grounding bodies, are equivalent to a mesh conductor structure. At present, the commonly used spectrum measurement methods based on the “spectrum method” in large-scale grounding grids include the spectrum loop method and the spectrum quadrupole method. In order to find the optimal spectrum measurement method, this paper will respectively adopt the spectrum loop method and the spectrum quadrupole method for measurement.
The simulation framework was established with reference to geological parameters from a large-scale hydropower station in China, where the predominant geological composition consists of granite formations with significant overburden thickness. The resistivity of the river water is taken as 55 Ω·m, and the resistivity of the rock is relatively high, at 3500 Ω·m. The computational model was constructed using CDEGS simulation software (v15), implementing a three-layer stratigraphic configuration comprising the concrete matrix, permeable seepage zone, and aqueous layer. Key parametric settings include the following: The left layer is the concrete layer with a resistivity of 3500 Ω·m. The thickness of the left layer decreases with an increase in the seepage layer. The middle layer is a seepage layer. The resistivity is set within the range of 1000–3500 Ω·m, and the thickness of the middle layer is 0–0.8 m. The right layer is the water layer, with the thickness set to infinity and the resistivity set to 55 Ω·m.
The spectrum quadrupole method employs a four-electrode measurement system. It injects excitation signals through two current electrodes and measures the potential difference with two voltage electrodes. Its advantage lies in eliminating the influence of contact resistance. For the equidistant quadrupole method, the distance between adjacent poles is a. For uniform soil, the potential difference V caused by the point current sources I and −I is described by (1). (I and −I denote two current excitation signals with identical amplitudes but opposite phases.)
After measuring I and V, the resistivity ρ of the uniform soil can be calculated by Equation (2):
In fact, the detection depth of the current and voltage electrodes will cause calculation errors. To reduce the errors, the current and voltage electrodes can be hit on the surface of the measured object, and ≥10 h can be taken. At this time, .
For the hierarchical medium model, its frequency-domain response impedance can be expressed as
Among them, ρi is the resistivity of the i-th layer; εi is the dielectric constant of the i-th layer; di is the thickness of the i-th layer; is the propagation constant.
In the spectral quadrupole method, the parameters of the grounding conductor are set as follows: the lengths of all four electrodes are 20 cm, the radius is 6.7 mm, the burial depth is 0.1 m, the material is copper, and the electrode spacing a = 10 m. The model is shown in Figure 1.
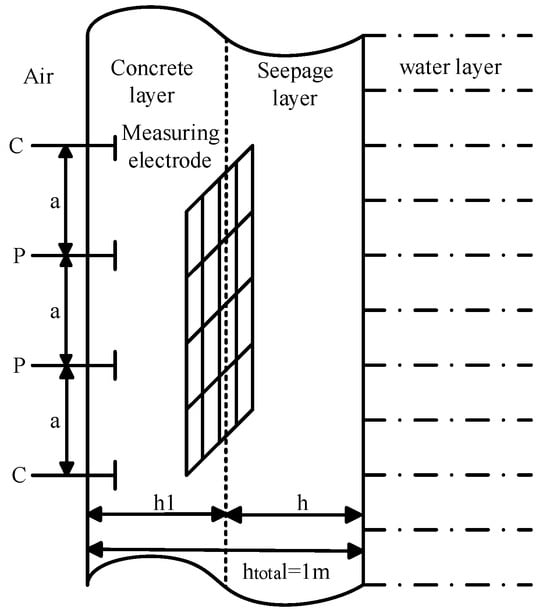
Figure 1.
Spectrum quadrupole method simulation model.
The spectral loop method is based on the loop coupling theory in electromagnetic fields. Its basic principle is to obtain the impedance spectral characteristics of the system by injecting an alternating current into the conductor network and measuring the response voltage V.
Among them, V1 is the voltage at the injection point position; V2 is the voltage at the position of the return point.
For the concrete structure of the dam, it can be equivalent to a multi-layer medium model, and its frequency-domain response can be expressed as
Among them, Z(ω) is the complex impedance; R is the equivalent resistance; L is the equivalent inductance; C is the equivalent capacitance; ω is the angular frequency.
In the multi-layer dielectric model, the real and imaginary parts of the impedance correspond to the resistive and dielectric characteristics of the concrete structure, respectively. When there is crack seepage, the intrusion of water will cause changes in the medium parameters, which are specifically manifested as
Among them, Δσ, Δε, and Δμ represent the changes in electrical conductivity, dielectric constant, and magnetic permeability, respectively.
In the spectral loop method, the conductor is a 50 m × 50 m mesh structure with a radius of 6.7 mm and a burial depth of 0.6 m, and is made of copper. The conductors in the injection and reflux sections are placed at the opposite corners of the mesh structure. The model is shown in Figure 2. In both models, the excitation is a current source with an amplitude of 20 A. In the loop method, the angle of the injected conductor excitation source in the polar coordinate system is 0°, and the angle of the reflux conductor is 180°.
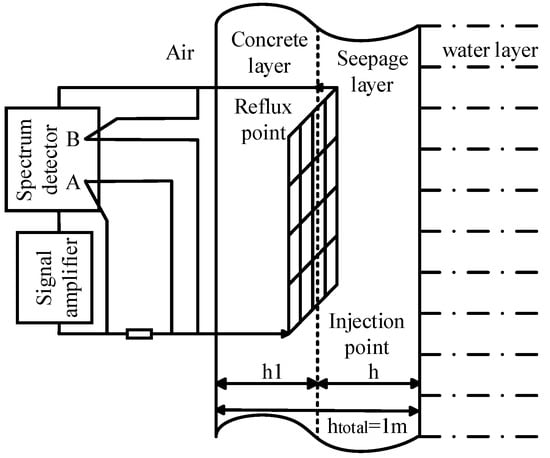
Figure 2.
Spectrum loop method simulation model diagram.
Whether it is the spectral quadrupole method or the spectral loop method, when there is a seepage layer in the dam, the parameter changes of the intermediate layer will lead to characteristic changes in the impedance spectrum. The frequency-domain response model of the three-layer seepage structure can be equivalent to , where ρ and h represent the resistivity and thickness of each layer, respectively, and ω represents the injection frequency. The frequency range of the injection current source is changed to 50 Hz–1 MHz.
3. Comparative Analysis of Structural Parameter Response Characteristics Using Two Spectral Methods
According to the structure of the dam and the influence of seepage, the hydropower station dam is equivalent to a three-layer structure model. Among them, due to the influence of seepage, the resistivity of the seepage layer, the thickness of the seepage layer and the thickness of the concrete layer will change. In order to explore the influence of these changes on the dam body, two methods, namely the spectral loop method and the spectral quadrupole method, were adopted to study the variation laws of the spectral response characteristics when the dam parameters and the river water changed, respectively, and to conduct a comparative analysis of the two spectral measurement methods in order to achieve the purpose of using the change of response characteristics to identify the seepage situation of the dam.
3.1. Spectral Response Characteristics of Resistivity in Concrete Seepage Layers
In the equivalent three-layer structure model, when water seepage occurs, the main affected layer is the middle seepage layer. Therefore, the influence of changes in the resistivity of the seepage layer is explored first. The resistivity of the concrete layer on the left is set to 3500 Ω m. The variation range of the resistivity of the seepage layer is 1000–3500 Ω m, and the thickness of the seepage layer is 0.5 m. The resistivity of the seepage layer was changed by using the spectral loop method and injecting current sources of different frequencies. The obtained spectral response characteristics are shown in Figure 3:
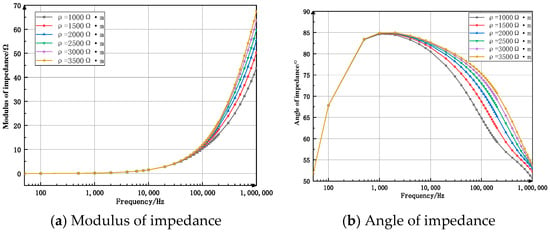
Figure 3.
Spectrum response characteristic curve when the resistivity of the permeable layer changes (spectrum loop method).
Figure 3a presents the variation characteristics of the impedance modulus with variations in the resistivity of the concrete seepage layer. The composite curve demonstrates an initial stabilization phase followed by an ascending progression with progressively increasing growth rates. In the sub-10 kHz frequency domain, both the characteristic curve and impedance modulus exhibit gradual enhancement, ascending from 0.01 to 1.5. While a marked upward trend emerges within the 10–60 kHz range, the curves corresponding to different resistivity values demonstrate minimal differentiation, exhibiting near-overlapping characteristics. As the frequency exceeds this range, the growth rate intensifies substantially, accompanied by progressively diverging characteristics among the resistivity-dependent curves. When the frequency reaches 200 kHz, the differences can be clearly seen. The higher the resistivity, the higher the curve, and the greater the impedance modulus value.
Figure 3b illustrates the variational characteristics of the impedance angle with respect to the resistivity variation in the concrete seepage layer. The characteristic curve demonstrates a distinct pattern of initial ascent followed by subsequent descent. At frequencies below 1 kHz, the impedance angle shows an elevation from 51° to 85°, during which the curves exhibit minimal divergence and nearly overlap. When the frequency continues to increase, the curve begins to decline, and the rate of decline accelerates with the increase in frequency. At this time, the difference in the curve is obvious. It can be seen that at the same frequency, the greater the resistivity, the greater the impedance angle.
The spectral response characteristics obtained by using the spectral quadrupole method are shown in Figure 4 as follows:
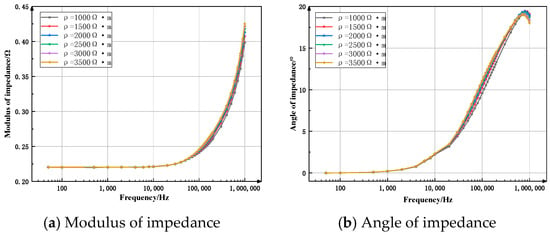
Figure 4.
Spectrum response characteristic curve when the resistivity of the permeable layer changes (spectrum quadrupole method).
Figure 4a shows the variation curve of the impedance modulus when the resistivity of the concrete seepage layer changes. The overall trend of the curve is that it changes slowly at first and then increases, and the rate of increase becomes faster and faster. When the frequency is less than 10 kHz, the curve remains basically unchanged and the impedance modulus value stays at 0.22. When the frequency continues to increase, the ascending speed of the curve significantly accelerates. There are certain differences among the curves of different resistances. The greater the resistivity, the higher the curve, and the greater the impedance modulus value.
Figure 4b demonstrates the impedance angle variation profiles under different resistivity conditions in the concrete seepage layer. The overall trend of the curve is to rise first and then slightly decrease. When the frequency is less than 10 kHz, the curve rises slowly, but at this time, the curve difference is small and almost coincides. Between 10 and 200 kHz, the ascending speed of the curve increases, and the differences in the curves of different resistances become larger and larger. When the frequency continues to increase, the rising speed of the curve slows down, and the curve differences of different resistances become smaller and smaller. When the frequency increases to 700 kHz, the impedance angle reaches the maximum. Within this frequency range, the higher the resistivity, the higher the curve, and the larger the impedance angle value. When the frequency continues to increase, the impedance angle begins to decrease, and the rate of decrease accelerates with the increase in frequency. At the same frequency, the greater the resistivity, the smaller the impedance angle.
It can be seen from the spectral response characteristics of the two methods that when the crack seepage phenomenon occurs, the resistivity of the concrete seepage layer will change. During the measurement process, when the spectral loop method is adopted, there are obvious changes in the impedance mode of the high-frequency band and the impedance angle of the medium- and high-frequency bands. The numerical changes are large, which is more conducive to observation and analysis. In the measurement results of the spectral quadrupole method, the variation of the impedance mode in the full frequency band is relatively small and difficult to observe, while the variation of the impedance angle in the mid-frequency band is more obvious.
3.2. Spectral Response Characteristics of Water Layer Resistivity
The concrete structure’s right boundary interfaces with a river water layer. In order to explore the influence of the water source and different water qualities on the crack seepage of the hydropower station dam, referring to the resistivity of different water qualities, the variation range of the resistivity of the right water layer is set as 20–100 Ω·m, the resistivity of the concrete is 3500 Ω·m, the resistivity of the seepage layer is 2000 Ω·m, and the thickness of the seepage layer is 0.5 m. In CDEGS, the resistivity of the water layer was changed, and the spectral loop method was adopted to obtain the variation law of the spectral response characteristics under different injection current source frequencies. The spectral response characteristic curves of the impedance mode and impedance angle when the resistivity of the water layer changed were drawn as shown in Figure 5:
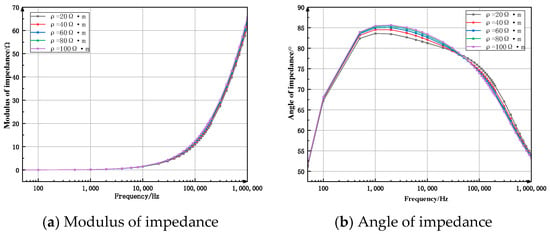
Figure 5.
Spectral response characteristic curve of water layer when resistivity changes (spectrum loop method).
Figure 5a shows the variation curve of the impedance modulus when the resistivity of the water layer changes. The overall trend of the curve is to be flat at first and then rise, and the rising speed becomes faster and faster. When the frequency is less than 10 kHz, the curve increases gently, and the impedance modulus increases from 0.01 to 1.51. As the frequency continues to increase, the curve shows a significant upward trend and the speed becomes faster and faster, but the differences between the curves are not obvious. When the frequency reaches 200 kHz, the differences in the impedance modulus values of the resistivity of different water layers become larger, but not obvious. It can be seen that in this model, the resistivity of the water layer has a relatively small influence on the impedance modulus.
Figure 5b shows the variation curve of the impedance angle when the resistivity of the water layer changes. The overall trend of the curve is to rise first and then fall. When the frequency is less than 1 kHz, the impedance angle rises from 51 to 83, but the differences between the curves are not obvious and almost overlap. When the frequency increases to 50 kHz, the impedance angle decreases to 78. Within this frequency range, the curve differences are obvious, and the greater the water layer rate, the greater the impedance angle. When the frequency increases to 1 MHz, the impedance angle continues to decrease. At this time, the greater the resistivity of the water layer, the smaller the impedance angle.
The spectral response characteristics obtained by using the spectral quadrupole method are shown in Figure 6:
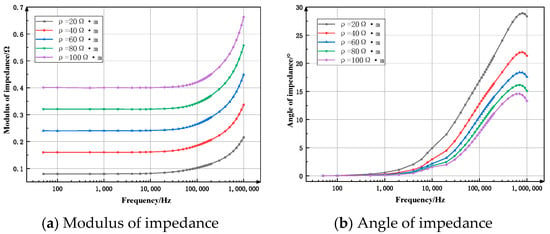
Figure 6.
Spectral response characteristic curve of water layer when resistivity changes (spectrum quadrupole method).
Figure 6a shows the variation curve of the impedance modulus when the resistivity of the water layer changes. The overall trend of the curve is that it changes slowly at first and then increases, and the rate of increase becomes faster and faster. When the frequency is less than 10 kHz, the curve remains basically unchanged. When the frequency continues to increase, the curve shows a significant upward trend and the speed becomes faster and faster. Within all frequency bands, the curve differences are obvious. The greater the resistivity, the greater the impedance modulus. It can be seen that in this model, the resistivity of the water layer has a significant influence on the impedance mode, but the value is relatively small.
Figure 6b shows the variation curve of the impedance angle when the resistivity of the water layer changes. The overall trend of the curve is a linear increase followed by a slight decrease. When the frequency is less than 1 kHz, the curve rises slowly, but the differences between the curves are not obvious. Between 1 and 700 kHz, the curve rises significantly. The smaller the resistivity, the greater the rising speed of the curve, and the difference in the curve is obvious. When the frequency continues to increase, the curve begins to decline. Within all frequency bands, the curve differences are obvious. The greater the resistivity, the smaller the impedance angle. It can be seen that in this model, the resistivity of the water layer has a significant influence on the impedance angle.
It can be seen from the spectral response characteristics of the two methods that when the resistivity of the water layer changes, the impedance mode of the spectral loop method changes less, and the impedance angle varies significantly in the mid-frequency band. The response impedance modulus curve of the spectral quadrupole method varies significantly throughout the entire frequency band. Although the numerical change is relatively small, the variation of the response impedance modulus when the soil resistivity of the water layer changes can be clearly observed. The impedance angle varies significantly in the mid-frequency band and the high-frequency band.
3.3. Spectral Response Characteristics of Concrete Seepage Layer Thickness
When leakage occurs in the dam body, the number and depth of cracks will affect the severity of the seepage. The deeper the cracks, the greater the thickness of the seepage layer in the model will be, and then the thickness of the concrete structure on the left will also change. The variation range of the seepage layer thickness is set as 0 to 0.8 m, the resistivity of the concrete on the left is 3500 Ω·m, that of the concrete seepage layer in the middle is 2000 Ω·m, and that of the river water on the right is 55 Ω·m. In the CDEGS software, the thickness of the intermediate seepage layer was changed, and the spectral loop method was adopted to obtain the variation law of the spectral response characteristics under different injection current source frequencies. The simulation results were imported into Origin, and the spectral response characteristic curves of the impedance mode and impedance angle when the thickness of the seepage layer changed were drawn as shown in Figure 7:
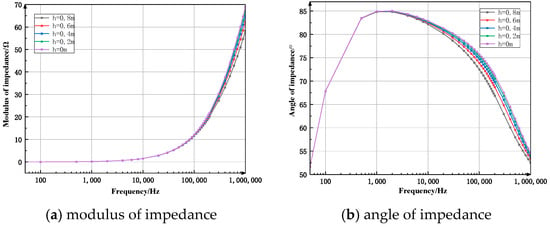
Figure 7.
Spectrum response characteristic curve when the thickness of the permeable layer changes (spectrum loop method).
Figure 7a shows the variation curve of the impedance modulus when the thickness of the seepage layer changes. The overall trend of the curve is to be flat at first and then rise, and the rising speed becomes faster and faster. When the frequency is less than 10 kHz, the curve is relatively gentle, almost coincident, and the impedance modulus is small, increasing from 0.01 to 1.5. When the frequency continues to increase to 200 kHz, the curve begins to rise, but the differences among the curves are not obvious. When the frequency continues to increase, the ascending speed of the curve accelerates, and there are relatively obvious differences among the curves. When the thickness of the seepage layer is 0, that is, when no seepage phenomenon occurs, the impedance modulus is the largest. The thicker the seepage layer, the smaller the impedance modulus.
Figure 7b shows the variation curve of the impedance angle when the thickness of the seepage layer changes. The overall trend of the curve is to rise first and then fall. When the frequency is less than 1 kHz, the impedance angle curve rises from 51 to 85, and the curve difference is not obvious and almost coincides. The frequency continues to increase, the curve begins to decline, and the differences between each curve become larger and larger. When the frequency reaches 20 kHz, the impedance angles of seepage layers of different thicknesses have already shown significant differences, and the thicker the seepage layer, the smaller the impedance angle.
The spectral response characteristics obtained by using the spectral quadrupole method are shown in Figure 8:
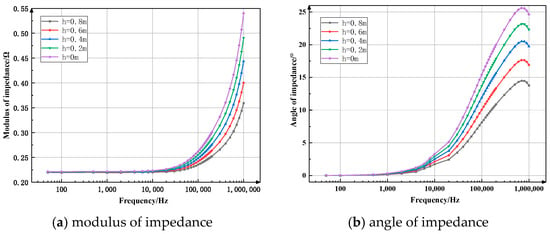
Figure 8.
Spectrum response characteristic curve when the thickness of the permeable layer changes (spectrum quadrupole method).
Figure 8a shows the variation curve of the impedance modulus when the thickness of the seepage layer changes. The overall trend of the curve is that it changes slowly at first and then increases, and the rate of increase becomes faster and faster. When the frequency is less than 10 kHz, the curve remains basically unchanged, and there is basically no difference in the impedance modulus values of seepage layers of different thicknesses. When the frequency continues to increase, the curve rises significantly. The smaller the thickness of the seepage layer, the greater the rising speed of the curve. The impedance modulus values of different thicknesses vary significantly. It can be seen that at the same frequency, the greater the thickness, the smaller the impedance modulus.
Figure 8b shows the variation curve of the impedance angle when the thickness of the seepage layer changes. The overall trend of the curve is that it first rises and the rising speed becomes faster and faster, and then slightly decreases. When the frequency is less than 1 kHz, the curve rises slowly, but the differences between the curves are not obvious. Between 1 and 700 kHz, the curve rises significantly. The smaller the thickness of the seepage layer, the greater the rising speed of the curve, and the difference in the curve is obvious. When the frequency continues to increase, the curve begins to decline, and the curve difference is obvious. It can be seen that at the same frequency, the greater the thickness, the smaller the impedance angle.
It can be seen from the spectral response characteristics of the two methods that when the thickness of the seepage layer changes, the impedance modulus measured by the spectral loop method changes less, and the impedance angle varies slightly in the high-frequency band. The impedance mode of the spectral quadrupole method varies significantly in the high-frequency band, with large differences between the curves, and the impedance angle varies significantly in the mid-frequency band and high-frequency band.
From the above comparative analysis, it can be seen that there are significant differences in the spectral response characteristics corresponding to the difference in the resistivity of seepage layers, the thickness of the seepage layer, and the thickness of the concrete layer. In engineering applications, by analyzing the spectral response data obtained by the two measurement methods based on the “spectrum method” and comparing it with the simulation results, the resistivity of the seepage layer, the thickness of the seepage layer and the thickness of the concrete layer of the dam can be effectively obtained, so as to judge the seepage in concrete cracks of dams.
4. Practical Application of Spectral Method
Seepage detection in dams constitutes a critical engineering measure for ensuring structural stability and operational safety [18]. Current dam seepage monitoring methodologies encompass both conventional physical monitoring approaches and advanced wireless sensing technologies [19]. Traditional physical monitoring primarily involves groundwater level, temperature, and pressure measurements, where data acquired through sensors are transmitted via wired transmission systems to monitoring stations for subsequent analysis [20]. In contrast, modern wireless monitoring technologies utilize integrated wireless transmission and cloud-based data storage solutions [21]. The spectral method, as an analytical technique for characterizing wave frequency distributions to determine source properties and propagation system characteristics, finds extensive applications in electronic engineering and communication systems [22]. Combined with the simulation data, it is proposed to adopt the spectral quadrupole detection technology to analyze the dispersion effect of structural parameters on different frequency responses in order to identify the changes in the concrete state of the dam. The simulation reveals that this method can effectively distinguish the physical characteristics of different structural layers and reflect the seepage situation of the dam body. To validate the engineering feasibility of this approach, our research team conducted field measurements at a major Chinese hydropower station. Spectral measurements were performed on concrete walls at two different elevations inside the dam: the first floor and the seventh floor. The seventh-floor measurements were taken at upstream and downstream locations of bay #4-5 in the middle of the gallery, while the first-floor measurements were conducted at upstream and downstream positions in the central gallery section. The specific measurement locations are illustrated in Figure 9.
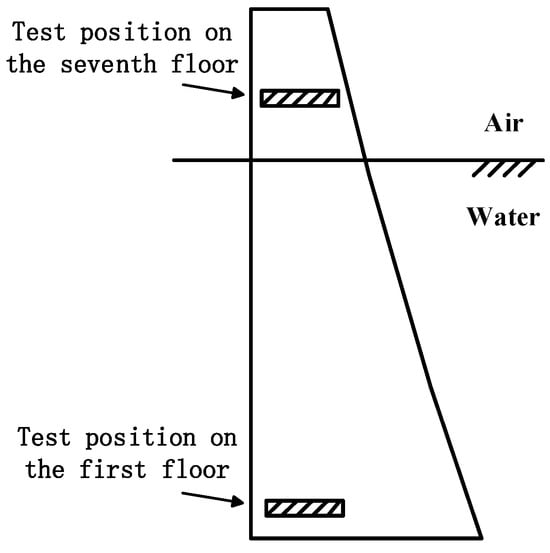
Figure 9.
Different test locations inside the dam.
We analyzed the test data and drew the modulus value curves of the response impedance at different positions as shown in Figure 10.
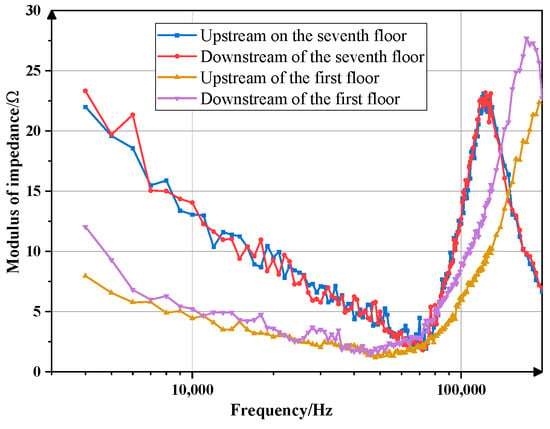
Figure 10.
Impedance mode curves of response characteristics at different positions.
The seventh floor of the dam is above the water level line of the day, while the first floor is below it. Due to the influence of seepage, the water content of the dam body on the first floor is higher than that on the seventh floor, and the soil resistivity is also lower than that on the seventh floor. It can be seen from the above figure that whether it is the first layer or the seventh layer, their spectral response curves all show a trend of first decreasing, then increasing, and then decreasing. The impedance modulus value curves of the upstream and downstream of the seventh layer basically overlap, while the impedance modulus of the downstream side of the first layer at high frequencies is greater than that of the upstream side. In the low-frequency band, the downward trend of the curve may be due to the internal sealing of the dam body, the high temperature resulting in a large moisture content in the air, and the low resistivity of the concrete wall surface. When the frequency is low, the surface concrete will affect the measurement results. As the frequency continues to increase, the detection depth will keep increasing, and the influence of the surface concrete will become smaller and smaller.
From the spectral response characteristic curves of the impedance modes of the first layer and the seventh layer, it can be seen that although the measurement point positions are different, the curve trends of the grounding mutual impedance are the same. The curves have two descending intervals and one ascending interval. There are four overlapping parts of the curves in the 70–80 kHz frequency band, and the response impedance mode values of the upstream and downstream sides of the same layer of the dam at the same frequency are not much different.
Due to the high water level on the upstream side of the first floor and the low water level on the downstream side, although both the upstream and downstream of the first floor are in contact with the river water, because the water pressure on the upstream side is greater than that on the downstream side, the local seepage situation on the upstream side is more serious than that on the downstream side. It can be seen from the measured mutual impedance modulus values that whether in the mid-frequency band of 10–70 kHz or the high-frequency band of 80–100 kHz, there are obvious differences in the response mutual impedance modulus of the upstream and downstream sides of the first layer. The response mutual impedance modulus of the upstream side of the first layer is smaller than that of the downstream side. Both the upstream and downstream sides of the seventh level of the dam are above the water surface, and there is no local seepage situation. Therefore, the mutual impedance curves of each frequency band basically overlap. The high-frequency impedance mode on the upstream side below the water level line is 8–10% lower than that on the downstream side, while the spectral responses of the upstream and downstream above the water level line are basically the same. The difference in high-frequency impedance mode between the upstream and downstream of the water level line can be as high as 65%.
5. Conclusions
Based on the measured data and experimental simulation results of a large hydropower station, the following conclusions can be drawn:
- Both of the two spectral detection methods proposed in this paper can reflect whether seepage occurs in the dam. Among them, the differences in the spectral response impedance mode under the loop method are mainly reflected in the high-frequency band after 200 kHz. The differences in response impedance mode and impedance angle under the quadrupole method are obvious after 20 kHz in the medium- and high-frequency band, that is, the required frequency of the quadrupole method is lower and it is easier to implement.
- The spectral quadrupole method is more sensitive to the change in the thickness of the seepage layer. The deeper the crack depth of the dam and the thicker the concrete seepage layer, the smaller the spectral response impedance mode and impedance angle, which are obvious in the medium- and high-frequency bands. The higher the frequency, the greater the difference between the curves. Moreover, the quadrupole method also responds significantly to the resistivity change of the water layer. After the full frequency band of the impedance mode and the impedance angle reach 1 kHz, the differences between the curves are significant. The smaller the resistivity of the water layer, the smaller the response impedance mode and impedance angle.
- During on-site measurement, for the dam body above the water level line, neither the upstream nor the downstream comes into contact with the water body, and the measured impedance modulus curves are basically coincident. For the dam body below the water level line, the upstream is in contact with the water body while the downstream is not. The high-frequency impedance modulus value measured in the upstream is significantly smaller than that in the downstream. It is indicated that the spectral quadrupole method can detect the condition on the outside of the dam concrete, which proves the feasibility of the spectral detection method in practice.
- In actual measurement, the thickness of the dam body concrete above the water level line is less than that below the water level line, and the thickness of the seepage layer above the water level line is even smaller. The resistivity of the concrete is much greater than that below the water level line. In the measured spectral response curves, whether in the low-frequency band or the mid-frequency band, the spectral response impedance modulus of the dam body below the water level line is much smaller than that of the dam body above the water level line, which is consistent with the research results in the previous text. It proves that the spectral method can effectively detect the crack seepage situation of the dam and also provides a new idea for the detection of dam concrete. Moreover, the spectral detection method has gradually gained attention in the field of non-destructive testing of structures due to its advantages such as high precision and strong penetration. It also shows broad application prospects in engineering fields such as tunnel engineering inspection, metro rail defect detection, and internal crack identification of underground structures.
Author Contributions
Conceptualization, J.T. and Y.X.; methodology, S.N.; software, Z.L.; validation, J.T., Y.X. and X.W.; formal analysis, J.T.; investigation, X.W.; resources, X.C.; data curation, D.H.; writing—original draft preparation, J.T.; writing—review and editing, Y.X.; visualization, D.H.; supervision, X.C.; project administration, S.N.; funding acquisition, Z.L. All authors have read and agreed to the published version of the manuscript.
Funding
This research was funded by the National Natural Science Foundation of China, grant number 51777175.
Data Availability Statement
The original contributions presented in the study are included in the article; further inquiries can be directed to the corresponding author.
Conflicts of Interest
Authors Jinmao Tang, Zhenchao Liu and Shuai Niu are employed by Yalong River Hydro Development Company. The remaining authors declare that the research was conducted in the absence of any commercial or financial relationships that could be construed as a potential conflict of interest.
References
- Serra, C.; Batista, A.L.; Monteiro Azevedo, N. Dam and wet-screened concrete creep in compression: In situ experimental results and creep strains prediction using model B3 and composite models. Mater. Struct. 2016, 49, 4831–4851. [Google Scholar] [CrossRef]
- Deng, Z.; Li, Q.; Fu, H. Comparison between mechanical properties of dam and sieved concretes. J. Mater. Civ. Eng. 2008, 20, 321–326. [Google Scholar] [CrossRef]
- Serra, C.; Batista, A.L.; Monteiro Azevedo, N. Effect of wet screening in the elastic properties of dam concrete: Experimental in situ test results and fit to composite models. J. Mater. Civ. Eng. 2016, 28, 04016146. [Google Scholar] [CrossRef]
- Serra, C.; Batista, A.L.; Azevedo, N.M.; Custódio, J. Prediction of Dam Concrete Compressive and Splitting Tensile Strength Based on Wet-Screened Concrete Test Results. J. Mater. Civ. Eng. 2017, 29, 04017188. [Google Scholar] [CrossRef]
- Wang, X.; Yu, H.; Lv, P.; Wang, C.; Zhang, J.; Yu, J. Seepage safety assessment of concrete gravity dam based on matter-element extension model and FDA. Energies 2019, 12, 502. [Google Scholar] [CrossRef]
- Singh, B.; Sihag, P.; Pandhiani, S.M.; Debnath, S.; Gautam, S. Estimation of permeability of soil using easy measured soil parameters: Assessing the artificial intelligence-based models. ISH J. Hydraul. Eng. 2019, 27, 38–48. [Google Scholar] [CrossRef]
- Benítez, R.; Ortiz-Caraballo, C.; Preciado, J.C.; Conejero, J.M.; Sánchez Figueroa, F.; Rubio-Largo, A. A short-term data based water consumption prediction approach. Energies 2019, 12, 2359. [Google Scholar] [CrossRef]
- Zhang, X.; Chen, X.; Li, J. Improving dam seepage prediction using back-propagation neural network and genetic algorithm. Math. Probl. Eng. 2020, 2020, 1404295. [Google Scholar] [CrossRef]
- Salmasi, F.; Nouri, M. Effect of upstream semi-impervious blanket of embankment dams on seepage. ISH J. Hydraul. Eng. 2017, 25, 143–152. [Google Scholar] [CrossRef]
- Scaioni, M.; Marsella, M.; Crosetto, M.; Tornatore, V.; Wang, J. Geodetic and remote-sensing sensors for dam deformation monitoring. Sensors 2018, 18, 3682. [Google Scholar] [CrossRef]
- Hong, J.; Lee, S.; Bae, J.H.; Lee, J.; Park, W.J.; Lee, D.; Kim, J.; Lim, K.J. Development and evaluation of the combined machine learning models for the prediction of dam inflow. Water 2020, 12, 2927. [Google Scholar] [CrossRef]
- Nourani, V.; Sharghi, E.; Aminfar, M.H. Integrated ANN model for earthfill dams seepage analysis: Sattarkhan dam in Iran. Artif. Intell. Res. 2012, 1, 22–37. [Google Scholar] [CrossRef]
- Wen, F.; Guan, W.H.; Yang, M.X.; Cao, J.X.; Zou, Y.B.; Liu, X.; Wang, H.J.; Dong, N.P. The optimization of water storage timing in upper Yangtze reservoirs affected by water transfer projects. Water 2023, 15, 3393. [Google Scholar] [CrossRef]
- Cho, I.K.; Yeom, J.Y. Crossline resistivity tomography for the delineation of anomalous seepage pathways in an embankment dam. Geophysics 2007, 72, 31–38. [Google Scholar] [CrossRef]
- Jiang, T.; Zhang, J.R.; Wan, W.F.; Cui, S.; Deng, D.P. 3D transient numerical flow simulation of groundwater bypass seepage at the dam site of Dongzhuang hydro-junction. Eng. Geol. 2017, 231, 176–189. [Google Scholar] [CrossRef]
- Rozycki, A.; Fonticiella, J.M.R.; Cuadra, A. Detection and evaluation of horizontal fractures in earth dams using the self-potential method. Eng. Geol. 2006, 82, 145–153. [Google Scholar] [CrossRef]
- Song, S.H.; Song, Y.; Kwon, B.D. Application of hydrogeological and geophysical methods to delineate leakage pathways in an earth fill dam. Explor. Geophys. 2005, 36, 92–96. [Google Scholar] [CrossRef]
- Bolève, A.; Revil, A.; Janod, F.; Mattiuzzo, J.L.; Fry, J.-J. Preferential fluid flow pathways in embankment dams imaged by self-potential tomography. Near Surf. Geophys. 2009, 7, 447–462. [Google Scholar] [CrossRef]
- Sjödahl, P.; Dahlin, T.; Johansson, S. Embankment dam seepage evaluation from resistivity monitoring data. Near Surf. Geophys. 2009, 7, 463–474. [Google Scholar] [CrossRef]
- Zhou, R.; Su, H.; Wen, Z. Experimental study on leakage detection of grassed earth dam by passive infrared thermography. NDT E Int. 2022, 126, 102583. [Google Scholar] [CrossRef]
- Zhu, Y.; Tang, H. Automatic damage detection and diagnosis for hydraulic structures using drones and artificial intelligence techniques. Remote Sens. 2023, 15, 615. [Google Scholar] [CrossRef]
- Liu, X.; Li, Z.; Sun, L.; Khailah, E.Y.; Wang, J.; Lu, W. A critical review of statistical model of dam monitoring data. J. Build. Eng. 2023, 80, 108106. [Google Scholar] [CrossRef]
Disclaimer/Publisher’s Note: The statements, opinions and data contained in all publications are solely those of the individual author(s) and contributor(s) and not of MDPI and/or the editor(s). MDPI and/or the editor(s) disclaim responsibility for any injury to people or property resulting from any ideas, methods, instructions or products referred to in the content. |
© 2025 by the authors. Licensee MDPI, Basel, Switzerland. This article is an open access article distributed under the terms and conditions of the Creative Commons Attribution (CC BY) license (https://creativecommons.org/licenses/by/4.0/).