Article

NaCl as a Simple Yet Unique Activator of Kaolin: Surface Engineering for Enhanced Heavy Metal Adsorption

by
Amos K. Avornyo
1,
Vasileios E. Katzourakis
1,
Shadi W. Hasan
2,
Fawzi Banat
2 and
Constantinos V. Chrysikopoulos
1,3,*
1
Department of Civil and Environmental Engineering, Khalifa University of Science and Technology, Abu Dhabi 127788, United Arab Emirates
2
Department of Chemical and Petroleum Engineering, Khalifa University of Science and Technology, Abu Dhabi 127788, United Arab Emirates
3
School of Chemical and Environmental Engineering, Technical University of Crete, 731 00 Chania, Greece
*
Author to whom correspondence should be addressed.
Water 2025, 17(14), 2120; https://doi.org/10.3390/w17142120
Submission received: 30 May 2025 / Revised: 12 July 2025 / Accepted: 14 July 2025 / Published: 16 July 2025
(This article belongs to the Section Wastewater Treatment and Reuse)

Abstract

This study investigates the effects of NaCl activation on the structural and chemical properties of kaolin for the adsorption of Zn2+ from solution. Kaolin was treated with NaCl solution at varying concentrations (0.5, 1.0, 2.0, and 4.0 M), and ultrasonication was used as a means of agitation. Scanning electron microscopy (SEM), X-ray diffraction (XRD), Fourier transform infrared spectroscopy (FTIR), X-ray photoelectron spectroscopy (XPS), and dynamic light scattering (DLS) were employed to characterize the physical and chemical effects of the NaCl activation and its subsequent influence on the kaolin’s heavy metal removal efficiency. The kaolin activated with 0.5 M NaCl solution yielded the optimal performance with a 13% increase in Zn2+ removal compared to the unmodified clay. The adsorption data best matched the pseudo-second-order kinetic model and the Langmuir isotherm. This indicates a monolayer adsorption on a homogeneous surface, with chemisorption as the dominant adsorption mechanism. Thermodynamic analysis also revealed that the adsorption process was endothermic and spontaneous. Furthermore, NaCl activation slightly enhanced the microstructural properties of the kaolin and moderated the surface charge, creating a more favorable electrostatic environment for improved heavy metal ion adsorption. The findings further highlight the potential of NaCl activation to introduce exchangeable Na+ onto the kaolin surface in a pH-neutral environment and promise a clean, mechanistically clear, and practical route for ion exchange with heavy metals such as Zn2+.

1. Introduction

Several industries such as mining, electroplating, dyeing and printing, petroleum refining, pulp and bleaching, leather tanning, glass and ceramic glazing, and coloring often produce wastewater that contains divalent heavy metals, such as Zn2+, Pb2+, and Cd2+. These metals are usually removed by sorbents, whilst others, like Ba2+, Fe2+, and Fe3+, are usually removed by oxidation–precipitation or sulfate dosing, respectively, rather than by sorption. Owing to their toxicity and persistence in the environment, these metals pose serious environmental and health risks [1].
Adsorption is the most common method for removing heavy metal ions from wastewater. Well-known conventional adsorbents include activated carbon (AC), silica gel, and alumina. Despite having high adsorption capacity, these materials are generally more expensive. Recently, natural inexpensive minerals such as kaolin have been explored as credible alternatives [2,3]. Kaolin, a hydrous aluminosilicate, belongs to the 1:1 group of clays. It is composed of layers of AlO6 octahedral sheets bonded alternately to tetrahedral SiO4 sheets through hydrogen bonding [4,5]. The ability of kaolin to adsorb cationic heavy metals stems from its inherent negative charge, which results either from a limited isomorphous substitution [6] or broken crystal edges [7]. The metal ion adsorption capacity of kaolin is further enhanced by its high pH dependence, with the release of H+ depending on the pH of the surrounding environment. Compared to other types of clays, such as bentonite and montmorillonite, kaolin has a rather limited interlayer space and is the least reactive clay because of the general lack of ready ionic substitution, especially in the tetrahedral layer. As a result, kaolin exhibits reduced adsorption capacity. Therefore, adsorption capacity is usually improved by the appropriate physical and/or chemical modifications.
The predominant physical modification method is high heat treatment. This increases the specific surface area and transforms kaolin into a metastable phase. This treatment removes structural water and reorganizes the structural properties of kaolin, retaining some AlO6 octahedra and transforming the remaining into more reactive tetra- and penta-coordination units [8]. Metakaolin has unsaturated coordination, thus vacancies that can be occupied by heavy-metal ions [9]. The optimal thermal activation temperature of kaolin for the effective removal of heavy metal ions ranges from 450 to 1000 °C [10,11,12]. Excessively high temperatures, however, produce mullites with minimal or even no metal adsorption capacity. This is because mullites have a reduced number of activated Al atoms, which are part of the kaolin’s primary adsorption sites [13,14]. Other physical modification methods that produce structural and morphological changes in kaolin include mechanical treatments such as milling and ultrasonication [15,16,17].
Acid treatment is the most common chemical activation method. Acids dissolve mineral impurities, replace exchangeable cations, and cause changes in porosity. According to Korichi et al. [18], the effect of acid activation depends not only on the concentration of the acid but also on the duration and the temperature of activation. However, increasing the acid concentration beyond a certain threshold can cause a decline in the surface area due to excessive leaching and, consequently, a collapse in kaolin’s layered structure [18]. Most experiments involving acid activation of kaolin, according to the literature, were carried out using inorganic acids such as H2SO4 and HCl with concentrations typically ranging from 0.1 to 2 M, and either under ordinary room temperature conditions or at elevated temperatures. In most situations, acid activation resulted in improved heavy metal adsorption (typically 5–30% higher) compared to the unmodified clay due to an increase in pore volume, surface area, and cation exchange capacity [19,20,21,22,23,24,25,26]. However, the use of organic acids produced a somewhat lower adsorption efficiency than similar concentrations of inorganic acids under similar operating conditions [27].
It has also been demonstrated through several studies that alkali activation of kaolin could positively affect its structural properties for the improved adsorption of heavy metals, with the type and concentration of the alkali solution playing a pivotal role, just as in the case of acids [28]. Kaolin reacts with NaOH, the most commonly used base, to form the basic hydroxysodalite tetrahydrate Na8[AlSiO4]6(OH)2·4(H2O), which is characterized by a homogenous microporous texture [29]. Because of the high cost and aggressiveness of conventional alkaline solutions, Shaqour et al. [30] used a mixture of Ca(OH)2 and Na2CO3 as an alternative activator to produce cancrinite-type zeolites. Alkali activation of kaolin to enhance its heavy metal adsorption capacity has often been carried out under hydrothermal conditions [31].
A synergy of mechanical, thermal, and/or chemical activation routes has been observed to produce even better adsorption results than a single standalone route [32]. S. Abdallah [33] combined heating at 600 °C with acid reflux, while Bhattacharyya and Gupta [34] and Bhattacharyya and Gupta [35] combined heating at 773 K with acid activation. Myasnikov et al. [17] combined ultrasonication with alkali activation. David et al. [8] combined heating at 800 °C with alkaline hydrothermal treatment. These combined treatment strategies had a positive effect on the surface area, pore structure, and ion exchangeability and enhanced the conversion of Al6+ into its unsaturated variants, Al4+ and Al5+ [36,37].
Although chemical activation of kaolin, especially using acids and bases, has proven quite effective, the excessive leaching of aluminum or silicon can cause irreversible structural damage, thus potentially compromising long-term mechanical stability. On the contrary, salt activation offers a potentially milder approach yet a significant enhancement in clay functionality. Carbonate salts, despite being commonly used for kaolin activation for heavy metal adsorption [38], can elevate pH and potentially occasion structural dissolution or secondary precipitation. Similarly, polyvalent salts could also prove disadvantageous, especially where mechanistic clarity is relevant [39]. The use of NaCl, therefore, promises not only a simple but also an environmentally benign, stable, and economical means of kaolin activation. It also introduces exchangeable Na+ without significant modification of structure or the introduction of interfering ions. A few studies on kaolin activation using NaCl have already been identified in the literature, but some of these studies do not deal with the direct capture of heavy metals from aqueous solutions. For example, Si [40] activated kaolin with NaCl to maximize the interlayer space and orientation of kaolin. In a more related study, Liu et al. [41] activated kaolin with sodium ions to reduce the eutectic temperature of the aluminosilicate to improve its heavy metal adsorption from waste incinerators. Feng et al. [42] achieved a maximum adsorption capacity of 6.23 mg/g for ammonia nitrogen using sodium-modified kaolin adsorbent. Matlok et al. [43] recorded 0.515 mg/g, 0.562 mg/g, and 0.899 mg/g maximum adsorption capacities for Cu2+, Zn2+, and Cd2+, respectively, using Na-modified kaolin. Most recently, Al-Essa et al. [44] investigated the removal of heavy metals from olive mill wastewater using sodium-activated Jordanian kaolinite, where maximum adsorption capacity was 8.8 mg/g. However, these studies provide no significant insight into the physical and/or chemical mechanisms underpinning heavy metal uptake. Therefore, this study presents the first report on how the structural and chemical effects of NaCl-induced tuning of kaolin ultimately affect kaolin’s capacity to capture heavy metal ions (using Zn2+ as a representative heavy metal) from solution under pH-neutral conditions whilst also probing the possible underlying physical/chemical mechanisms, including ion exchange. Furthermore, no study has explored whether low-frequency ultrasonication can synergistically enhance salt activation by exfoliating kaolin stacks and revealing, in particular, fresh silanol/aluminol sites [45,46]. Ultrasonication, however, has been used in some related studies. For example, Pham et al. [47] used ultrasonication as a means of enhancing the electrokinetic remediation of kaolin contaminated with the three persistent organic pollutants. Others have also used ultrasonication to ensure a more effective dispersion [48,49] and incorporation of functional groups in solid matrices [50]. Bhatti et al. [51] also listed some benefits of ultrasonication, such as improvement in the specific surface area, surface charge density, and particle size reduction (comminution). These properties will ultimately improve heavy metal ion uptake.
Here we demonstrate, for the first time, a benign ultrasound-assisted 0.5 M NaCl activation that records a maximum adsorption capacity of 9.2 mg/g and increases Zn2+ uptake by 13% relative to untreated kaolin while avoiding structural dissolution. Through DLS, XPS, and ICP-OES/IC, we provide direct evidence of (i) aggregate disruption, (ii) inner-sphere complexation, and (iii) a Na+ ↔ Zn2+ ion-exchange pathway.

2. Materials and Methods

Pristine kaolin and NaCl (extra pure, 99%) were purchased from Sigma-Aldrich, Burlington, VT, USA, and deionized (DI) water (resistivity of 15 MΩ cm at 25 °C) was obtained from a Milli-Q purification system (Millipore Corp., Burlington, MA, USA). All chemicals were used without further purification.
To investigate the adsorption efficiency of NaCl-activated kaolin for Zn2+ removal from aqueous solutions, activation and adsorption experiments were performed as follows:
  • Activation of Kaolinite: 20 g of kaolin was introduced into 150 mL NaCl solutions at varying concentrations of 0.5, 1.0, 2.0, and 4.0 M in separate beakers. Each beaker was covered and ultrasonicated at 60 Hz for 2 h at a controlled temperature of 80 °C. The ultrasonicated kaolin samples were then washed several times with deionized water and filtered. The washed clay was oven-dried at 70 °C for 24 h to obtain the activated kaolin. Furthermore, in this bench-scale study, the liquor was not recycled after each activation step. The suspension was rather centrifuged and filtered. The brine was then amply diluted with tap water, giving TDS ≈ 9 g L−1, and discharged safely through a drain line for non-hazardous effluents. The clarified brine was characterized using ICP-OES (Thermo iCAP 7400 Duo, Qtegra ISDS V.2.11, Thermo Fisher Scientific Inc., Waltham, MA, USA; λ = 213.856 nm for Zn; MDLs: Zn 0.003, Al 0.010, Si 0.020 mg L−1) and ion chromatography (Metrohm 930 Compact IC Flex v 4.1, Metrohm, Herisau, Switzerland; MDL 0.115 mg L−1).
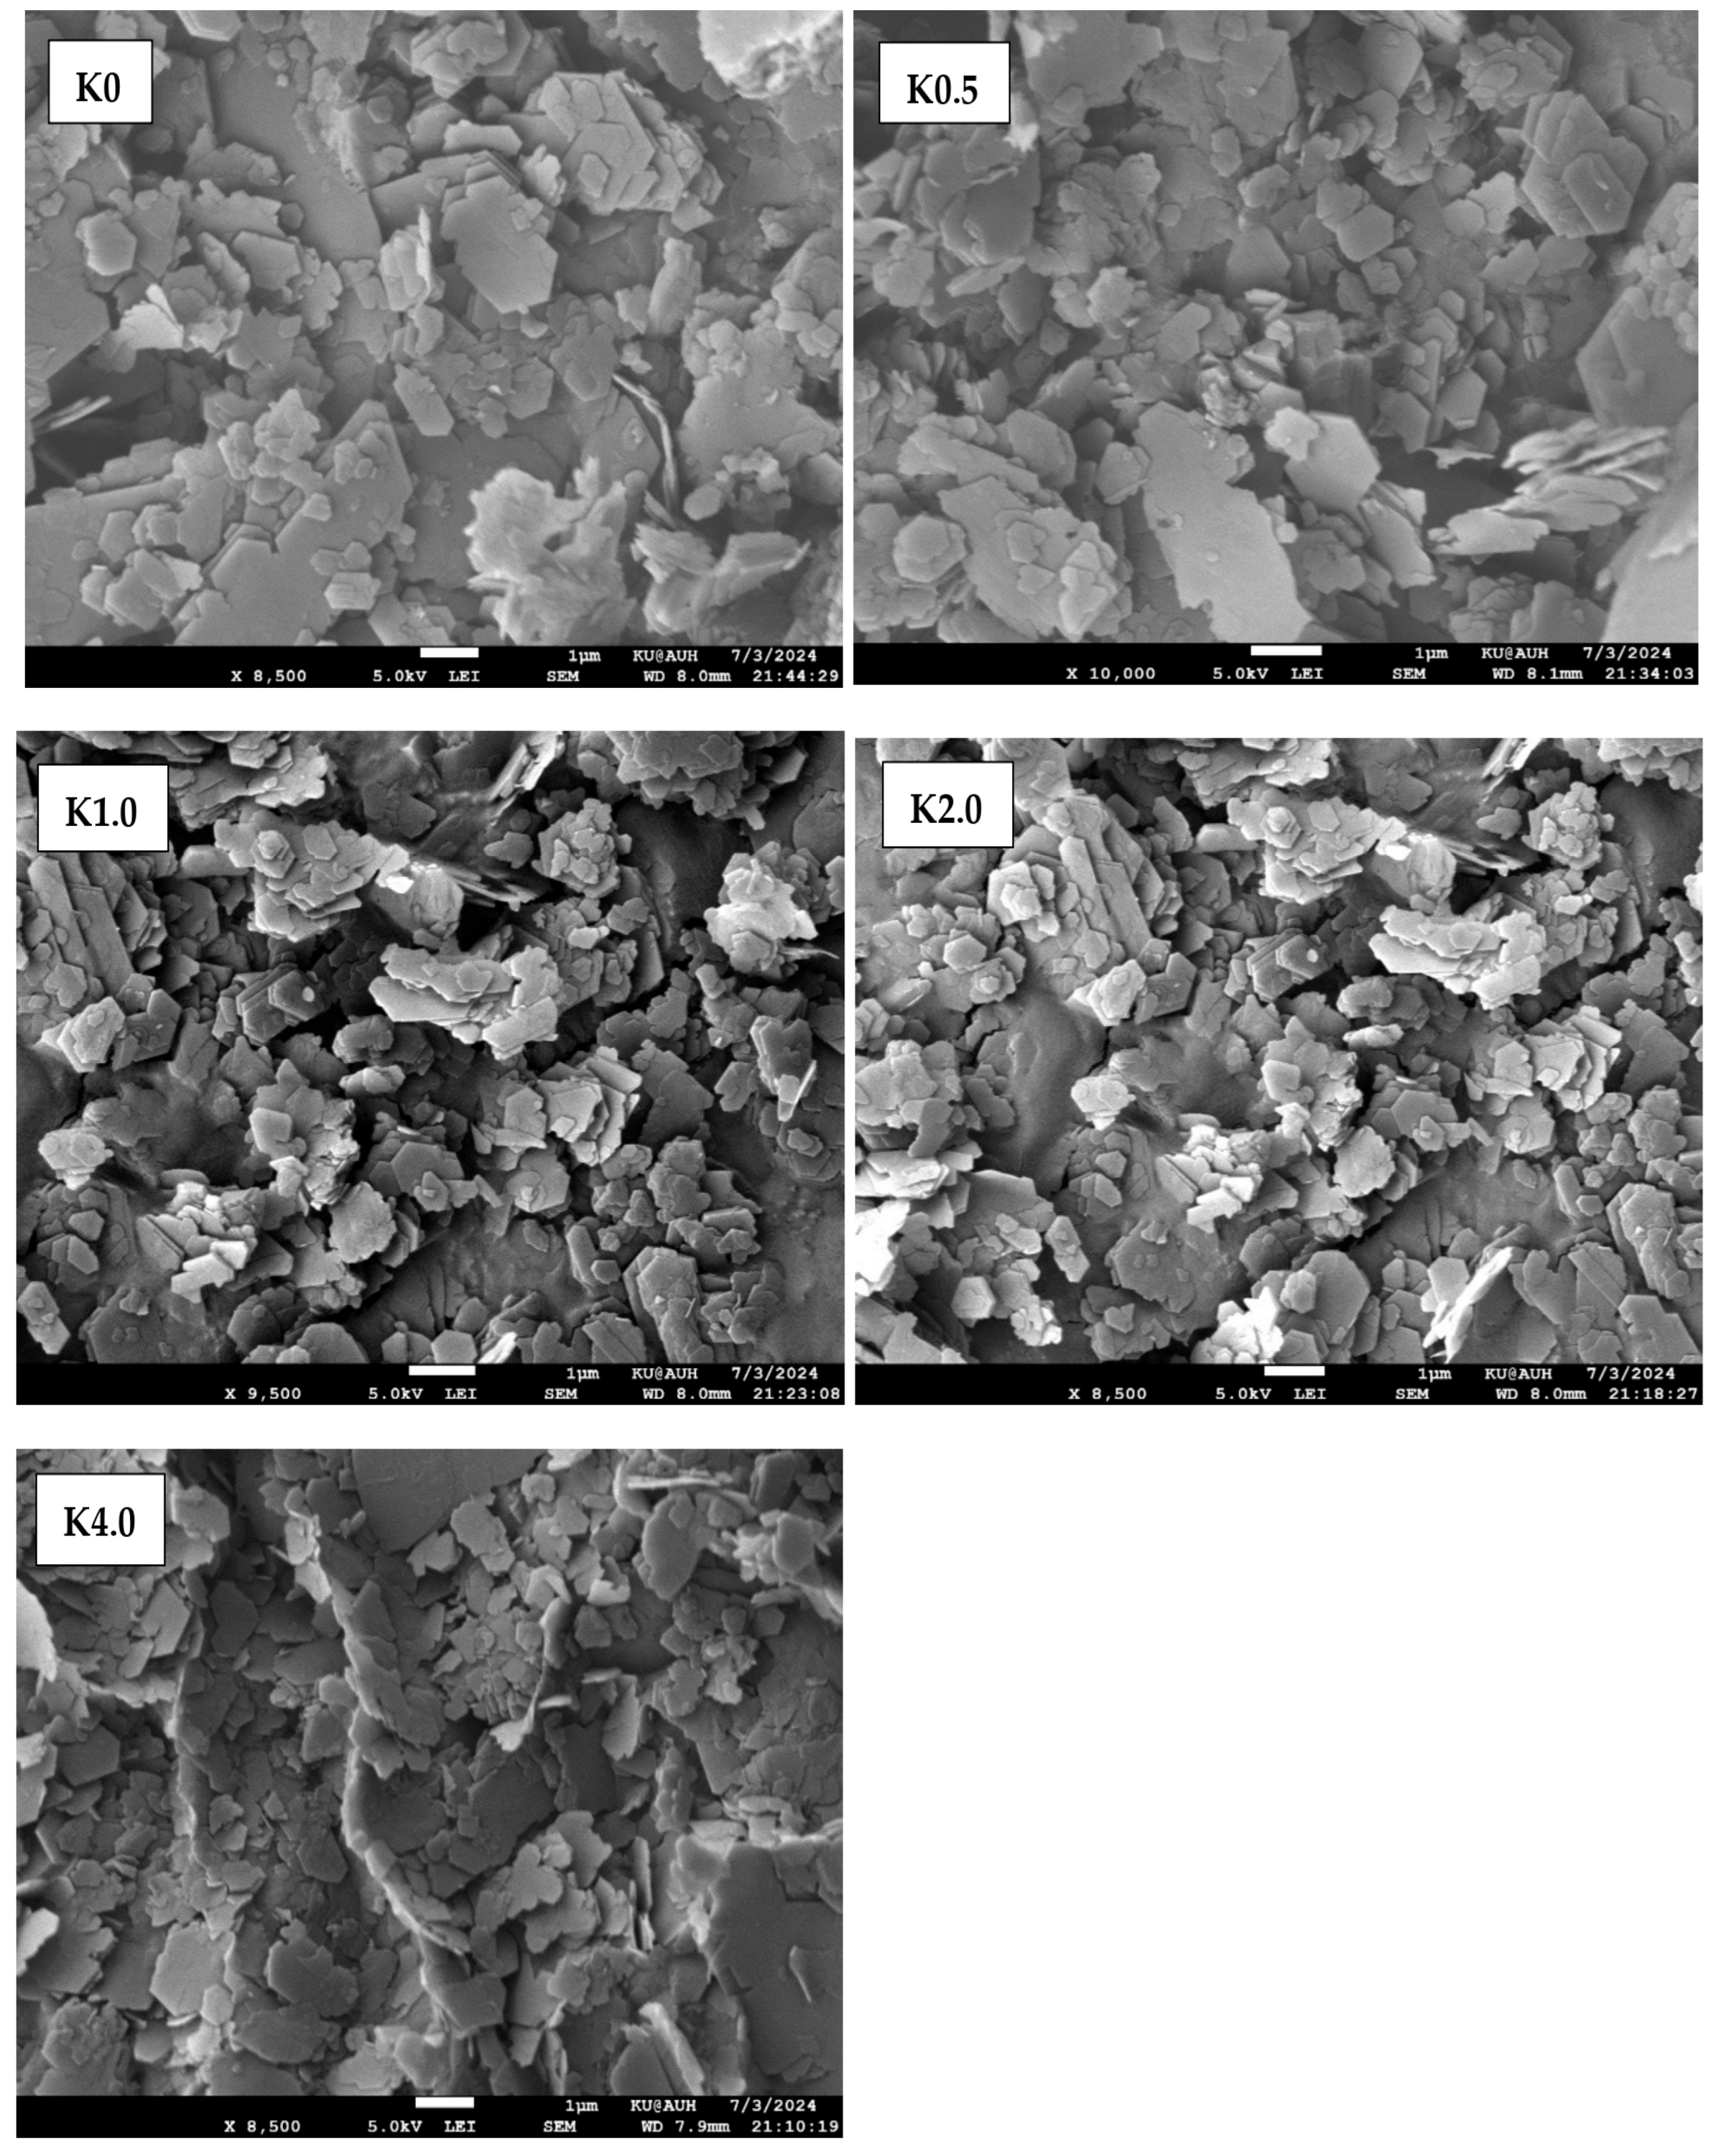
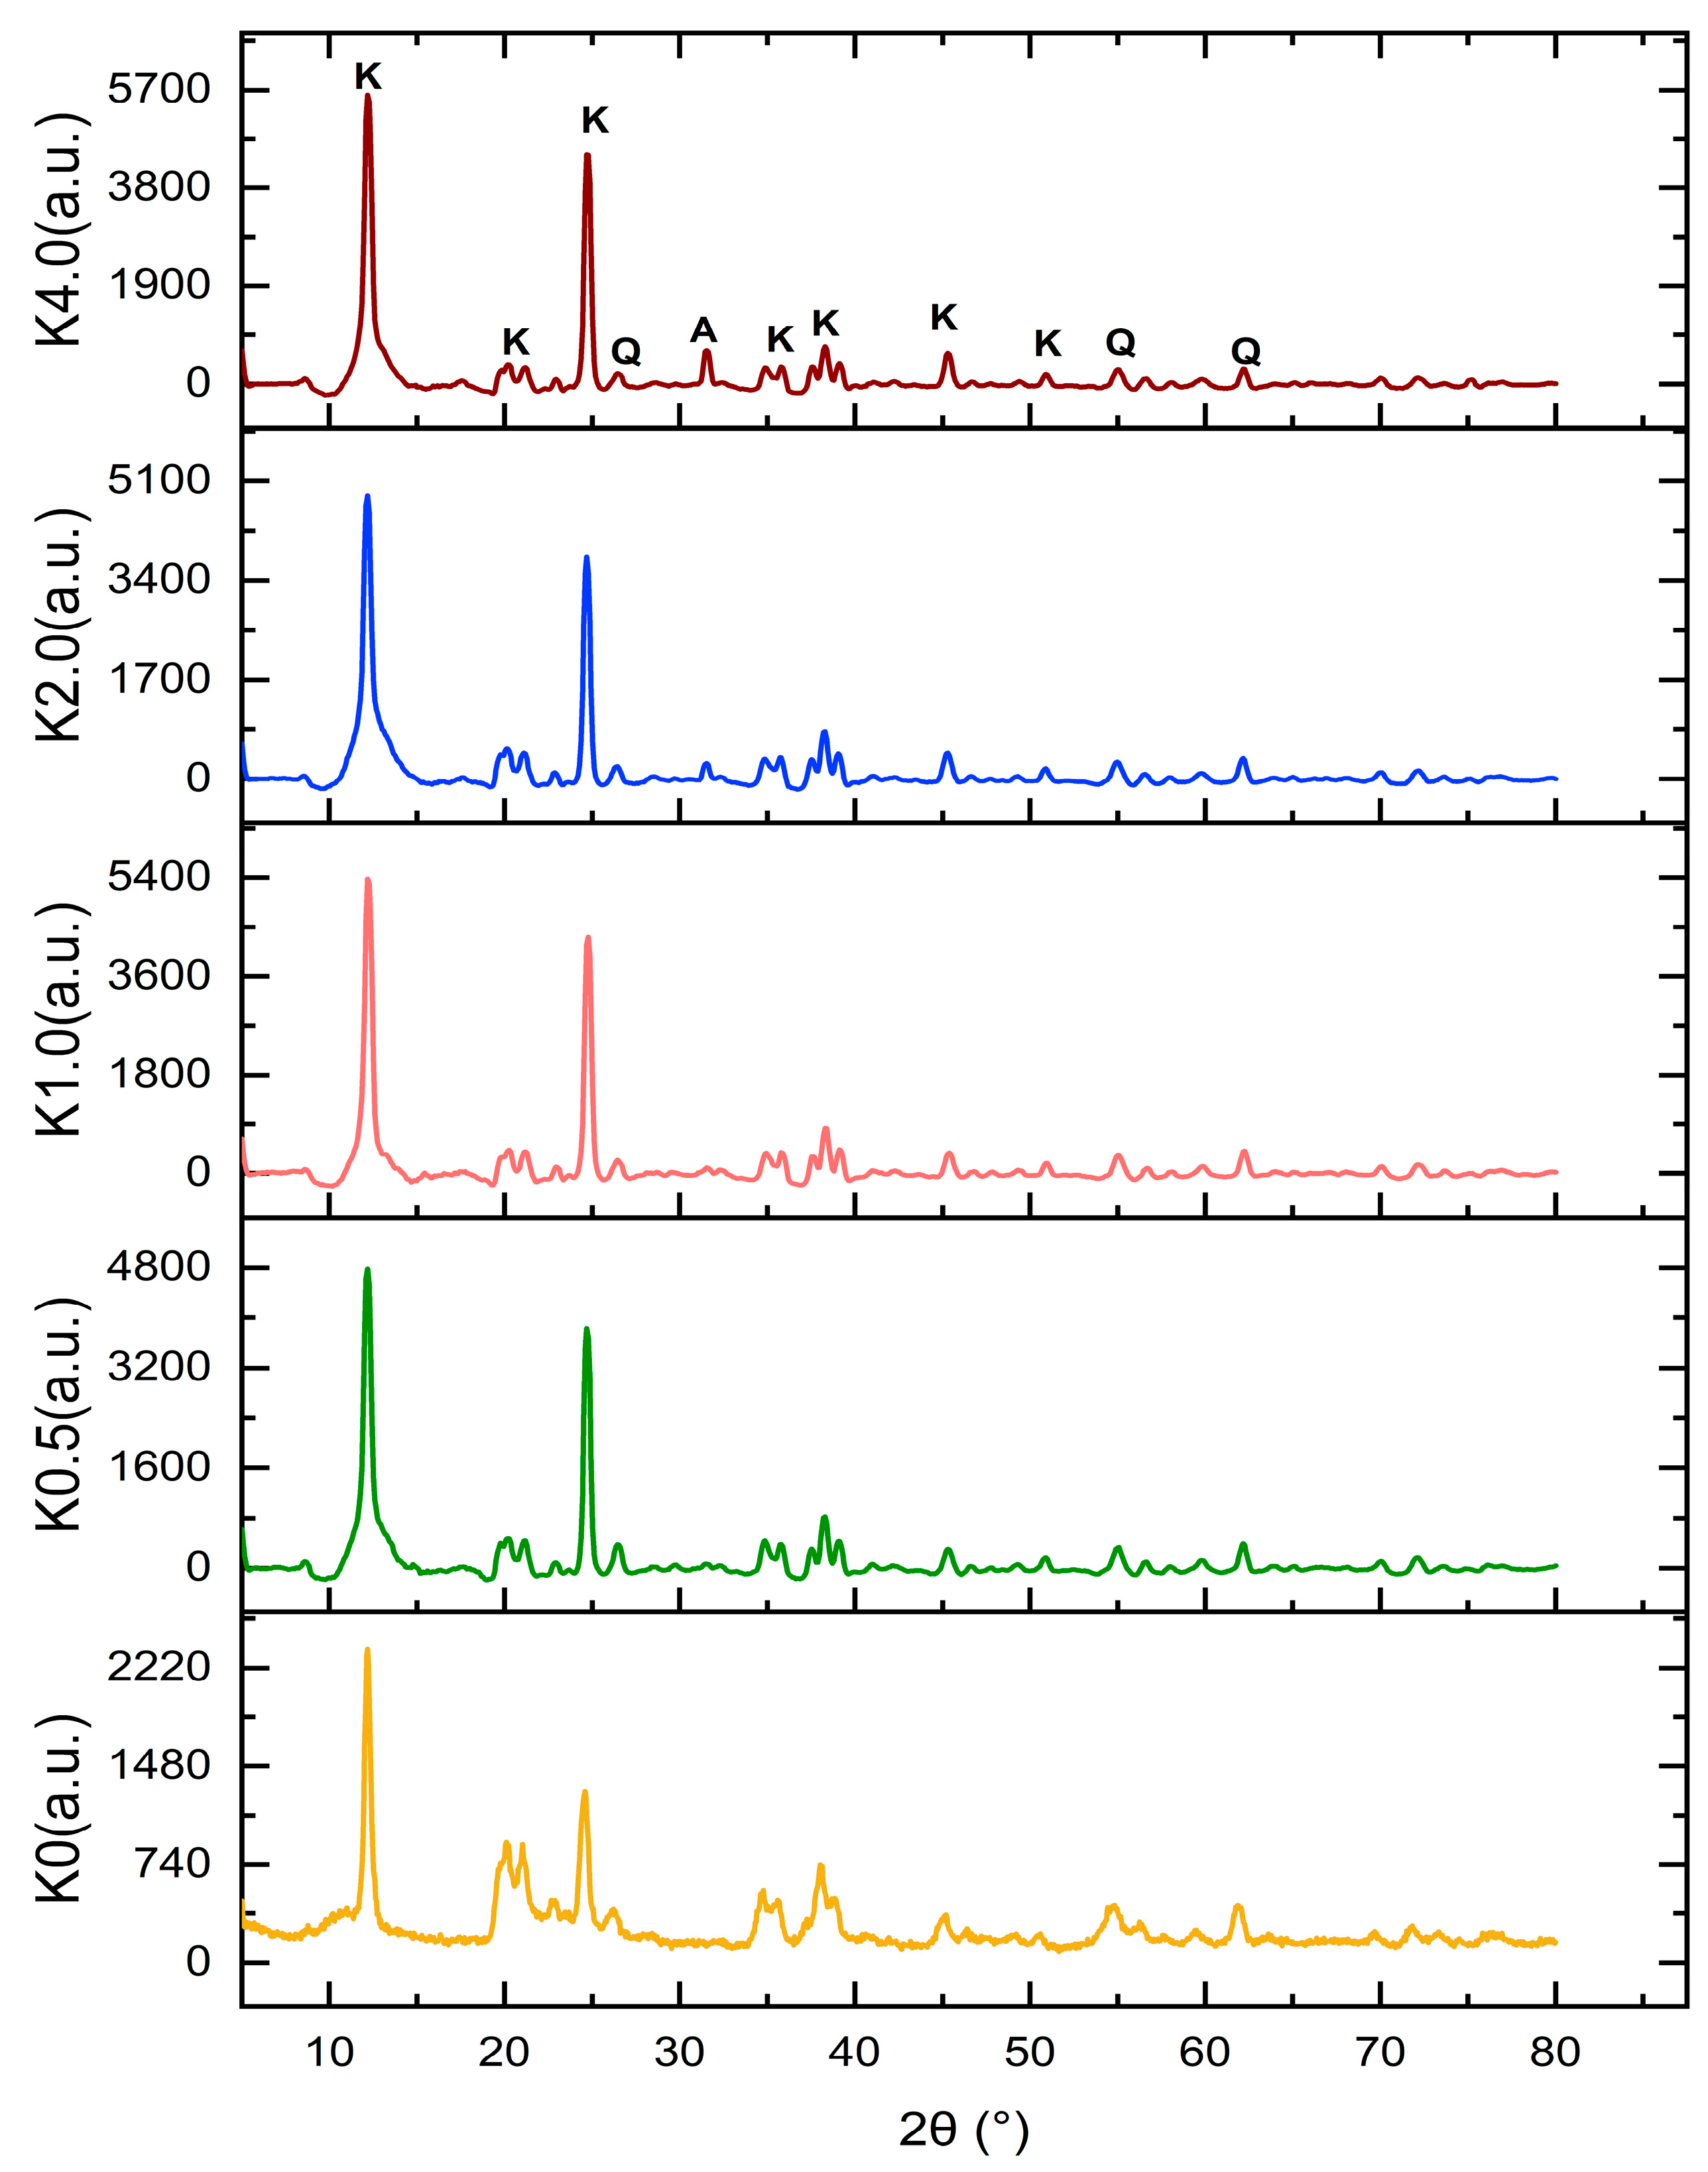
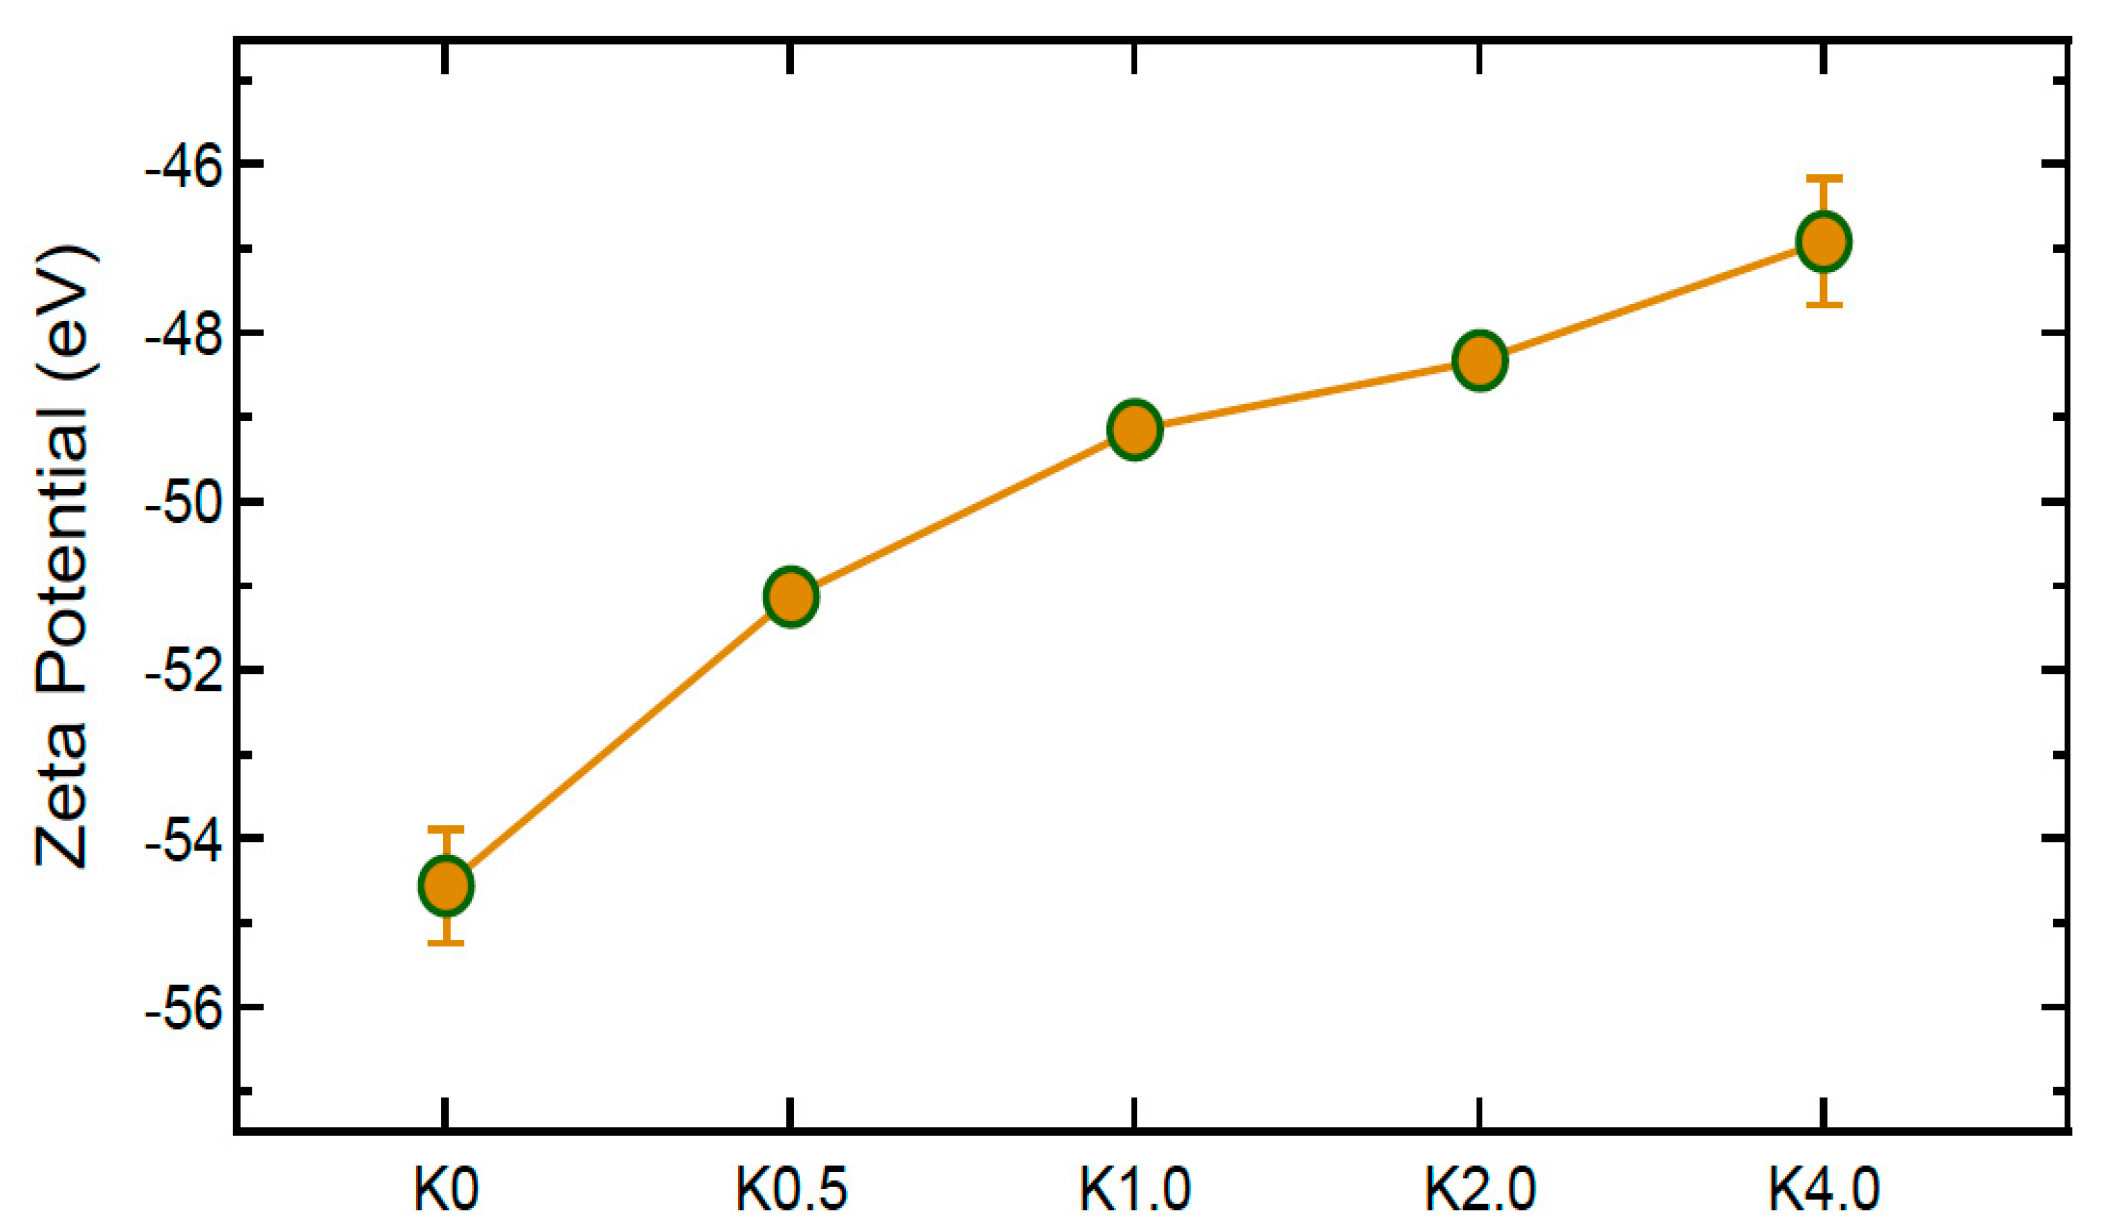
  • Characterization of Activated Kaolin: The physicochemical properties of the NaCl-activated kaolin samples were characterized using a combination of analytical techniques: SEM to analyze morphological changes (using a JEOL JSM-7610F, Tokyo, Japan; with an accelerating voltage of 5.0 kV. The specimen was imaged in secondary electron (SE) mode and under low energy imaging (LEI) function); XRD was used to examine crystallinity and potential phase transformations (Bruker D2 Phaser diffractometer with DIFFRAC.EVA V.6.2, Bruker Corporation, Billerica, MA, USA; operating at 30 kV and 10 mA with a Cu Kα source (λ = 1.5406 Å). The scan was performed, beginning at ~5° 2θ with a 0.083° step size across 900 steps, FTIR for functional group analysis (using a Nicolet iS10 spectrometer, OMNIC Spectra, Thermo Fisher Scientific Inc., Waltham, MA, USA). The spectra were recorded in the range of 4000–400 cm−1 at a resolution of 4 cm−1, with 32 scans averaged per sample); XPS to determine surface elemental composition (using the Escalab Xi+ system, Avantage V.6, Thermo Fisher Scientific Inc., Waltham, MA, USA). The device was equipped with a monochromatic Al Kα source and operating under ultrahigh vacuum of ~10−9 Torr, a spot size of 650 µm, pass energy of 20 to 30 eV, and energy step size of 0.10 eV); Zeta Potential measurements to assess surface charge; and DLS for hydrodynamic particle size distribution analysis (using a Litesizer DLS 500, Kalliope, Anton Paar GmbH, Graz, Austria), with water as the dispersing medium. The cumulant model was applied for size analysis, and the Smoluchowski approximation was applied with automatic voltage adjustment (up to 200 V) and a Henry factor of 1.5 for the zeta potential.
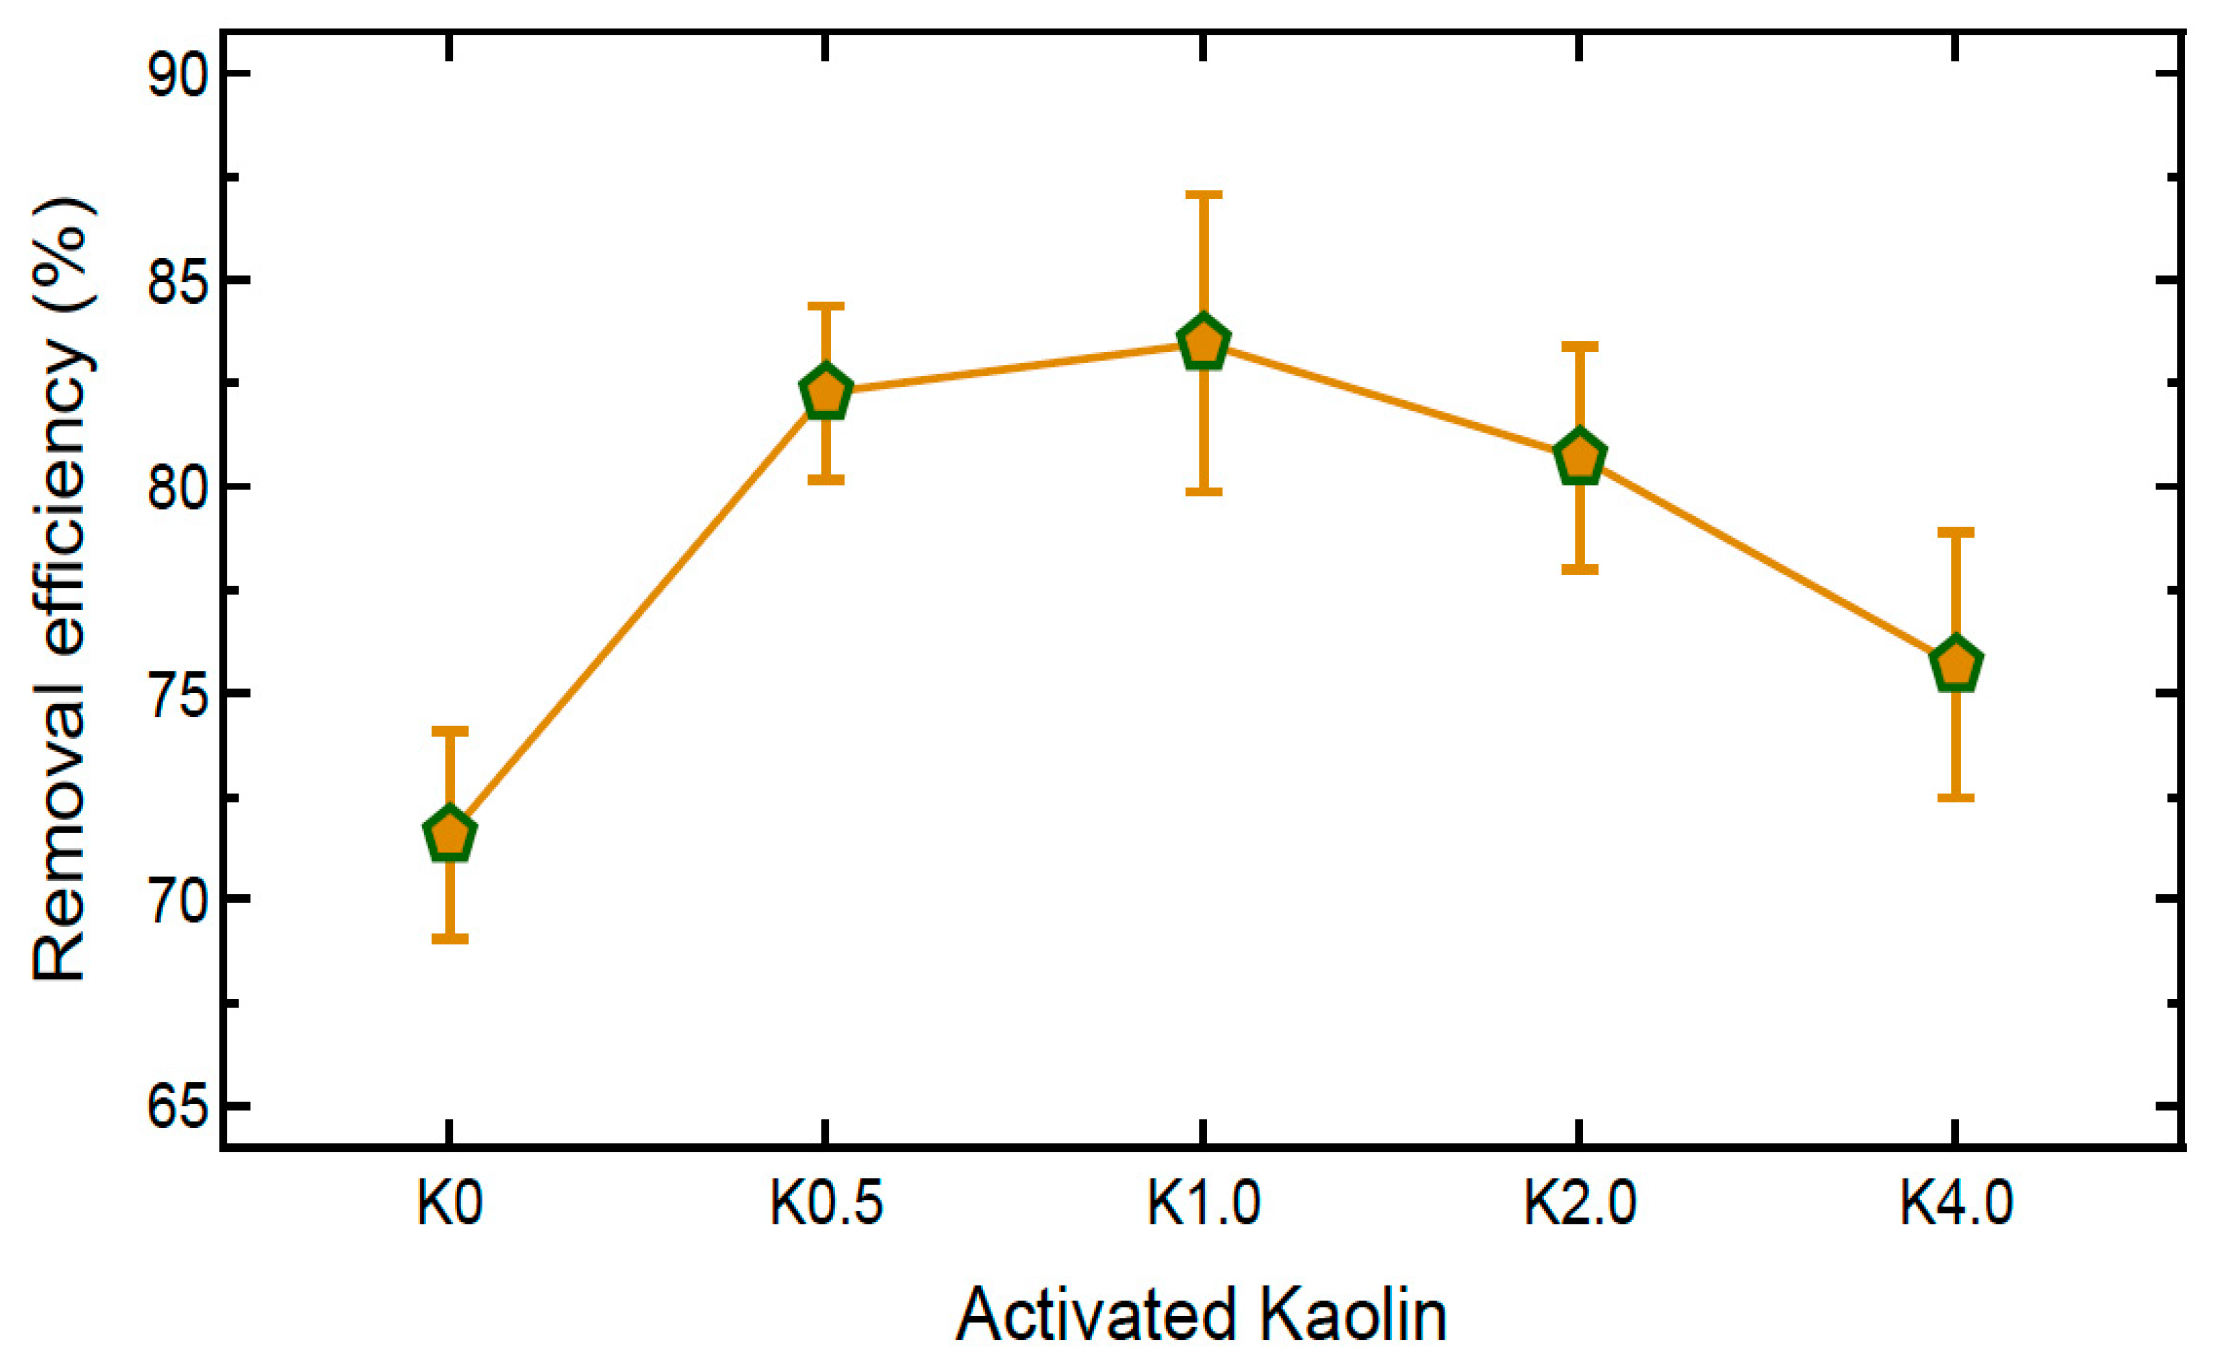
  • Adsorption–Desorption Experiments: For each concentration of NaCl-activated kaolin sample, 0.1 g was added to 20 mL of a Zn(NO3)2 solution (adsorbent dosage from other studies, for example, ranges from 0.5 to 4.0 g/L [42]) with an initial Zn2+ concentration (Co) of 70 mg/L (initial pollutant concentration for such studies typically ranges from 10 to 400 mg/L [42,52]). The mixtures were stirred at 200 rpm for 2 h to allow for equilibrium to be reached. The equilibrium time of about 2 h was determined through preliminary studies. This is in line with many other studies involving kaolin, where equilibrium times were typically between 30 and 120 min [42,53].
    After each adsorption test the slurry was centrifuged (4000 rpm, 10 min, 20 °C), and the supernatant was passed through a 0.22 µm PES syringe filter. Note that 10 mL aliquots were taken, and the concentration of Zn2+ determined using iCAP 7400 Duo, Qtegra ISDS V.2.11, Thermo Fisher Scientific Inc., Waltham, MA, USA; λ = 213.856 nm for Zn; MDLs: Zn 0.003, Al 0.010, Si 0.020 mg L−1). To ensure data accuracy, adsorption experiments were performed in triplicate, and the average Ce was recorded. The Zn2+ removal was calculated as follows:
    %   R e m o v a l = C o C e C o × 100
    The average zeta potential and the hydrodynamic particle size of the spent kaolin were determined and compared with the values recorded before the heavy metal adsorption. The settling behavior of the spent kaolin suspension was also observed.
    For regeneration, spent kaolin (0.10 g) was treated with 20 mL of 0.05 mol L−1 HCl (pH ≈ 1.6) and agitated at 200 rpm and 25 °C for 30 min, which is longer than the 20 min required for desorption equilibrium, providing a safety margin. The dilute acid protonates the surface and displaces Zn2+ from ≡AlO/≡SiO sites; a subsequent 0.1 mol L−1 NaCl rinse restores the clay’s Na+-exchange form. Finally, three washes with 20 mL deionized water return the slurry to pH 6.5 ± 0.1 and remove residual Cl, ensuring the material re-enters the next adsorption cycle under conditions identical to the original test. The percent desorption is calculated as follows:
    D e s o r p t i o n   % = Z n   r e l e a s e d   t o   H C l Z n   a d s o r b e d   i n   p r e c e d i n g   c y c l e × 100 %
  • Leachate Sampling Protocol: The optimal NaCl concentration, determined from the adsorption experiments, was used for the leaching analysis. A series of four batch suspensions (all 20 mL, 25 ± 1 °C, pH 6.5 ± 0.1) were prepared in triplicate: (i) a blank containing only ultrapure water; (ii) a control containing the NaCl-activated kaolin (0.1 g) but with no Zn2+; (iii) an adsorption test in which the same kaolin dose was contacted with 50 mg L−1 Zn2+ for 2 h; and (iv) an identical reactor held for 24 h to analyze additional uptake. After the designated contact time, each slurry was centrifuged (4000 rpm, 10 min), and the supernatant passed through a 0.22 µm PES syringe filter. Zn, Al, and Si were quantified by ICP-OES (Thermo iCAP 7400 Duo, Qtegra ISDS V.2.11, Thermo Fisher Scientific Inc., Waltham, MA, USA; λ = 213.856 nm for Zn; MDLs: Zn 0.003, Al 0.010, Si 0.020 mg L−1). Sodium was measured by ion chromatography (Metrohm 930 Compact IC Flex, Metrohm, Herisau, Switzerland; MDL 0.115 mg L−1). Solution data are reported in mg L−1; solid-phase loadings were obtained from mass balance, i.e., (C0 − Ce) × V divided by the clay mass and expressed as mg g−1 (Zn) or, after blank subtraction, mg g−1 Na+ released. The results of the leachate analysis are presented in Table 1.

3. Modeling and Statistical Analysis

The following studies served as blueprints for the isotherm, kinetic, and thermodynamic analyses: [23,24]. The modeling analysis was performed to obtain the maximum monolayer capacity (qm) and rate constant (k2)—and to benchmark the ultrasound-assisted NaCl treatment against capacities already reported for kaolin. The adsorbent dosage was 0.1 g per 20 mL of the heavy metal ion solution.

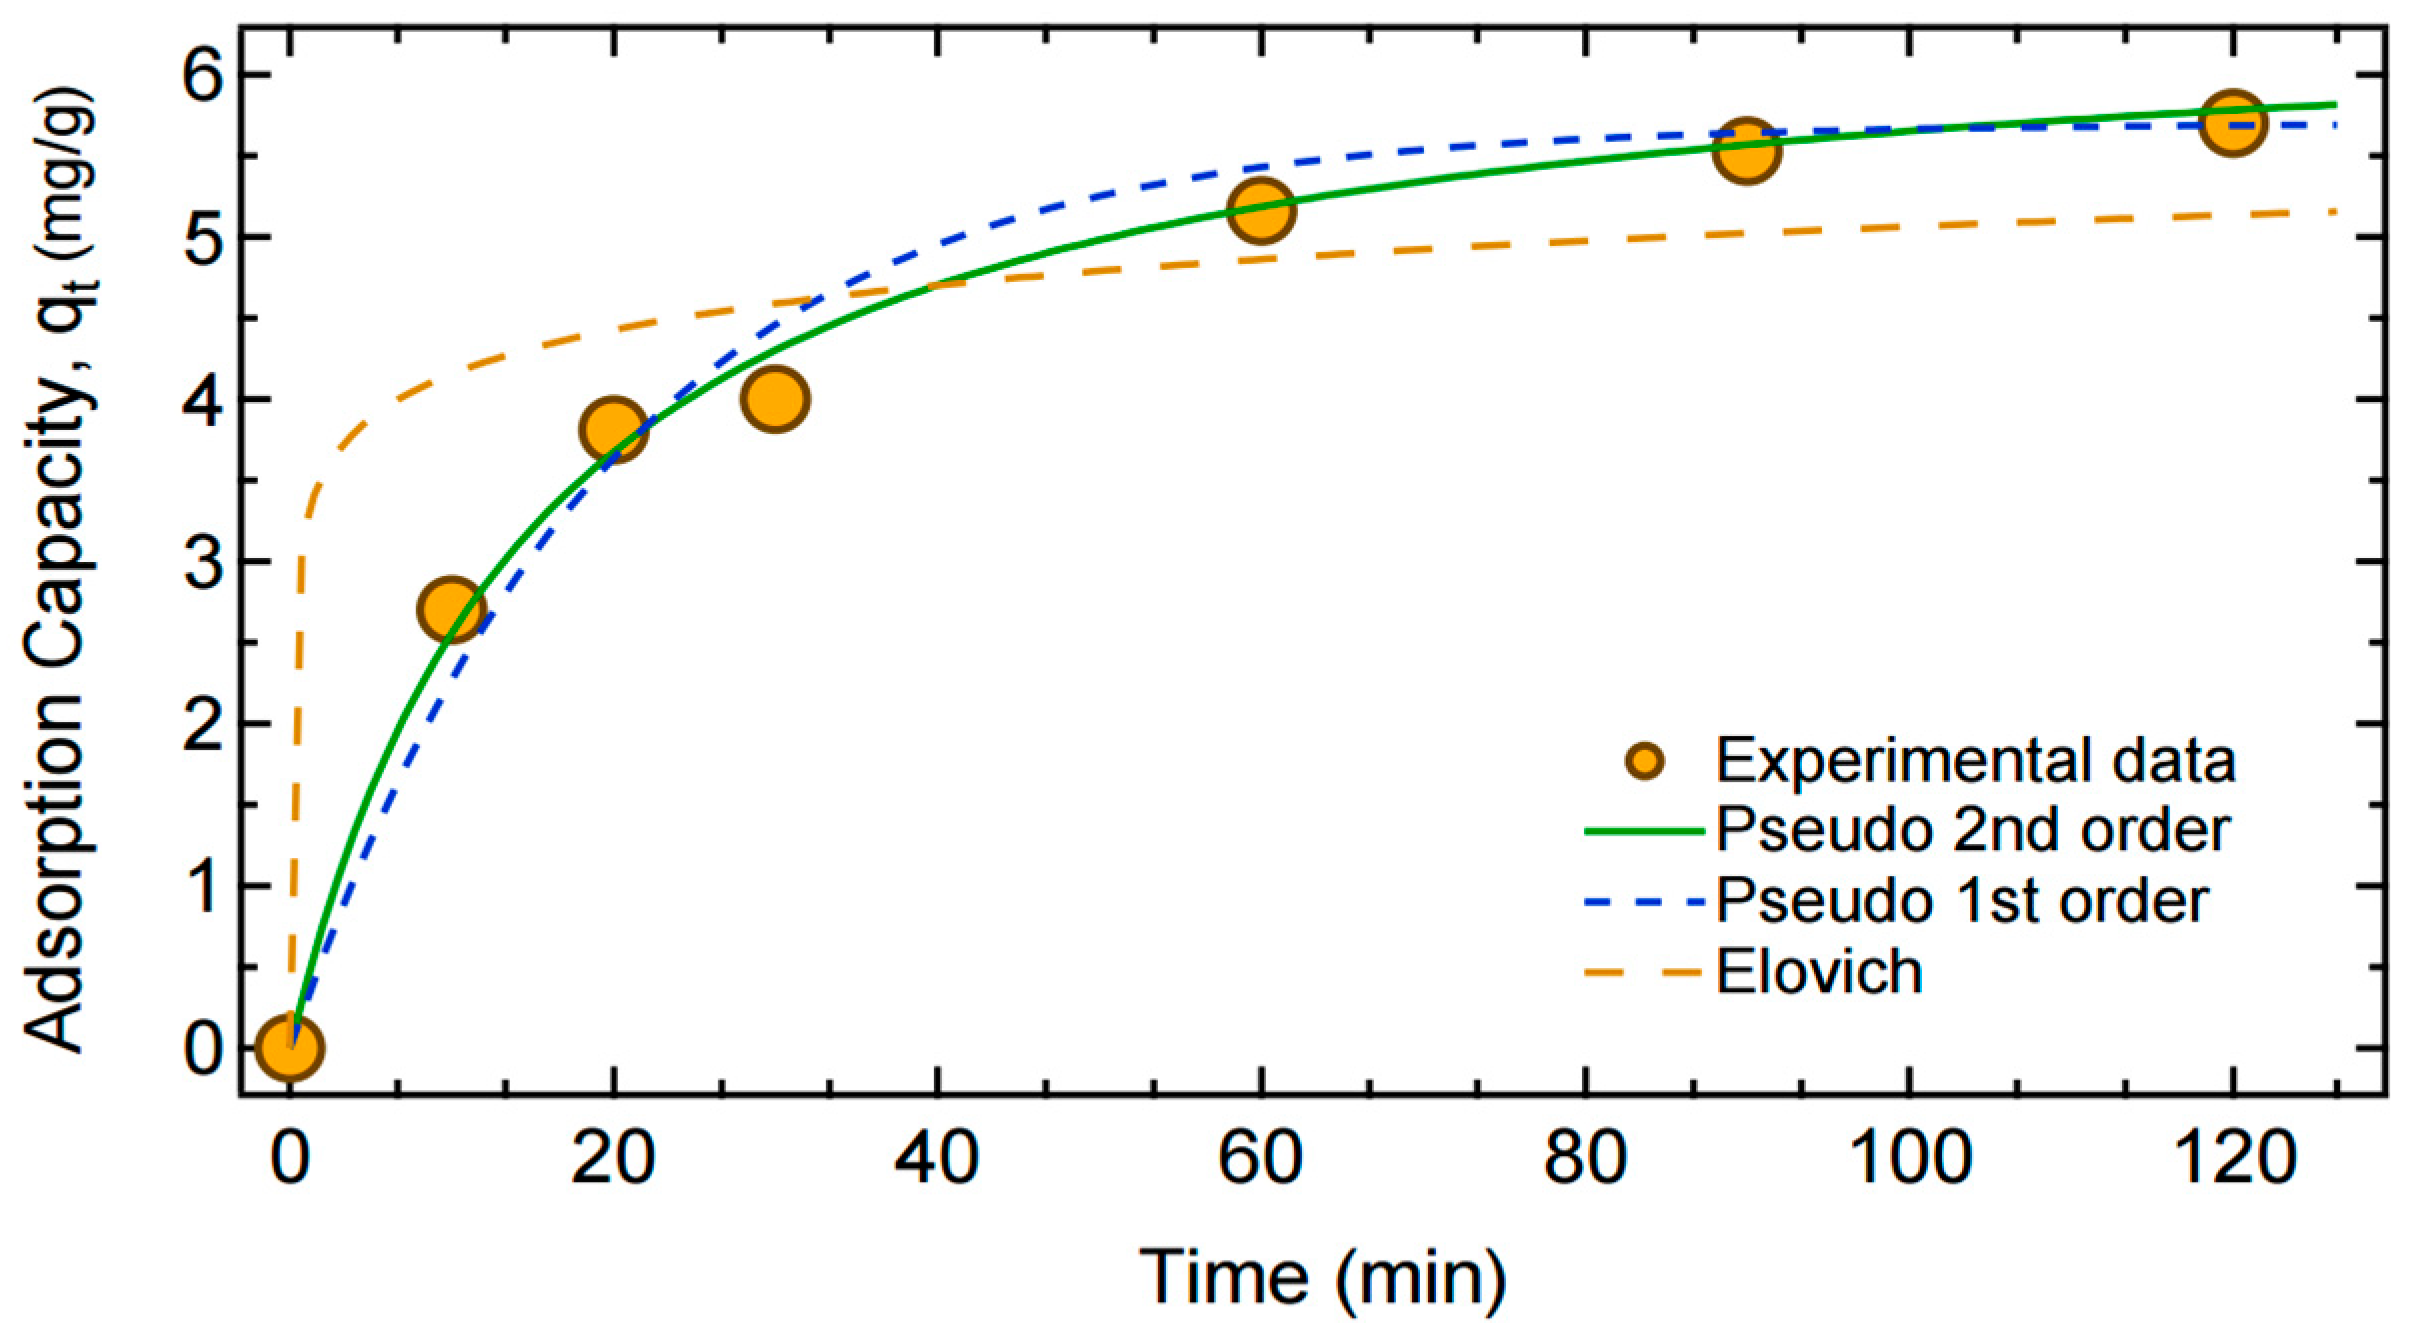
3.1. Kinetic Adsorption Equations

To assess the adsorption rate and mechanism, kinetic studies were performed by sampling the Zn2+ solution at various time intervals (t = 0, 10, 20, 30, 60, 90, 120, 150, and 180 min). The initial concentration of Zn2+ solution used was 50 mg/L. The data were analyzed using the pseudo-first-order, pseudo-second order, and Elovich kinetic models.
Pseudo-first-order kinetic equation:
q t = q e 1 exp   ( k 1 t )
where qt (mg/g) is the adsorption capacity at time t, qe (mg/g) is the equilibrium adsorption capacity, and k1 (min−1) is the pseudo-first-order rate constant. The pseudo-first-order kinetic model [54] was introduced by Lagergren and has been extensively used to model the sorption of metals in solutions [55,56].
Pseudo-second-order kinetic equation:
q t = q e 2 k 2 t 1 + q e k 2 t
where k2 (min−1) is the pseudo-second-order rate constant. The pseudo-second-order model [41] is suitable for describing adsorption processes dominated by chemisorption, where it incorporates the interaction between the adsorbent and adsorbate through valence forces [57].
Elovich kinetic model:
q t   =     1 β ln α     β + 1 β ln t
where α (mg/(g min)) is the initial adsorption rate, and β (g/mg) is the Elovich constant. The Elovich model is also widely used to describe adsorption kinetics, particularly for chemisorption on heterogeneous surfaces [58].

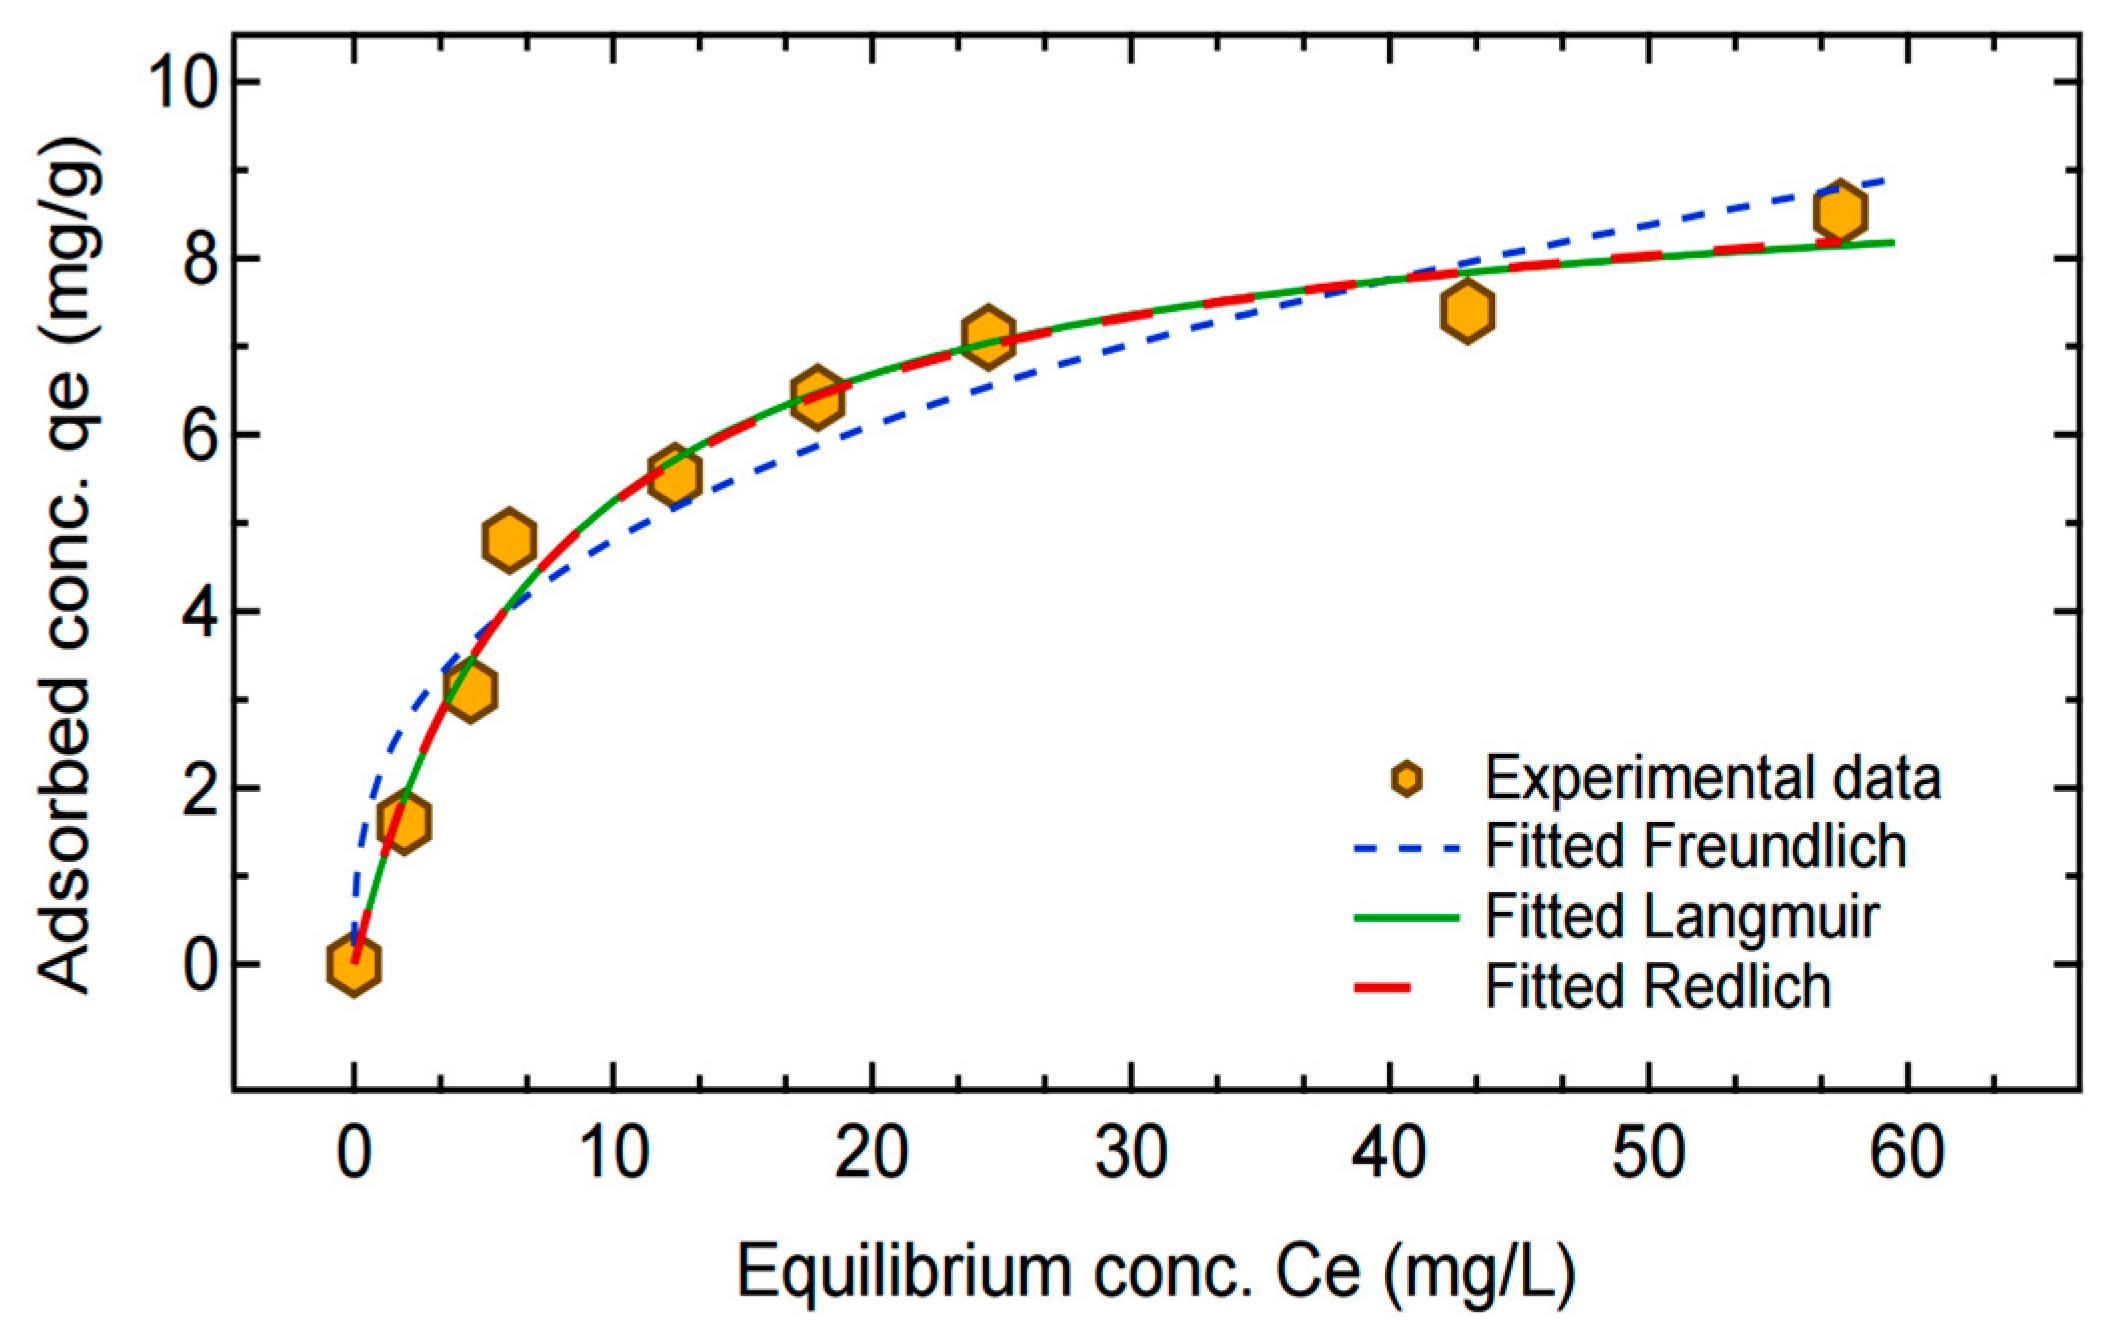
3.2. Adsorption Isotherms

To characterize the adsorption capacity of the optimized NaCl-activated kaolin, adsorption isotherm studies were conducted using a range of initial Zn2+ concentrations (C0 = 10, 20, 30, 40, 50, 60, 80, and 100 mg/L). A time interval t of about 2 h, determined through preliminary studies, was allowed for equilibrium to be reached. The data were then analyzed using Langmuir, Freundlich, and Redlich–Peterson isotherm models [59].
Langmuir isotherm equation:
q e = q m K L C e 1 + K L C e  
where qe (mg/g) is the amount of Zn2+ adsorbed at equilibrium, qm (mg/g) is the maximum adsorption capacity, KL is the Langmuir constant, and Ce (mg/L) is the equilibrium concentration of Zn2+. Langmuir isotherm describes monolayer adsorption on homogenous surfaces.
Freundlich isotherm equation:
q e = K F C e 1 n
where KF (mg/g⋅(L/mg)1/n) and n are Freundlich constants indicating adsorption capacity and intensity, respectively. Freundlich isotherm describes multilayer adsorption on heterogenous surfaces.
Redlich–Peterson:
q e = K R C e 1 +   a R C e β
where K R (L/g) is the isotherm constant, a R (L/mg) is a constant related to the adsorption capacity, and β is an empirical parameter between 0 and 1. Redlich–Peterson model combines features of the Langmuir and Freundlich models.

3.3. Thermodynamic Equations

To evaluate the thermodynamic feasibility of the adsorption process, thermodynamic parameters such as Gibbs free energy (Δ), enthalpy (Δ), and entropy (Δ) were determined. Adsorption experiments were conducted at various temperatures (298, 308, and 318 K) at an initial concentration of 50 mg/L. The equilibrium constant (Kd,eq) was calculated using the ratio of qe to Ce at each temperature. Gibbs free energy was calculated using the following equations [2]:
Δ G o = RT   ln   ( K d , eq )
where R is the universal gas constant (8.314 J/mol·K) and T is the absolute temperature (K). The values of Δ and Δ were determined from the slope and intercept of the van ‘t Hoff plot, which is a plot of ln(Kd) versus 1/T, using the following equation:
l n ( K d ) = Δ S 0 R Δ H 0 R T

3.4. Statistical Analysis and Comparison Between Models

To evaluate the performance of the kinetic and isotherm models, the statistical metrics of sum of square of errors (SSE), coefficient of determination (R2), chi-squared (χ2), Akaike information criterion (AIC), corrected Akaike information criterion (AICc), and Bayesian information criterion (BIC) were calculated. These metrics provide a quantitative assessment of the goodness-of-fit and reliability of the models for describing the experimental data.
The SSE [25] quantifies the overall deviation between the experimental q e x p and predicted q m o d e l adsorption capacity:
S S E = i = 1 n ( q e x p , i q m o d e l , i ) 2
The R2 [60] indicates the proportion of variance in the experimental data:
R 2 = 1 i = 1 n ( q e x p , i q m o d e l , i ) 2 i = 1 n ( q e x p , i q ¯ e x p ) 2
where q ¯ e x p is the mean value of the experimental adsorption capacities.
The χ2 [25] evaluates the discrepancy between the experimental and predicted values relative to the model predictions.
x 2 = i = 1 n ( q e x p , i q m o d e l , i ) 2 q m o d e l , i
The AIC [61] helps compare statistical models by balancing the goodness of fit and complexity and penalizing models with excessive parameters. AIC is expressed as follows:
A I C = 2 k ^ 2 ln L ^
where L ^ is the maximized value of the likelihood function for the model and k ^ is the number of independently adjusted parameters. For small sample sizes, the AICc [62] addresses the biases in AIC, which can underestimate information loss:
A I C c = A I C + 2 k ^ 2 + 2 k ^ n ^ k ^ + 1
where n ^ is the sample size, k ^ is the number of independently adjusted parameters. Similar to the AIC and AICc, the BIC [63], which applies a stronger penalty for model complexity, is expressed as follows:
B I C = k ^ ln n ^ ln L ^
where n ^ is the sample size, L ^ is the maximized value of the likelihood function of the model, and k is the number of fitted parameters.
When selecting models, lower error values are generally preferred. These selection criteria balance the trade-off between model complexity and goodness of fit, ensuring that the most appropriate model is chosen for the data.

4. Results and Discussion

4.1. Activation Liquor Analysis

Apart from a small decrease in Na+ (4.00 → 3.97 mol L−1, –0.8 %), the liquor contained only trace exchangeable cations K+ ≈ 1.3 mM, Ca2+ ≈ 0.9 mM, Mg2+ ≈ 0.6 mM, and Al and Si were below 0.05 mg L−1, confirming negligible framework dissolution. Thus, in future experiments, the liquor could be reused, either by topping up with salt or diluting with DI water to obtain the required concentration for the activation batches.

4.2. Characterization

4.2.1. SEM

Figure 1 shows the pristine kaolin particles, relatively uniform with characteristic hexagonal plate-like structures. The particle size distribution appeared largely consistent, with sharp and well-defined edges. There was no evidence of significant interparticle interactions or agglomeration. Visible basal planes indicated a lack of significant disruption in the natural structure of kaolin. However, as the NaCl concentration increased, the sharpness of the edges decreased, although the particles still generally retained their plate-like structure. As the concentration of NaCl increased, especially to 2 M and 4 M, the changes became somewhat more noticeable, with a moderate degree of agglomeration and, thus, a noticeable reduction in the distinction between individual particles.

4.2.2. FTIR

Figure 2 shows the FTIR spectra, covering a wavenumber range from approximately 400 cm−1 to 4000 cm−1, and displaying the characteristic absorption bands of kaolin. The O-H stretching band was strong and well-defined between 3700 and 3500 cm−1. The Si-O stretching vibrations were equally prominent around 1000 cm−1. The Al-OH bending vibrations were observed in the region around 900–700 cm−1 [64]. The bands remained relatively stable across all NaCl concentrations, and while this suggests that the inherent chemical structure of kaolin was not significantly altered by the NaCl activation, it could also have been that if any alterations occurred at all, they probably were too subtle to be distinctly captured by the FTIR. This ensured that the intrinsic affinity of kaolin for cations was maintained, while the physical modifications caused by the NaCl activation and ultrasonication improved the adsorption efficiency of the kaolin.

4.2.3. XRD

The XRD pattern (Figure 3) of untreated kaolin (K0), serving as the baseline, shows the most prominent peaks at 2θ angles of 12° and 25°, corresponding to the (001) and (002) crystallographic basal planes. These selective planes have been used in previous experiments to identify kaolinite. Other significant peaks of kaolin were identified, but with decreased intensity, at 20°, 35.1°, and 38.3°, which correspond to reflections from the prism planes (110), (130), and (−202) [65]. Humps occurring at 2θ of 19.8–21.9°, 35.0–36.0°, and 37.8–39.2° are also characteristic of kaolin. Diffraction peaks corresponding to alunite and quartz impurities were also detected [66,67]. Even though the incorporation of NaCl showed a visible increase in the peak intensity, this variation remained almost constant at the various NaCl concentrations. The improvement in peak intensity could be a result of the reduction in defects in the crystal lattice of kaolinite [68] or selective ion exchange, where Na+ ions replaced other exchangeable cations in the kaolin structure, influencing the preferred orientation of the crystallites [69].
The spectrum also shows peak broadening upon the incorporation of Na+. However, the extent of the broadening was indistinguishable at varying concentrations of the NaCl activator. Peak broadening suggests a smaller crystallite size (which is in line with the Scherrer equation, where the Full Width at Half Maximum (FWHM) and crystallite size are inversely proportional) or a distortion in the kaolinite lattice structure. While this may not necessarily indicate particle fragmentation, it suggests that NaCl, in synergy with ultrasonication, introduced microstructural changes, potentially creating more defects or reactive sites for heavy metal ions to bind to.

4.2.4. Zeta Potential

Figure 4 shows a decrease in zeta potential as the NaCl concentration increased. The adsorption of Na+ onto the surface of kaolin neutralizes the negative charges on the kaolin surface [70]. While the inherent negative charge of kaolin favorably attracts positive ions, the presence of a strongly negative zeta potential could prove counterproductive, potentially creating what could be too strong a repulsive force between adsorbent particles, thus limiting how closely the heavy metal ions are attracted towards the kaolin’s surface. The strong repulsion is caused by the strong electrical double layer around each negative kaolin particle. Therefore, the NaCl activation potentially moderates the zeta potential and creates a somewhat balanced electrostatic environment around the kaolin particles where heavy metals can more freely approach without experiencing excessive interparticle repulsion. While the explanation might seem counterintuitive, reduced repulsion and favorable accessibility align with the established colloidal behavior and electrostatic principles, as described by the Stern and Gouy–Chapman models [71].

4.2.5. Hydrodynamic Particle Size

Figure 5 shows that the particle size decreased significantly from 1.09 µm at 0 M NaCl to around 0.74 µm at 0.5 M NaCl. The further decrease in average hydrodynamic particle sizes at higher NaCl concentrations may primarily be due to variability rather than a substantial particle size difference, considering the overlap of the confidence intervals. The hydrodynamic size, measured by DLS, represents an “apparent” particle size that includes both the particle and its associated electrical double layer. By reducing the zeta potential and compressing the double layer, the measured effective hydrodynamic size may become smaller.
The reduction in hydrodynamic particle size, which is somewhat contrary to the agglomeration observed in the SEM, suggests that the NaCl activation process may have altered the kaolinite surface in a way that improved its dispersibility in solution. This change could have caused an increase in the effective surface area for adsorption. In addition, the agglomeration observed in SEM at a larger scale may not be truly reflective of particle size, as particles in a dry state are influenced by attractive forces such as van der Waals forces that can cause physical clumping of particles, which might not be fully dispersed as they would in a liquid suspension. The reduced particle size and the resulting increase in surface area might have facilitated access to reactive sites on the clay, thus promoting adsorption.
The presence of Na+, as confirmed by XPS analysis, could have partially disrupted the electrostatic balance or potentially caused disruptions within the crystallite lattice. This could have facilitated particle breakdown and allowed mechanical forces, in this case ultrasonic forces, to act more actively, potentially resulting in somewhat smaller, broken, and rugged-edged particles, as shown in the SEM images.

4.2.6. XPS

Figure 6 shows Al 2p, Si 2p, and O 1s peaks of the pristine kaolin at binding energies of 531.5 eV, 102.45 eV, and 74.3 eV, respectively. The 531.5 eV matches Al3+ in octahedral coordination within the kaolinite structure, whilst 102.45 eV and 74.3 eV respectively correspond to Si+4 in the SiO2 framework of kaolin and O2- from the Si-O-Si and Si-O-Al bonds of kaolin [64]. After modification with NaCl (see Figure 7), the Al 2p peak, at a binding energy of approximately 74–76 eV, displayed a slight asymmetry, where several minor humps suggest potential subpeaks or secondary chemical states. The Si 2p peak for the modified kaolin was characterized by a peak broadening at 102–105 eV. This may be related to unresolved spin–orbit components or slightly different chemical environments due to a partial substitution of Si in Si-O-Si and Si-OH. For both the modified and unmodified kaolin, the O 1s peaks remained narrow and almost symmetrical. This indicates that the chemical state of oxygen in kaolin remained relatively stable or was not significantly affected by the NaCl activation. The XPS scan also reveals the successful incorporation of Na+ (with a maximum peak at approximately 1072 eV, which is consistent with Na in the +1-oxidation state) on the kaolinite surface. The asymmetry and moderate noise observed in the Na 1s peak suggest the existence of multiple surface environments. The existence of Cl, which was likely adsorbed on the kaolin surface following NaCl activation, was confirmed by the Cl 2p peak, detected around 198–200 eV. The broad and noisy signal indicates that the surface adsorption of Cl was weak. It should also be noted that Cl could be present in the form of electrostatically bound anions on positively charged sites created by the Na+ adsorption.

4.3. Heavy Metal Uptake

Figure 8 shows the adsorption performance of NaCl-modified kaolin, indicating that the removal efficiency of Zn2+ improved significantly from 72% (K0) to approximately 84% (K1.0) and then subsequently declined to approximately 76% at K4.0. The improvement in heavy metal ion removal efficiency, especially from K0 to K1.0, corresponded to a steady reduction in zeta potential from −55 eV to −49 eV and also a reduction in hydrodynamic particle size from 1.1 µm to 0.7 µm.
Beyond 1.0 M NaCl, however, the adsorption capacity reduced to approximately 81% for K2.0 and further down to 76% for K4.0. This trend suggests an optimal concentration range for NaCl activation, where further increases in the NaCl concentration may have led to a somewhat unfavorable electrostatic environment, particle agglomeration, or surface saturation. Since there was no significant difference between the removal performances of K0.5 and K1.0, especially considering the margin of error, K0.5 was selected as the optimal performance for further adsorption studies.

4.4. Post-Adsorption Analysis

Adsorption of Zn2+ by the activated kaolin was confirmed through XPS. Figure 9 shows the new chemical environments of all the elements post adsorption. In particular, the Zn 2p deconvolution reveals four distinct peaks and two distinct Zn2+ adsorption environments: (i) a Zn 2p3/2 peak at 1021.8 eV and its spin–orbit partner Zn 2p1/2 at 1043.9 eV are associated with Zn2+ in Zn-O coordination environments, confirming inner sphere binding to aluminol or silanol sites [72]. The absence of high binding energy contribution rules out the presence of metallic zinc, ZnAl2O4, or Zn(OH)2/ZnO precipitation. A weak shoulder at ~1023 eV is ~0.5 eV higher than the 1022.5 ± 0.2 eV, which is reported for crystalline ZnCl2 [73]. Also, the absence of a corresponding 2p12 high-BE feature and the very low Cl 2p signal rule out the presence of residual ZnCl2. Instead, the weak shoulder is more likely suggestive of Zn bound in Zn–Al layered double hydroxide. After Zn2+ sorption, the Al 2p and Si 2p peak intensities decrease while the binding energies remain generally unchanged. The intensity drop reflects partial masking of the aluminosilicate surface by a Zn-rich overlayer rather than lattice dissolution. The XPS also provides strong evidence of Na+–Zn2+ ion exchange, as evident in the reduction of Na+ peak intensities (see peak intensities before and after zinc adsorption, Figure 9). A further confirmation, through solution-phase analyses, was that Na+ concentration triples in the presence of Zn2+, confirming the release of exchangeable Na+ sites (see Table 1). Desorption efficiencies exceeded 90% for the first three cycles and remained 78% at cycle 5 (Table 2), while the working capacity declined by only 14%. Al and Si concentrations of <0.05 mg/L in the leachate suggest negligible framework dissolution.
Although direct measurements of pore size or porosity were not conducted, possible inferences could be drawn based on indirect experimental observations. Notably, the reduction in zeta potential and the significant decrease in the hydrodynamic particle size suggest modified inter-particle interactions, either forming or exposing additional pathways in the kaolin matrix. The enhanced adsorption efficiency for Zn2+ which is consistent with greater surface accessibility, is an outcome that could be explained by increased “effective porosity,” either through inter-particle voids or the opening of edge sites.
During adsorption, the strongly negative zeta potential (≈−55 mV) keeps the slurry dispersed, maximizing contact between Zn2+ and exchange sites. After adsorption, ion exchange and inner-sphere complexation neutralize surface charge (≈−22 mV) and promote inter-particle bridging, causing rapid self-flocculation. The exhausted sorbent can therefore be removed by simple gravity clarification, requiring no external coagulant unless sub-minute separation is desired. Figure 10 shows the effect of the Zn adsorption on adsorbent settleability.

4.5. Adsorption Kinetics, Isotherms, and Thermodynamic Studies

Statistical analysis and curve fitting were performed using ColloidFit V.1.3 [74] and MATLAB R2021a in order to model the adsorption behavior of the activated kaolin. Using these tools, the experimental data was fitted to isotherms and kinetic models. Model performance was evaluated and fitting parameters along with the related statistics were extracted. Table 3 summarizes the results of the isotherm and kinetic studies, including goodness-of-fit metrics such as R2, SSE, and χ2, and information criteria such as AIC, AICc, and BIC.
Figure 11 illustrates the adsorption kinetics of Zn2+ on kaolin. In evaluating adsorption kinetics, the pseudo-first-order, pseudo-second order, and Elovich models offered distinct and complementary insights into the mechanism and rate of adsorption. The pseudo-first order and the pseudo-second-order models depicted a rapid initial adsorption, as demonstrated by the steep increase in qt within the first 30 min. This behavior indicated a high initial interaction or affinity between kaolin and Zn2+ because of the high availability of active sites on the kaolin surface. However, the pseudo-first-order model, although moderately agreeing with the experimental data (with a rate constant k1 = 0.0508 ± 0.006 min−1 and R2 = 0.905), appeared to deviate slightly (SSE = 0.697 and χ2 = 0.185), especially at higher time points, suggesting that the adsorption mechanism may not have been fully captured as equilibrium was approached. In effect, the model underestimated the adsorption capacity (qe = 5.699 ± 0.19 mg/g) compared to the pseudo-second-order model (qe = 6.529 ± 0.23 mg/g). The pseudo-second-order model, with rate constant k2 = 0.0094 min−1, SSE = 0.184, chi2 = 0.043, and R2 = 0.993, matched the data most closely. The pseudo-second-order model also produced the best information criteria (AIC = −26.177, AICc = −23.777, BIC = −26.018), showing the strongest fit with minimal complexity penalties. This suggests that chemisorption, rather than physisorption, was likely the dominant adsorption mechanism.
In contrast, the Elovich model gave the lowest R2 of 0.8438 and the highest SSE of 4.483. Thus, it less accurately represented the data and the underlying adsorption mechanism. Despite its poor fit, the Elovich model did not only provide a comparative framework to assess alternative adsorption mechanisms but also emphasized that chemisorption processes could vary based on the adsorption dynamics. The discrepancy between the pseudo-second order and Elovich models, both of which are chemisorption-based, suggests that the fundamental assumptions of the Elovich model of surface heterogeneity and exponential decay in adsorption rates did not reflect the experimental conditions. The pseudo-second-order kinetic model, as established in this work, aligns with the majority of similar studies conducted earlier [25,26,53].
Figure 12 shows the fitted Langmuir, Freundlich, and Redlich–Peterson. It is evident that although all three models provided a very good fit for the experimental data, the Langmuir and Redlich–Peterson models most closely aligned with the data points. The Langmuir isotherm fit, for example, recorded an R2 value of 0.983 and comparatively low SSE of 1.076 and χ2 of 0.245. This suggests that the Langmuir model, which is based on monolayer adsorption with a finite number of identical or uniform sites, was highly characteristic of the adsorption of Zn2+ by the kaolin. This also implies that once a site was occupied, no further adsorption could occur at that site, as adsorption capacity reached saturation. This is evident in the adsorption capacity (qe) plateauing as the equilibrium concentration (Ce) increased. The observation also aligns with other studies on heavy metal adsorption by kaolin clay, in which the Langmuir fit was the dominant adsorption isotherm [26,53]. However, in some studies, Freundlich, Langmuir, and other models were found to fit the data simultaneously, depending on the specific adsorption conditions [25,75].
The Freundlich model, which assumes heterogeneous surface energies, also recorded a high R2 value of 0.950, although it was lower than that recorded by the Langmuir fitting. The n value, a key parameter in the Freundlich model of ~2.89, supports a favorable multilayer heterogeneous adsorption process. However, the comparatively higher SSE value of 3.22 and χ2 of 0.937 makes it less suitable overall, suggesting that the adsorption of Zn2+ onto kaolin, in this instance, may not have truly followed a predominantly heterogeneous process.
The Redlich–Peterson model exhibited R2 (0.983) and errors (SSE = 1.069; χ2 = 0.252) comparable to those of the Langmuir model. Although the extra parameters (KR, αR, and β) offer added complexity, they did not sufficiently improve the statistical fit to justify the complexity. In this model, parameter β allows for a flexible transition between the Langmuir and Freundlich models, suggesting a hybrid behavior of monolayer and multilayer adsorptions. However, a β value of ~0.97, which is close to 1, tilts the Redlich–Peterson model more towards Langmuir than Freundlich, further corroborating the former as the dominant mechanism. Furthermore, the Langmuir model produced the lowest AIC (−15.11), AICc (−13.11), and BIC (−14.71) values, indicating that it best balanced accuracy and complexity. While the Redlich–Peterson model produced comparable values (AIC = −13.17, AICc = −11.17, BIC = −12.58), the added complexity was not justified. Based on these criteria, the Langmuir model was preferred as the most appropriate fit for this experiment, although the Redlich–Peterson model remains a valid secondary option.
Figure 13 shows the Van’t Hoff plot, which provides thermodynamic information on the adsorptive behavior of kaolin. As expected for systems in which adsorption positively correlates with temperature, the ΔH was 12.4 kJ/mol, indicating that the adsorption process was endothermic. This suggests that for Zn2+ to be adsorbed on the kaolin surface, an initial energy barrier had to be overcome, even if relatively weak. The moderate ΔH also suggests a good balance between strong adsorbent–adsorbate interactions and effective desorption-regeneration reversibility. This is particularly important for sustainable environmental applications that require that large-scale adsorbents be easily renewable. In addition, the moderate enthalpy recorded indicates that the activated kaolin was not overly temperature-dependent, a situation that would have potentially limited its application, especially under normal environmental conditions.
The ΔS of 29.84 J/mol suggests an increase in randomness, which is reflective of a favorable thermodynamic driving force for the adsorption of Zn2+ onto the activated kaolin surface. This randomness results from system reorganization, which can be in the form of an ion exchange process and/or a displacement/disruption of solvated water molecules and structured hydration shells during adsorption. The positive values of ΔH and ΔS are consistent with adsorption mechanisms driven primarily by chemisorption or strong physical interactions. These results are in agreement with those of previous studies on similar adsorption systems [23,24]. ΔG for the adsorption process, calculated using ΔG = ΔHTΔS, demonstrates both the reaction’s feasibility and spontaneity. At the studied temperatures (298–328 K), ΔG ranged from approximately −2.62 to −2.48 kJ/mol. The negative values of ΔG confirm that the adsorption process was spontaneous and thermodynamically feasible across all the temperatures considered. The slightly less negative ΔG values with increasing temperature, however, suggest that the adsorption process reaching equilibrium at higher thermal energy was marginally less favorable.

5. Conclusions

The heavy metal adsorption capacity of NaCl-activated kaolinite clay is influenced by the complex interplay between the particle size and surface chemistry. The observed trends indicate that optimal adsorption occurs when there is a balance between accessible surface area and favorable electrostatic interactions. The initial significant increase in adsorption capacity is driven by a combination of these factors, while the subsequent decline highlights the sensitivity of adsorption efficiency to changes in the conditions, as stated. Understanding these relationships is important for optimizing the use of kaolin clay in the removal of heavy metals from aqueous solutions. Although NaCl activation of kaolin did yield some positive results, it was not significantly superior to conventional acid or base activation. This study was primarily exploratory and designed to investigate the viability of salt-based activation as a milder, environmentally benign alternative for kaolin activation.

Author Contributions

A.K.A.: Writing—original draft, data curation, and conceptualization; V.E.K.: writing—review and editing, and data curation; S.W.H.: writing—review and editing, and supervision; F.B.: writing—review and editing, and supervision; C.V.C.: writing—review and editing, supervision, funding acquisition, and conceptualization. All authors have read and agreed to the published version of the manuscript.

Funding

This research has received funding from the Khalifa University Grant/Award Number: FSU-2023-12.

Data Availability Statement

The raw data supporting the conclusions of this article will be made available by the authors on request.

Conflicts of Interest

The authors declare no conflicts of interest.

References

  1. Qasem, N.A.A.; Mohammed, R.H.; Lawal, D.U. Removal of heavy metal ions from wastewater: A comprehensive and critical review. NPJ Clean Water 2021, 4, 36. [Google Scholar] [CrossRef]
  2. Nandi, B.K.; Goswami, A.; Purkait, M.K. Removal of cationic dyes from aqueous solutions by kaolin: Kinetic and equilibrium studies. Appl. Clay Sci. 2009, 42, 583–590. [Google Scholar] [CrossRef]
  3. Yang, T.; Wang, N.; Gu, H. The adsorption behavior of niobium (V) on kaolin clay and kaolinite. Appl. Clay Sci. 2023, 235, 106866. [Google Scholar] [CrossRef]
  4. Zewdie, T.M.; Prihatiningtyas, I.; Dutta, A.; Gabbiye Habtu, N.; van der Bruggen, B. Characterization and beneficiation of Ethiopian kaolin for use in fabrication of ceramic membrane. Mater. Res. Express 2021, 8, 115201. [Google Scholar] [CrossRef]
  5. Worasith, N.; Goodman, B.A. Clay mineral products for improving environmental quality. Appl. Clay Sci. 2023, 242, 106980. [Google Scholar] [CrossRef]
  6. Belver, C.; Bañares Muñoz, M.A.; Vicente, M.A. Chemical activation of a kaolinite under acid and alkaline conditions. Chem. Mater. 2002, 14, 2033–2043. [Google Scholar] [CrossRef]
  7. Bhattacharyya, K.G.; Gupta, S. Sen Adsorption of a few heavy metals on natural and modified kaolinite and montmorillonite: A review. Adv. Colloid Interface Sci. 2008, 140, 114–131. [Google Scholar] [CrossRef]
  8. David, M.K.; Okoro, U.C.; Akpomie, K.G.; Okey, C.; Oluwasola, H.O. Thermal and hydrothermal alkaline modification of kaolin for the adsorptive removal of lead(II) ions from aqueous solution. SN Appl. Sci. 2020, 2, 1134. [Google Scholar] [CrossRef]
  9. Ptáček, P.; Frajkorová, F.; Šoukal, F.; Opravil, T. Kinetics and mechanism of three stages of thermal transformation of kaolinite to metakaolinite. Powder Technol. 2014, 264, 439–445. [Google Scholar] [CrossRef]
  10. Du, H.; Zhong, Z.; Zhang, B.; Zhao, D.; Lai, X.; Wang, N.; Li, J. Comparative study on intercalation-exfoliation and thermal activation modified kaolin for heavy metals immobilization during high-organic solid waste pyrolysis. Chemosphere 2021, 280, 130714. [Google Scholar] [CrossRef]
  11. Zhang, A.; Liu, J.; Yang, Y.; Yu, Y.; Wu, D. Experimental and theoretical studies on the adsorption performance of lead by thermal pre-activation and phosphate modified kaolin sorbent. Chem. Eng. J. 2023, 451, 138762. [Google Scholar] [CrossRef]
  12. Yu, M.; Huang, Y.; Xia, W.; Zhu, Z.; Fan, C.; Liu, C.; Dong, L.; Xu, L.; Liu, L.; Zha, J.; et al. PbCl2 Capture by Kaolin and Metakaolin under Different Influencing Factors of Thermal Treatment. Energy Fuels 2020, 34, 2284–2292. [Google Scholar] [CrossRef]
  13. Cheng, Y.; Xing, J.; Bu, C.; Zhang, J.; Piao, G.; Huang, Y.; Xie, H.; Wang, X. Dehydroxylation and structural distortion of kaolinite as a high-temperature sorbent in the furnace. Minerals 2019, 9, 587. [Google Scholar] [CrossRef]
  14. Stefanova, R.Y. Metal removal by thermally activated clay marl. J. Environ. Sci. Health—Part A Toxic/Hazardous Subst. Environ. Eng. 2001, 36, 293–306. [Google Scholar] [CrossRef] [PubMed]
  15. Kumrić, K.R.; Crossed, D.; Signukić, A.D.S.B.; Trtić-Petrović, T.M.; Vukelić, N.S.; Stojanović, Z.; Grbović Novaković, J.D.; Matović, L.L. Simultaneous removal of divalent heavy metals from aqueous solutions using raw and mechanochemically treated interstratified montmorillonite/kaolinite clay. Ind. Eng. Chem. Res. 2013, 52, 7930–7939. [Google Scholar] [CrossRef]
  16. Dukić, A.B.; Kumrić, K.R.; Vukelić, N.S.; Dimitrijević, M.S.; Baščarević, Z.D.; Kurko, S.V.; Matović, L.L. Simultaneous removal of Pb2+, Cu2+, Zn2+ and Cd2+ from highly acidic solutions using mechanochemically synthesized montmorillonite-kaolinite/TiO2 composite. Appl. Clay Sci. 2015, 103, 20–27. [Google Scholar] [CrossRef]
  17. Myasnikov, S.K.; Tikhonov, A.Y.; Chipryakova, A.P.; Kulov, N.N. Removal of heavy metal ions from water by an combined sorption–crystallization process using activated clays. Theor. Found. Chem. Eng. 2016, 50, 366–382. [Google Scholar] [CrossRef]
  18. Korichi, S.; Elias, A.; Mefti, A. Characterization of smectite after acid activation with microwave irradiation. Appl. Clay Sci. 2009, 42, 432–438. [Google Scholar] [CrossRef]
  19. Bhattacharyya, K.G.; Gupta, S. Sen Adsorption of chromium(VI) from water by clays. Ind. Eng. Chem. Res. 2006, 45, 7232–7240. [Google Scholar] [CrossRef]
  20. Bhattacharyya, K.G.; Gupta, S. Sen Adsorption of Co(II) from aqueous medium on natural and acid activated kaolinite and montmorillonite. Sep. Sci. Technol. 2007, 42, 3391–3418. [Google Scholar] [CrossRef]
  21. Bhattacharyya, K.G.; Gupta, S. Sen Adsorptive accumulation of Cd(II), Co(II), Cu(II), Pb(II) and Ni(II) ions from water onto Kaolinite: Influence of acid activation. Adsorpt. Sci. Technol. 2009, 27, 47–68. [Google Scholar] [CrossRef]
  22. Bhattacharyya, K.G.; Sen Gupta, S. Pb(II) uptake by kaolinite and montmorillonite in aqueous medium: Influence of acid activation of the clays. Colloids Surf. A Physicochem. Eng. Asp. 2006, 277, 191–200. [Google Scholar] [CrossRef]
  23. Bhattacharyya, K.G.; Gupta, S. Sen Uptake of Ni(II) ions from aqueous solution by kaolinite and montmorillonite: Influence of acid activation of the clays. Sep. Sci. Technol. 2008, 43, 3221–3250. [Google Scholar] [CrossRef]
  24. Dim, P.E.; Mustapha, L.S.; Termtanun, M.; Okafor, J.O. Adsorption of chromium (VI) and iron (III) ions onto acid-modified kaolinite: Isotherm, kinetics and thermodynamics studies. Arab. J. Chem. 2021, 14, 103064. [Google Scholar] [CrossRef]
  25. Mustapha, L.S.; Yusuff, A.S.; Dim, P.E. RSM optimization studies for cadmium ions adsorption onto pristine and acid-modified kaolinite clay. Heliyon 2023, 9, e18634. [Google Scholar] [CrossRef]
  26. Malima, N.M.; Owonubi, S.J.; Lugwisha, E.H.; Mwakaboko, A.S. Thermodynamic, isothermal and kinetic studies of heavy metals adsorption by chemically modified Tanzanian Malangali kaolin clay. Int. J. Environ. Sci. Technol. 2021, 18, 3153–3168. [Google Scholar] [CrossRef]
  27. Abu, T.O.; Adegoke, H.I.; Odebunmi, E.O. Optimization of Adsorption Potentials of Nigerian Kaolinite Mineral Through Acid Activation. Fountain J. Nat. Appl. Sci. 2023, 12, 55–74. [Google Scholar] [CrossRef]
  28. Hounsi, A.D.; Lecomte-Nana, G.; Djétéli, G.; Blanchart, P.; Alowanou, D.; Kpelou, P.; Napo, K.; Tchangbédji, G.; Praisler, M. How does Na, K alkali metal concentration change the early age structural characteristic of kaolin-based geopolymers. Ceram. Int. 2014, 40, 8953–8962. [Google Scholar] [CrossRef]
  29. Esaifan, M.; Rahier, H.; Barhoum, A.; Khoury, H.; Hourani, M.; Wastiels, J. Development of inorganic polymer by alkali-activation of untreated kaolinitic clay: Reaction stoichiometry, strength and dimensional stability. Constr. Build. Mater. 2015, 91, 251–259. [Google Scholar] [CrossRef]
  30. Shaqour, F.; Ismeik, M.; Esaifan, M. Alkali activation of natural clay using a Ca(OH)2/Na2CO3 alkaline mixture. Clay Miner. 2017, 52, 485–496. [Google Scholar] [CrossRef]
  31. Alkan, M.; Hopa, Ç.; Yilmaz, Z.; Güler, H. The effect of alkali concentration and solid/liquid ratio on the hydrothermal synthesis of zeolite NaA from natural kaolinite. Microporous Mesoporous Mater. 2005, 86, 176–184. [Google Scholar] [CrossRef]
  32. Luo, J.; Jiang, T.; Li, G.; Peng, Z.; Rao, M.; Zhang, Y. Porous materials from thermally activated kaolinite: Preparation, characterization and application. Materials 2017, 10, 647. [Google Scholar] [CrossRef]
  33. Abdallah, S. Remediation of Copper and Zinc from wastewater by modified clay in Asir region southwest of Saudi Arabia. Open Geosci. 2019, 11, 505–512. [Google Scholar] [CrossRef]
  34. Bhattacharyya, K.G.; Gupta, S. Sen Influence of acid activation of kaolinite and montmorillonite on adsorptive removal of Cd(II) from water. Ind. Eng. Chem. Res. 2007, 46, 3734–3742. [Google Scholar] [CrossRef]
  35. Bhattacharyya, K.G.; Gupta, S. Sen Removal of Cu(II) by natural and acid-activated clays: An insight of adsorption isotherm, kinetic and thermodynamics. Desalination 2011, 272, 66–75. [Google Scholar] [CrossRef]
  36. Suraj, G.; Iyer, C.S.P.; Lalithambika, M. Adsorption of cadmium and copper by modified kaolinites. Appl. Clay Sci. 1998, 13, 293–306. [Google Scholar] [CrossRef]
  37. Cheng, H.; Huang, Y.; Zhu, Z.; Dong, L.; Zha, J.; Yu, M. Enhanced PbCl2 adsorption capacity of modified kaolin in the furnace using a combined method of thermal pre-activation and acid impregnation. Chem. Eng. J. 2021, 414, 128672. [Google Scholar] [CrossRef]
  38. Lawal, J.; Odebunmi, E.; Adekola, F. Removal of heavy metals from aqueous solutions by adsorption using natural and ammonium carbonate modified kaolinite clays. S. Afr. J. Chem. 2023, 77, 61–73. [Google Scholar] [CrossRef]
  39. Mammen, M.; Choi, S.K.; Whitesides, G.M. Polyvalent interactions in biological systems: Implications for design and use of multivalent ligands and inhibitors. Angew. Chem.—Int. Ed. 1998, 37, 2754–2794. [Google Scholar] [CrossRef]
  40. SI, S. Examining the Features of NaCl Activated Kaolinite Nano-layers for Use in Excipients. Bioceram. Dev. Appl. 2018, 8, 1000106. [Google Scholar] [CrossRef]
  41. Liu, C.; Huang, Y.; Zhu, Z.; Yu, M.; Meng, J.; Bu, C.; Zhang, J. Study on Capture Performance on PbCl2 and CdCl2 using Kaolin Modified by Sodium Ions. ChemistrySelect 2022, 7, e202103554. [Google Scholar] [CrossRef]
  42. Feng, L.; Qiu, T.; Liu, C. Study on adsorption of ammonia nitrogen by sodium-modified kaolin at calcination temperature. Environ. Sci. Pollut. Res. 2023, 30, 97063–97077. [Google Scholar] [CrossRef]
  43. Matłok, M.; Petrus, R.; Warchoł, J.K. Equilibrium Study of Heavy Metals Adsorption on Kaolin. Ind. Eng. Chem. Res. 2015, 54, 6975–6984. [Google Scholar] [CrossRef]
  44. Al-Essa, E.M.; Al-Essa, K.; Halalsheh, N.; Lagum, A.A.; Al-Ma’abreh, A.M.; Saraireh, H.; Shatnawi, K. Removal of Total Phenolic Compounds and Heavy Metal Ions from Olive Mill Wastewater Using Sodium-Activated Jordanian Kaolinite. Sustainability 2025, 17, 4627. [Google Scholar] [CrossRef]
  45. Zhang, X.; Liu, H.; Xing, H.; Li, H.; Hu, H.; Li, A.; Yao, H. Improved sodium adsorption by modified kaolinite at high temperature using intercalation-exfoliation method. Fuel 2017, 191, 198–203. [Google Scholar] [CrossRef]
  46. Prabawa, I.D.G.P.; Lestari, R.Y.; Hamdi, S. Modified physical properties of kaolin by intercalation and exfoliation method. In IOP Conference Series: Materials Science and Engineering; IOP Publishing: Bristol, UK, 2020; Volume 980. [Google Scholar] [CrossRef]
  47. Pham, T.D.; Shrestha, R.A.; Virkutyte, J.; Sillanpää, M. Combined ultrasonication and electrokinetic remediation for persistent organic removal from contaminated kaolin. Electrochim. Acta 2009, 54, 1403–1407. [Google Scholar] [CrossRef]
  48. Qu, M.; Ma, L.; Zhou, Y.; Zhao, Y.; Wang, J.; Zhang, Y.; Zhu, X.; Liu, X.; He, J. Durable and Recyclable Superhydrophilic-Superoleophobic Materials for Efficient Oil/Water Separation and Water-Soluble Dyes Removal. ACS Appl. Nano Mater. 2018, 1, 5197–5209. [Google Scholar] [CrossRef]
  49. Dohnalová, Ž.; Svoboda, L.; Šulcová, P. Characterization of kaolin dispersion using acoustic and electroacoustic spectroscopy. J. Min. Metall. Sect. B Metall. 2008, 44, 63–72. [Google Scholar] [CrossRef]
  50. Wu, J.; Trubyanov, M.; Prvački, D.; Lim, K.; Andreeva, D.V.; Novoselov, K.S. Art and Science of Reinforcing Ceramics with Graphene via Ultrasonication Mixing. ACS Omega 2024, 9, 42944–42949. [Google Scholar] [CrossRef]
  51. Bhatti, Q.A.; Baloch, M.K.; Schwarz, S.; Ishaq, M. Impact of mechanochemical treatment on surface chemistry and flocculation of kaolinite dispersion. Asia-Pac. J. Chem. Eng. 2023, 18, e2886. [Google Scholar] [CrossRef]
  52. Ibrahim, H.S.; Jamil, T.S.; Hegazy, E.Z. Application of zeolite prepared from Egyptian kaolin for the removal of heavy metals: II. Isotherm models. J. Hazard. Mater. 2010, 182, 842–847. [Google Scholar] [CrossRef]
  53. Chai, J.B.; Au, P.I.; Mubarak, N.M.; Khalid, M.; Ng, W.P.Q.; Jagadish, P.; Walvekar, R.; Abdullah, E.C. Adsorption of heavy metal from industrial wastewater onto low-cost Malaysian kaolin clay–based adsorbent. Environ. Sci. Pollut. Res. 2020, 27, 13949–13962. [Google Scholar] [CrossRef]
  54. Revellame, E.D.; Fortela, D.L.; Sharp, W.; Hernandez, R.; Zappi, M.E. Adsorption kinetic modeling using pseudo-first order and pseudo-second order rate laws: A review. Clean. Eng. Technol. 2020, 1, 100032. [Google Scholar] [CrossRef]
  55. Ho, Y.S.; McKay, G. Pseudo-second order model for sorption processes. Process Biochem. 1999, 34, 451–465. [Google Scholar] [CrossRef]
  56. Sotirelis, N.P.; Chrysikopoulos, C.V. Interaction Between Graphene Oxide Nanoparticles and Quartz Sand. Environ. Sci. Technol. 2015, 49, 13413–13421. [Google Scholar] [CrossRef] [PubMed]
  57. Febrianto, J.; Kosasih, A.N.; Sunarso, J.; Ju, Y.H.; Indraswati, N.; Ismadji, S. Equilibrium and kinetic studies in adsorption of heavy metals using biosorbent: A summary of recent studies. J. Hazard. Mater. 2009, 162, 616–645. [Google Scholar] [CrossRef] [PubMed]
  58. Wu, F.C.; Tseng, R.L.; Juang, R.S. Characteristics of Elovich equation used for the analysis of adsorption kinetics in dye-chitosan systems. Chem. Eng. J. 2009, 150, 366–373. [Google Scholar] [CrossRef]
  59. Sharafee Shamsudin, M.; Taufik Mohd Din, A.; Sellaoui, L.; Badawi, M.; Bonilla-Petriciolet, A.; Ismail, S. Characterization, evaluation, and mechanism analysis of the functionalization of kaolin with a surfactant for the removal of diclofenac from aqueous solution. Chem. Eng. J. 2023, 465, 142833. [Google Scholar] [CrossRef]
  60. Spiess, A.N.; Neumeyer, N. An evaluation of R2 as an inadequate measure for nonlinear models in pharmacological and biochemical research: A Monte Carlo approach. BMC Pharmacol. 2010, 10, 6. [Google Scholar] [CrossRef]
  61. Akaike, H. A New Look at the Statistical Model Identification. IEEE Trans. Automat. Contr. 1974, 17, 716–723. [Google Scholar] [CrossRef]
  62. Burnham, K.P.; Anderson, D.R. Multimodel inference: Understanding AIC and BIC in model selection. Sociol. Methods Res. 2004, 33, 261–304. [Google Scholar] [CrossRef]
  63. Wit, E.; van den Heuvel, E.; Romeijn, J.W. ‘All models are wrong…’: An introduction to model uncertainty. Stat. Neerl. 2012, 66, 217–236. [Google Scholar] [CrossRef]
  64. Avornyo, A.K.; Hasan, S.W.; Banat, F.; Chrysikopoulos, C.V. Preparation, characterization, and applications of kaolin/kaolin-based composite membranes in oily wastewater treatment: Recent developments, challenges, and opportunities. J. Environ. Manag. 2024, 370, 122800. [Google Scholar] [CrossRef] [PubMed]
  65. Sachan, A.; Penumadu, D. Identification of microfabric of kaolinite clay mineral using X-ray diffraction technique. Geotech. Geol. Eng. 2007, 25, 603–616. [Google Scholar] [CrossRef]
  66. Liew, Y.M.; Kamarudin, H.; Mustafa Al Bakri, A.M.; Luqman, M.; Khairul Nizar, I.; Ruzaidi, C.M.; Heah, C.Y. Processing and characterization of calcined kaolin cement powder. Constr. Build. Mater. 2012, 30, 794–802. [Google Scholar] [CrossRef]
  67. Hernández-Chávez, M.; Vargas-Ramírez, M.; Herrera-González, A.M.; García-Serrano, J.; Hernández-Chávez, M.; Ramírez, A.C.; Romero-Serrano, R.G.; Sánchez-Alvarado, J.A. Thermodynamic analysis of the influence of potassium on the thermal behavior of kaolin raw material. Physicochem. Probl. Miner. Process. 2020, 57, 39–52. [Google Scholar] [CrossRef]
  68. Yang, K.J.; Sim, J.H.; Jeon, B.; Son, D.H.; Kim, D.H.; Sung, S.J.; Hwang, D.K.; Song, S.; Khadka, D.B.; Kim, J.; et al. Effects of Na and MoS2 on Cu2ZnSnS4 thin-film solar cell. Prog. Photovolt. Res. Appl. 2015, 23, 862–873. [Google Scholar] [CrossRef]
  69. You, L.; Tan, X.; Liu, Q.; Zhao, L. Ammonium removal from aqueous solutions using an ammonium ion-exchange material, the equilibrium study. Adv. Mater. Res. 2011, 322, 102–107. [Google Scholar] [CrossRef]
  70. Schoonheydt, R.A.; Johnston, C.T. Surface and interface chemistry of clay minerals. Dev. Clay Sci. 2013, 5, 139–172. [Google Scholar] [CrossRef]
  71. Allagui, A.; Benaoum, H.; Olendski, O. On the Gouy–Chapman–Stern model of the electrical double-layer structure with a generalized Boltzmann factor. Phys. A Stat. Mech. Its Appl. 2021, 582, 126252. [Google Scholar] [CrossRef]
  72. Li, J.; Li, Y.; Li, S.; Zhu, M.; Zhang, J.; Li, Y.; He, Y.; Li, W. Zinc interstitial and oxygen vacancy mediated high Curie-temperature ferromagnetism in Ag-doped ZnO. Ceram. Int. 2020, 46, 18639–18647. [Google Scholar] [CrossRef]
  73. Seals, R.D.; Alexander, R.; Taylor, L.T.; Dillard, J.G. Core Electron Binding Energy Study of Group IIb-VIIa Compounds. Inorg. Chem. 1973, 12, 2485–2487. [Google Scholar] [CrossRef]
  74. Katzourakis, V.E.; Chrysikopoulos, C.V. Fitting the Transport and Attachment of Dense Biocolloids in One-Dimensional Porous Media: ColloidFit. Groundwater 2017, 55, 156–159. [Google Scholar] [CrossRef]
  75. Lankathilaka, K.P.W.; de Silva, R.M.; Mantilaka, M.M.M.G.P.G.; de Silva, K.M.N. Magnetite nanoparticles incorporated porous kaolin as a superior heavy metal sorbent for water purification. Groundw. Sustain. Dev. 2021, 14, 100606. [Google Scholar] [CrossRef]
Figure 1. SEM images of kaolin samples at different NaCl activator concentrations.
Water 17 02120 g001
Figure 2. FTIR of kaolin samples at different NaCl activator concentrations.
Water 17 02120 g002
Figure 3. XRD spectra of kaolin samples at different NaCl activator concentrations. (K = kaolin, Q = quartz, A = alunite).
Water 17 02120 g003
Figure 4. Zeta potential of kaolin samples at different NaCl activator concentrations.
Water 17 02120 g004
Figure 5. Average hydrodynamic particle size of kaolin samples at different NaCl activator concentrations.
Water 17 02120 g005
Figure 6. XPS peaks of the chemical environments of the elemental compositions of pristine kaolin showing (a) Al2p, (b) Si2p, and (c) O1s peaks, confirming the presence of aluminum, silicon, and oxygen in their expected chemical environments.
Water 17 02120 g006
Figure 7. XPS peaks of the chemical environments of the elemental compositions of the NaCl-activated kaolin. The spectra show the core-level peaks of (a) Al2p, (b) Si2p, (c) O1s, (d) Na1s, and (e) Cl2p. These peaks confirm the presence of aluminum, silicon, oxygen, sodium, and chlorine in the activated sample.
Water 17 02120 g007
Figure 8. Removal efficiency of kaolin samples at different NaCl activator concentrations.
Water 17 02120 g008
Figure 9. XPS peaks of the chemical environments of the elemental compositions of the NaCl-activated kaolin after the Zn2+ adsorption (af). The figure shows the deconvoluted peaks of (a) Zn2p, (b) Al2p, (c) Si2p, (d) O1s, (e) Na1s, and (f) Cl2p. The fitted envelopes reveal the chemical states of the corresponding elements and confirm the successful adsorption of Zn2+ as well as the presence of sodium and chloride from the activation treatment.
Water 17 02120 g009
Figure 10. (a) NaCl-activated kaolin showing a more turbid mixture, (b) Adsorbent particles begin to settle faster due to charge neutralization.
Water 17 02120 g010
Figure 11. Adsorption kinetics of 0.5M NaCl-activated kaolin sample.
Water 17 02120 g011
Figure 12. Adsorption isotherm of 0.5 M NaCl-activated kaolin sample.
Water 17 02120 g012
Figure 13. Van’t Hoff Plot of 0.5M NaCl-activated kaolin sample.
Water 17 02120 g013
Table 1. Leachate analysis protocol and summary of results.
Blank DI Water (No Kaolin)NaCl-Kaolin, No Zn2+After Zn2+ Adsorption (2 h)After Zn2+ Adsorption (24 h Test)Notes on Results
Zn
(mg L−1)
<0.003<0.0035.1 ± 0.34.8 ± 0.4The blank confirms zero Zn contamination. Kaolin alone does not release Zn. After dosing with 50 mg L−1, only ~5 mg L−1 remains in 2 h and just a further small loss after 24 h.
Zn adsorbed
(mg g−1)
13.0 ± 0.713.3 ± 1.1Mass balance converts the drop in solution Zn to loading on the clay (0.10 g). The value exceeds the Langmuir monolayer (9 mg g−1), showing multilayer uptake/early Zn–Al LDH nucleation at high concentration. The 24-h figure matches the 2-h figure within error.
Na+
(mg/L)
0.0460.276 ± 0.0230.644 ± 0.0460.690 ± 0.046The blank gives background Na+ from water and, perhaps, labware. Contact with Na-activated kaolin (no Zn2+) raises Na+ nine-fold because some exchangeable K+/Ca2+/Mg2+ are replaced by Na+. When Zn2+ is present, Na+ rises a further 0.37 mg L−1 owing to Na+ ↔ Zn2+ ion exchange. The plateau at 24 h confirms the exchange is finished in 2 h.
Na+ released
(mg g−1)
0.055 ± 0.0050.129 ± 0.0090.138 ± 0.011Blank-corrected and normalized to clay mass. After Zn2+ uptake, 0.129 mg g−1 Na+ ≈ 5.6 µmol g−1 is released, close to the amount needed to balance the Zn2+ adsorbed on a 2 Na+: Zn2+ basis.
Al
(mg L−1)
<0.010.018 ± 0.0020.031 ± 0.0030.034 ± 0.004Framework Al dissolution is <0.05 mg L−1 at all times, indicating the kaolinite lattice remains intact during activation and adsorption.
Si
(mg L−1)
<0.020.024 ± 0.0030.043 ± 0.0050.044 ± 0.006Similarly, low Si release confirms negligible layer dissolution; Zn removal is therefore by surface exchange/complexation, not by clay breakdown and re-precipitation.
Table 2. Multi-cycle regeneration of NaCl-activated kaolin with 0.05 M HCl.
CycleZn Adsorbed (mg/g)Zn Desorbed (mg/g)Efficiency
19.22 ± 0.348.72 ± 0.3094.6 ± 2.3
29.06 ± 0.288.45 ± 0.2993.3 ± 2.5
38.89 ± 0.318.01 ± 0.2790.1 ± 3.0
48.54 ± 0.367.38 ± 0.2586.4 ± 3.5
57.97 ± 0.416.23 ± 0.2278.1 ± 4.1
Table 3. Isotherm and kinetic fitting results.
Isotherm StudiesKinetic Studies
Model/ParameterLangmuirFreundlichRedlich–PetersonModel/ParameterPseudo-First OrderPseudo-Second OrderElovich
qm9.218 ±0.11--K10.0508 ± 0.006--
KL0.132 ±0.03--K2-0.0098 ± 0.002-
KF-2.169 ± 0.42-qe5.699 ± 0.196.529 ± 0.23-
N-2.895 ± 0.53-α--1485.4 ± 1025.9
KR--1.268 ± 0.86β--2.535 ± 1.08
αR--0.150 ± 0.027----
β--0.978 ± 0.28----
R20.9830.9500.983R20.9050.9930.843
SSE1.0763.2281.069SSE0.6970.1844.483
χ20.2450.9370.251χ20.1850.0430.575
AIC−15.113−5.2262−13.170AIC−15.520−26.177−0.632
AICc−13.113−3.2262−8.3703AICc−13.120−23.7771.767
BIC−14.718−4.8317−12.578BIC−15.361−26.018−0.473
Disclaimer/Publisher’s Note: The statements, opinions and data contained in all publications are solely those of the individual author(s) and contributor(s) and not of MDPI and/or the editor(s). MDPI and/or the editor(s) disclaim responsibility for any injury to people or property resulting from any ideas, methods, instructions or products referred to in the content.

