1. Introduction
More effective water usage is required for sustainable agriculture because of the growing demand for water from non-agricultural sectors, climate change, and precipitation variations [
1,
2]. As water resources become increasingly crucial in the future, it is essential to efficiently utilize the available water. Various water system strategies have been implemented to optimize water usage in agriculture, demonstrating the need for effective water management [
3,
4]. Improving water use efficiency (WUE) can lead to significant water savings. Traditional irrigation methods like flood irrigation not only strain water resources but also lead to waste [
5]. Micro irrigation, also known as localized irrigation, focuses on wetting only part of the soil volume. It is characterized by (i) low water application rates; (ii) prolonged irrigation periods; (iii) frequent irrigation intervals; (iv) delivery near the root zone; (v) low-pressure systems; and (vi) the transportation of fertilizers and chemicals [
6]. The benefits of micro irrigation include (a) increased water use efficiency; (b) improved crop yields and quality; (c) reduced evaporation and irrigation runoff; (d) minimized deep percolation; and (e) better fertilizer application with less leaching [
7,
8]. Subsurface drip irrigation is deemed the most effective method for delivering water and nutrients to crops, enhancing productivity [
9]. Understanding water behavior in the soil profile is essential for optimal water use [
10]. The emitters in subsurface drip irrigation (SDI) systems are similar to those used in surface drip irrigation, but they are embedded within the drip line [
11]. Choosing the appropriate depth for the subsurface irrigation pipe is extremely important and varies depending on Root Zone Depth, Soil Texture and Properties, and Intermittent Flow Considerations [
11,
12]. The emitters in subsurface drip water application (SDI) systems resemble those utilized in surface drip water application, although they are integrated into the drip line [
11]. The optimal depth for subsurface water application pipes is crucial and depends on factors such as root zone depth, soil texture, and intermittent flow considerations [
11]. Proper scheduling and emission rates significantly affect root growth and yield [
13].
Understanding water behavior in soil profiles is essential for optimal plant water use [
14]. The wetting zone is improved by intermittent water application because of the cycles of water supply and water redistribution. Cycle duration lengthens as the frequency of these additions declines, enhancing both horizontal and vertical dispersion [
15]. The WP depends on two major factors: the soil properties (texture, hydraulic conductivity, etc.) and the application scheme (application method, position, rate, and frequency) [
16]. Khoshravesh-Miangoleh, Kiani [
17] found that soil type is the most crucial factor affecting infiltration. Li, Kang [
18] identified water application quota, flow, initial soil water, and water holding capacity as key factors, with water quantity and flow rate significantly impacting wetting front transport [
19]. Scheduling water application is crucial for the efficient use of drip water application systems, as excessive or inadequate water application can reduce yield and increase water stress [
20]. Continuous water application leads to root zone inefficiencies, while intermittent pulsed discharge with breaks improves field water management and overall water application efficiency [
21]. Pulsating water application prevents leaching by delivering small water amounts through microtubes, aligning the water application rate with the soil’s hydraulic conductivity, and minimizing percolation beyond the root zone [
22]. Pulsating water application is gaining global popularity for its ability to enhance yield and quality, conserve water, reduce dripper clogging, lower energy use, and expand horizontal soil water distribution, particularly in sandy soils [
23]. This method, particularly in drip water application systems, maintains a smaller soil wetting volume and higher soil water content in a small range, thereby enhancing soil health [
24]. Drip water application effectively conserves soil health by reducing wetting volume and water content. Using four water application cycles of 15 min ON and 45 min OFF can save up to 25% of water, boosting efficiency [
25]. Intermittent subsurface drip water application enhances lateral water movement by applying successive amounts of water, allowing redistribution between applications for improved efficiency [
26]. Various application regimes have been applied, including specific ON and OFF times, fixed ON times, and applied water depth [
27]. Researchers have adjusted the wetted zone shape to better match root extraction patterns [
14]. Increasing water application frequency can manage the wet pattern around the buried emitter, resulting in more water moving toward the soil surface [
15]. Analyzing wetted soil volume dimensions is crucial for determining optimal design parameters and water application durations for various soil types, enabling efficient wetting of a targeted soil depth [
28].
Deterministic models predict individual processes and their interactions uniquely [
29]. Physically based simulation models are valuable tools for designing water application strategies that optimize water use efficiency, offering a scientific basis for decision-making in water management practices [
28]. Empirical, analytical, and numerical models are utilized to simulate water flow and soil water content dynamics within water application systems, providing insights to refine water application efficiency and management practices [
30]. Advancements in computer technology have increased interest in using numerical models for subsurface water application systems [
28]. HYDRUS 2.05, a popular package for simulating water and solute transport in variably saturated soils, is widely used for simulating drip water application [
31]. HYDRUS2D/3D is a Windows-based model that simulates soil water dynamics using numerical and mathematical techniques in two and three dimensions [
32]. Extensive studies have assessed software tools to evaluate their capacity for predicting water and nutrient dynamics across different drip water application techniques, highlighting their value in optimizing water application practices [
33]. This software’s advantage lies in its input parameters being closely linked to soil physical properties, which can be measured in situ or in the lab [
34]. The applicability of HYDRUS-2D/3D to numerous plant/soil scenarios has been demonstrated experimentally, including surface drip [
35] and subsurface drip water application systems [
36]. Agricultural applications of the HYDRUS modules often involve evaluations of various water application schemes [
37].
This study utilizes computer simulations with HYDRUS (2D/3D) software to investigate the effects of various water application strategies on soil water dynamics. We developed multiple scenarios to compare continuous and intermittent water flow regimes, focusing on the vertical movement of water through the soil profile. These scenarios included variations in the frequency of water application cycles, the durations of both water application and cessation periods, and the depth of the water application tubes. This study aims to systematically evaluate the effects of various water application methods on vertical water movement and retention in subsurface drip water application systems. By optimizing water application efficiency, the research seeks to enhance water retention, refine water application strategies, reduce deep seepage, and support effective crop establishment, particularly in arid regions. The significance of this work lies in its potential to advance sustainable agricultural practices and optimize water management techniques, thereby contributing to improved water utilization in water-scarce environments. The findings are expected to play a crucial role in promoting sustainable agriculture and ensuring efficient water resource management.
2. Material and Method
2.1. Subsurface Drip (SDI) Modeling
The program numerically solves Richards’ equation for saturated–unsaturated water flow. The program was used to analyze water and solute movement in unsaturated, partially saturated, or fully saturated porous media [
38]. The water flows part of the model can deal with (constant or time-varying) prescribed head and flux boundaries, boundaries controlled by atmospheric conditions, as well as free drainage boundary conditions (BCs) [
39]. The governing flow and transport equations are solved numerically using Galerkin-type linear finite element schemes. Integration in time is achieved using an implicit (backward) finite difference scheme for both saturated and unsaturated conditions [
39].
The HYDRUS software needs some hydraulic parameters for soil layers as
θs,
θr, KS, and
α, in addition to BCs, initial conditions, and flow field geometry. The numerical model accuracy in simulating the wetting pattern is correlated with the accuracy of these parameters. The hydraulic parameters of the soil layers were estimated by the Rosetta program [
40], available within the HYDRUS-2D program through the option (Neural Network Predictions), where some soil characteristics specified in the laboratory were introduced such as the volumetric distribution for a percentage of (sand, clay, and silt) for each soil layers, in addition to the bulk density and water content at a pressure of 33 and 1500 kPa. The initial conditions of the program were represented by the initial water content of 10% in the initial condition case.
The Richards equation governing water flow from a point source through variably saturated, porous media can be written in axisymmetric coordinates as shown in Equation (1) [
41]:
where
is the volumetric water content (L3L-3),
t is the time (T),
h is the soil water pressure head (L), r is the radial (horizontal) coordinate (L),
z is the vertical coordinate that is positive upward (L), K(h) is the unsaturated hydraulic conductivity (LT
−1), and
S(
h) is the sink term representing root water uptake expressed as a volume of water removed from a unit volume of soil per unit time (L
3L
−3T
−1).
The soil water retention was modeled using the van Genuchten Equation (2) [
42],
where
Se is the effective degree of saturation or the reduced water content,
θr and
θs are the residual and saturated water contents (L
3L
−3), respectively,
α is an empirical parameter (L
−l) inversely related to the air entry value, and
n and m are empirical constants affecting the shape of the retention curve. The value of m is restricted by m = 1 − 1/n.
The hydraulic conductivity as a function of
Se was assumed to be described using the closed-form equation of van Genuchten [
42], which combines the analytical expression with the pore size distribution model of Mualem as Equation (3) [
43]:
where ɤ is the pore connectivity parameter estimated by [
43] to be about 0.5 as an average for many soils, and k
s is the saturated hydraulic conductivity (LT
−1).
The sink term S(h) as Equation (4) was computed using the Feddes, Kowalik [
44] model adapted for a radially symmetric problem:
where S and Sp are the actual and potential (during no-stress periods) root water uptake rates (L
3L
−3T
−1), respectively, (h) is a dimensionless water stress response function for water uptake by plant roots [
44], β(r, z) is a function describing the spatial root distribution [
45] (L
−3), Tp is the potential transpiration rate, and A
T is the surface area associated with transpiration (L
2).
2.2. Modeled Scenarios
To address the main objectives of this study, we have chosen to evaluate the following scenarios:
Different emitting depths (25, 35 cm)
Three ratios of ON: OFF times (1ON:1OFF, 1ON:3OFF, and 1ON:5OFF)
Intermittent water flow (one cycle–two cycle–three cycle–four cycle–five cycle)
The HYDRUS (2D/3D) software package (version 2.0) [
46] is used in numerical simulations for all modeled scenarios. Water flow, root water uptake, and solute transport are the processes considered in the simulations. The transport domain for all scenarios was considered to be the Vertical plane XZ, similar as performed by many other researchers [
47].
The transport domain was 200 cm wide, with a 75 cm depth. The soil profile was considered to be homogeneous and initially uniformly dry, with an initial pressure head of −1000 cm. An unstructured triangular mesh with 15,241 nodes and 30,174 2D elements was used to spatially discretize the transport domain for the case of the drip line located 25 and 35 cm below the soil surface. Mesh refinement was performed closer to the soil surface and around the emitter, where a rapid change in flux occurs.
In all simulated scenarios, the upper boundary of the transport domain was subjected to atmospheric conditions, while the lower boundary of the domain was free drainage. Boundaries at both vertical sides were assigned a “no-flux” BC. Emitters were represented in all cases as circles with a radius of 1 cm, located at the selected depth in the boundary of the transport domain. The emitter was assigned a “Variable Flux” BCs. The transpiration rate was considered to be constant with time and equal to 4.0 mm/day, i.e., daily variations of the transpiration rate were not considered. Simulations were carried out for 15 days, and one day was selected (after a week) in which the initial water content had a value of 10%. The effective root zone of potatoes lies within the upper 60 cm of soil. Potatoes, planted 15 cm deep, had drip tubes simulated at depths of 25 cm (10 cm below tubers) and 35 cm, to assess water conservation efficiency.
Time-variable BCs were used to simulate drip water application. The dripper discharge (
Q) was considered to be 3.41 L/h, which is equivalent to a flux of about 5 cm/min (q
= Q/4πr2), where
q is the boundary flux (cm/min),
Q is the emitter discharge (cm
3/min), and
r is the wetted radius of the emitter (cm). The root-water uptake of selected crops was simulated using the Fades [
15] model with the default values of required parameters provided by the Hydrus model.
2.3. Treatments
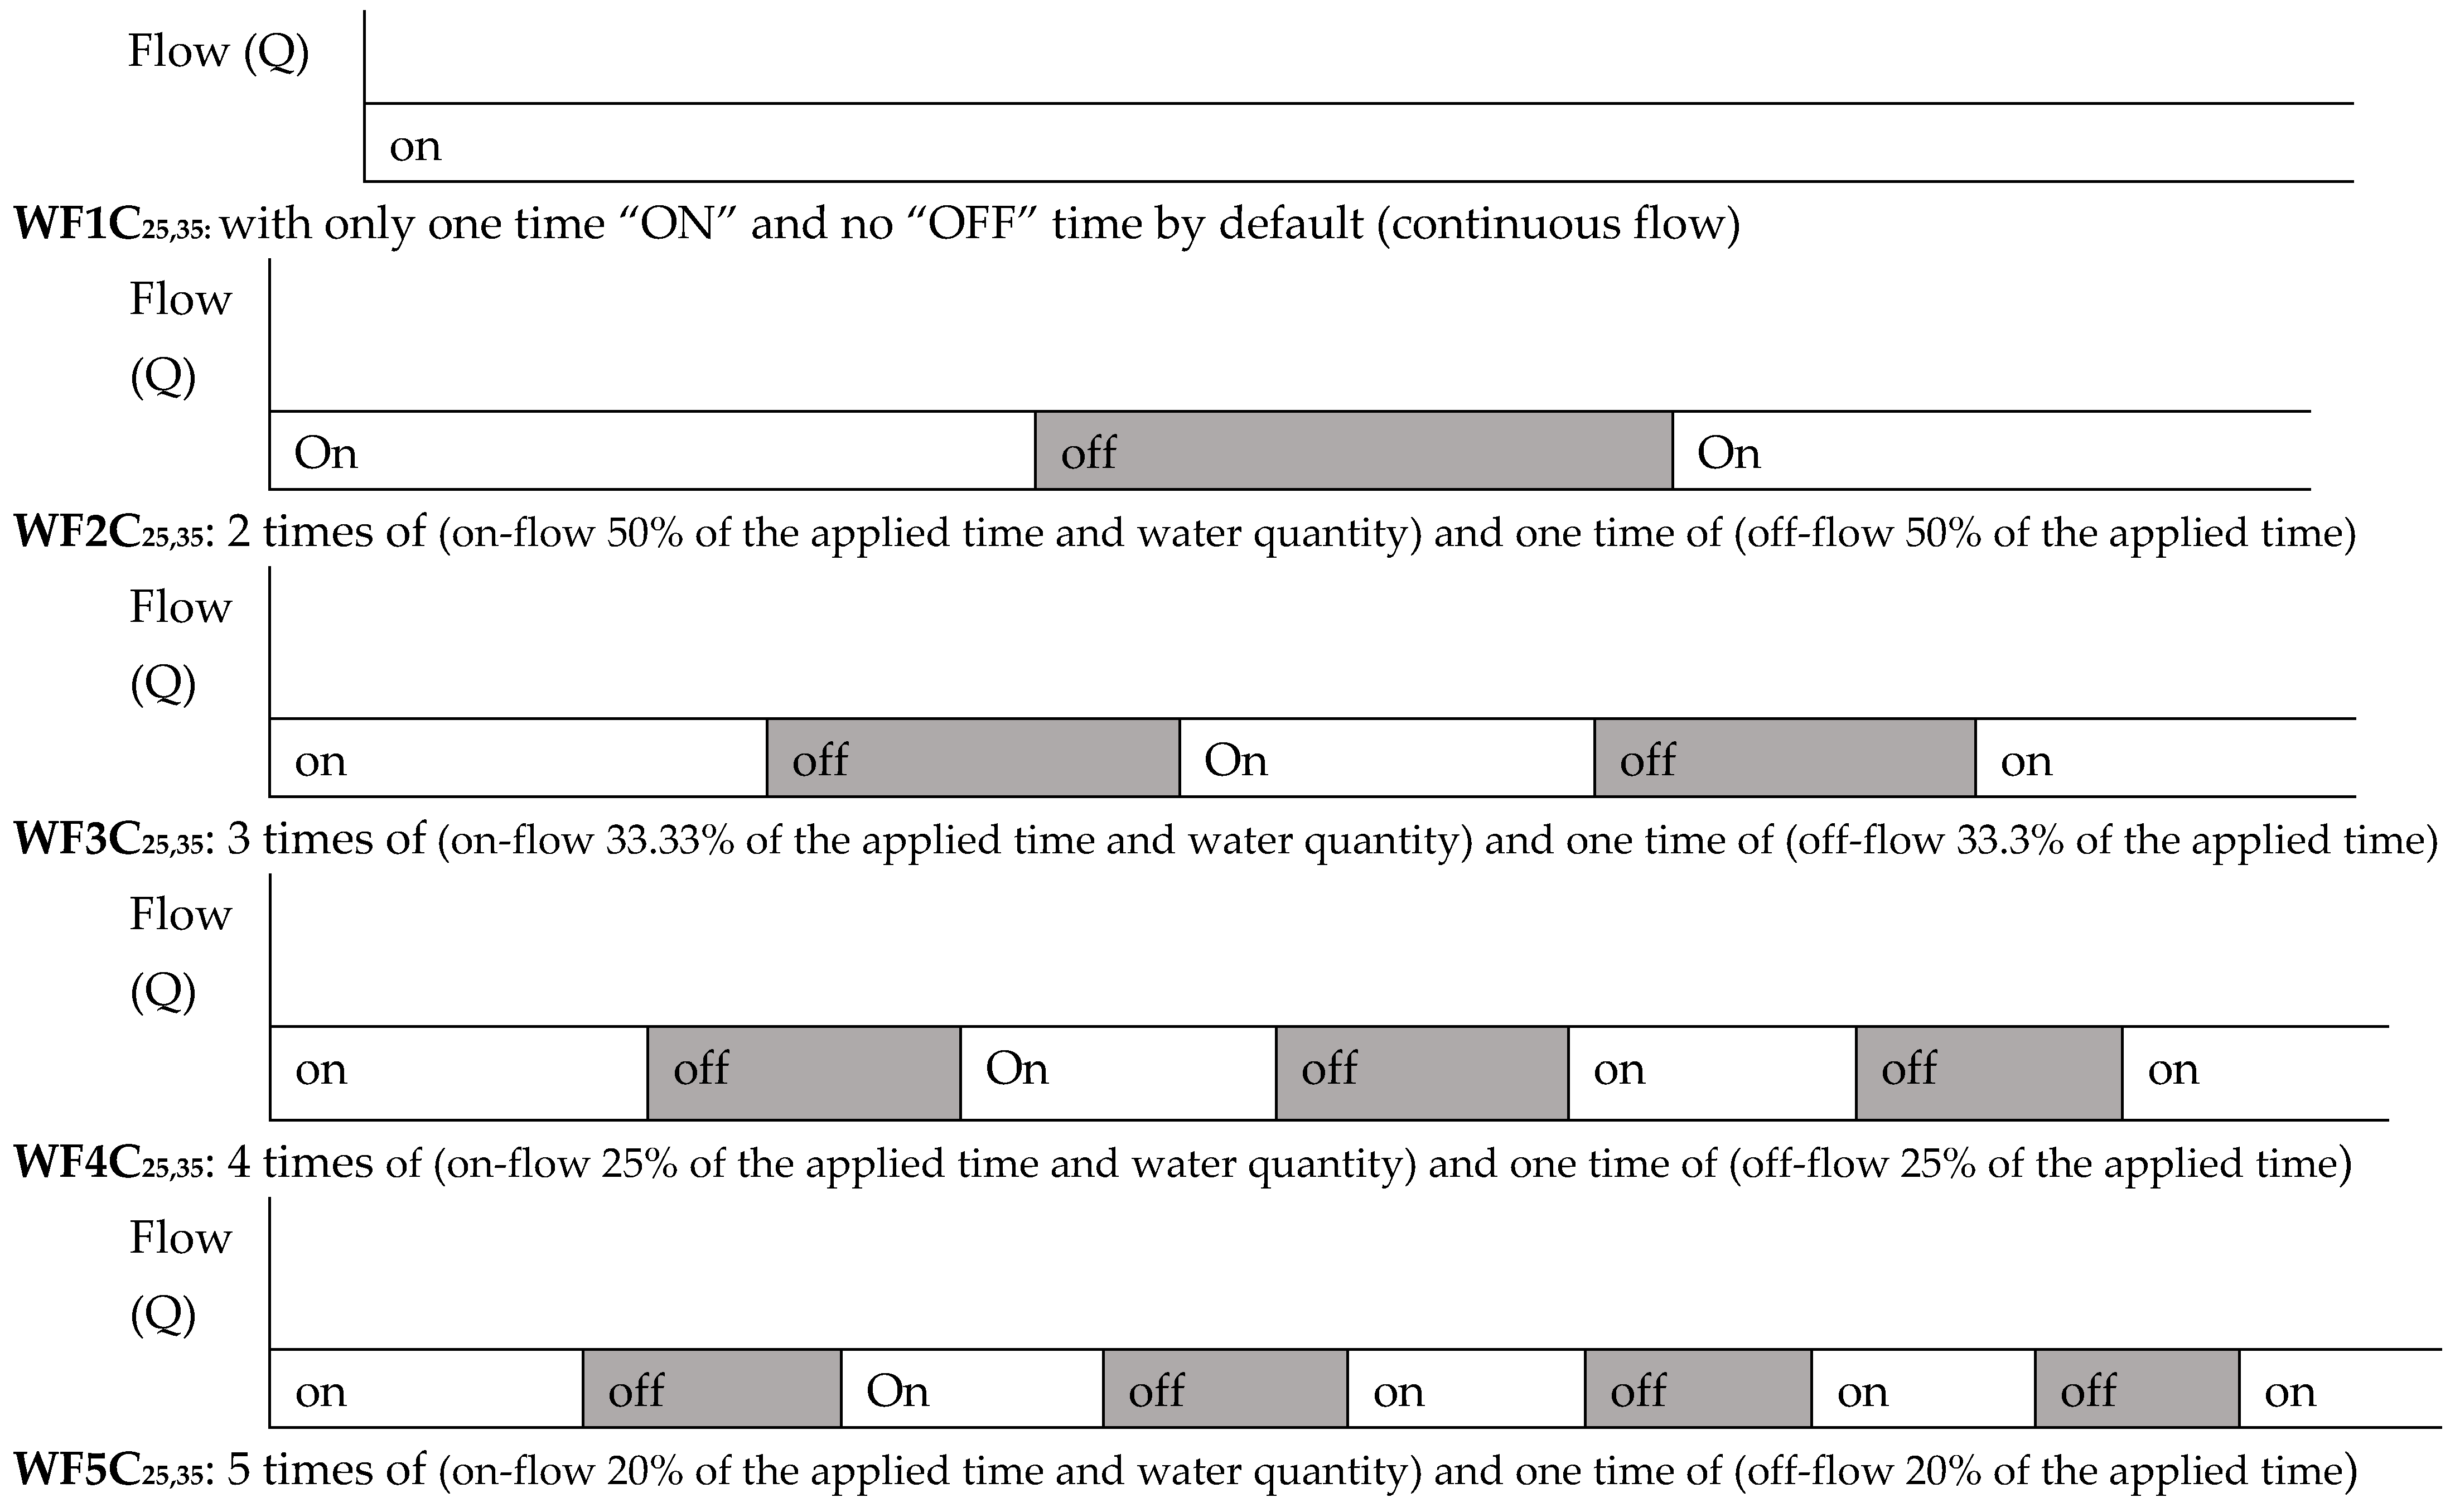
The varying parameters established the treatments for the simulation process, which included a total of 30 distinct treatments. These treatments resulted from two different pipe depths (25 and 35 cm) of discharging water sources, represented by the abbreviated SDI, combined with five water flow regimes (WF1C, WF2C, WF3C, WF4C, and WF5C, with WF1C as the continuous water flow) under 3 different ratios of ON: OFF times (1ON:1OFF, 1ON:3OFF, and 1ON:5OFF). The five flow regimes can be categorized into one continuous flow and four intermittent flows. The intermittent flows are defined by the number of “ON: OFF” cycles; for instance, one cycle indicates a continuous water flow, while a two-cycle consists of one “OFF” period and two “ON” periods. Similarly, a three-cycle entails two “OFF” periods followed by three “ON” periods, and this pattern continues for the four-cycle and five-cycle, as illustrated in
Figure 1.
The simulations were conducted using loamy sand soil, with hydraulic parameters sourced from the soil catalog provided by the HYDRUS software [
48] and are given in
Table 1. Additionally, parameters representing the model crop, potatoes (
Solanum tuberosum), were incorporated into the simulations.
In the one-cycle water flow (WF1C) (continuous water flow), the duration of water application was set to 30 min, representing uninterrupted water flow with an equal OFF time of 30 min. In the two-cycle water flow (WF2C), the water application lasted for 15 min, followed by one cycle of OFF, which also took 15 min, resulting in a total applied water time of 50 min. For the three-cycle water flow (WF3C), the water application was 10 min long, with two OFF cycles of 10 min each, leading to a total water application time of 45 min. In the four-cycle water flow (WF4C), the water application duration was 7.5 min, coupled with one OFF cycle lasting 7.5 min, resulting in a total application time of 52.5 min. Lastly, in the five-cycle water flow (WF5C), the water application lasted 6 min, with four OFF cycles of 6 min each, summing up to a total applied water time of 54 min, as shown in
Table 2. This is a simplified explanation in case of use ratios of ON OFF times (1ON:1OFF).
However, in the case of applying different stopping times, i.e., 3 or 5 times the operating time, the total time to add water is clear from the following Equation (5) and as shown in
Table 3.
where: TOT: Total ON: OFF Time (min); WAT: Water Application Time (min); NOC: Number of Cycles; ROF: Ratio of ON:OFF time
This article presents an in-depth analysis of subsurface drip water application practices in stratified loamy sand soil. The focus is on understanding how different emitter depths—specifically 25 cm and 35 cm—affect water dynamics within the soil. The study employs a variety of scenarios, examining the implications of intermittent water flow across five distinct cycles. Furthermore, it investigates diverse water application schedules, utilizing three specific ON/OFF time ratios: 1ON:1OFF, 1ON:3OFF, and 1ON:5OFF. Notably, the OFF periods for these schedules are extended to three and five times the duration of the ON periods. This comprehensive exploration aims to shed light on how these varying configurations influence the distribution and movement of water in the soil, ultimately enhancing our understanding of optimal water application strategies. In those simulations, the dripper becomes calibrated to supply 3.41 L/h, with a regular water application frequency of half an hour every day. To comprehensively examine the water content profiles, vertical move-sections of the soil were examined at six cautiously timed durations: previous to water application and at 30, 60, 120, 180, and 360 min following the initiation of the watering process. These specific profiles captured both the infiltration section, in which water first penetrates the soil, and the redistribution phase, which displays how the water is sooner or later distributed throughout the soil layers.
The difference in water content values before and after the water application process is explained as a percentage through the following Equation (6):
where
is the initial water content value that represents the value before water application and adding water to the soil.
the water content value after water application and at a specific time.
To visualize these dynamics, snapshots from the simulation application were amassed at every one of the distinctive intervals, supplying vivid illustrations of the spatial distribution of water content across the soil profile. This imparts a clean perception of the movement and retention of water inside the soil, elucidating the difficult interplay between water application practices and soil water dynamics.
This study aims to conduct a statistical analysis using the SPSS 26 statistical software to investigate key parameters related to the effects of various independent variables on soil water content dynamics. The variables under examination include pipe depth, the number of water application cycles, and the ON:OFF water application ratios. The hypotheses formulated for this analysis are as follows:
General Null Hypothesis (H0):
“There is no statistically significant effect of pipe depth, number of water application cycles, or water application interval on soil water content across levels A, B, and C.”
Where (A) is 10 cm depth (surface), (B) is 20–40 cm depth (root zone), and(C) is 50 cm depth (sub-root zone).
General Alternative Hypothesis (H1):
“At least one of the factors—pipe depth, number of water application cycles, or water application interval—exerts a statistically significant effect on soil water content across levels A, B, and C.”
Hypotheses for Individual Factors (Three-Way ANOVA):
A three-way ANOVA is employed to analyze the main and interaction effects of three independent variables. The specific hypotheses are as follows:
- –
Main Effect of Pipe Depth:
H01: “Pipe depth does not significantly affect soil water content at levels A, B, and C.”
H11: “Pipe depth significantly affects soil water content at levels A, B, and C.”
- –
Main Effect of Number of Water Application Cycles:
H02: “The number of water application cycles does not significantly affect soil water content at levels A, B, and C.”
H12: “The number of water application cycles significantly affects soil water content at levels A, B, and C.”
- –
Main Effect of Water Application Interval:
H03: “Water application interval has no significant effect on soil water content at levels A, B, and C.”
H13: “Water application interval significantly affects soil water content at levels A, B, and C.”
3. Results
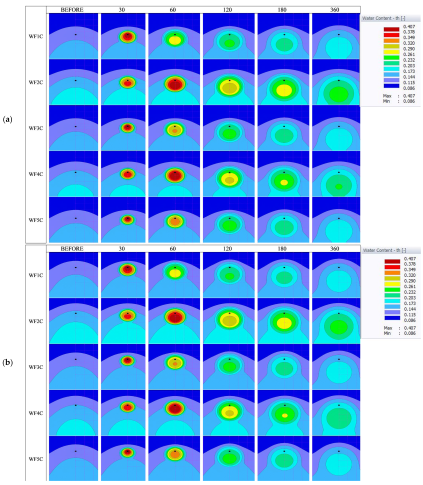
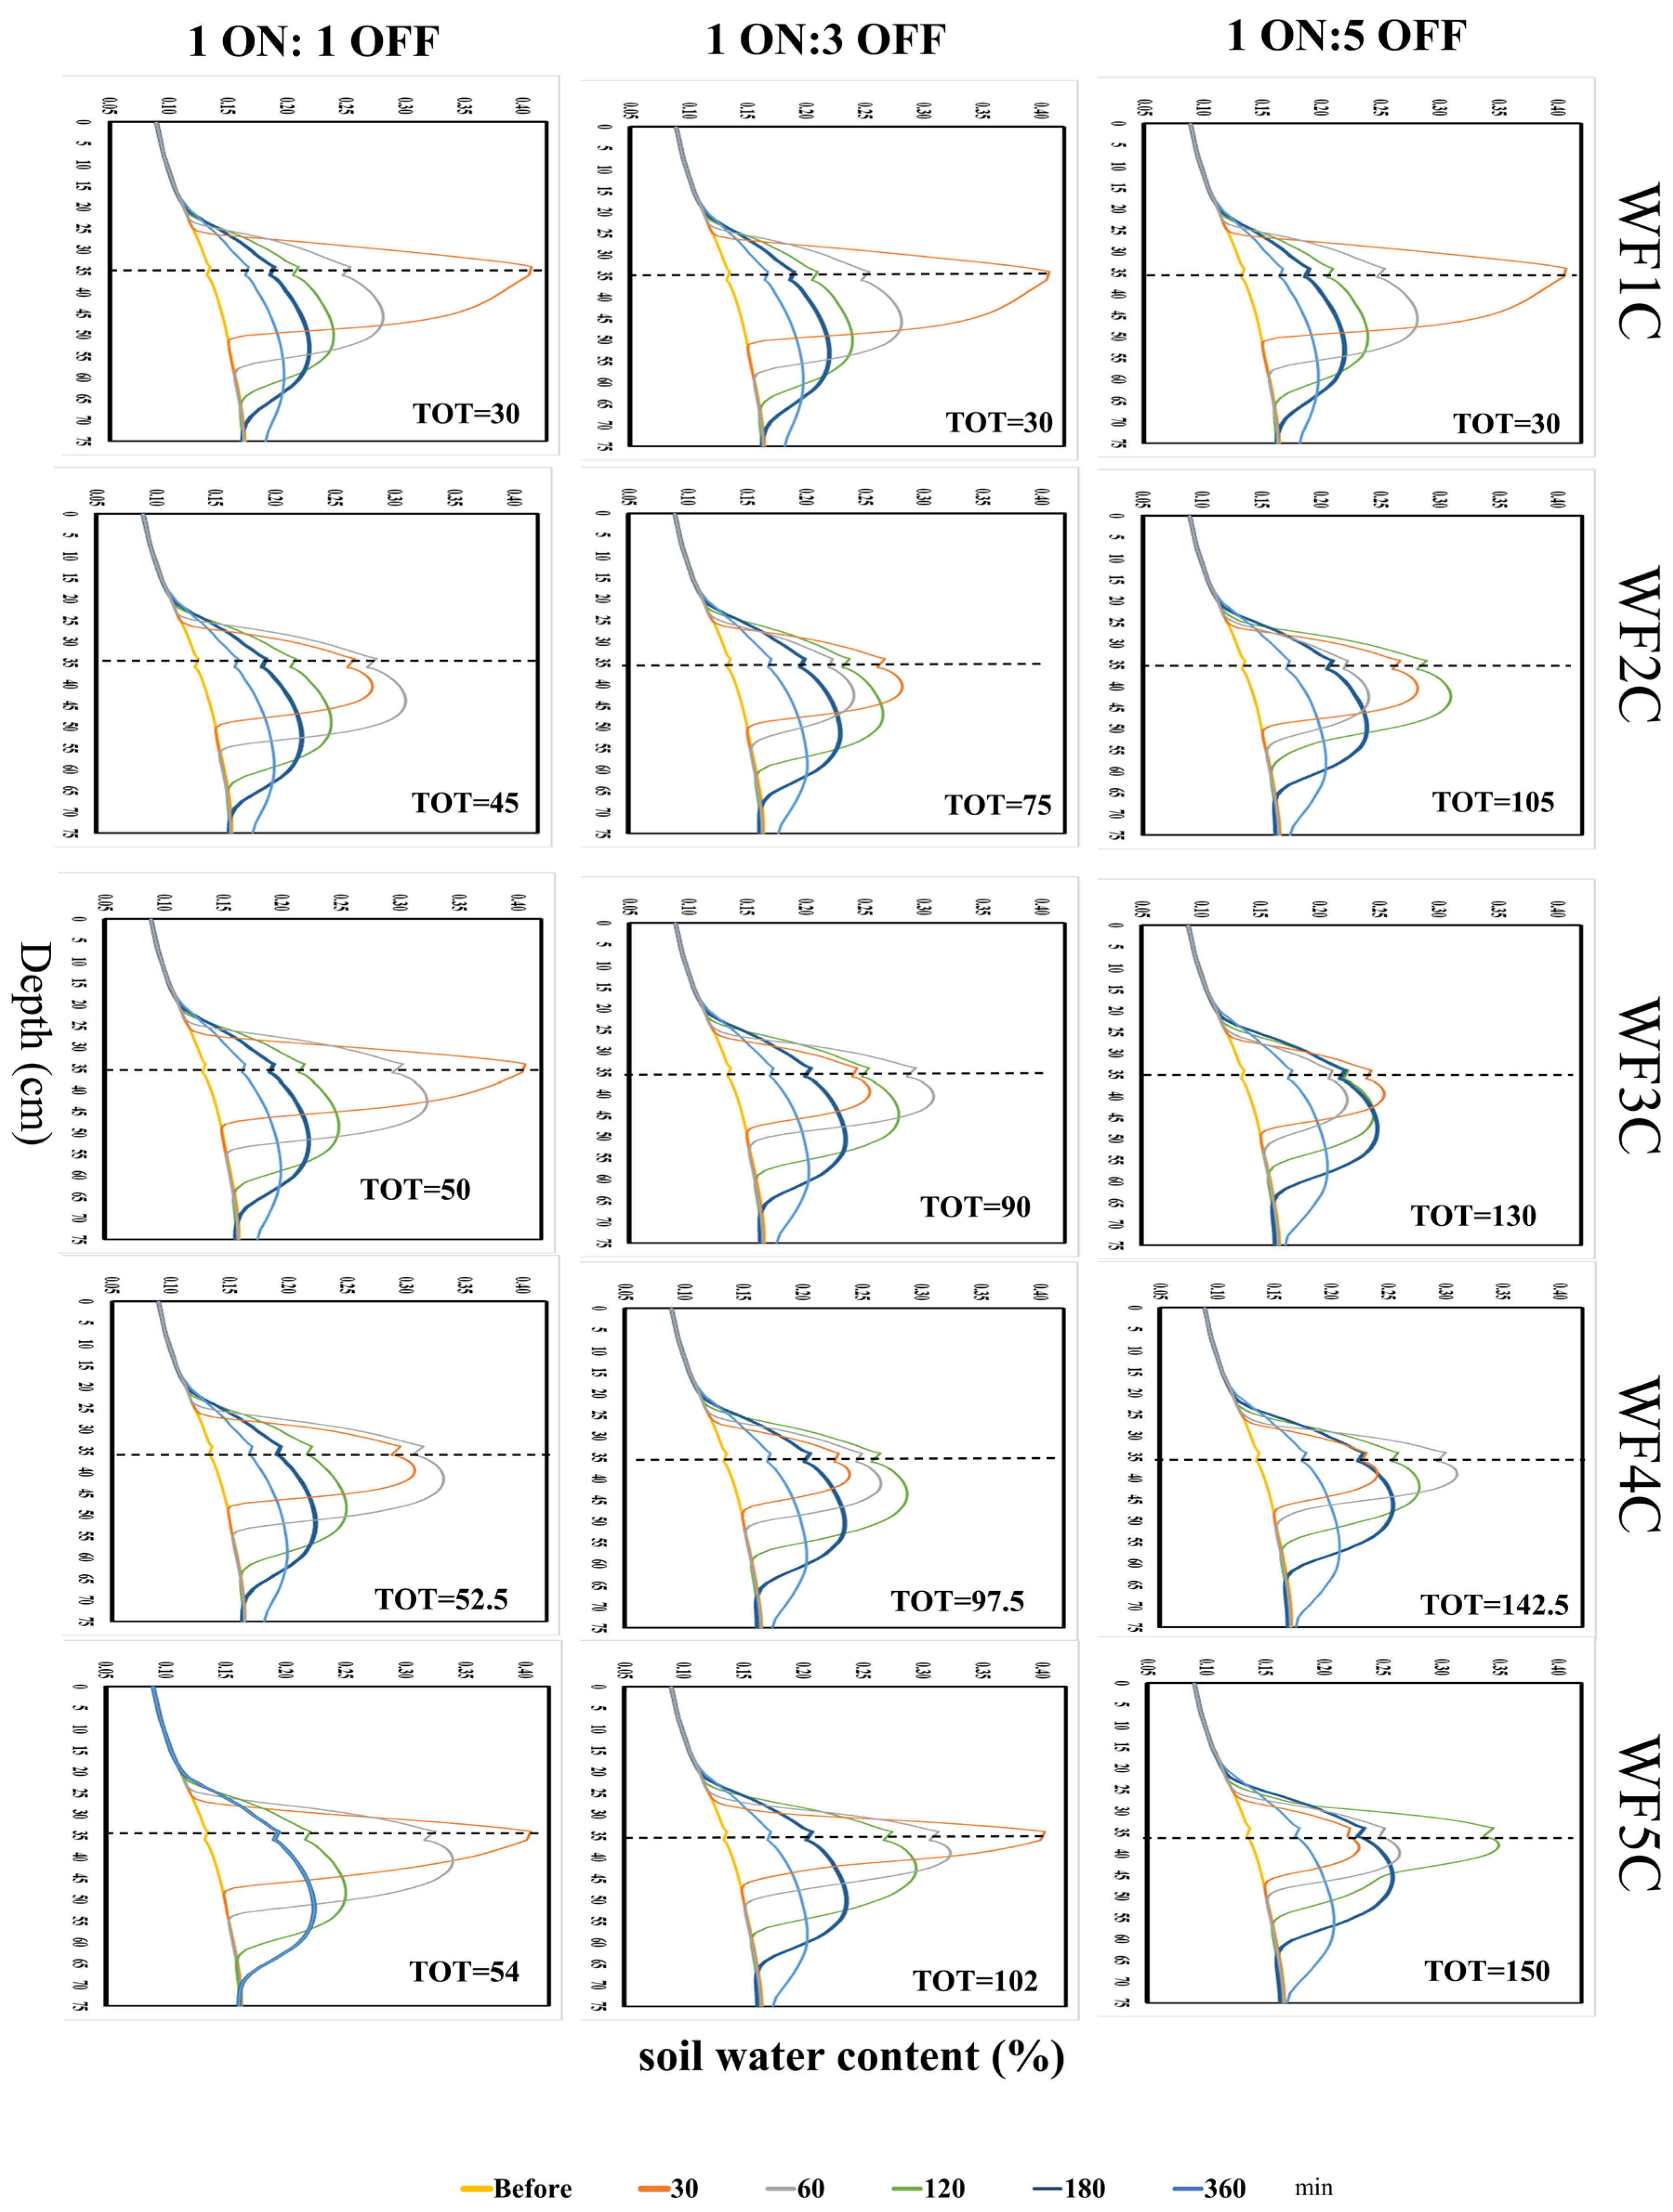
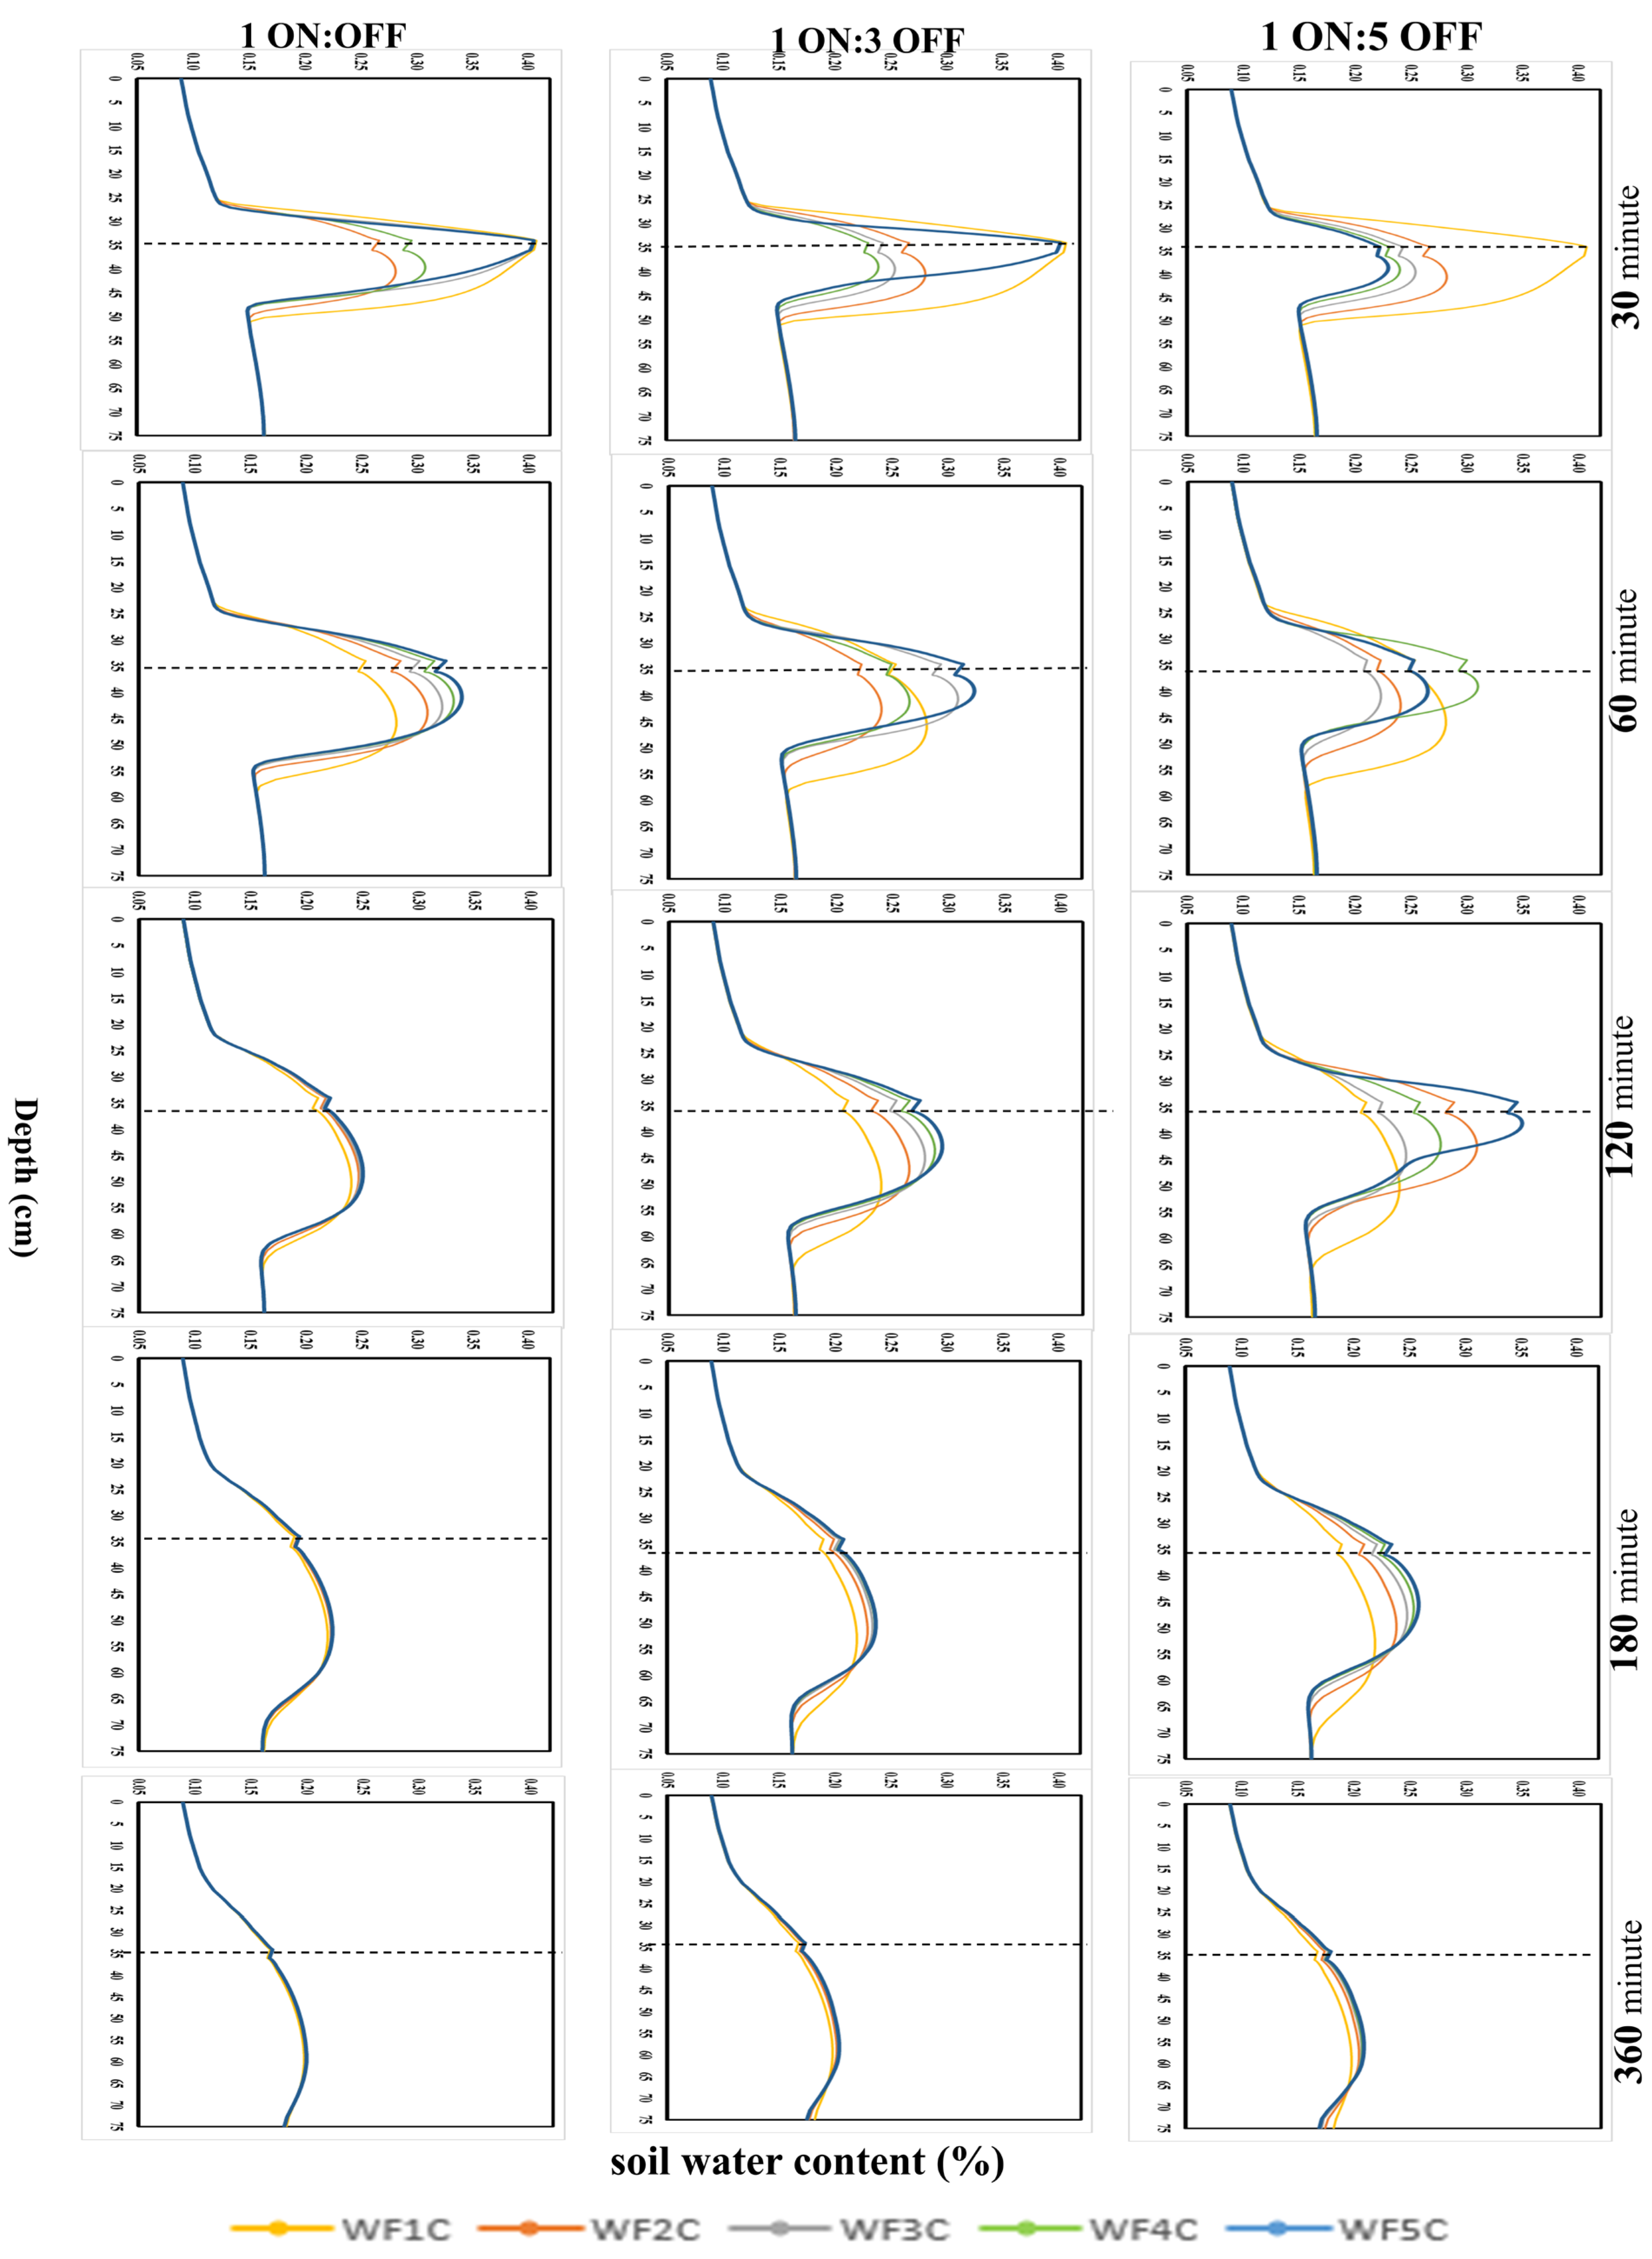
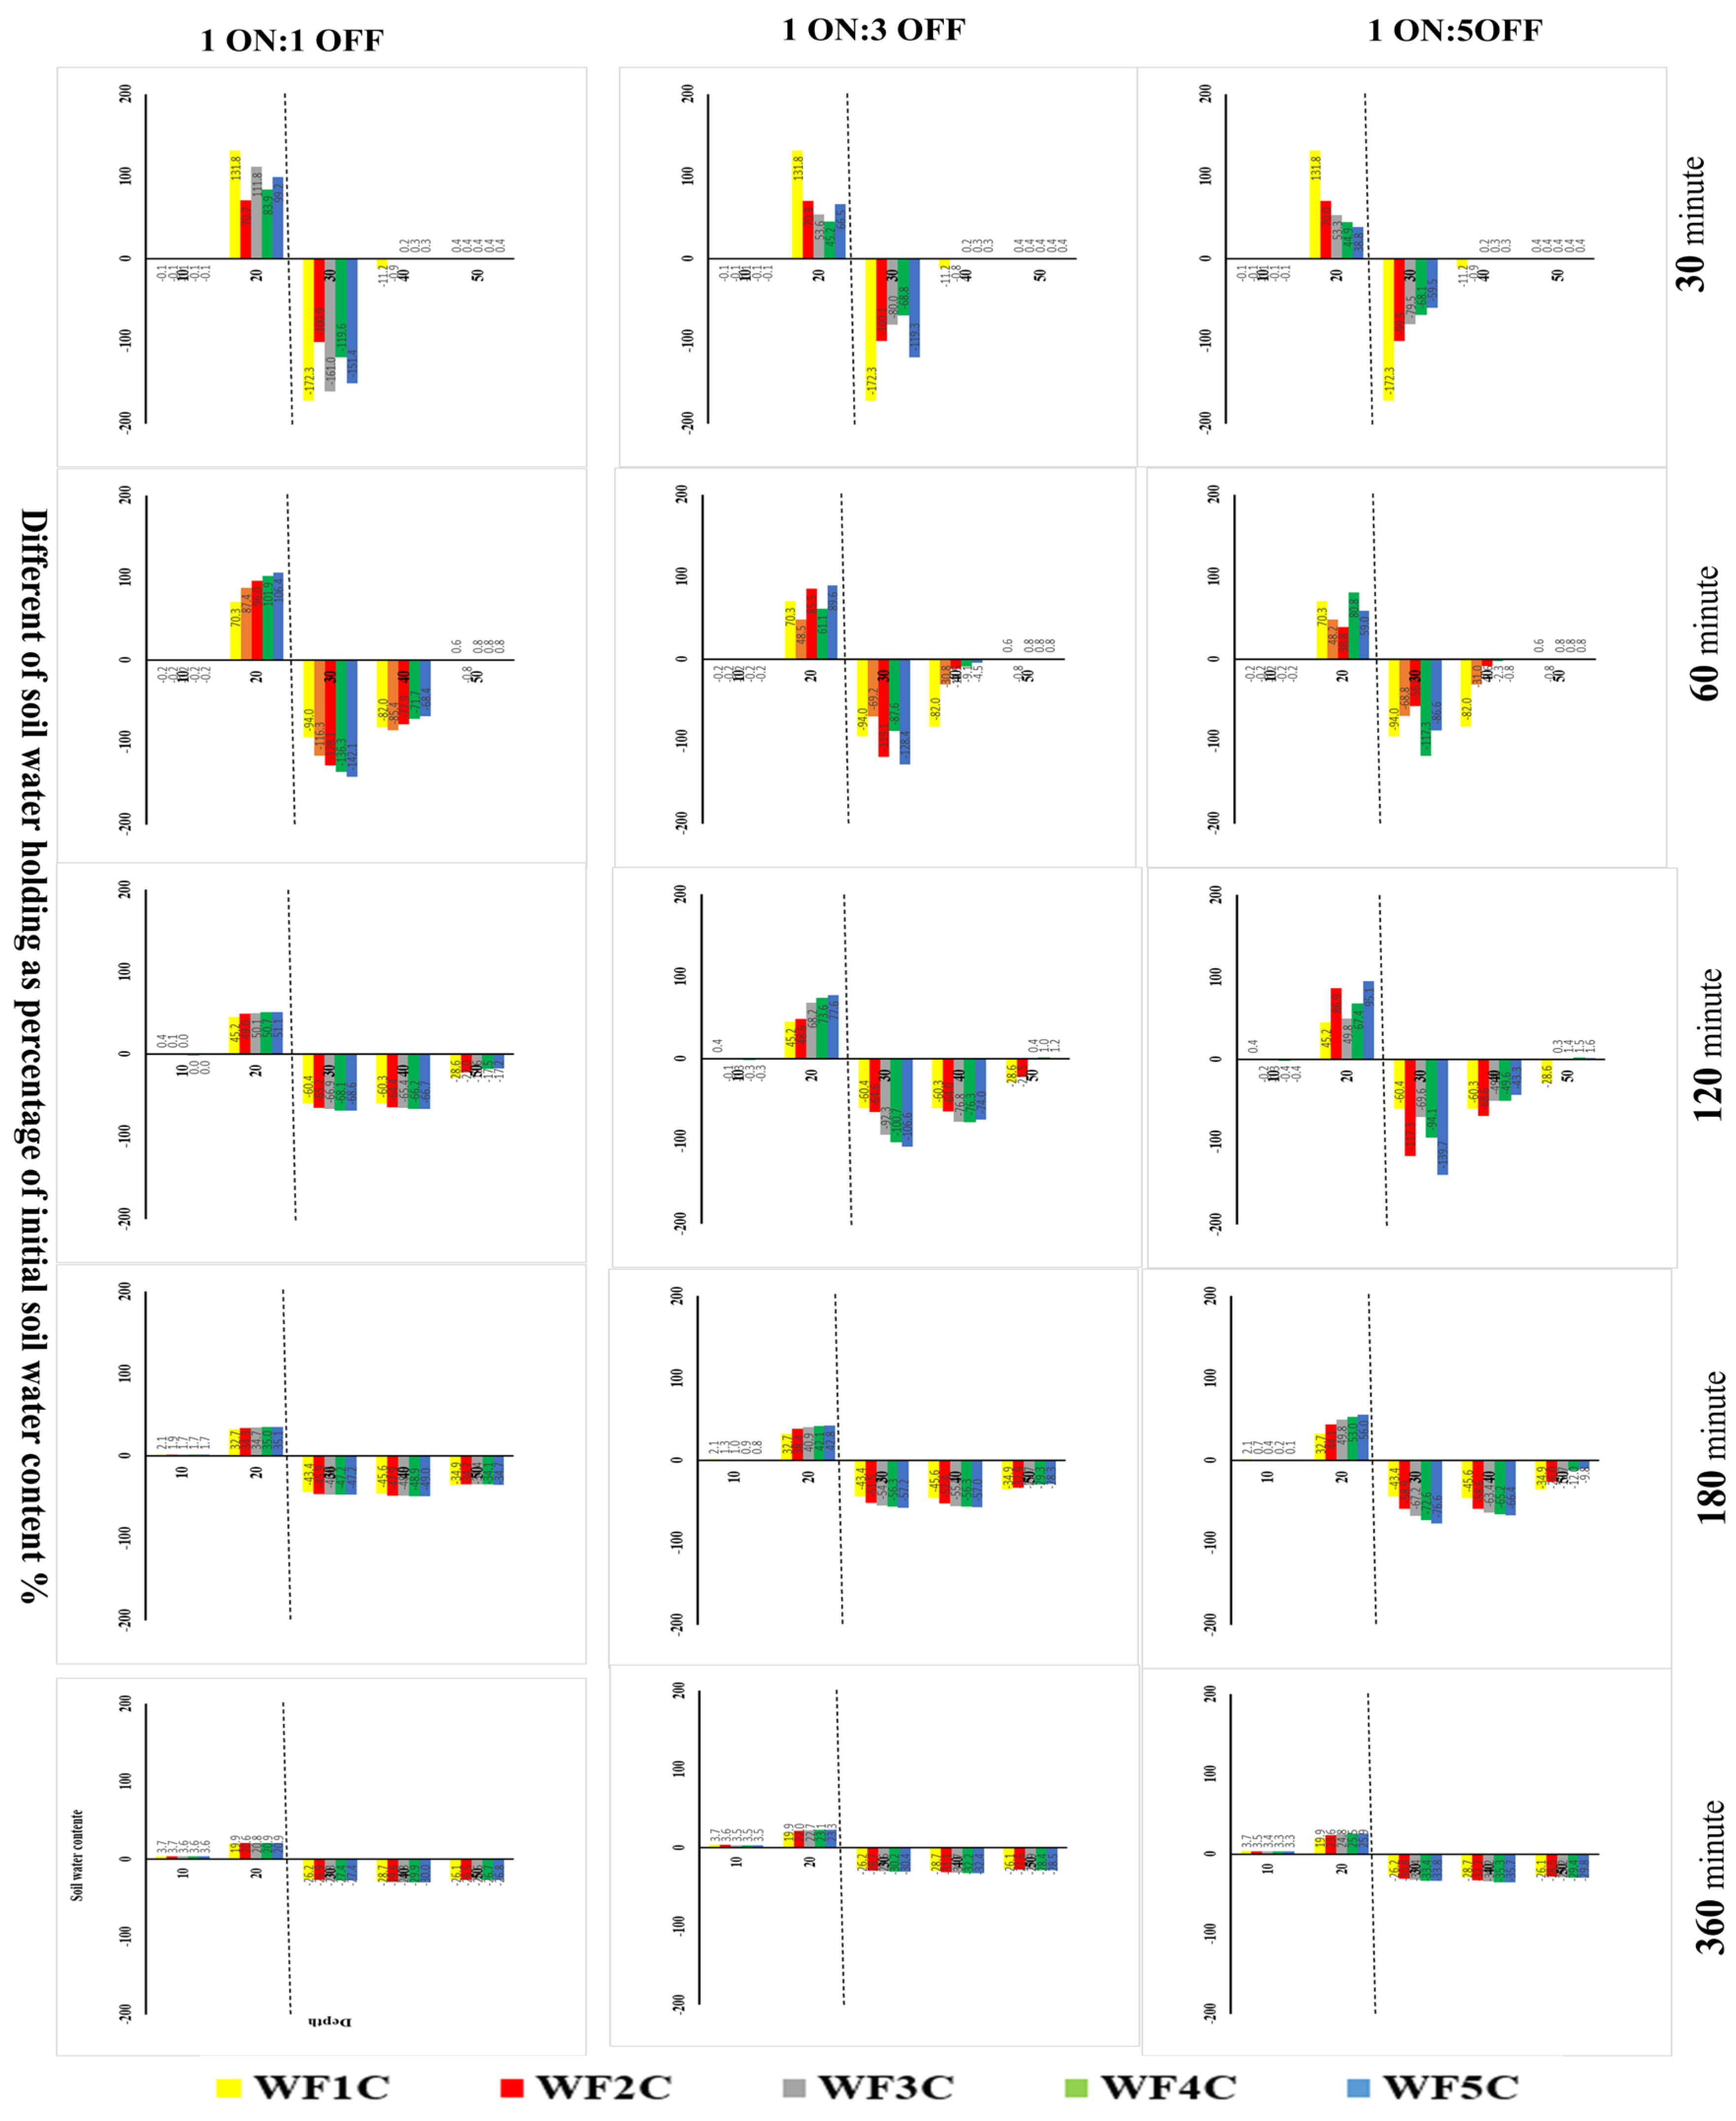
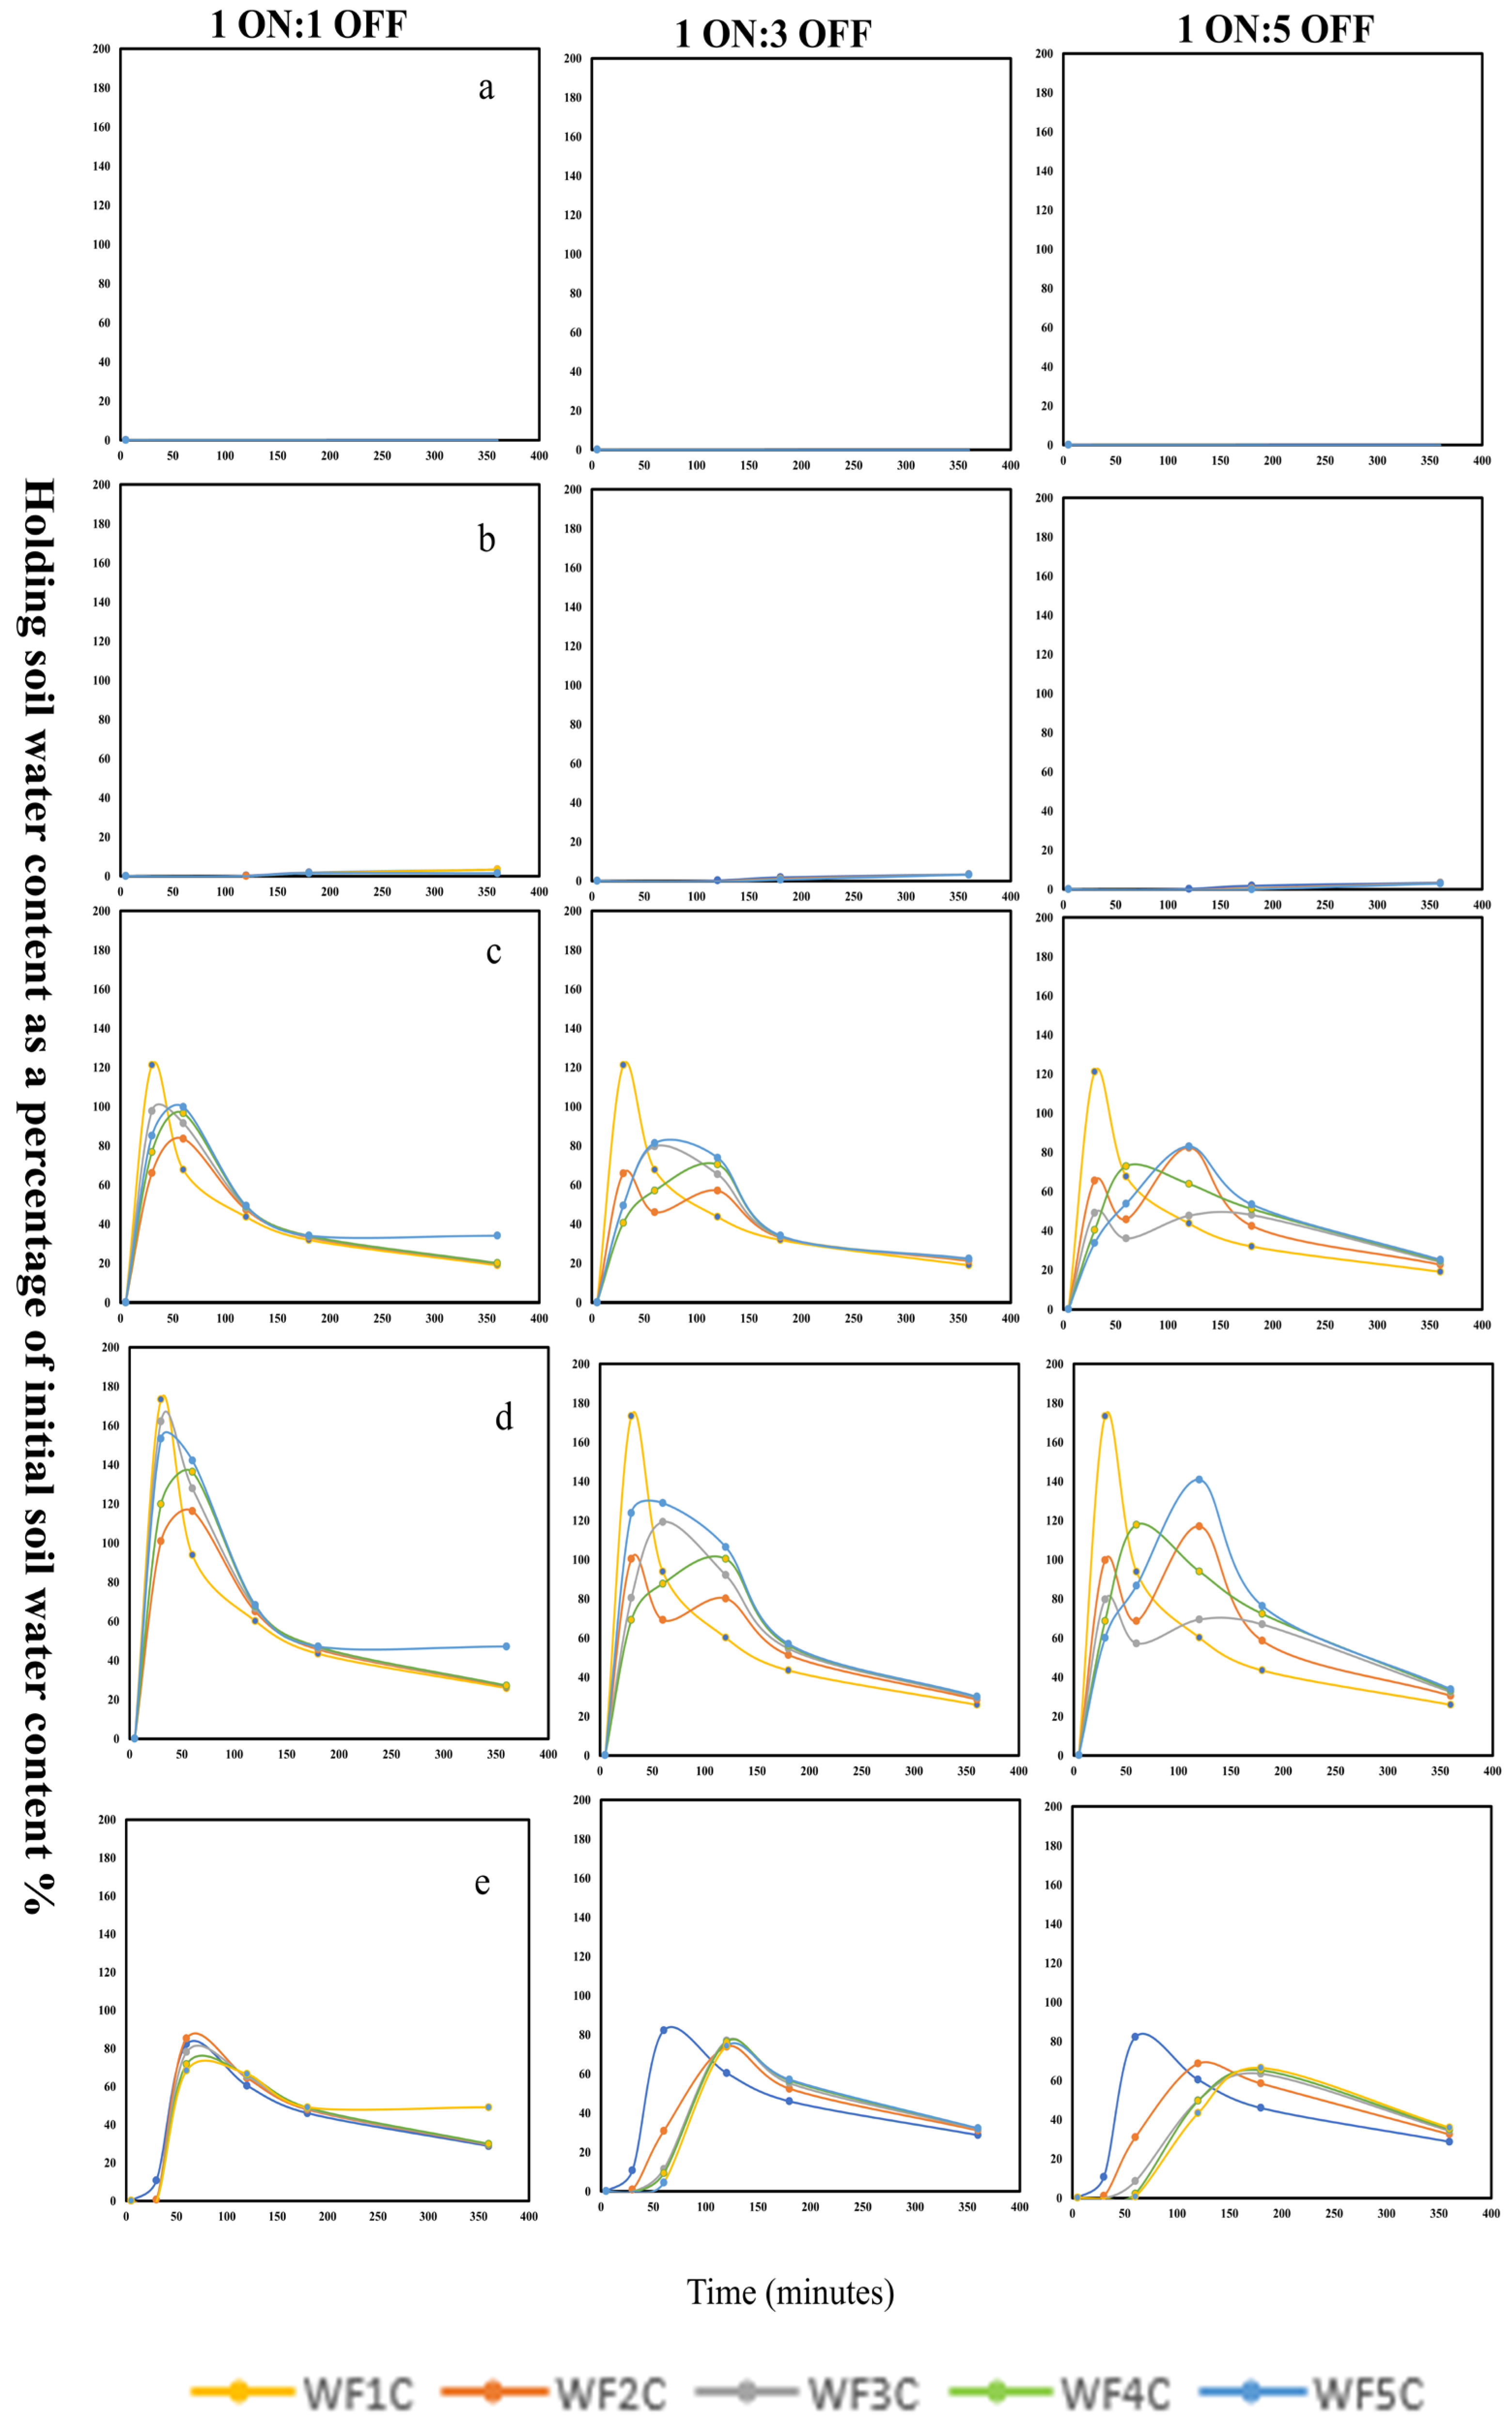
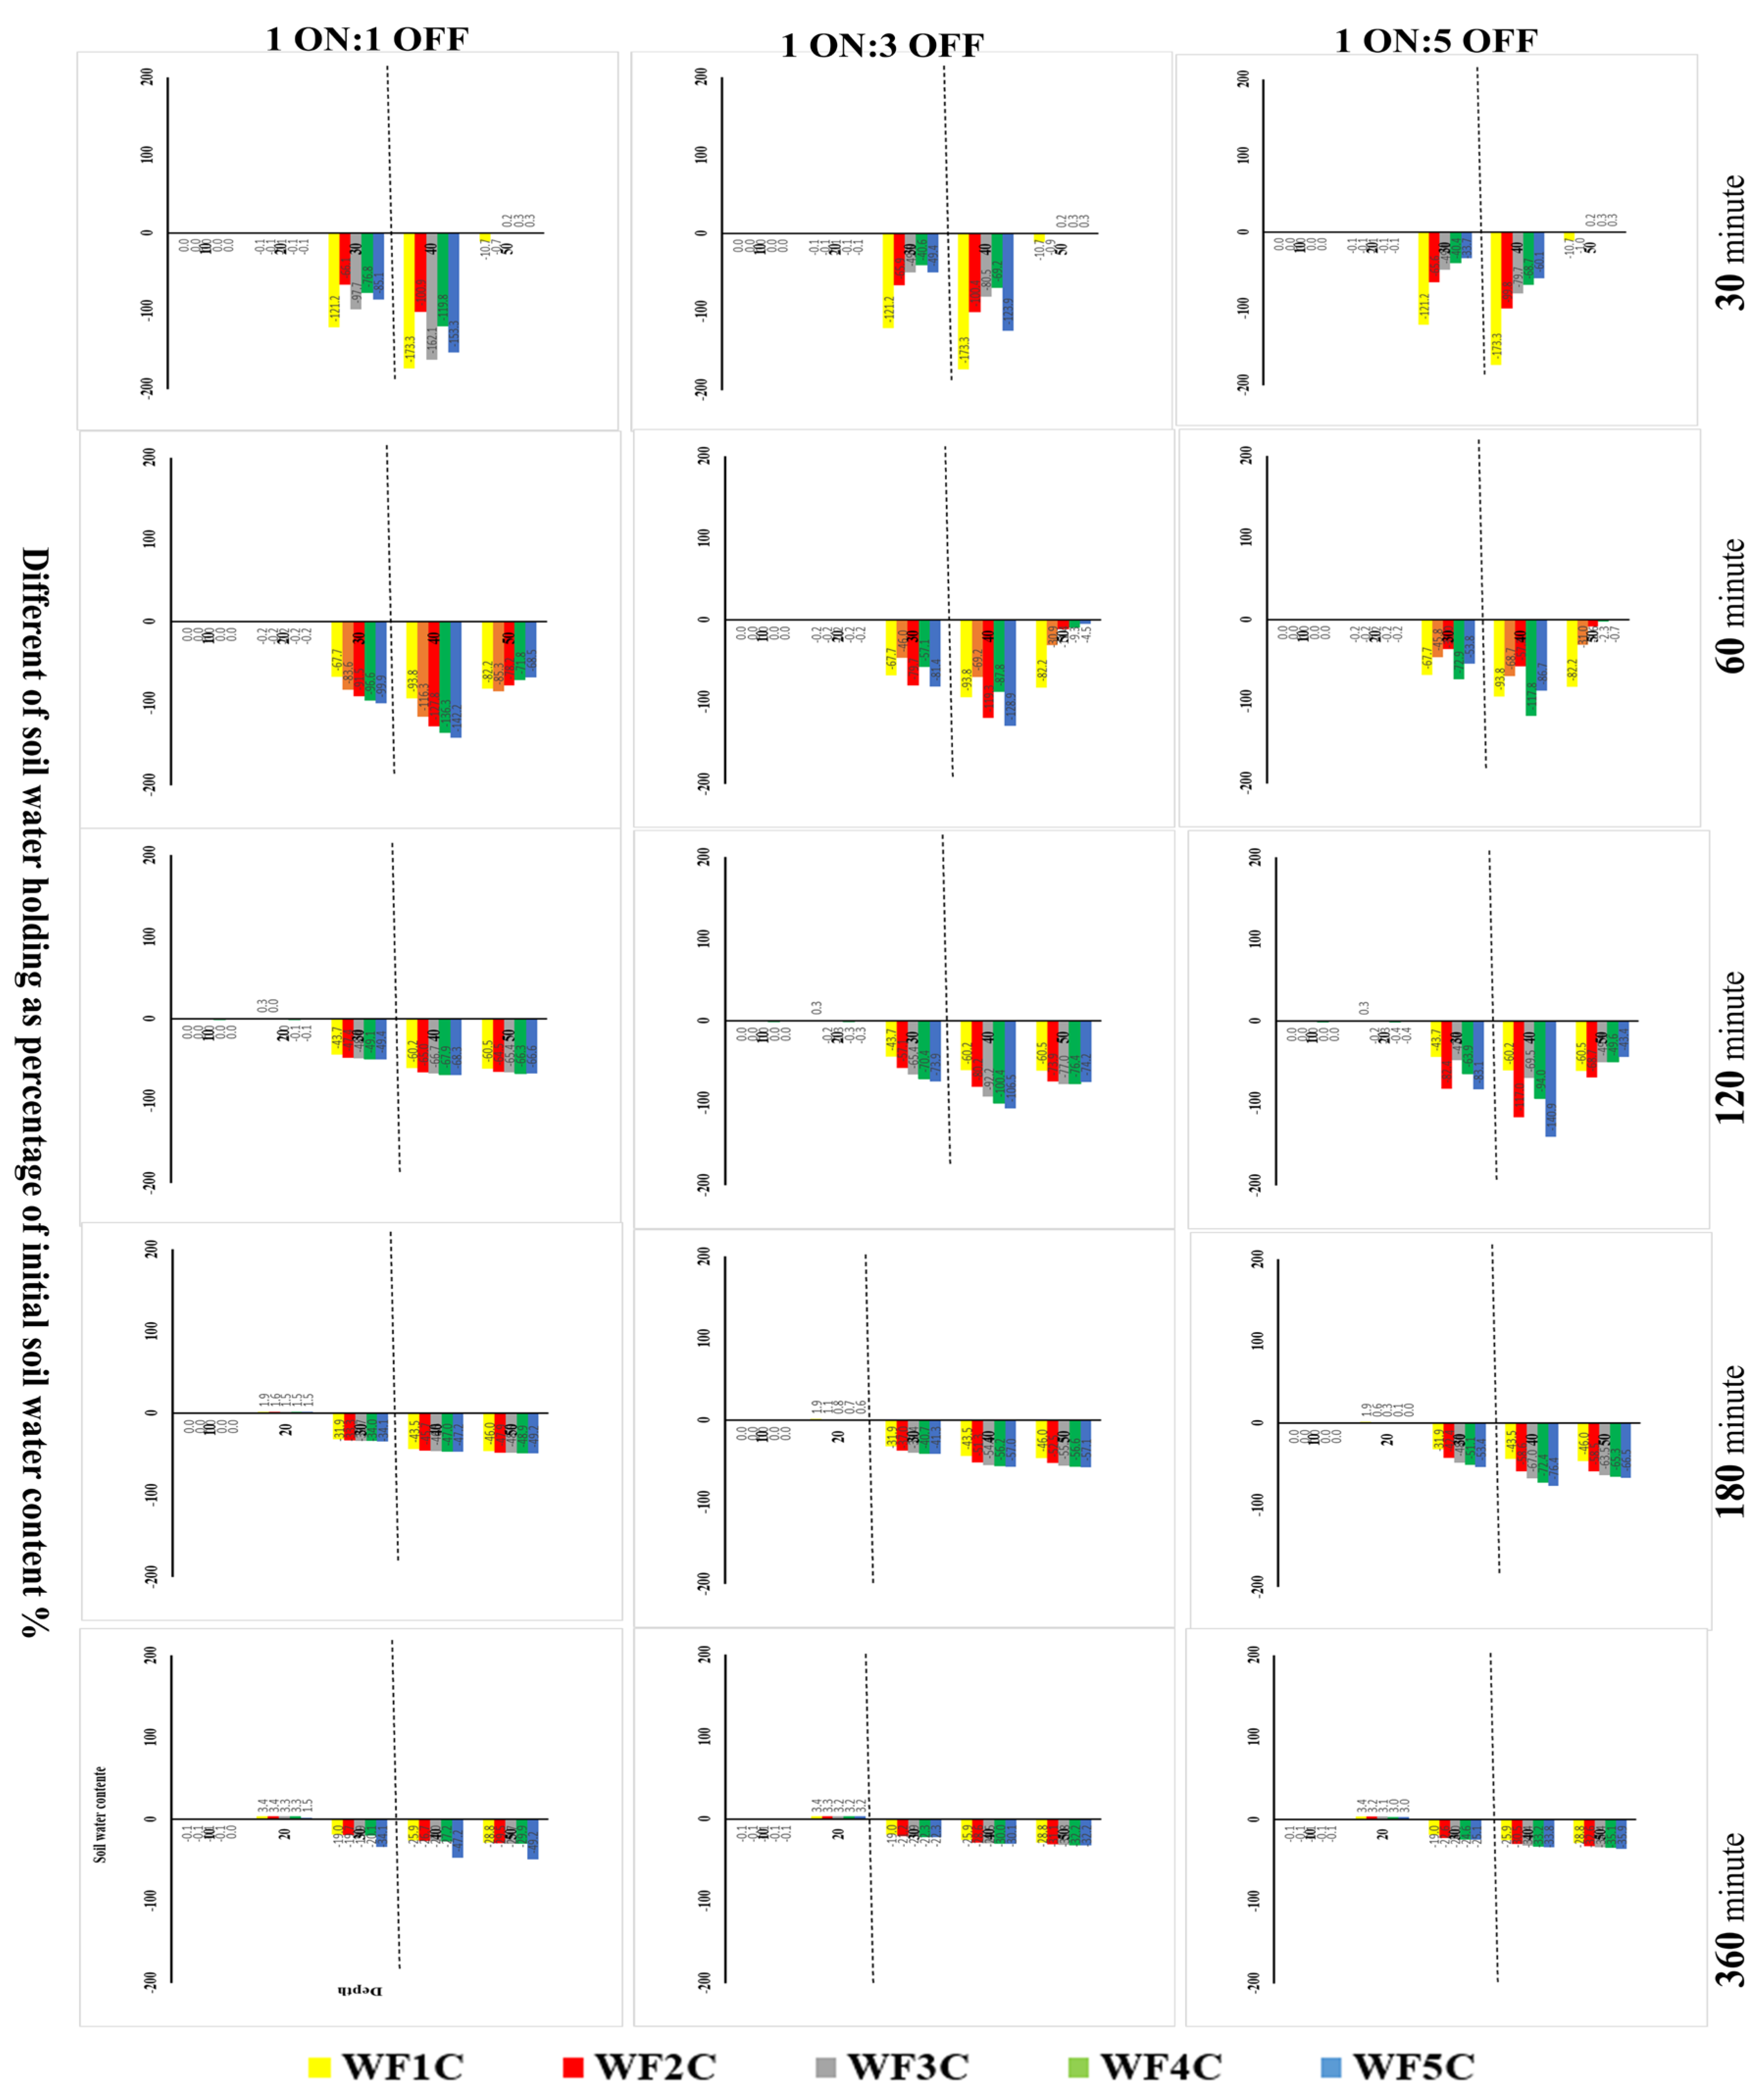
The study focuses on monitoring the relative change in soil water movement around the emitter at the soil profile ranging from 10 to 50 cm when using various flow systems (WF1C to WF5C) with subsurface water application pipes over extended periods (0 to 360 min). The Hydrus program was employed to track these results and observations, as illustrated in
Figure 2a for a depth of 35 cm and
Figure 2b for a depth of 25 cm. The program’s snapshots
Figure 2a,b,
Figure 3 and
Figure 4 illustrate the distribution of water content within the soil profile at various time intervals. These visual representations corroborate the numerical data outlined in the preceding table and figure, demonstrating the effectiveness of the different treatments in enhancing water retention.
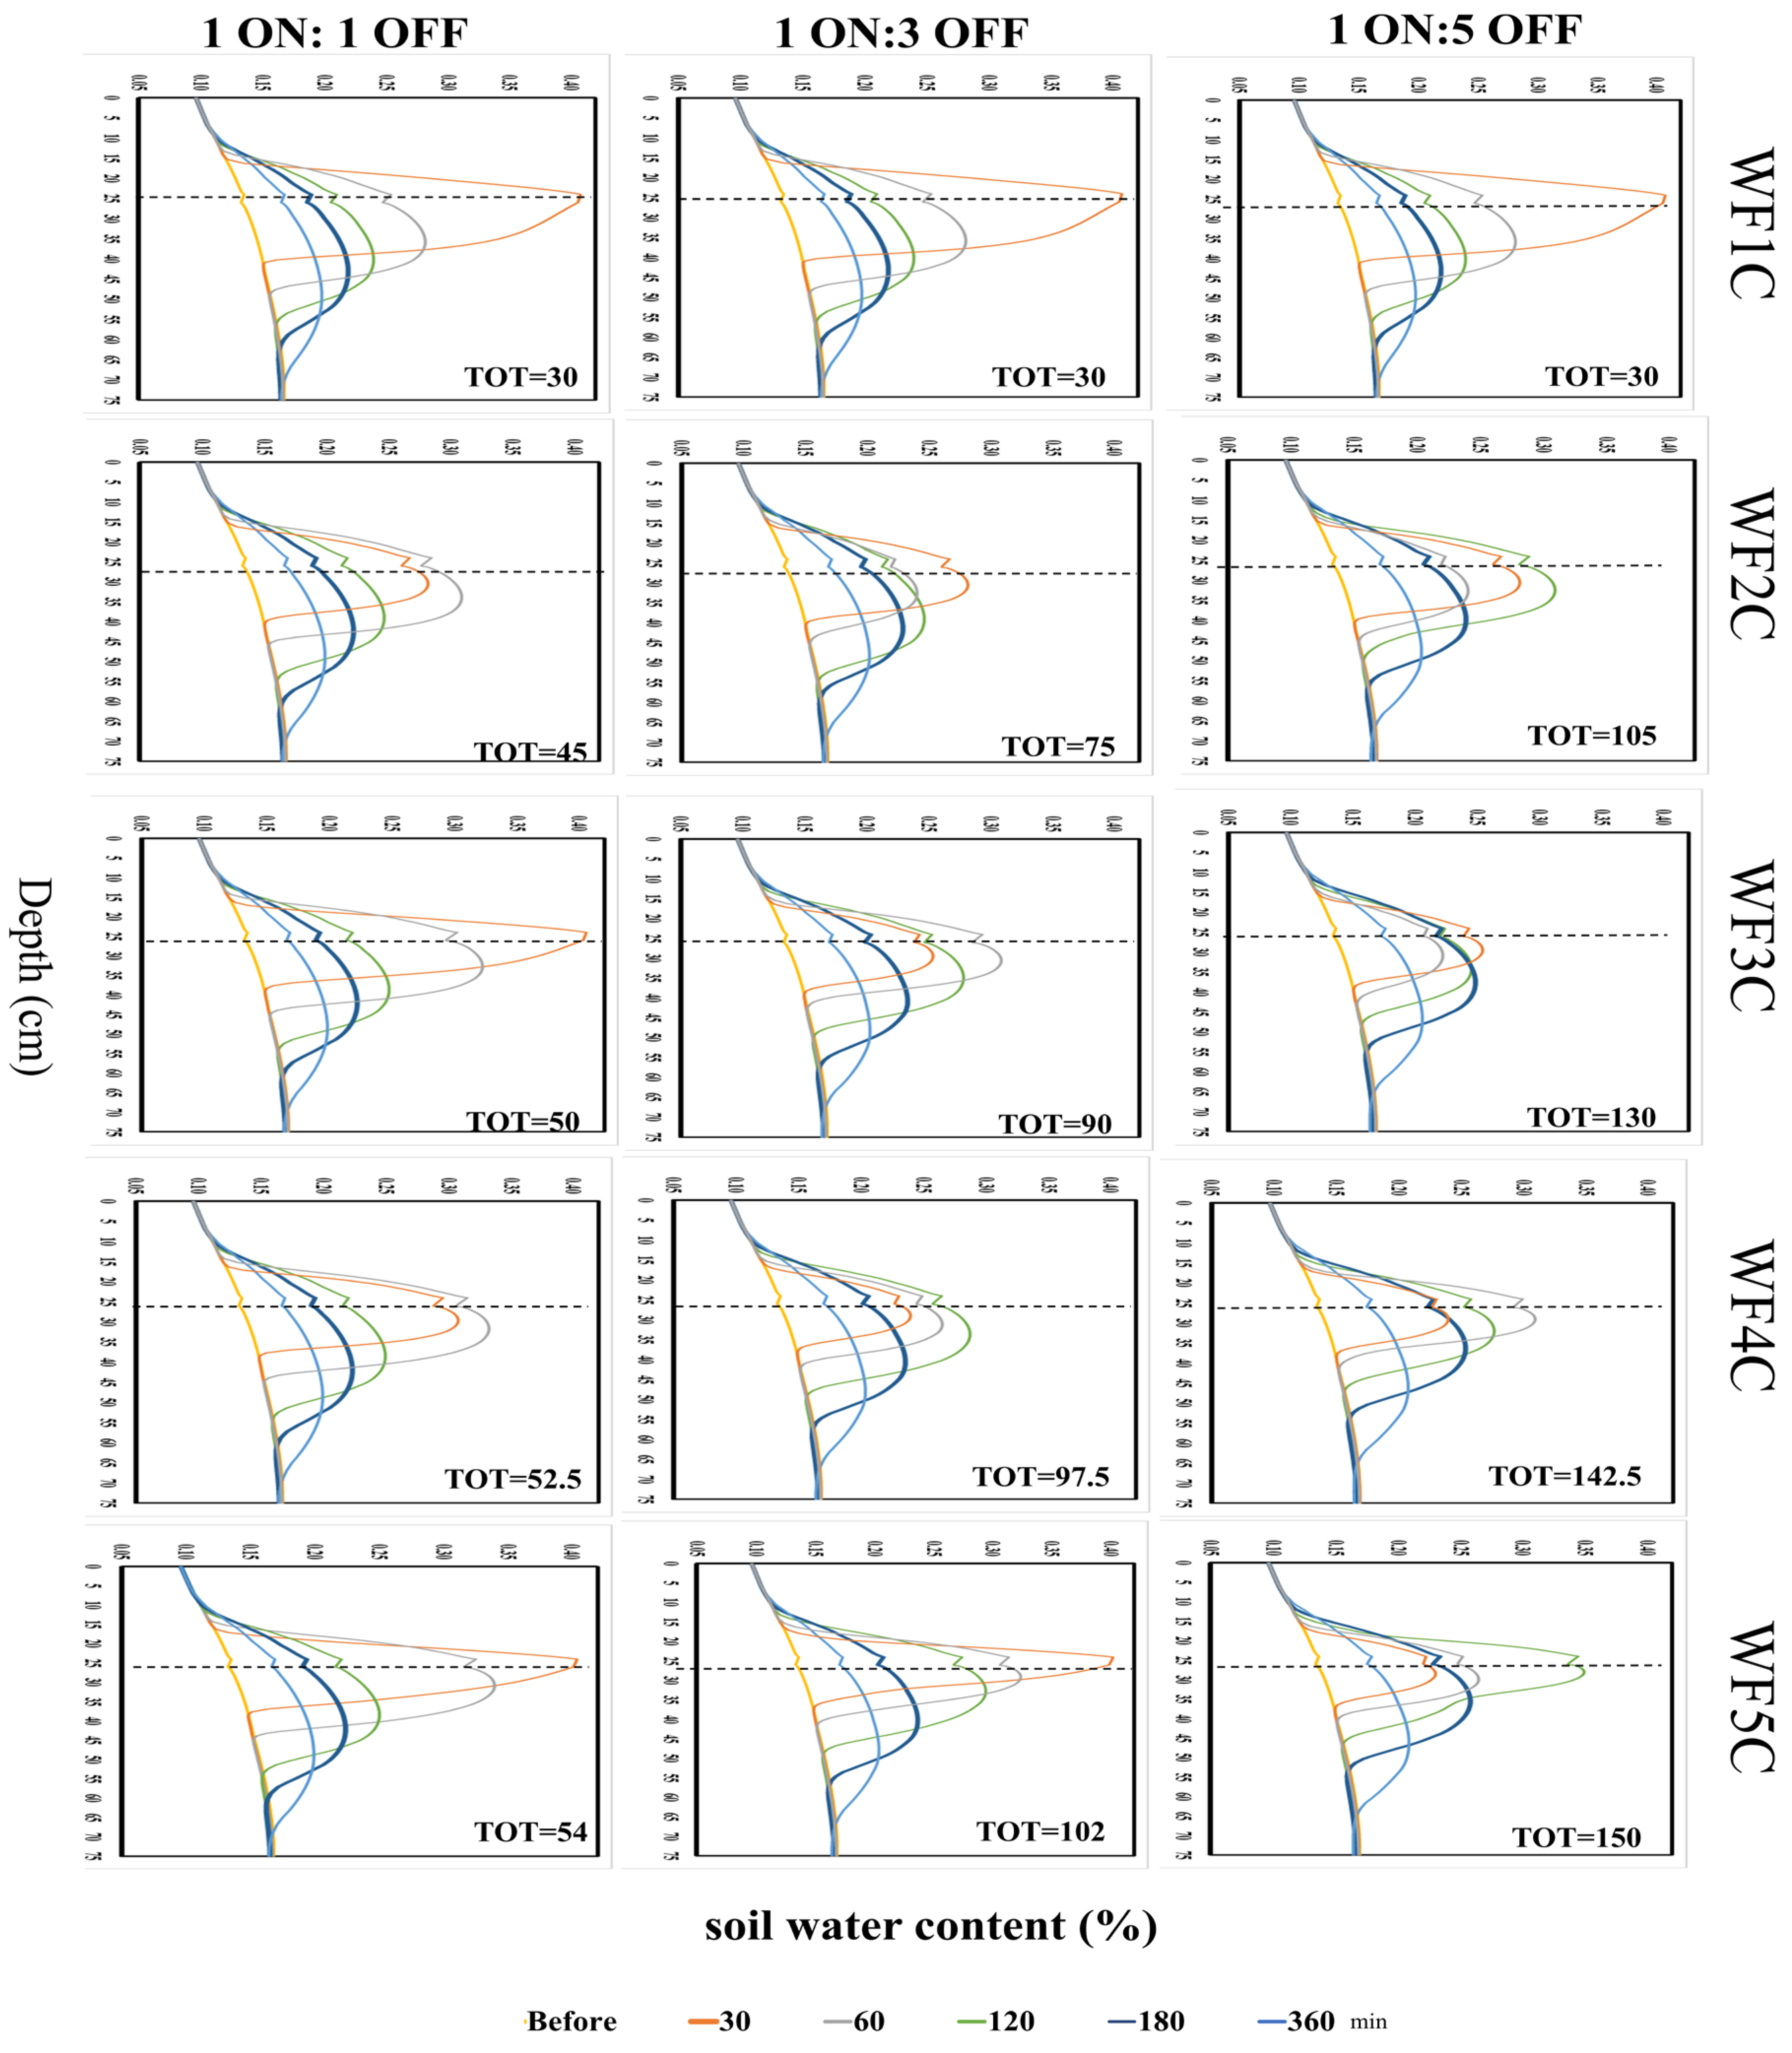
This study evaluates the effects of varying water application cycles and ON: OFF time ratios on soil water content at different depths, as shown in
Figure 3, which shows the relationship between the water content across the soil profile under the influence of changing periods of stoppage and operation at specific time periods for observation. In the continuous water application method (WF1C), a 30 min water flow resulted in maximum soil water content immediately after water application, with no variability due to the lack of OFF cycles. Then for the next cycle, the intermittent water application method (WF2C) employed two cycles. The equal stop-to-on ratio (1ON:1OFF) (45 min total) achieved a peak water content of 31% at 60 min, particularly between 15 cm and 40 cm. The 1ON:3OFF ratio (75 min) recorded a maximum of 27% at 30 min within 15–35 cm depths, while the 1ON:5OFF ratio (105 min) peaked at 31% at 1 min 20 min between 15 cm and 45 cm. Further analysis with a three-cycle intermittent method (WF3C) indicated that the 1ON:1OFF ratio (50 min) yielded peak water content at 30 min (15–35 cm), the 1ON:3OFF (90 min) peaked at 60 min (10–40 cm), and the 1ON:5OFF (130 min) maintained significant soil water content up to 30 min. Similar trends were observed in the four-cycle method (WF4C), with the 1ON:1OFF (52.5 min) showing peak soil water content at 60 min (15–45 cm) and the 1ON:4OFF (97 min) the highest content at 120 min (10–45 cm), and the 1ON:5OFF (142.5 min) the highest content at 60 min (15–35 cm). In the five-cycle intermittent configuration (WF5C), Scenario 1 (1ON:1OFF ratio, 54 min) peaked at 30 min (15–35 cm). Scenario 2 (1ON:3OFF, 102 min) also achieved maximum content at 30 min (10–45 cm), with subsequent measurements at 60 and 120 min indicating an upward trend. Scenario 3 (1ON:5OFF, 150 min) demonstrated the highest water retention, maintaining elevated levels for up to 120 min (10–40 cm). Overall, this analysis highlights the significance of intermittent water application in enhancing soil water retention, offering valuable insights for optimizing agricultural water application practices.
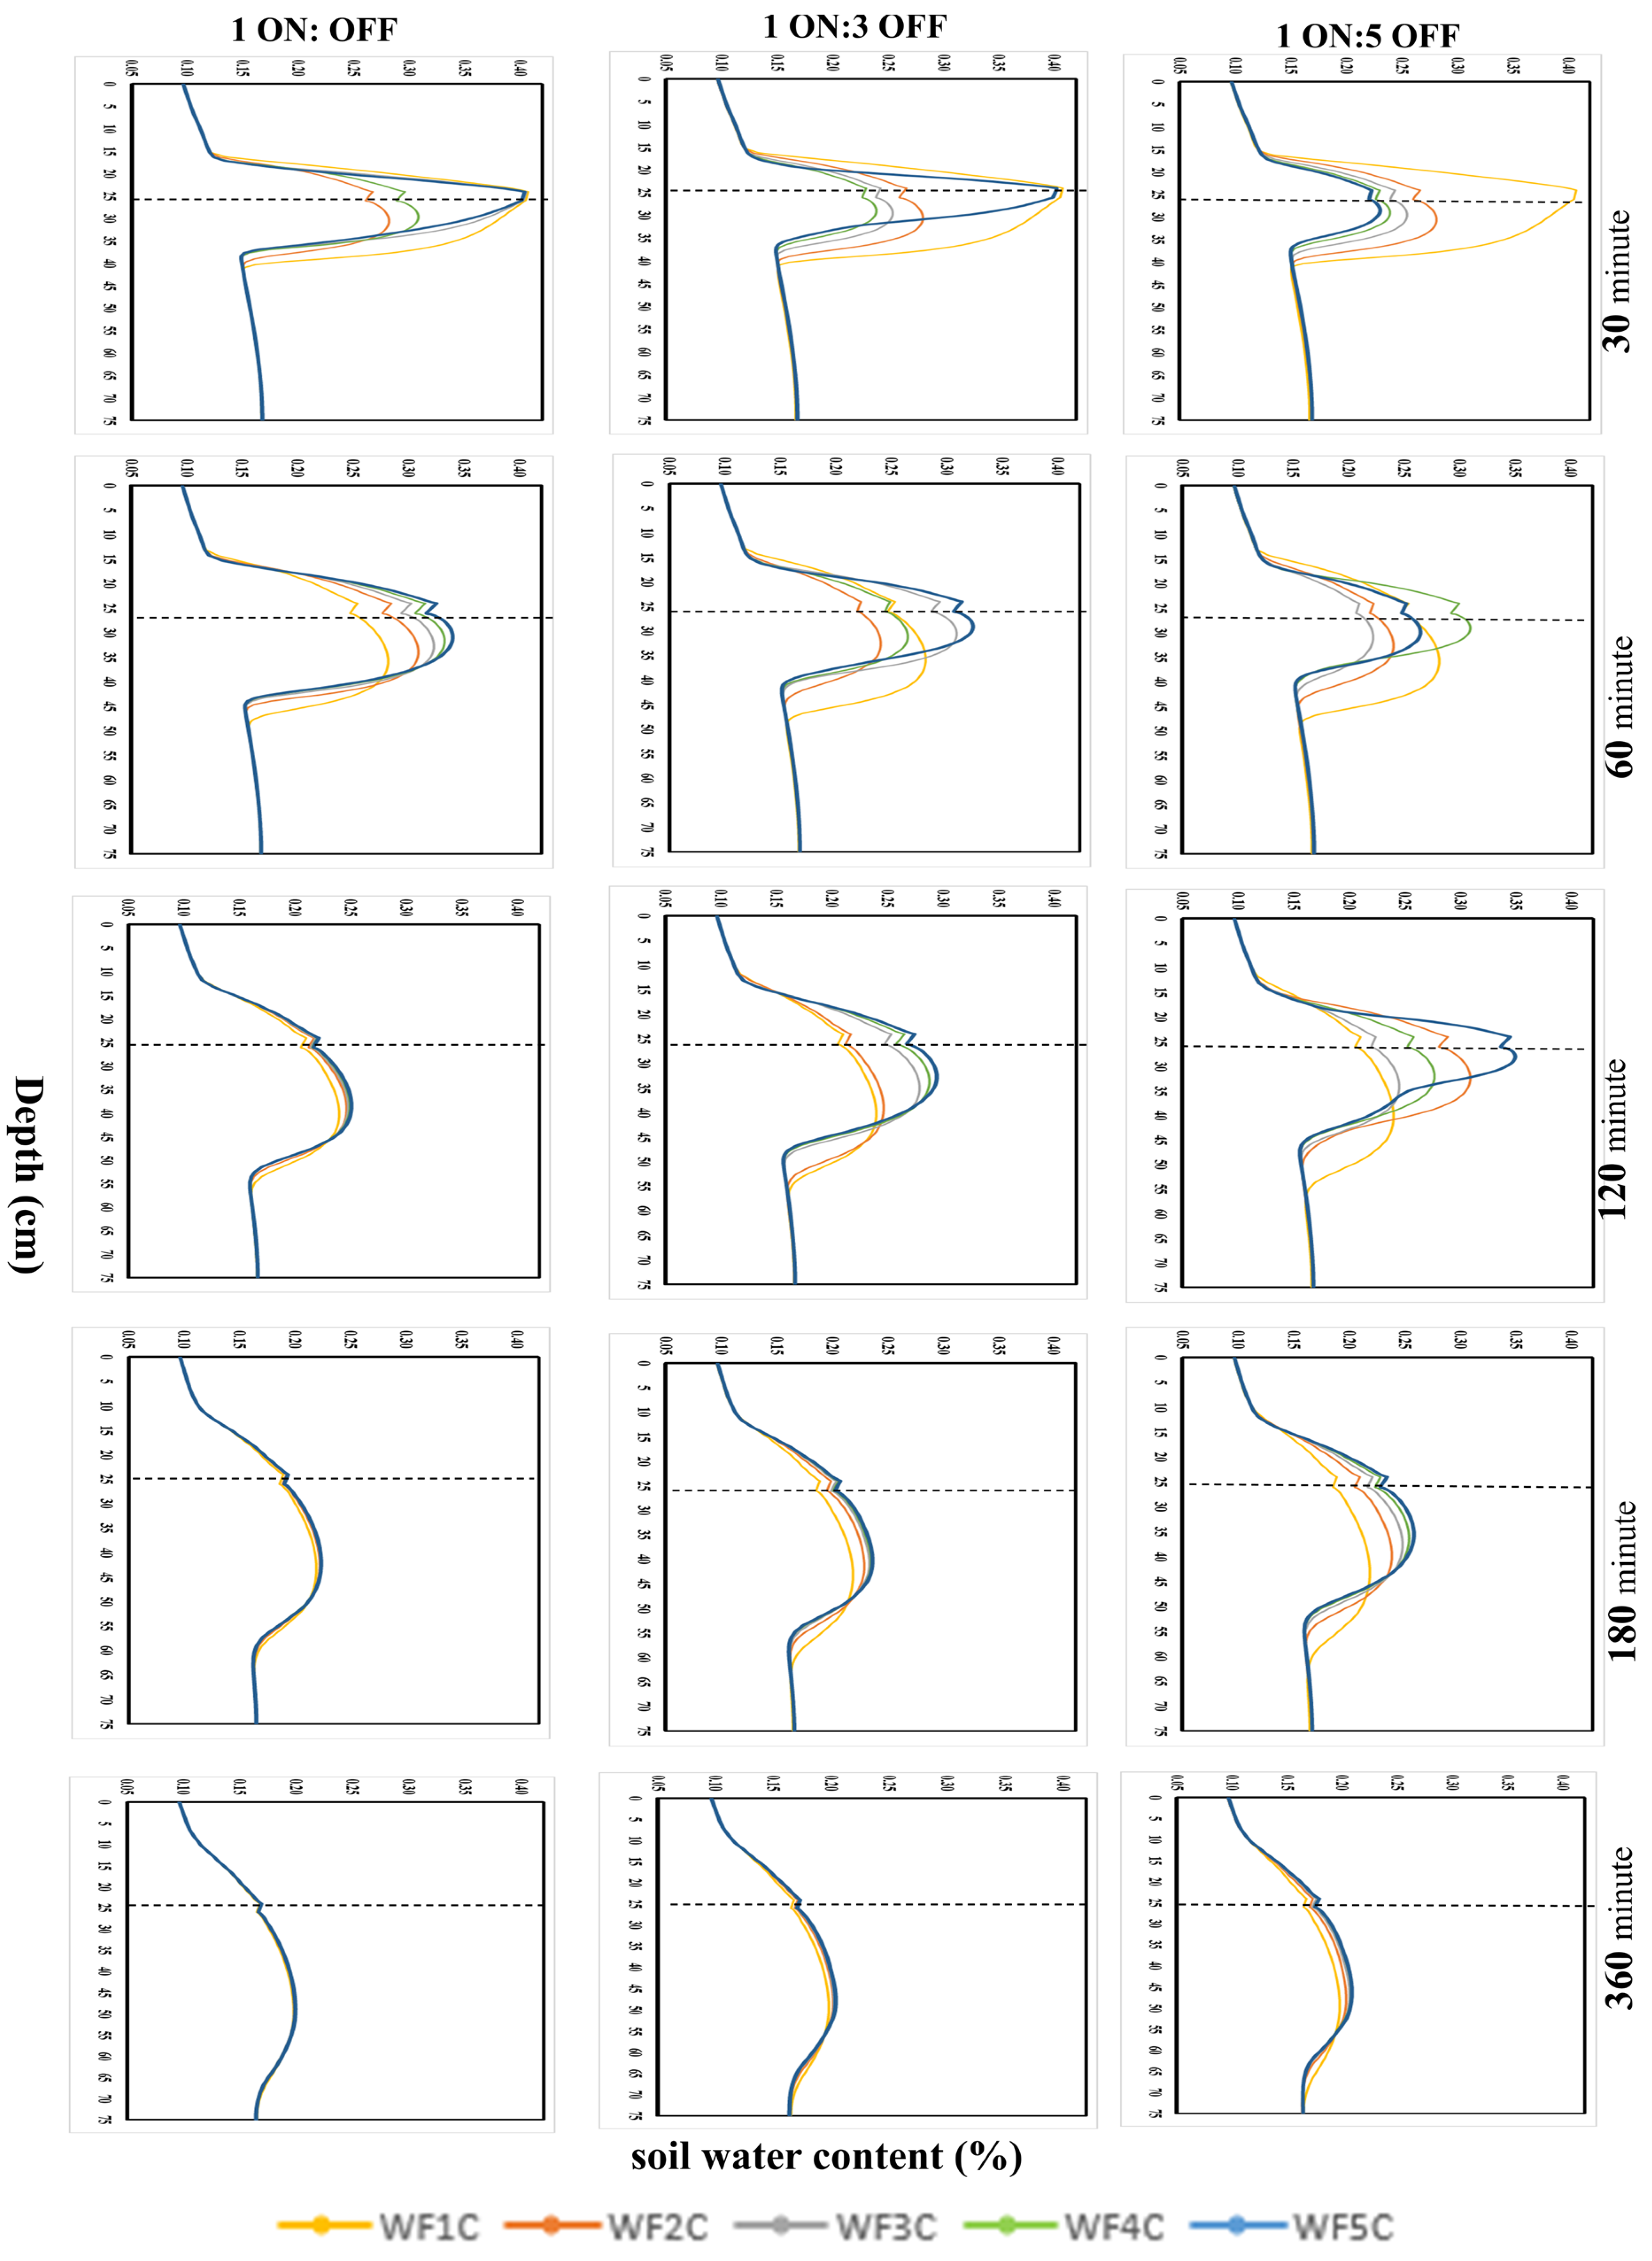
In confirmation of our study,
Figure 4 shows the relationship between the water content across the soil profile under the influence of changing the number of water addition cycles at specific observation time periods. We evaluated the effect of multiple water application cycles on water retention in the soil profile, employing five water application cycles with three different ON:OFF ratios (1ON:1OFF, 1ON:3OFF, and 1ON:5OFF). After 30 min, at a soil depth of 15 to 40 cm—optimal for root water uptake—the five-cycle methods using 1ON:OFF1 and 1ON:3OFF demonstrated significantly superior water retention compared to a one-cycle system. However, the 1ON:5OFF showed that the one-cycle model was the most effective in maintaining water content. At the 60 min, the five-cycle method again outperformed alternatives, particularly with the 1ON:1OFF and 1ON:3OFF. Enhanced upward water movement was observed with the 1ON:3OFF compared to 1ON:1OFF. Furthermore, 1ON:5OFF indicated that both four-cycle and five-cycle methods achieved the highest water retention at the measured depth. This reinforces the notion that increased cycle frequency significantly bolsters water retention capabilities. By 120 min, the differences in water application cycle counts and pause durations became evident; five cycles coupled with a 1ON:5OFF maximized water content at the targeted depth, demonstrating substantial benefits in soil water retention. At 180 min, while the water retention disparity between the 1ON:1OFF and 1ON:3OFF ratios diminished, the five-cycle method continued to show marginal superiority. Conversely, the 1ON:5OFF ratio indicated a clear trend favoring more frequent water application cycles for enhanced retention effectiveness. Ultimately, by 360 min, there were no significant differences across the water application treatments or operational ratios. This comprehensive analysis suggests that, despite all treatments proving effective, the five-cycle method incorporating a 1ON:5OFF distinctly enhances water management strategies in agricultural practices across varying time intervals.
The snapshots from the program, depicted in
Figure 3 and
Figure 4, illustrate the distribution of water content within the soil profile at various time intervals. These visual representations corroborate the numerical data presented in the preceding figure, showcasing the effectiveness of the different treatments in enhancing water retention.
Figure 5 demonstrates and clears that the analysis begins with the continuous water application method (WF1C), where a consistent 30 min water flow produced maximum soil water content immediately following water application. In contrast, the intermittent water application method (WF2C) employed two distinct cycles for the water application process. The equal stop-to-on ratio of 1ON:1OFF, with a total cycle time of 45 min, reached a peak soil water content of 31% at 60 min, particularly within the depth range of 20 cm to 55 cm. Further variations in the ON: OFF ratios highlighted significant differences in soil water retention: the 1ON:3OFF ratio (75 min total time) recorded a maximum soil water content of 27% at 30 min within the 25–45 cm depth interval, whereas the 1ON:5OFF ratio (105 min) achieved a peak of 31% at the 120 min interval, notably between 25 cm and 55 cm depths. Subsequent analysis through a three-cycle intermittent method (WF3C) revealed differing outcomes based on the ON: OFF ratios utilized. The 1ON:1OFF (50 min) produced maximum soil water content at 30 min within the 25–45 cm range. When at the 1ON:3OFF (90 min) peaked at 60 min within the 25–55 cm depth, while the 1ON:5OFF (130 min) demonstrated soil water retention, maintaining significant levels up to 30 min. A similar trend was observed in the four-cycle method (WF4C), where the 1ON:1OFF (52.5 min) exhibited peak soil water content at 60 min within the 25–55 cm range. Further examination revealed that the 1ON:3OFF (97.5 min) achieved the highest soil water content at 120 min for the 20–55 cm depth, and the 1ON:5OFF (142.5 min) peaked at 60 min for the same depth interval. The five-cycle intermittent configuration (WF5C) provided additional insights with three distinct scenarios. In Scenario 1, utilizing the 1ON:1OFF over 54 min, soil water peaked at 30 min within the 20–50 cm interval. Scenario 2 (1ON:3OFF, 102 min) similarly achieved maximum soil content at 30 min (25–45 cm), with continued measurements at 60 and 120 min indicating a positive trend in soil water retention. Notably, Scenario 3 (1ON:5OFF, 150 min) demonstrated the greatest soil water retention capability, sustaining elevated levels for up to 120 min in the 20–55 cm depth range.
As shown in
Figure 6, this study investigates the impact of multiple water application cycles on soil water retention, focusing on the efficacy of five distinct cycles with three ON: OFF ratios: 1ON:1OFF, 1ON:5OFF, and 1ON:5OFF. At a soil depth optimal for root water uptake (15 to 40 cm), we found significant differences in water retention after 30 min. Both the 1ON:1OFF and 1ON:3OFF from the five-cycle methodology exhibited markedly better water retention compared to a single-cycle system. Conversely, the 1ON:5OFF ratio indicated that the one-cycle model was more efficient in sustaining water content. After 60 min, the five-cycle methods continued to demonstrate superior performance, with the 1ON:1OFF and 1ON:3OFF ratios particularly effective in enhancing upward water movement; the 1ON:3OFF outperformed the 1ON:1OFF in this regard. The 1ON:5OFF also revealed that both four-cycle and five-cycle approaches retained the highest water content at the specified depth, reinforcing the notion that increased application frequency enhances water retention capabilities. At 120 min, clear distinctions emerged among water application cycle frequencies and their respective stop durations. Notably, as the number of cycles increased to five and the stop ratio reached five times the operation duration, the water content attained its peak at the targeted depth, indicating maximum efficiency within this water application pattern. By the 180 min interval, the difference in water retention between the 1ON:1OFF and 1ON:3OFF ratio began to narrow, though the five-cycle method maintained a slight advantage. In contrast, the 1ON:5OFF clearly demonstrated that more frequent water addition cycles improved overall retention efficacy, further highlighting the superiority of the five-cycle strategy. Ultimately, at the 360 min point, no substantial differences were observed among the water application treatments or operational ratios. Collectively, these findings underscore that while all water application treatments proved effective, the five-cycle method utilizing a 1ON:5OFF stands out as the most advantageous approach for enhancing water management practices in agriculture across varying timeframes.
4. Discussion
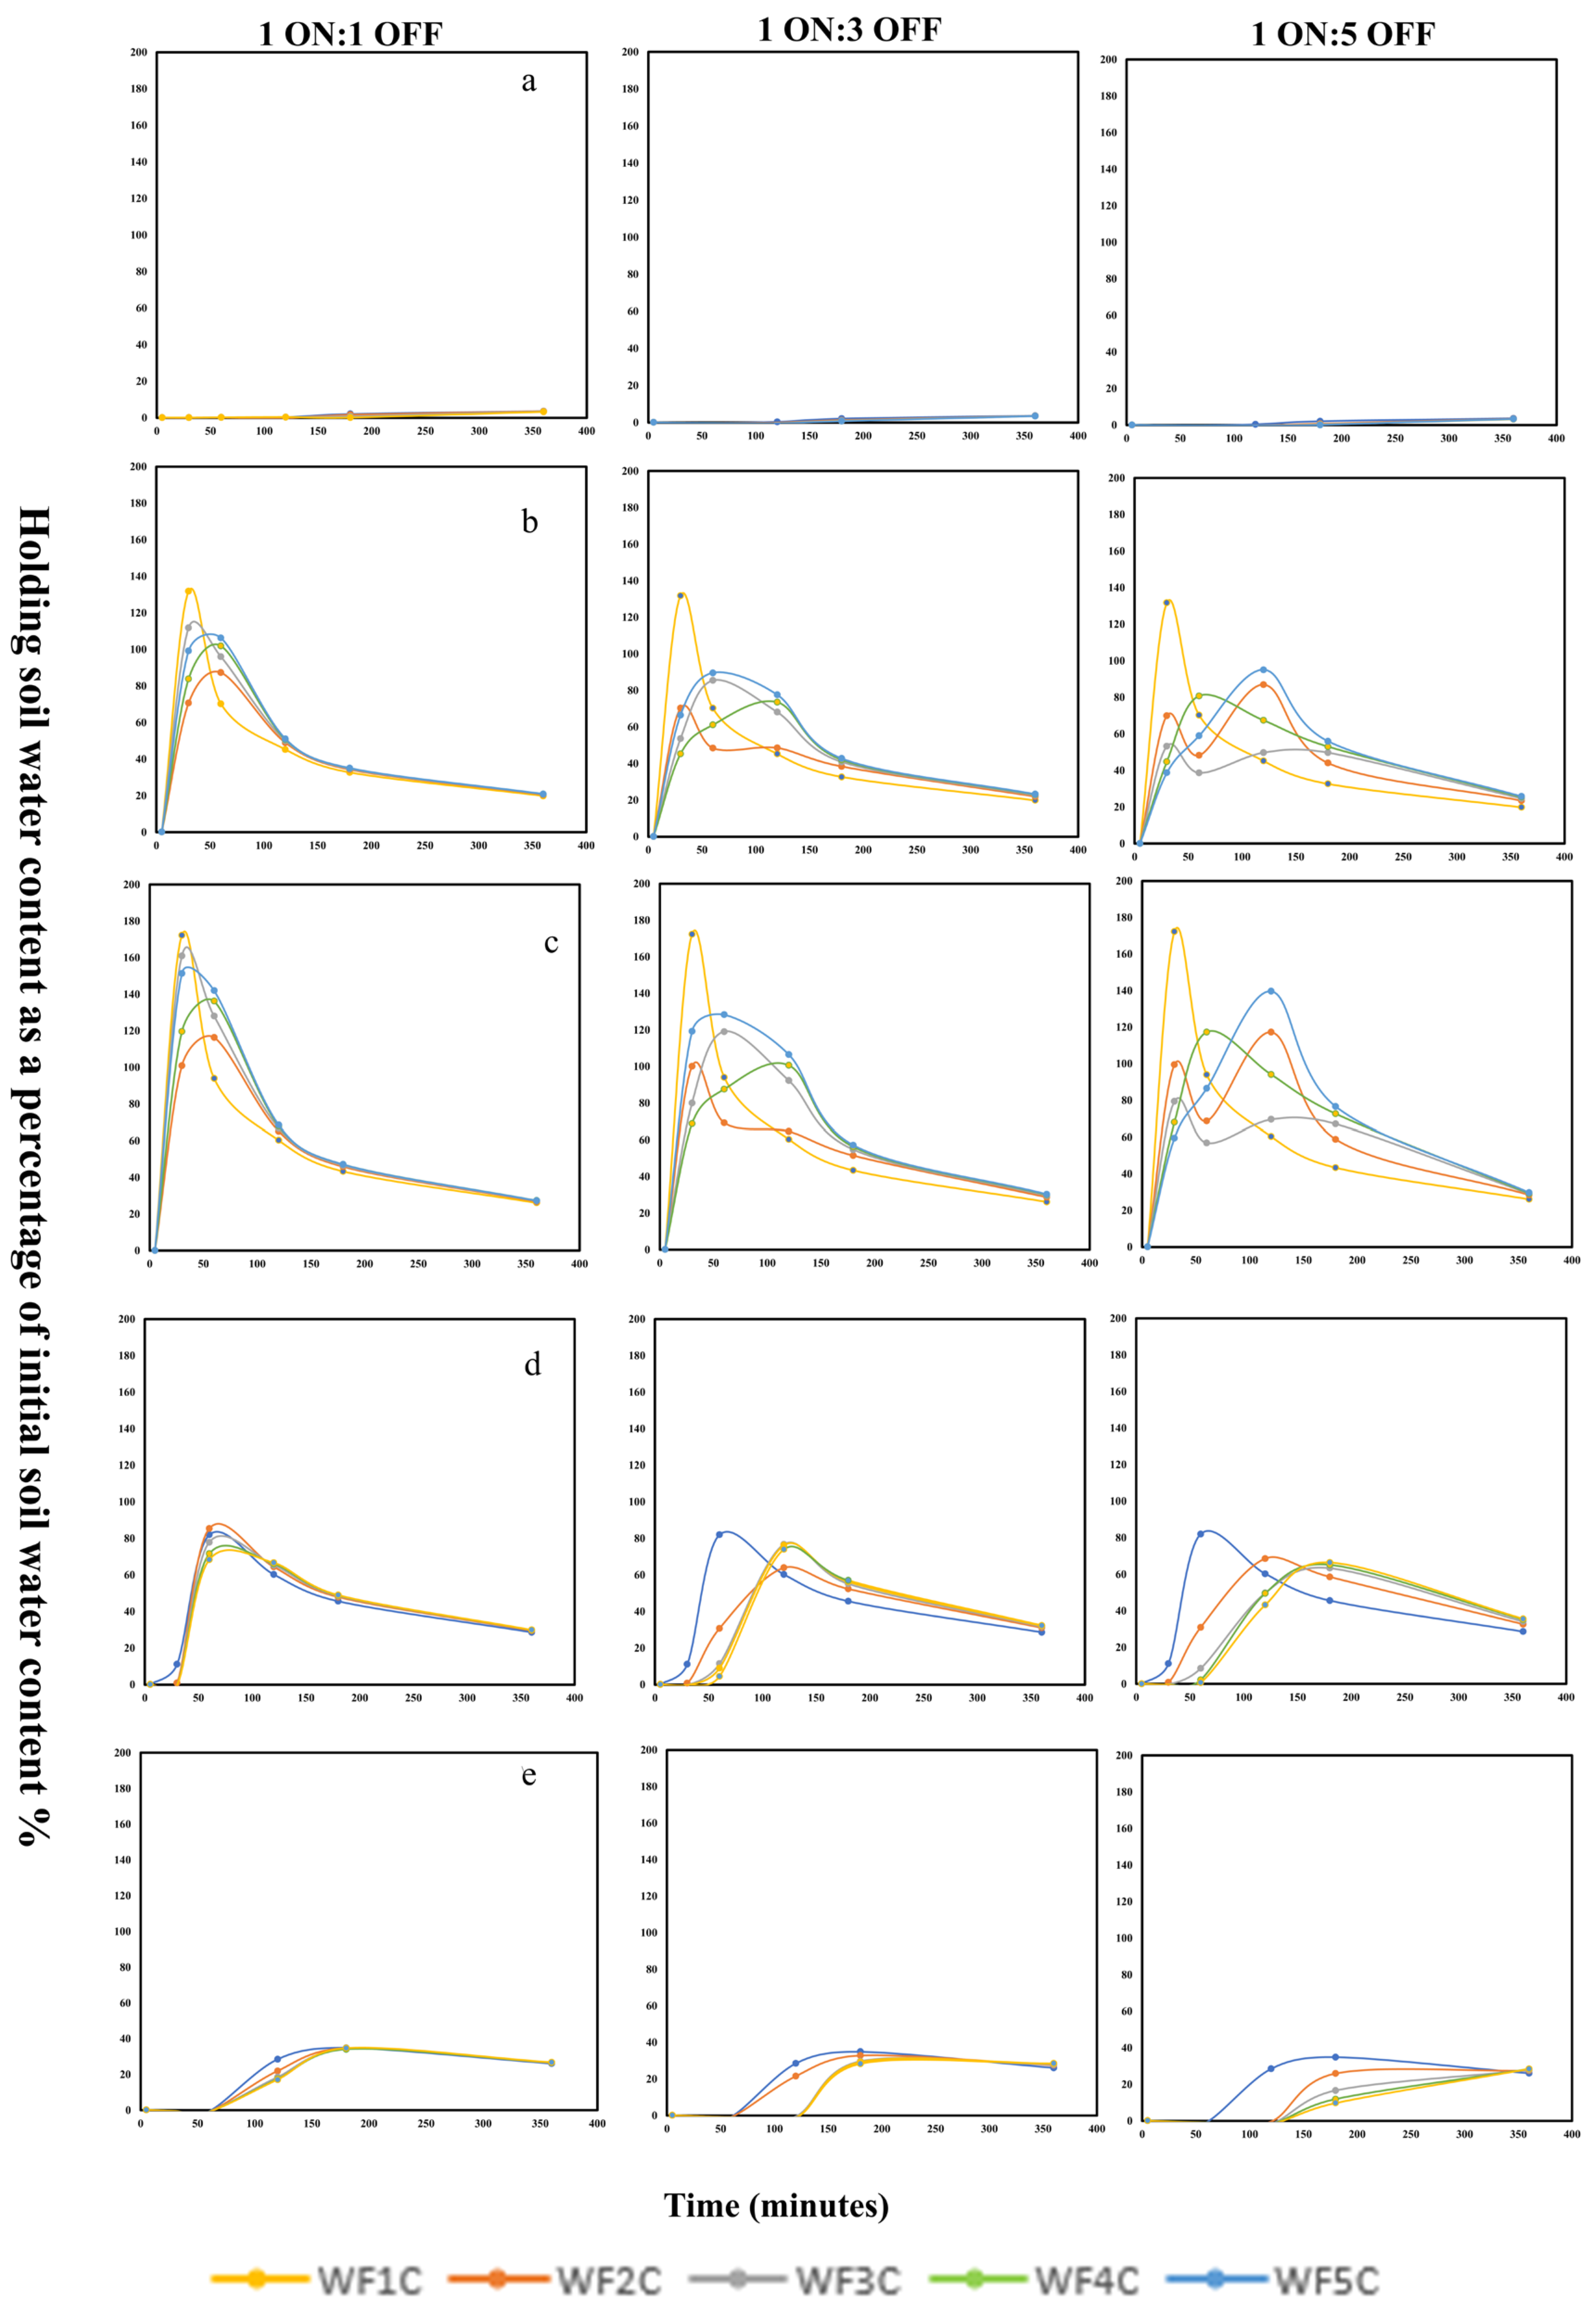
As shown in
Figure 7, in this study, we analyze the effects of different water application cycles and ON:OFF ratios on soil water content at various depths. Our findings, presented in the accompanying graphs, show the percentage relative change in soil water movement around the emitter compared to initial water content across soil profile depths. At 10 cm, the influence of water application cycles and ON: OFF intervals on water retention is minimal. This indicates that using these various techniques had no tangible effect at this depth. In contrast, at 20 cm depth, continuous water application (one-cycle application) results in the most rapid initial change in water content, though this effect rapidly declines over time. The five-cycle water application method demonstrates comparable maximum holding under a 1ON:3OFF while maintaining elevated water levels longer. The 1ON:5OFF also supports the five-cycle method’s efficacy, surpassing both continuous and three-cycle applications in sustaining soil water content. At 30 cm, patterns and indicators resemble those at 20 cm depths, with continuous water application achieving the highest initial water change for a short time; however, five-cycle applications remain robust under a different ON: OFF ratio, confirming its effectiveness in prolonged water retention. At 40 cm and 50 cm depths, water content changes among water application methods under a 1ON:1OFF ratio are similar. However, the five-cycle method consistently yields the highest water content under both 1ON:3OFF and 1ON:5OFF. The five-cycle water application pattern emerges as a robust approach for optimizing water retention, particularly effective at depths of 20 and 30 cm and beyond.
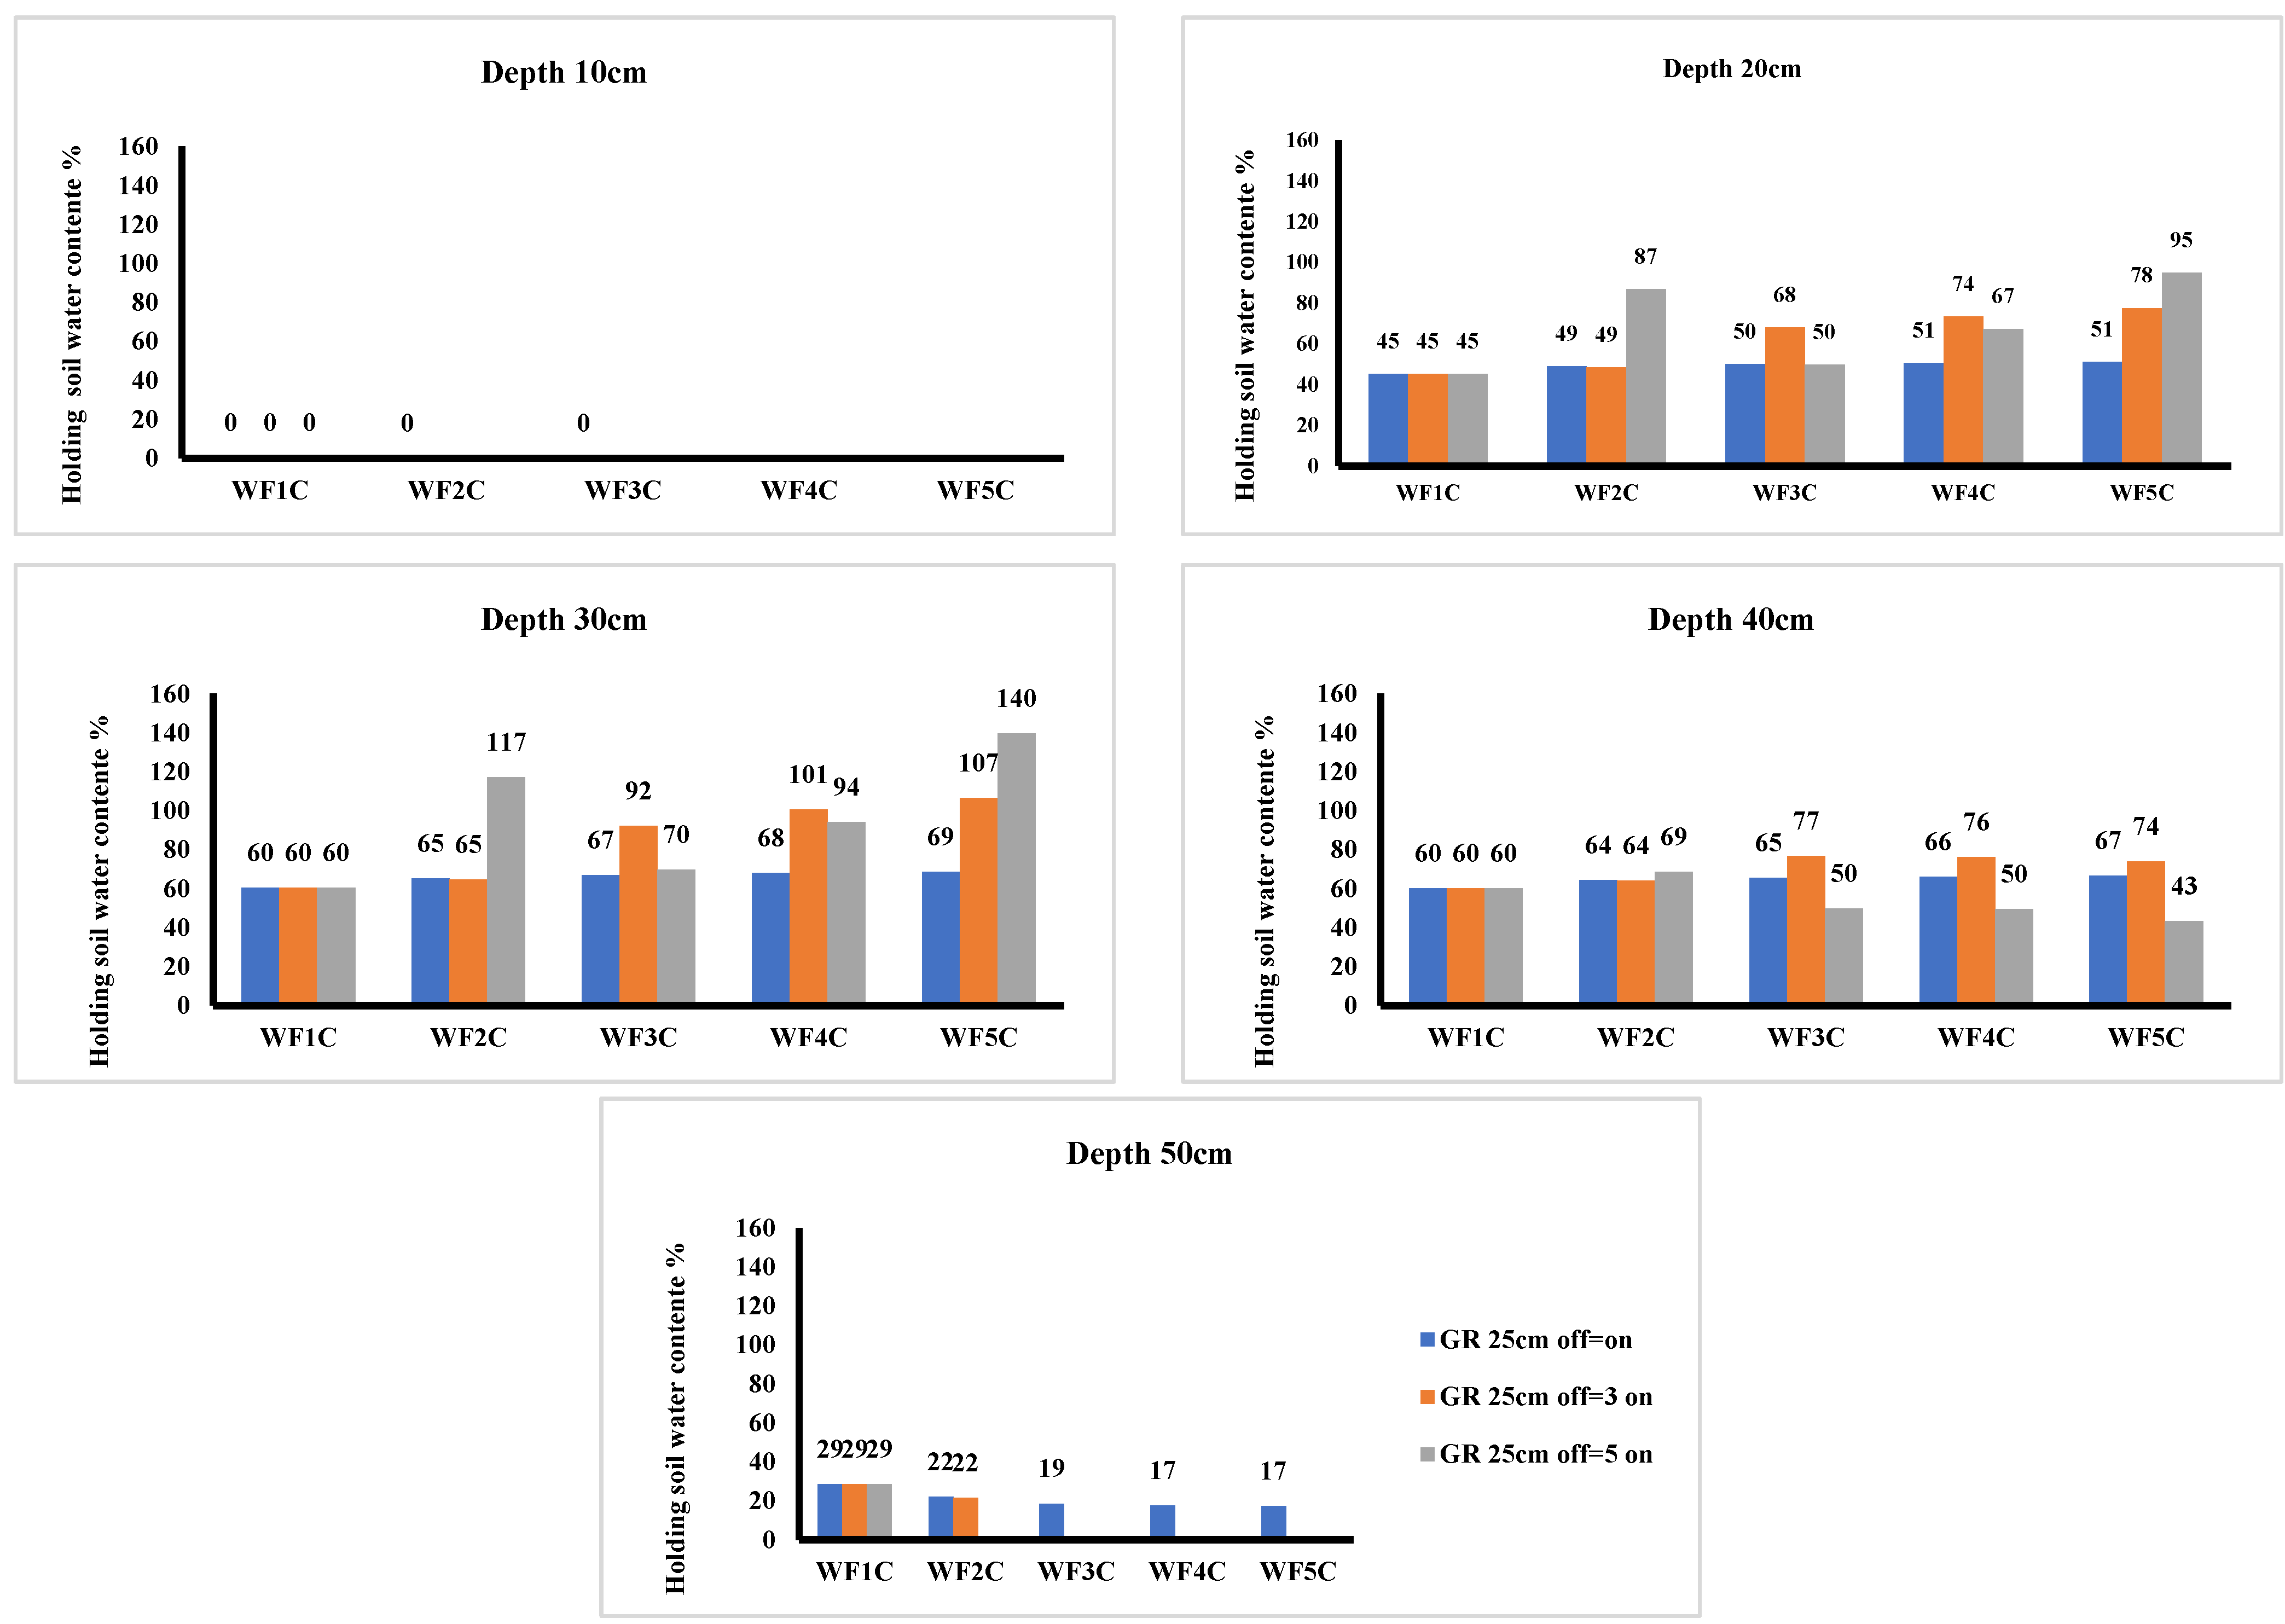
As illustrated in
Figure 8, the investigation of water retention at varying soil depths reveals distinct patterns in response to different water application treatments. At a depth of 10 cm below the soil surface, no significant effects were observed from any water addition treatments across the varying number of cycles—specifically one to five cycles—or among the three different ON: OFF ratios analyzed. In contrast, at a soil depth of 20 cm, notable enhancements in water retention were documented. The application of a two-cycle water addition pattern at 1ON:5OFF resulted in a water content retention rate of 87% compared to the initial water content. Similarly, the five-cycle water addition pattern under the same ratio achieved an even higher retention rate of 95%. Further analysis at 30 cm depth indicated that the two-cycle and five-cycle water addition patterns continued to perform effectively. Here, both patterns (WF2C, WF5C) at the 1ON:5OFF yielded impressive water content retention rates of 117% and 140%, respectively, relative to the initial conditions. At a depth of 40 cm, the results showed similar trends across the first four water addition patterns when using the 1ON:1OFF and 1ON:3OFF. However, a marked decrease in percentage increase was noted when applying the 1ON:5OFF, particularly as the number of water application cycles increased, culminating in the fifth cycle. Finally, at the unfavorable depth of 50 cm, which is critical for water content management, the data reveal a more complex interaction. The employment of the ON: OFF ratio demonstrated a decreasing trend in holding soil water with an increasing number of water application cycles across all five water application cycles. Applying 1ON:3OFF has a change only with the one and two-cycle pattern. There was no increase in the percentage of water content retention with increasing the number of cycles after that. When applying the 1ON:1OFF pattern at a ratio of 1ON:5OFF, it had the advantage of not allowing the water content to reach this depth (50 cm), especially with the increase in the number of water application cycles.
Figure 9, after 30 min of observation, there was no significant effect of varying the ON: OFF ratios or the number of water application cycles on water content at depths of 10 cm, 40 cm, and 50 cm. However, at depths of 20 cm and 30 cm, a single-cycle water application system resulted in the highest retention of water content. After 60 min, similar trends were observed, with no impact on water content at 10 cm and 50 cm. Conversely, at 20 cm and 30 cm, increasing the number of water application cycles led to greater water retention, notably under both 1ON:1OFF and ON:3OFF. At 1ON:5OFF, a four-cycle water application system demonstrated a relative increase in water content compared to other cycles under the same ratios. At a depth of 40 cm, a single-cycle water application system enhanced water content, regardless of the ON: OFF ratios. After 120 min, no variations in ON: OFF rates or cycles affected the water content at 10 cm. However, at 20 cm, 30 cm, 40 cm, and 50 cm, the differences in water content between the five cycles and the 1ON:1OFF were minimal, though there was a preference for the five-cycle pattern in conjunction with 1ON:1OFF and 1ON:5OFF. Finally, at 180 and 360 min, adjustments in ON: OFF ratios or water application cycles again showed no significant effect at 10 cm. The continued minimal differences in water content at various depths indicated a tendency to favor the five-cycle application and a 1ON:5OFF, highlighting the complexity of optimizing water application strategies for improved water retention. The negative values that appear on the curve in
Figure 9 are only an expression of the water content value, but at a depth below the pipe location (25 cm), so we put it with a negative sign.
Figure 10, as we explored this study, systematically examines the effects of varying water application cycles and ON: OFF ratios on soil water content at multiple depths, providing a thorough analysis grounded in simulated data. The findings, represented through detailed graphs, illustrate the percentage holding in soil water content relative to initial measurements at depths of 10 cm, 20 cm, 30 cm, 40 cm, and 50 cm. At shallow depths of 10 cm and 20 cm, the data indicate minimal variation in water retention due to different water application methods, suggesting these strategies may not be necessary for optimizing soil water levels at these depths. Conversely, at 30 cm, continuous water application (one-cycle application) resulted in a significant initial change in soil water content, although this heightened saturation decreased rapidly over time. Both five-cycle and three-cycle water application methods demonstrated comparable maximum increases, effectively maintaining elevated soil water levels for extended periods, particularly under 1ON:1OFF and 1ON:3OFF. Notably, the one-cycle method showed a swift increase in holding water content with a 1ON:5OFF ratio, yet this effect also diminished quickly. At a depth of 40 cm, the patterns mirrored those observed at 30 cm, with continuous water application achieving the highest soil water content increase for a short time, but five-cycle applications exhibited greater resilience across different ON: OFF ratios, thereby extending water retention within the soil profile for a long time. At the 50 cm depth, comparative analysis revealed uniform increases in water content across various water application methods under 1ON:1OFF.
However, the five-cycle method consistently achieved the highest water content across both 1ON:3OFF and 1ON:5OFF, further confirming its superior efficacy in enhancing soil water retention. Specifically, the five-cycle water application pattern is identified as a robust and effective approach for optimizing water retention, particularly at depths of 30 cm and 40 cm. The incorporation of a GR pipe at a depth of 35 cm below the soil surface enhances these positive effects, suggesting further avenues for improving water application efficiency in agricultural practices.
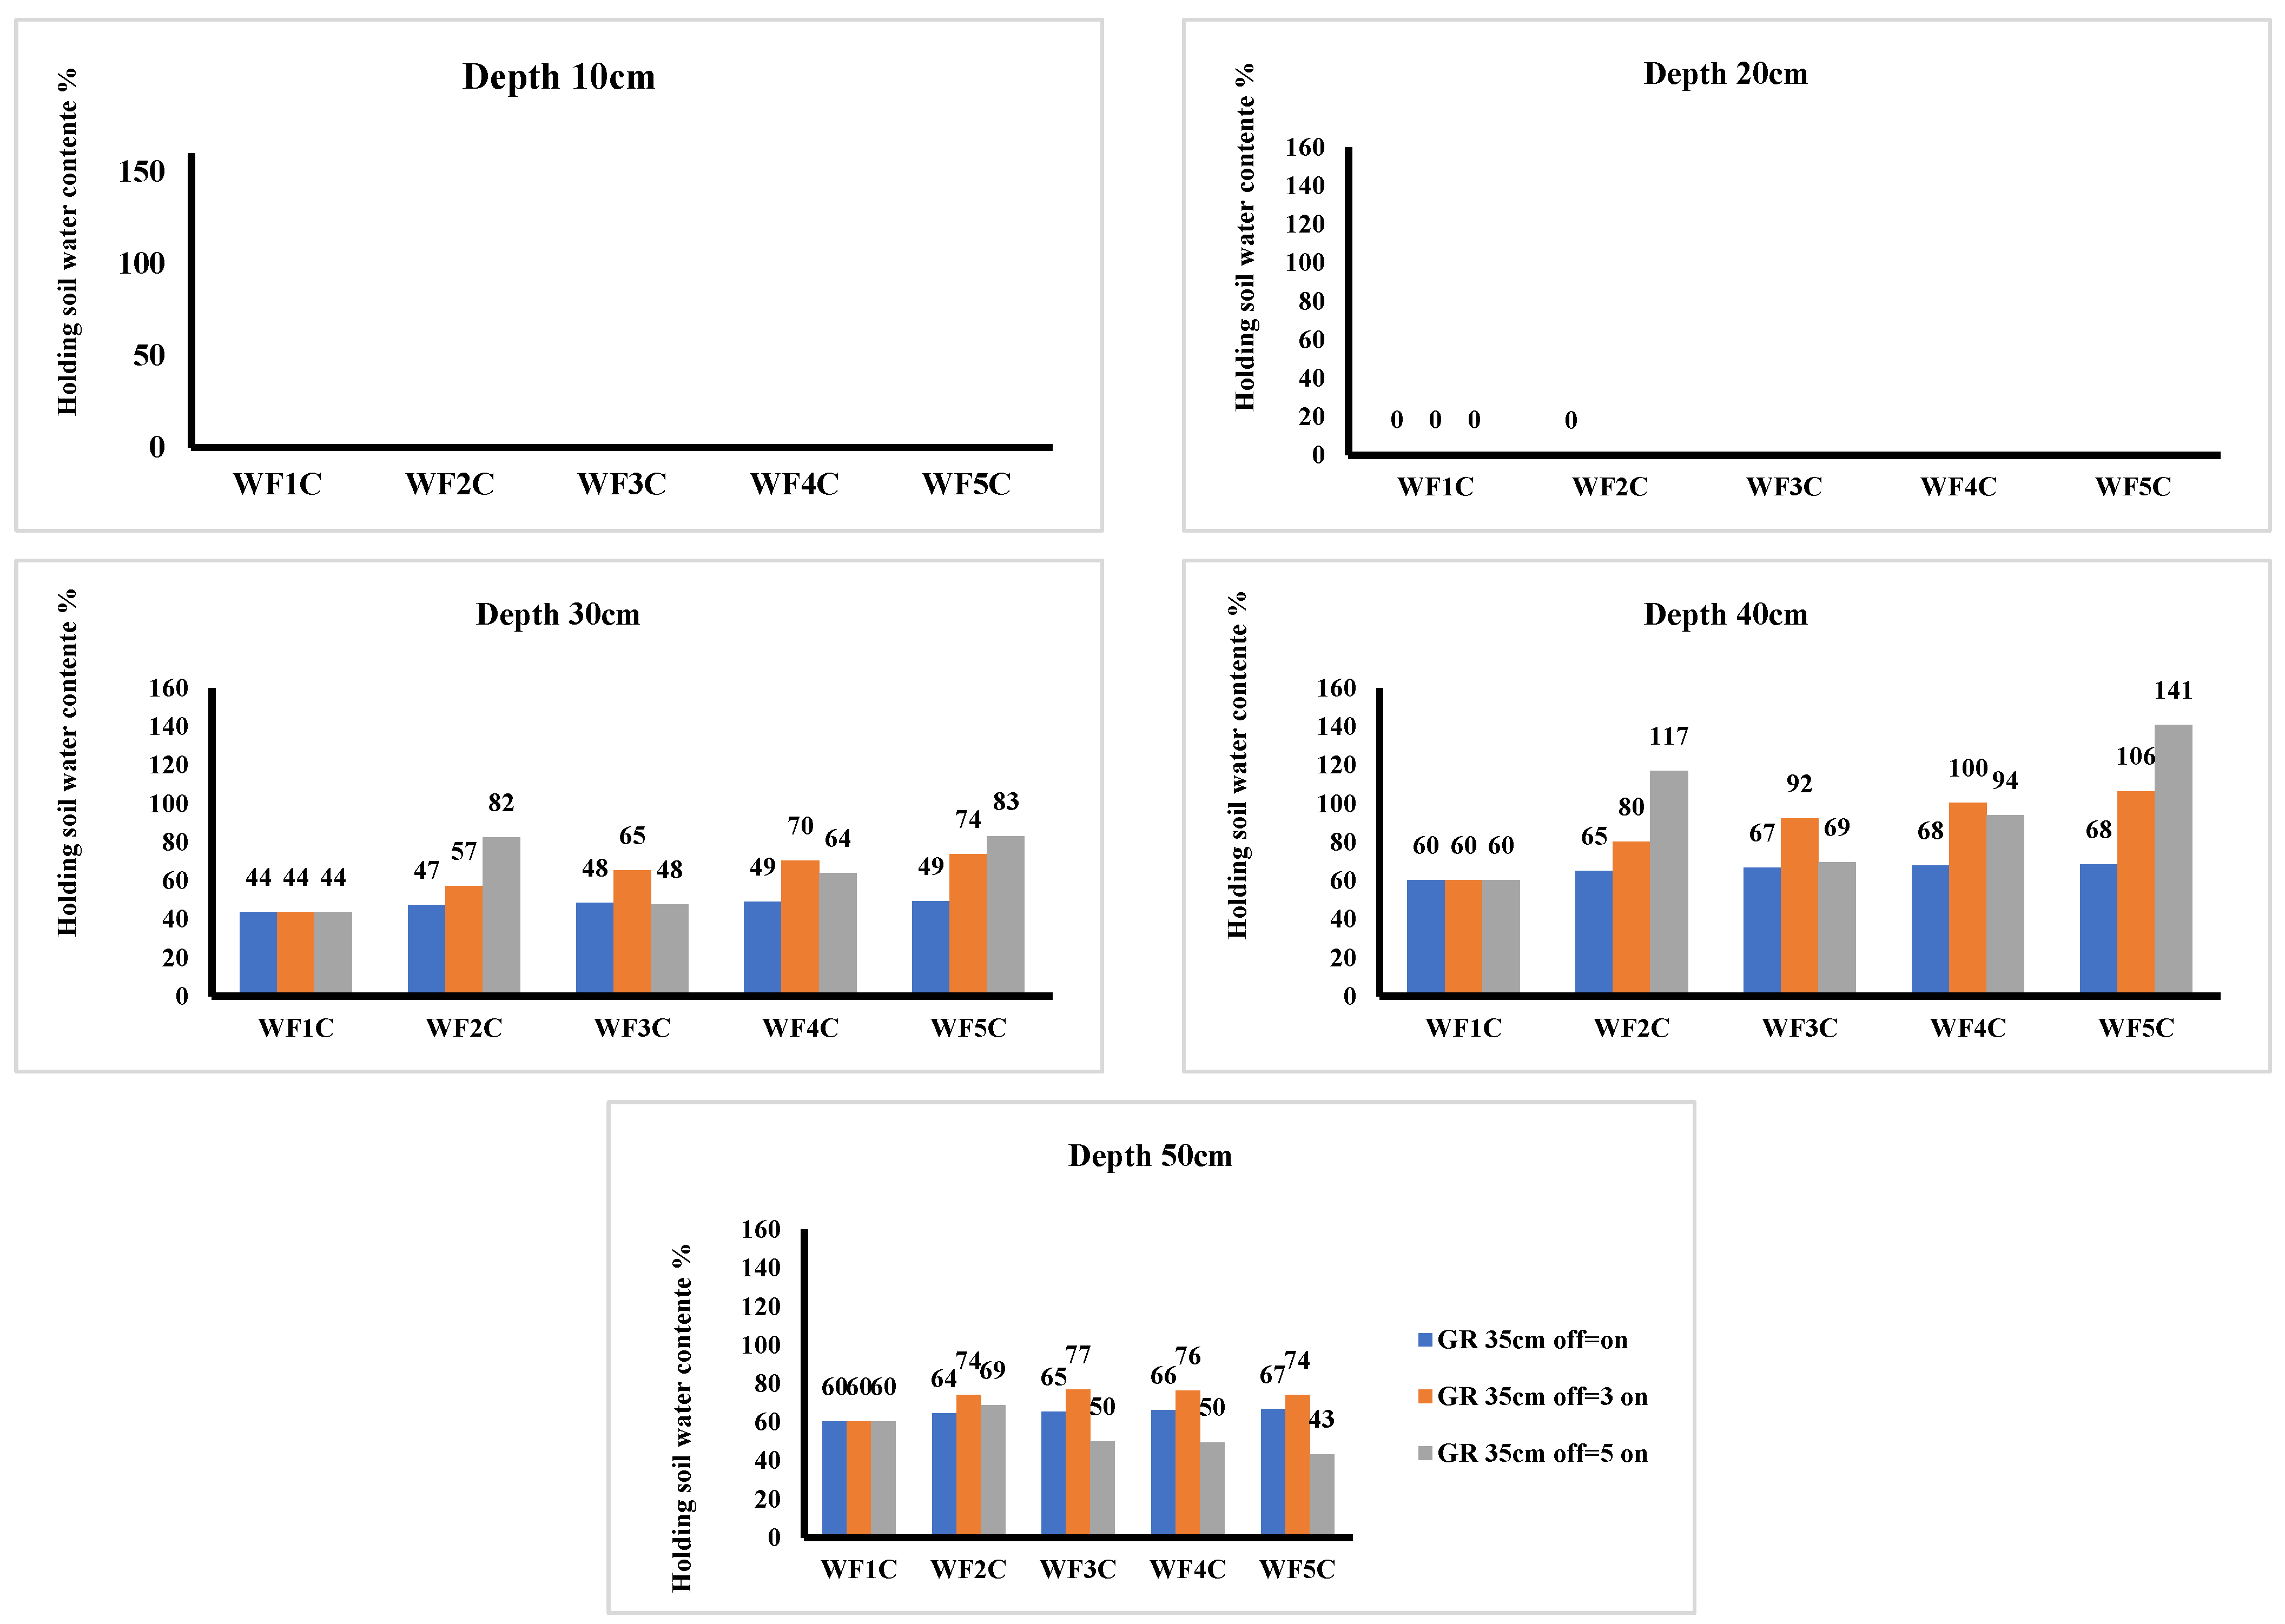
In
Figure 11, at depths of 10 and 20 cm below the soil surface, the study found no significant effects from varying water addition treatments, regardless of the number of cycles (one to five) or the ON: OFF ratios analyzed. However, notable improvements in water retention were observed at a depth of 30 cm. Specifically, a two-cycle water addition pattern with 1ON:5OFF resulted in an 82% retention rate compared to initial water content, while a five-cycle pattern under the same ratio achieved a higher retention rate of 83%. At a depth of 40 cm, both the two-cycle and five-cycle water addition patterns continued to demonstrate effectiveness, yielding impressive retention rates of 117% and 141%, respectively, relative to initial soil content. In contrast, at the critical depth of 50 cm, the interaction between the water addition patterns and ON: OFF ratios became more complex. While the different ON: OFF ratios exhibited similar trends across the water-filling treatment patterns (WF1C), there was a noticeable decrease in retention percentage when employing the 1ON:5OFF, particularly with increased water application cycles, culminating in a decline by the fifth cycle. These findings highlight the importance of both water application pattern and depth in enhancing soil water retention, suggesting that optimal strategies may differ significantly across varying depths.
A study investigating the effects of varying ON: OFF water application ratios and cycles on soil water content revealed several notable findings. As shown in
Figure 12, after 30 min of observation, no significant differences in water content were detected at depths of 10 cm and 20 cm. However, at depths of 30 cm and 40 cm, a single-cycle water application system yielded the highest water retention. After 60 min, trends persisted, with no notable changes in water content at 10 cm and 20 cm; conversely, an increase in water application cycles resulted in enhanced water retention at 30 cm and 40 cm, particularly under 1ON:1OFF and 1ON:3OFF. Under a 1ON:5OFF, a four-cycle water application system demonstrated a notable increase in holding soil water, outperforming other cycles at the same ratios. At 50 cm, a single-cycle system consistently enhanced water content, independent of the ON: OFF ratios. At 120 min, variations in ON: OFF ratios and cycles had no significant impact at 10 cm and 20 cm. However, at depths of 30 cm, 40 cm, and 50 cm, water content differences between five cycles under the 1ON:1OFF were minimal, yet there was a discernible preference for the five-cycle pattern when paired with 1ON:1OFF and 1ON:5OFF. At 180 and 360 min, adjustments to ON: OFF ratios or water application cycles continued to show negligible effects at 10 cm and 20 cm. Overall, the data indicated a consistent trend favoring the five-cycle water application and the 1ON:5OFF, underscoring the complexity of optimizing water application strategies to improve water retention efficiently. The negative values that appear on the curve in
Figure 10 are only an expression of the water content value, but at a depth below the pipe location (35 cm), so we put it with a negative sign.
This comprehensive analysis underscores the notable effect of intermittent water application cycles on enhancing soil water retention, elucidating critical variables for optimizing water application techniques and improving water management strategies in agricultural settings. The evident relative change in soil’s water retention capacity with extended water application and OFF periods suggests that careful optimization of stop ratios and total water application duration could significantly improve soil water management and contribute to enhanced agricultural productivity. The findings of this study provide valuable empirical evidence that may guide future research and practical applications in sustainable agricultural water management.
From previous experiments in the simulation process, as shown in
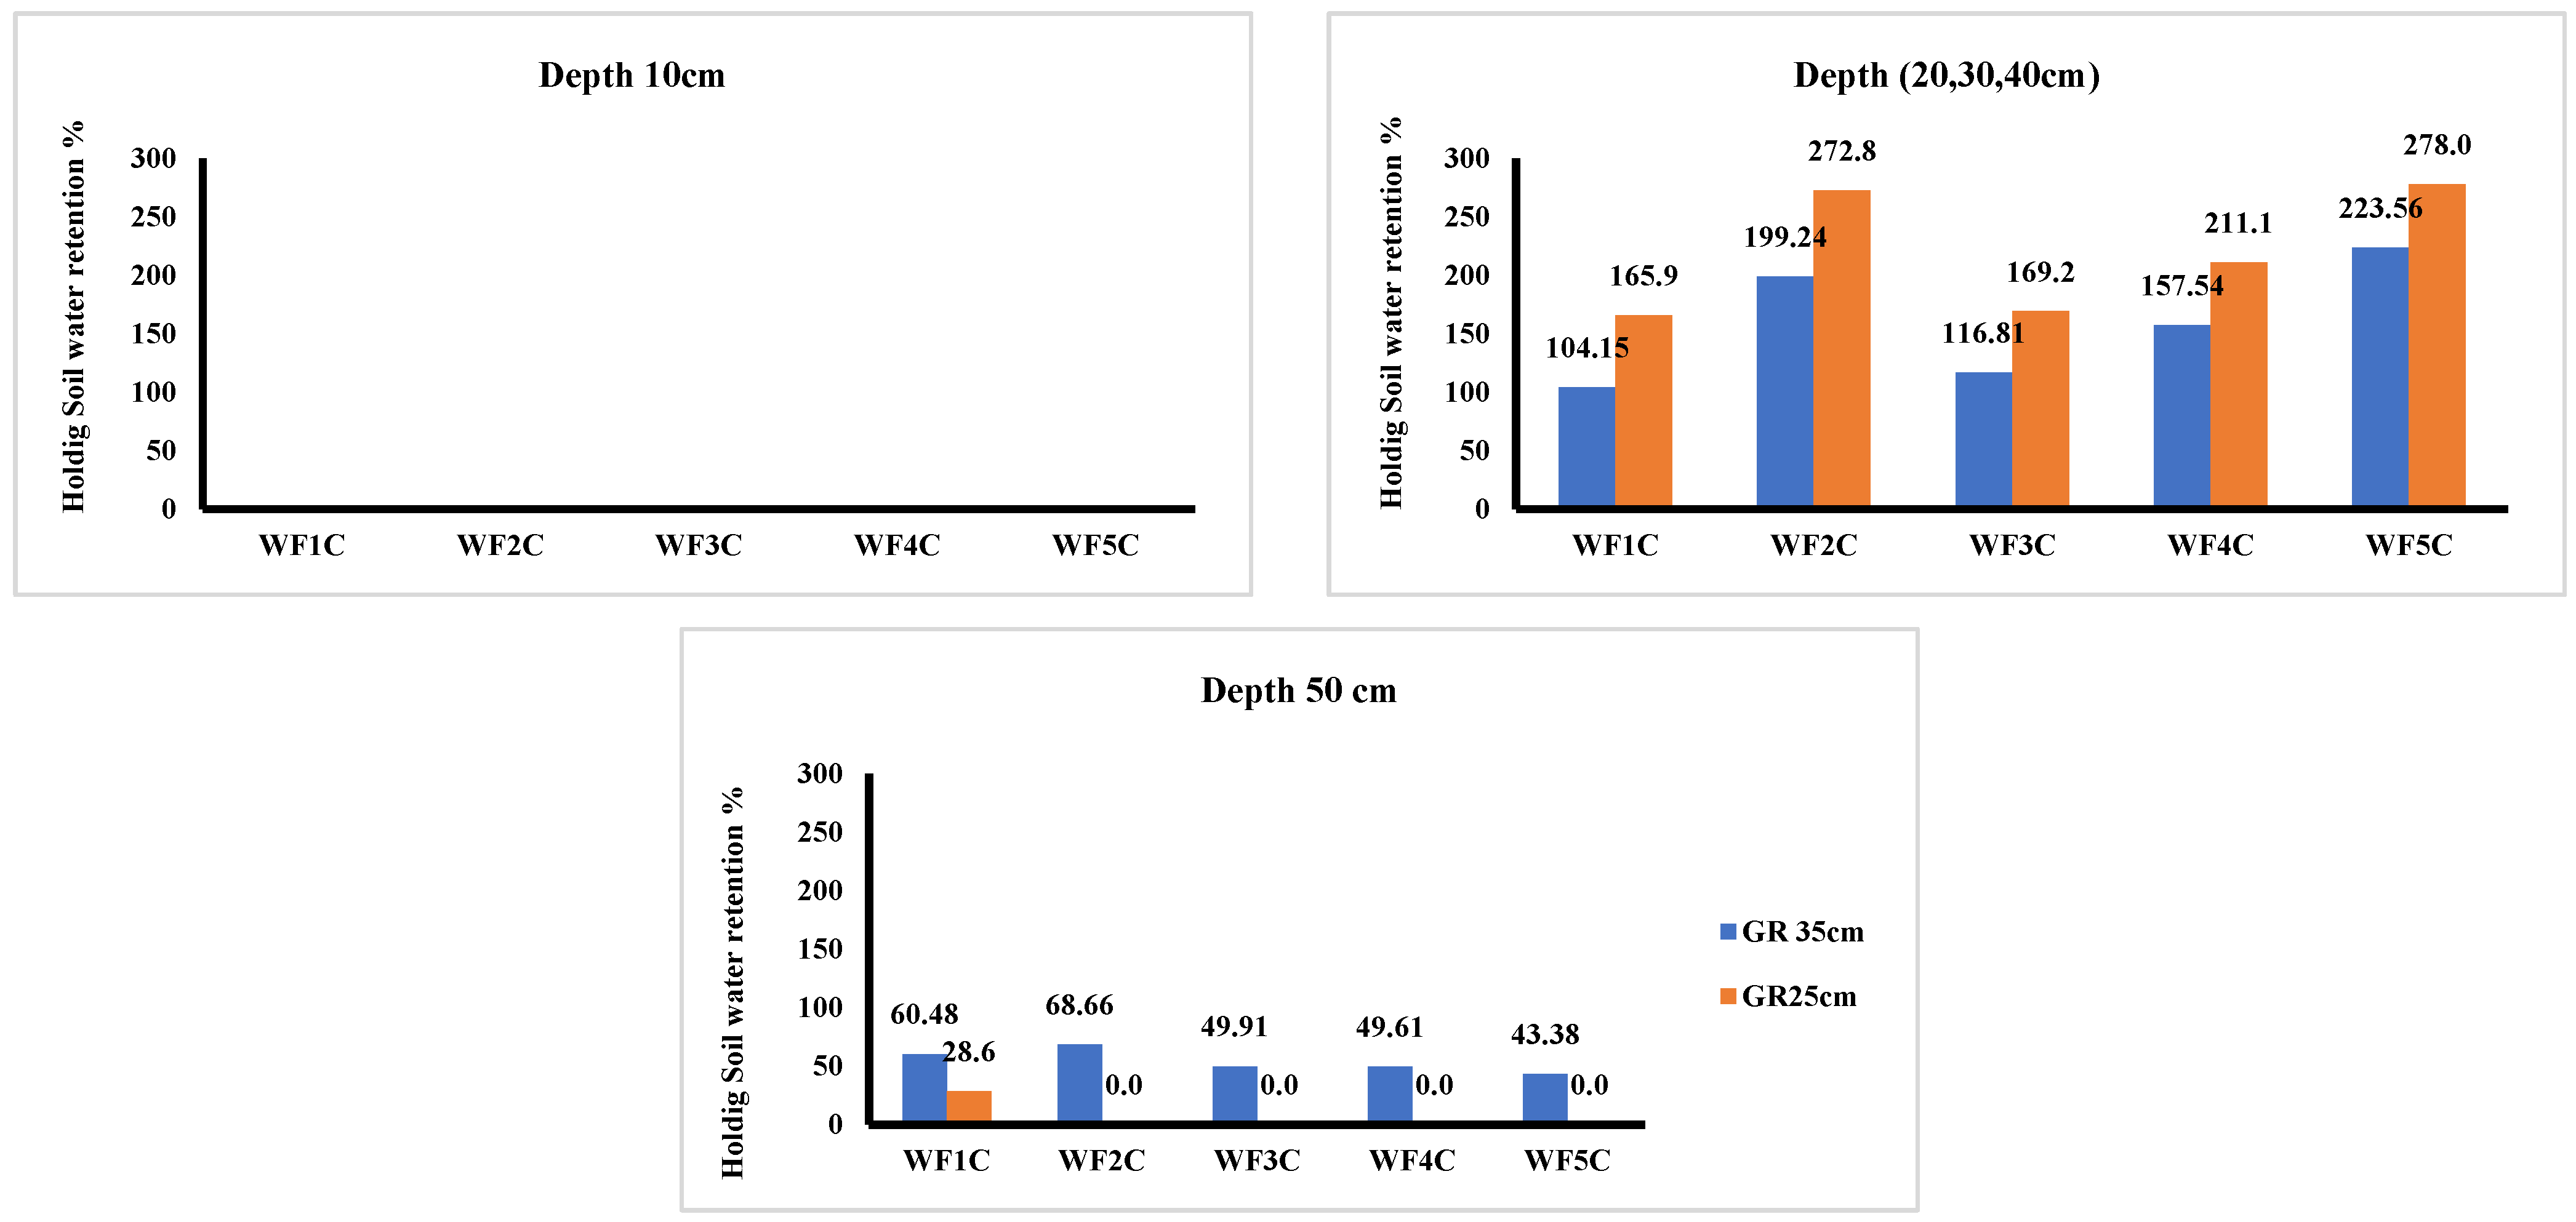
Figure 13, it was found that the best ratio of ON: OFF is (1ON:5OFF); it is clear that at a depth of 10 cm below the soil surface, none of the water different applications or ON: OFF ratios had any effect on retaining the water content in the soil. The results indicated that the placement of the pipe at a depth of 25 cm significantly enhanced the lateral movement of water, effectively reaching depths of 20 cm, 30 cm, and 40 cm within the soil profile. Particularly noteworthy was the performance of the water application system employing five water addition cycles combined with a 1ON:5OFF ratio, which demonstrated an exceptional capacity for retaining soil water at the targeted root depth (WF5C 25CM), achieving 278% as an increase compared with the initial water content. At a depth of 50 cm, which is an undesirable depth for water to reach, we find that increasing the number of water application cycles prevents water from reaching it, thus avoiding deep seepage. This is when using a drip pipe at a depth of 25 cm below the soil surface, while if we use a drip pipe at a depth of 35 cm below the soil surface, deep seepage occurs, and this decreases with increasing the number of water application cycles. This configuration maximized the efficiency of the added water, thereby optimizing plant productivity.
Statistical Analysis
The experimental investigation of soil water dynamics under varying water application regimes revealed significant depth-dependent patterns in soil water distribution, with important implications for water application management. As presented in
Table 4, the balanced experimental design systematically evaluated three key parameters—subsurface drip line installation depth (25 cm vs. 35 cm), water application interval duration (OFF = ON, OFF = 3 × ON, OFF = 5 × ON), and application frequency (1–5 cycles)—through a comprehensive three-way ANOVA framework. This rigorous approach enabled simultaneous assessment of both individual parameter effects and their complex interactions on soil moisture retention.
The stratified analysis of water content distribution (
Table 5) revealed significantly different hydrological responses across soil profiles (Tukey’s HSD,
p < 0.05).
We utilized Tukey’s HSD test, which requires specific assumptions for valid results. Firstly, the data within each group must be normally distributed, adhering to the characteristics of a bell-shaped curve. This normality, verifiable through tests like Shapiro–Wilk or Kolmogorov-Smirnov, is crucial for various statistical analyses, including t-tests and ANOVA. Secondly, groups should demonstrate approximately equal variances, known as homogeneity of variance, and the observations must be independent. Violating these assumptions can lead to erroneous conclusions, making it essential for researchers to confirm these conditions before applying Tukey’s HSD test. The surface layer (10 cm depth) showed consistently minimal water retention, with statistically similar values across all cycles (0.2 to −0.1 mm; denoted by superscripts a–c). In subsurface water application systems, it is preferable for the surface layer of the soil to be dry and not reach the water content. This allows the water content to be concentrated around the active zone of the root system, preventing its loss through evaporation. It also helps in carrying out various agricultural operations, such as plowing and other activities. In contrast, the root zone (20–40 cm depth) demonstrated progressive soil water accumulation with increasing water application frequency, where cycle 5 (207.3 ± 3.9 mm, d) retained 55% more water than cycle 1 (133.5 ± 3.9 mm, d)—all pairwise comparisons being statistically significant (p < 0.05). The sub-root zone (50 cm depth) exhibited an inverse pattern, with cycle 1 (44.5 ± 3.2 mm, g) showing significantly higher moisture than cycle 5 (33.1 ± 3.2 mm, j), representing a 26% reduction in deep percolation under frequent water application (all cycles significantly different at p < 0.05 except cycles 3–4 which shared superscript i).
The three-way ANOVA results, presented in
Table 6, revealed several key insights when comparing parameter effects across soil depths. Depth emerged as the most influential parameter for middle and deep layers (both
p < 0.001), while showing only marginal effects at the surface (
p = 0.04). Water application interval duration demonstrated consistent significance across all depths (
p ≤ 0.012), though its effects were most pronounced in the root zone. Cycle frequency showed strong effects on surface and root zones (both
p < 0.001) but weaker influence in deep layers (
p = 0.04). The analysis also uncovered significant interaction effects that warrant particular attention: the Depth × Pause Time interaction at Position A (
p = 0.002) indicates that surface moisture responses to water application intervals are modulated by installation depth, while the strong Pause Time × Cycles interaction at Position B (
p < 0.001) reveals that the benefits of increased water application frequency depend critically on the duration between watering events. These interaction effects highlight the complex, non-linear relationships governing soil moisture dynamics in drip water application systems. These results carry significant practical implications for water application management. The demonstrated ability to simultaneously enhance root zone moisture while controlling deep percolation through optimized water application scheduling presents a valuable strategy for improving water use efficiency in water-limited environments. The significant interaction effects particularly emphasize the need for integrated water application management approaches that consider installation depth, interval duration, and application frequency as interdependent parameters rather than isolated factors.
The findings of the present study align well with previous research employing similar methodologies, indicating that intermittent (pulsed) water application effectively reduces deep percolation losses when compared to continuous flow. This approach is particularly advantageous for loamy sand soils due to their rapid infiltration rates [
26,
49,
50]. Our results demonstrate that an increase in the number of water addition cycles correlates with a reduced likelihood of deep percolation. Enhanced frequency of water application contributes to increased water availability in the upper root zone [
51]. Moreover, the optimal depth range for drip emitters, identified to be between 20 and 35 cm, offers a balance between minimizing evaporation and maximizing lateral spreading [
52,
53,
54]. Our findings further illustrate that the implementation of intermittent water addition, coupled with extended pauses between applications, results in greater water content retention over a prolonged period. Other studies have confirmed that intermittent water application significantly enhances soil water distribution, particularly at depths of 0–15 cm and 15–30 cm [
21]. As detailed in our text and illustrated in previous figures, we observed water content retention at a depth of 20–40 cm, which is critical for the active root zone of plants. The use of HYDRUS/2D simulations for loamy sand further corroborates our findings, demonstrating that intermittent flow facilitates better water distribution in comparison to continuous flow [
50]. Notably, the application of five cycles of intermittent water, as indicated in our study, resulted in an enhanced capability of the soil to retain greater water content for extended durations when juxtaposed with the continuous water application method. In conclusion, our simulation of potato cultivation under subsurface water application in loamy sandy soil suggests that increasing the number of water application cycles to five, along with extending the intervals between water applications to five times the original length, maximizes water content retention at the crucial root depth of 20–40 cm.
5. Conclusions
The study presents several important conclusions regarding the effects of water application strategies on soil water distribution, particularly in subsurface drip water application systems under the effects of intermittent water flow, different ratios of ON and OFF time, and drip depth, particularly in stratified soils like loamy sand. The findings indicate that a pipe depth of 25 cm from the soil surface is more effective at increasing water holding at various depths (20, 30, and 40 cm) compared to a depth of 35 cm. Specifically, the SDI treatment WF5C at a depth of 35 cm demonstrated a 241.9% increase in water holding at 30 cm and 40 cm depths with WF5C. At a depth of 25 cm, WF5C achieved a remarkable 316.8% increase in water holding at 20 cm, 30 cm, and 40 cm depths. The study also noted that increasing water application cycles led to higher soil water content, while no increases were observed at a depth of 50 cm. After completing all water application operations for all transactions, i.e., after 120 min: WF1C (165.9%), WF5C (186.4%), WF5C3off (258.2%), and WF5C5off (278%) at a depth of 25 cm, as systematic increases were noted for WF5C5off.
Here are the main findings: simulation insights: Utilizing HYDRUS (2D/3D) software for simulations, the study evaluates the impact of different water application patterns on loamy sand soils. This methodological approach allows for a comprehensive understanding of water dynamics in soil, which can be applied to real-world agricultural settings. Effectiveness of pipe depth: The research indicates that a pipe depth of 25 cm from the soil surface is more effective in enhancing water retention at various depths (20, 30, and 40 cm) compared to a depth of 35 cm. This suggests that the shallower placement of drip pipes can optimize water availability for crops. Impact of water application cycles: increasing the frequency of water application cycles leads to higher soil water content, particularly at depths of 20 cm, 30 cm, and 40 cm. However, no significant increases were observed at a depth of 50 cm, indicating that careful management of water application cycles is crucial to prevent deep percolation. Optimal ON: OFF ratios: the study found that longer OFF periods during intermittent water application (e.g., 1ON:5OFF) significantly improved water retention in the soil profile. This configuration allowed for better water accumulation and reduced deep leakage, enhancing overall water management. The statistical analysis, a comprehensive three-way ANOVA, conducted using SPSS, highlighted the statistical significance of the independent variables—pipe depth, water application cycle frequency, and ON: OFF ratios—on soil water content, with a p-value of less than 0.005 indicating reliability in the findings. Notably, interactions between pause time and cycles emerged as particularly influential in layer B, emphasizing the significance of timing in moisture retention strategies. Furthermore, depth proved to be a critical determinant for middle and deep soil layers, with significant effects observed at p < 0.001. Graphical representations of the findings were represented through detailed graphs, illustrating the percentage of soil water content relative to initial measurements at various depths. This visual representation aids in understanding the effects of different water application treatments. Recommendations for farmers: the study suggests that farmers should adopt innovative water application strategies, including longer cessation periods during intermittent water application, to improve water distribution and boost crop yields. Recommendations for practice: The findings suggest that specific water application patterns, such as a 1ON:5OFF ratio, significantly improve water retention at certain soil depths. These recommendations can help farmers implement more effective water application practices, ultimately leading to better crop yields and resource conservation. Support for sustainable agriculture: the findings highlight the importance of efficient water use in arid and semi-arid regions, suggesting that government subsidies could support sustainable agricultural practices that enhance water conservation and crop productivity.
