Article

Spatiotemporal Variations in Observed Rain-on-Snow Events and Their Intensities in China from 1978 to 2020

1
Institute of Geological Natural Disaster Prevention and Control, Gansu Academy of Sciences, Lanzhou 730000, China
2
State Key Laboratory of Ecological Safety and Sustainable Development in Arid Lands, Northwest Institute of Eco-Environment and Resources, Chinese Academy of Sciences, Lanzhou 730000, China
3
University of Chinese Academy of Sciences, Beijing 100049, China
4
Gansu Academy of Sciences, Lanzhou 730000, China
5
College of Geography and Tourism, Hengyang Normal University, Hengyang 421000, China
*
Author to whom correspondence should be addressed.
Water 2025, 17(14), 2114; https://doi.org/10.3390/w17142114
Submission received: 26 June 2025 / Revised: 10 July 2025 / Accepted: 14 July 2025 / Published: 16 July 2025
(This article belongs to the Section Hydrology)

Abstract

The spatiotemporal changes and driving mechanisms of rain-on-snow (ROS) events and their intensities are crucial for responding to disasters triggered by such events. However, there is currently a lack of detailed assessment of the seasonal variations and driving mechanisms of ROS events and their intensities in China. Therefore, this study utilized daily meteorological data and daily snow depth data from 513 stations in China during 1978–2020 to investigate spatiotemporal variations of ROS events and their intensities. Also, based on the detrend and partial correlation analysis model, the driving factors of ROS events and their intensity were explored. The results showed that ROS events primarily occurred in northern Xinjiang, the Qinghai–Tibet Plateau, Northeast China, and central and eastern China. ROS events frequently occurred in the middle and lower Yangtze River Plain in winter but were easily overlooked. The number and intensity of ROS events increased significantly (p < 0.05) in the Changbai Mountains in spring and the Altay Mountains and the southeast part of the Qinghai–Tibet Plateau in winter, leading to heightened ROS flood risks. However, the number and intensity of ROS events decreased significantly (p < 0.05) in the middle and lower Yangtze River Plain in winter. The driving mechanisms of the changes for ROS events and their intensities were different. Changes in the number of ROS events and their intensities in snow-rich regions were driven by rainfall days and quantity of rainfall, respectively. In regions with more rainfall, these changes were driven by snow cover days and snow water equivalent, respectively. Air temperature had no direct impact on ROS events and their intensities. These findings provide reliable evidence for responding to disasters and changes triggered by ROS events.

1. Introduction

Rain-on-snow (ROS) events are a unique form of precipitation. They are prevalent in regions with snow cover, primarily occurring in early spring and late autumn, and at times in winter [1].
ROS events, although infrequent throughout the year, have significant consequences when they occur. They increase snow moisture content [2] and disrupt the structure between snow particles [3]. They also reduce snow surface albedo [4] and enhance solar radiation absorption, accelerating snow melting [5,6]. As snow melts, water seepage and refreezing occur, forming an ice crust that poses risks to ungulates [7]. Rainwater carries a nonnegligible amount of heat [8,9], melting snow upon contact and potentially warming the ground as it infiltrates. This can lead to a reduction in snow cover as it begins to melt in spring and cause changes in the energy balance of the permafrost layer [10], which can trigger a series of ecological and hydrological responses [11]. Moreover, ROS events can induce destructive flooding with significant ring rupture forces [12,13,14], and trigger avalanches and other hazards [15].
Over the past several decades, higher air temperatures have led to an increase in ROS events in the western United States at higher altitudes and a decrease at lower altitudes [16]. In the western North America, due to climate warming, the frequency of ROS events has decreased in low-altitude areas due to reduced snow. However, in high-altitude areas, due to the persistent presence of snow, the frequency of ROS events has increased with the shift of snowfall to rainfall [17]. A similar trend has been observed in Europe [18]. Data indicate that the spatial and temporal features of ROS events are undergoing significant changes due to changes in snow cover and precipitation patterns caused by global warming [19].
China occupies a unique geographical position in the eastern part of Eurasia, along the western coast of the Pacific Ocean. This geographic characteristic results in a wide snow distribution and significant seasonal variations in snow cover [20,21,22,23]. However, this feature has also provided conditions for the occurrence of ROS events, resulting in a greater frequency of ROS events in China, with significant ecological and water cycle impacts [6,24,25]. Therefore, understanding the spatial and temporal distribution and trend of ROS events and their intensities in China is very important for water resource management, and disaster prevention and control. Zhou et al. [24] used MODIS snow cover and grid precipitation data to study the spatial and temporal distribution and annual trends of ROS events in China during 2001 to 2018. Li et al. [26] analyzed the spatial and temporal distribution and impact factors for ROS events in China during 1960–2013 using observational data from 191 stations. However, there are obvious errors in MODIS snow cover data, especially in alpine areas with complex topography and climate. This may lead to significant uncertainty in the results derived by Zhou et al. [24]. Li et al. [26] used a limitation in the definition of ROS events in their study that prevented the exclusion of fake ROS events, which may affect the accuracy of the results. In addition, there are significant differences between Zhou et al. [24] and Li et al. [26] in terms of spatiotemporal distributions and variations, and there is an urgent need for further in-depth studies on the spatiotemporal variations and drivers of ROS events in China. Furthermore, the spatiotemporal changes in ROS event intensity and driving factors correspond to the critical importance of ROS event-related disasters, which was neglected in the studies of Zhou et al. [24] and Li et al. [26]. Therefore, this study systematically assessed the spatial variations and seasonal differences in ROS events and their intensities in China from 1978 to 2020 by optimizing the definition of ROS events, adopting a more appropriate analysis of spatiotemporal variations, and using daily snow depth data and meteorological data from 513 stations. Also, the driving factors of ROS events and their intensities were explored. This study adds to scientific evidence regarding water resource management and response to disasters and changes caused by ROS events.

2. Data and Methods

2.1. Data

Daily meteorological data and snow depth data from 513 stations (Figure 1) from 1978 to 2020 provided by the National Meteorological Information Center of the China Meteorological Administration were used. The meteorological data and snow depth data from these 513 stations were subjected to quality control and completeness screening to ensure data reliability. Moreover, to avoid data errors caused by station migration, observation rules, or instrument changes, we homogenized all data. The snow depth data were collected manually before 2004 and automatically by instruments after 2004. The meteorological data included the daily relative humidity (RH), surface pressure (ps), precipitation (Pre), and air temperature (Ta). However, precipitation types are not distinguished after 1979.

2.2. Methods

2.2.1. Daily ROS Event Definition

Currently, there are differences in the definition of ROS events in existing studies [27,28,29]. However, in general, the definition of ROS events has primarily been determined based on the specific research region and research objectives. Additionally, due to the influence of the temporal scales of many datasets (most of which have a minimum temporal scale of daily) and to facilitate the analysis of spatiotemporal variation characteristics, all current studies related to ROS use the ROS day as a representation of a ROS event. Therefore, to study the spatiotemporal variations and driving mechanisms of ROS events in China and analyze and compare them with existing research, this study adopted the definitions proposed by Yang et al. [25] and Zhou et al. [24], defining a daily ROS event as ≥1 mm of rainfall falling on ≥1 cm of snow cover during a 24 h period. Regardless of how accurate the precipitation classification method may be, there will always be some errors. Especially when precipitation amounts were less than 1 mm, it was difficult to distinguish precipitation types through field observations, let alone using models. This was why the minimum precipitation threshold was set at 1 mm. However, the main reason for setting the minimum snow depth threshold at 1 cm was that the snow depth data provided by observation stations had an accuracy of 1 cm. Furthermore, since the data were on a daily scale, there may have been instances of rainfall followed by snowfall on the same day, but, judging from the data, this situation would also be considered as a ROS event. Therefore, to avoid the above scenarios, we added the definition of snow depth > 0 cm on the day before the ROS event.
The intensity of ROS events is closely related to the magnitude of the hazard triggered by the ROS event (e.g., ROS flooding). For this reason, this study used the definition of ROS event intensity (Equations (1) and (2)) by Yang et al. [25]) to analyze the spatial and temporal variability of ROS event intensity and disaster risk in China. Note that to analyze the risk of flooding triggered by ROS events at each station, the ROS event intensity involved in this study is the maximum intensity.
R O S intensity = R + M
R O S intensity = < 10 Light   rainfall 10 25 Moderate   rainfall 25 50 Heavy   rainfall > 50 Rainstorm
where ROSintensity is ROS event intensity (mm/d); M is the daily snowmelt (mm/d); and R is the daily rainfall (mm/d). The calculation methods for R and M are described in Section 2.2.2 and Section 2.2.3, respectively.
Equation (2) is an equivalent equation for ROS event intensity and rainfall levels, which allows for a better understanding of ROS event intensity. Currently, people are relatively unfamiliar with ROS event intensity. By equating ROS event intensity with familiar rainfall levels, such as light rainfall or moderate rainfall, we can increase public awareness of ROS event intensity and better assess the flood risk associated with ROS events. When ROS event intensity is equivalent to light rainfall or moderate rainfall, the likelihood of triggering a flood is relatively low. However, when ROS event intensity reaches heavy rainfall, especially rainstorm, the probability of flooding increases significantly.

2.2.2. Discrimination of Precipitation Type

Many studies [30,31,32,33] have shown that a precipitation type classification approach that combines relative humidity is superior to a strategy that only considers air temperature. Therefore, Ding et al. [30] developed a new method for discriminating precipitation types based on parameters such as ps, Ta, RH, and altitude. The method shows high accuracy in identifying precipitation types in China [32]. Consequently, Ding’s method was used to distinguish precipitation types in this study. The specifics of Ding’s method are as follows:
P type = snow T w T min sleet T min < T w T max rain T w T max
where Tmax and Tmin are the threshold temperatures for sleet and snow, respectively (°C), and Tw is the wet bulb temperature (°C). Tmax, Tmin, and Tw can be calculated using the following equations.
T w = T a e s a t ( T a ) × ( 1 R H ) 0.000643 × p s + e s a t T a
T min = T 0 Δ S × ln e Δ T Δ S 2 e Δ T Δ S Δ T Δ S > ln 2 T 0 Δ T Δ S ln 2
T max = 2 × T 0 T min Δ T Δ S > ln 2 T 0 Δ T Δ S ln 2
T 0 = 5.87 0.1042 × Z + 0.0885 × Z 2 + 16.06 × R H 9.614 × R H 2
Δ T = 0.215 0.099 × R H + 1.018 × R H 2
Δ S = 2.374 1.634 × R H
where Ta is daily average air temperature (°C); esat(Ta) is saturation vapor pressure (hPa) at Ta, given by the Tetens’ empirical equation [34]; T0 refers to the temperature (°C) when half of the total of snow probability and the cumulative probabilities of sleet and snow are equal to 0.5; ΔS and ΔT represent temperature scale and temperature difference, respectively; and Z is altitude (m).

2.2.3. Daily Snowmelt

According to the definition of ROS event intensity, the daily snowmelt M is crucial for quantifying ROS event intensity. Typically, M is estimated using a temperature index model. However, the heat carried by rain during a ROS event accelerates snow cover ablation. Thus, the estimation of M on the day of a ROS event using a temperature index model that does not take into account the heat of rainwater may have a large bias. For this reason, Myers et al. [9] presented a model for estimating the amount of snowmelt on the day on which the ROS event occurred, as shown in Equation (10). This model takes into account the effect of heat carried by rainfall on snowmelt and can estimate the amount of snowmelt on the day of the ROS event more accurately. Therefore, in this study, Equation (10) was used to estimate M in the ROS event intensity.
M = σ Δ t p ( ( T a + 273 ) 4 273 4 ) + 0.0125 R s u m T r a i n + 8.5 U A D J Δ t p 6 ( ( 0.9 e s a t 6.11 ) + 0.00057 p a T a )
where σ is the snowmelt rate on the day of the ROS event (mm/K/h), which takes the value of 6. 12 × 10−10 [8,9]; Δtp is the time step (h), which takes the value of 8; Rsum is the daily total rainfall (mm); Train is the rain temperature (°C), which takes the value of the maximum value of Ta (°C) and 0; UADJ stands for the effect of wind speed on the snowmelt (mm/hPa/6 h), which takes the value of 0.15; and pa is the atmospheric pressure (hPa).

2.2.4. Calculation of Influencing Factors

Note that due to the low number for ROS events in summer, only the cold season (spring, autumn, and winter) was considered in the analysis of the influencing factors. The relevant influencing factors are calculated as follows: Air temperature is the mean of daily mean air temperature in the cold season of a year. Snow cover days are the total of the sum of days with snow depth ≥ 1 cm in the cold season of a year. Rainfall days are the total of the sum of days with rainfall ≥ 1 mm in the cold season of a year. Snowfall-to-precipitation ratio is the ratio of the sum of daily snowfall to total precipitation in the cold season of a year. The quantity of rainfall is the sum of daily rainfall in the cold season of a year. Snow water equivalent is the average of daily snow water equivalent > 0 mm in the cold season of a year. In addition, to correspond with the impact factor, the intensity and number for ROS events were also calculated for the cold season of the year in the impact factor analysis.

2.2.5. Trend Analysis

In this study, the trend in ROS events (namely, the correlation of the intensity and number of ROS events with the year) across stations was analyzed using Spearman’s rho [35], which effectively avoids the impact of 0 values with trend analysis [36]. Moreover, correlations (that is, trends) of air temperature, snow cover days, rainfall days, snowfall-to-precipitation ratios, quantity of rainfall, and snow water equivalent with the year across stations were calculated using Spearman’s rho. The Spearman’s rank correlation coefficient r was calculated from Equation (11).
r = 1 6 i = 1 n R D i 2 n 3 n
where RDi is the rank difference between each data pair (xi, yi); n is the sum of data pairs; and r is the level for the ROS event trend, ranging from −1 to 1. The significance of ROS event trends was assessed using a two-sided significance test (α = 0.05).

2.2.6. Correlation Analysis

In the analysis of the influencing factors, all data were first detrended, after which the partial correlation coefficient (ranging from −1 to 1) between the independent and dependent variables was calculated using the partial correlation analysis model. A partial correlation coefficient < 0 indicates a negative correlation, >0 indicates a positive correlation, and 0 indicates no correlation. The reason for using the partial correlation analysis model in the analysis of the influencing factors is that the model is able to exclude the interaction of other factors in the multivariate analysis. The significance of the effect of each factor on the intensity and number of ROS events was assessed using a two-sided significance test (α = 0.05).

3. Results

3.1. Spatial and Temporal Patterns for ROS Events in China

3.1.1. Spatial Distribution

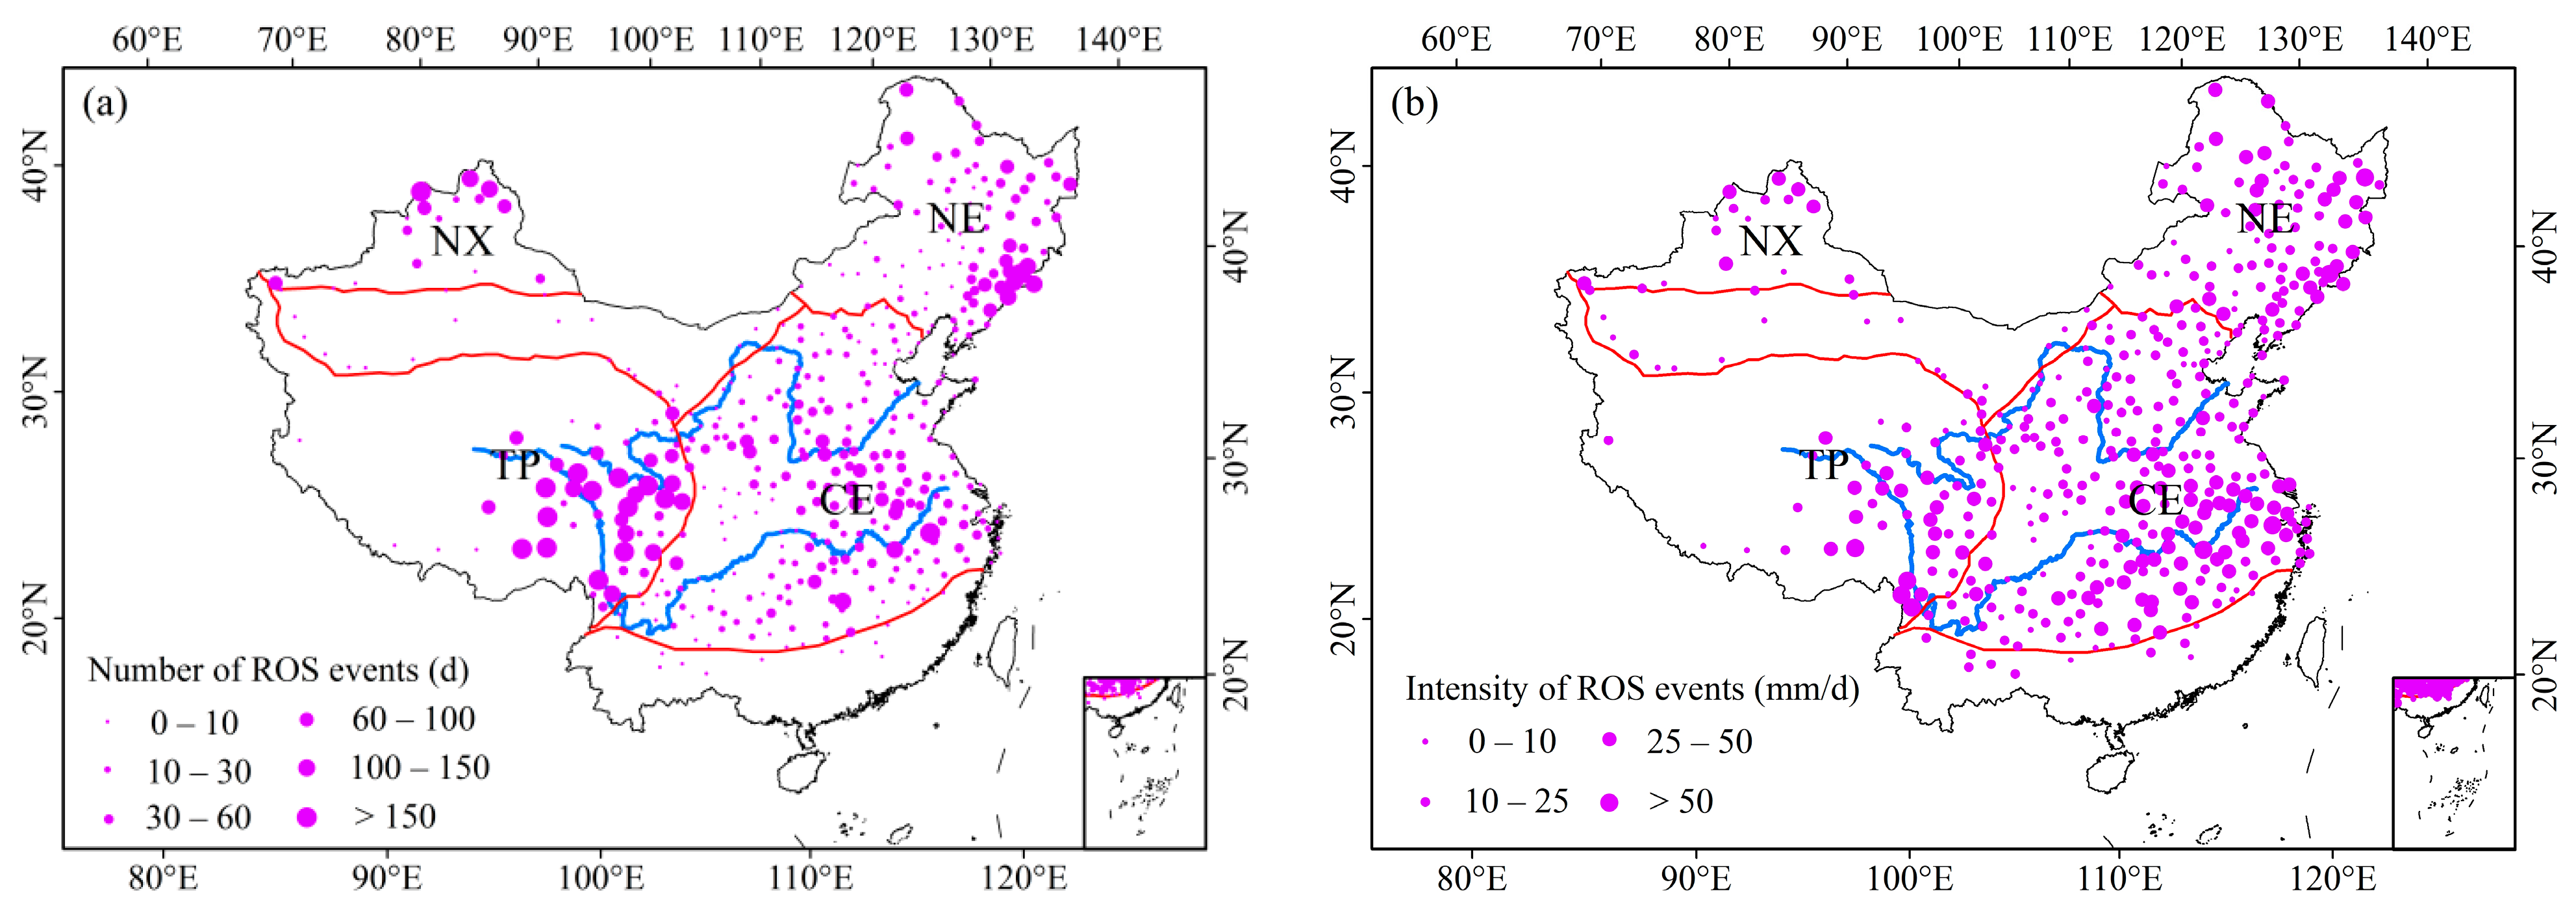
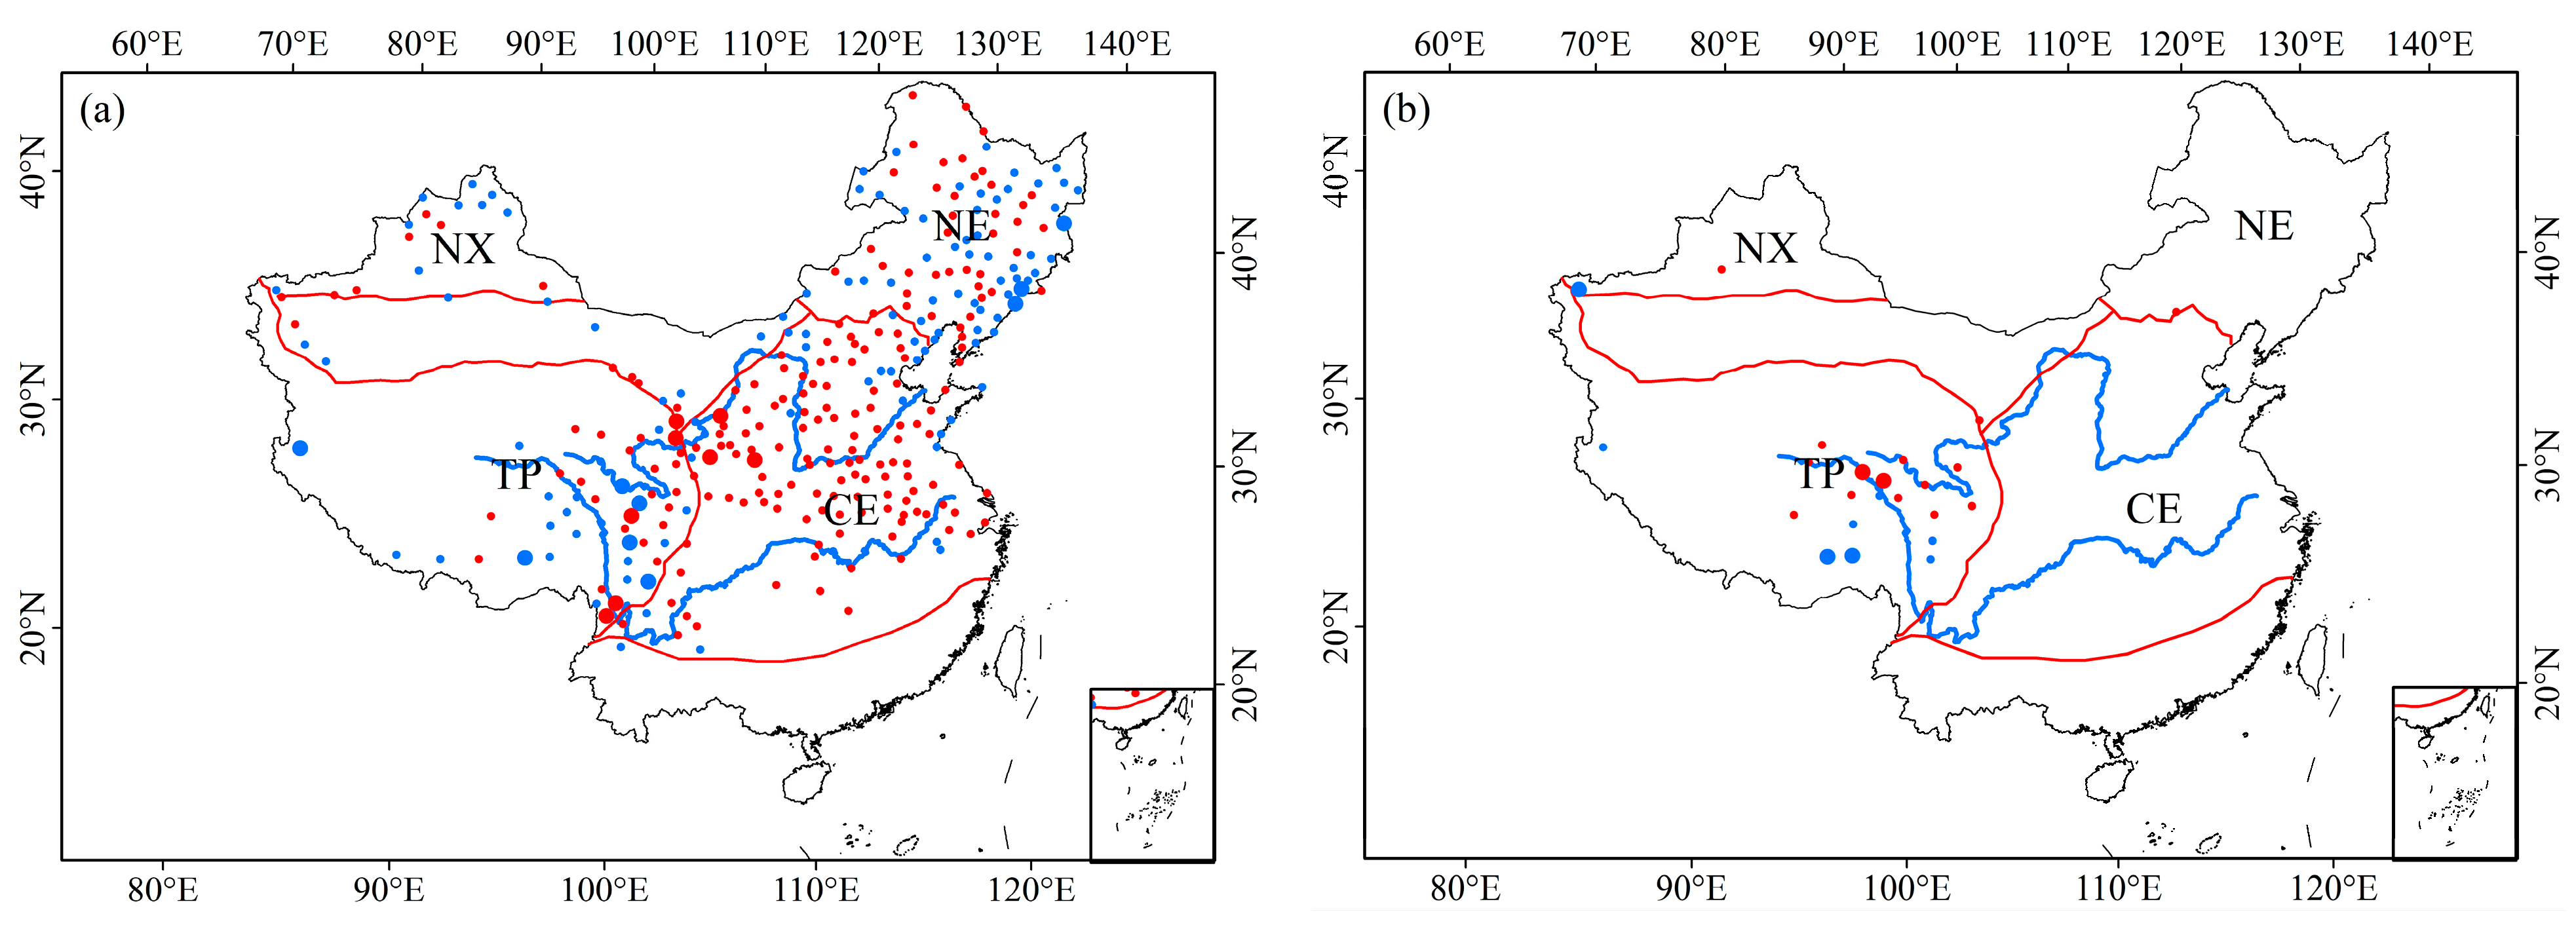
Among the analyzed stations, 418 experienced at least one ROS event from 1978 to 2020, while 95 stations did not experience any ROS events (Figure 2a). The 418 stations were predominantly located in northern Xinjiang (NX), Northeast China (NE), the Qinghai–Tibet Plateau (TP), and central and eastern China (CE).
In NX, ROS events primarily occurred in the Altay Mountains and on the northern slopes of the Tianshan Mountains. Furthermore, the Ili River Valley and the northern part of Tacheng Prefecture, which were influenced by the monsoon, exhibited more rainfall days, and ROS events frequently occurred. In NE, the Xiaoxing’an Mountains, Changbai Mountains, and Daxing’an Mountains were prone to ROS events. In the TP, ROS events were concentrated in the Qilian Mountains and the southeast part of TP due to the substantial rainfall and snowfall [37,38]. ROS events in CE mainly occurred in the Loess Plateau and middle and lower Yangtze River Plain (MLYRP).
Figure 2b shows that the intensity of ROS events is high in the Altay Mountains and Ili River Valley of NX, the Changbai Mountains and Xiaoxing’an Mountains in NE, the southeast part of TP, and MLYRP, and can reach 25–50 mm/d. The intensity of ROS events even reached more than 50 mm/d in the Hengduan Mountains and in parts of MLYRP. The southeast part of TP, the Altay Mountains, the Ili River Valley, and the Changbai Mountains had frequent ROS events and their intensities were high, which leads to a higher risk of flooding.

3.1.2. Seasonality Distribution

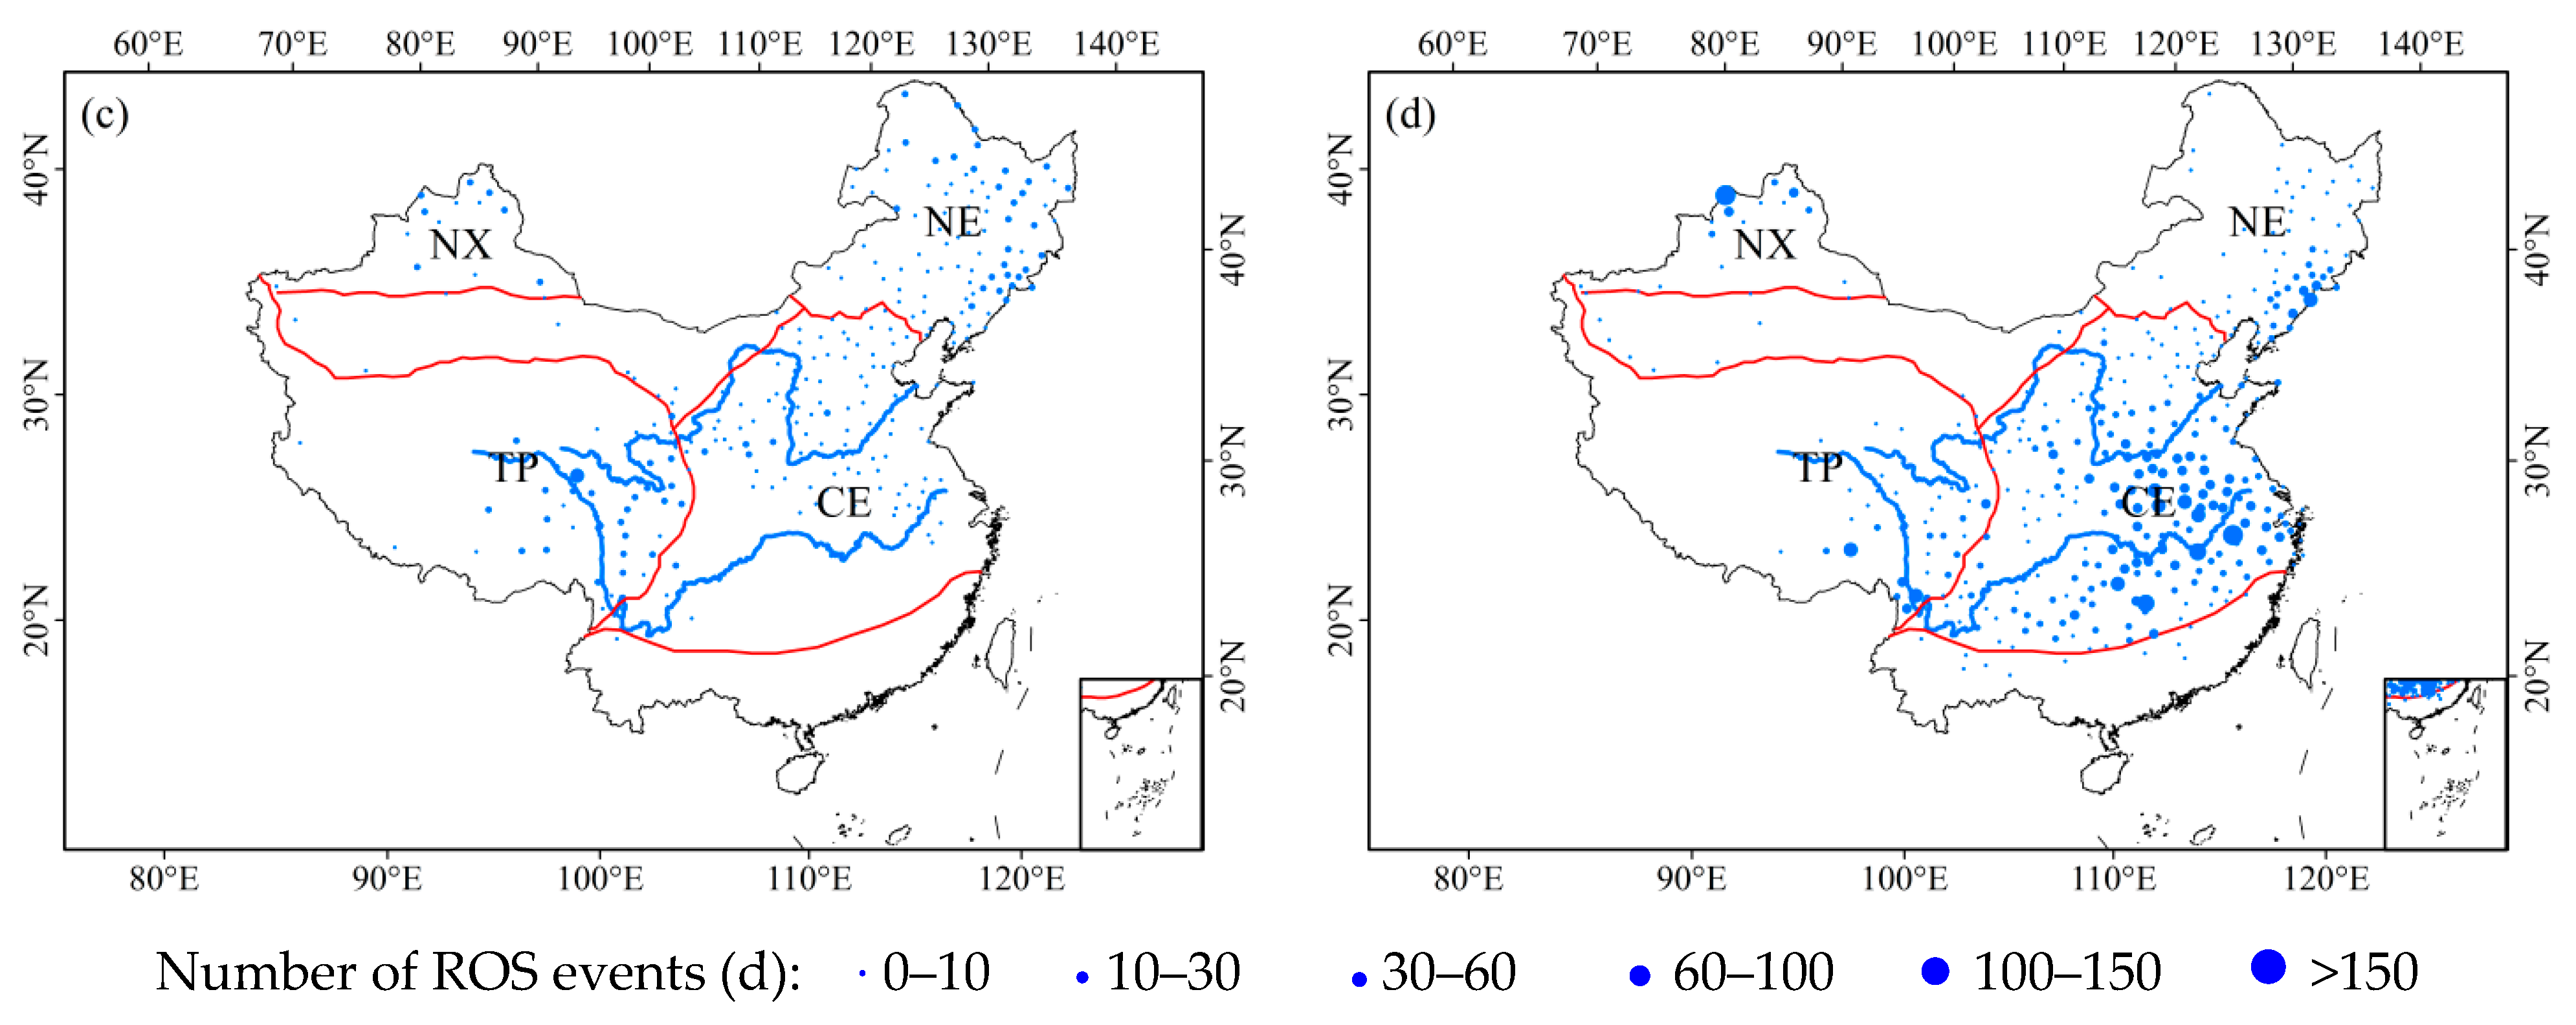
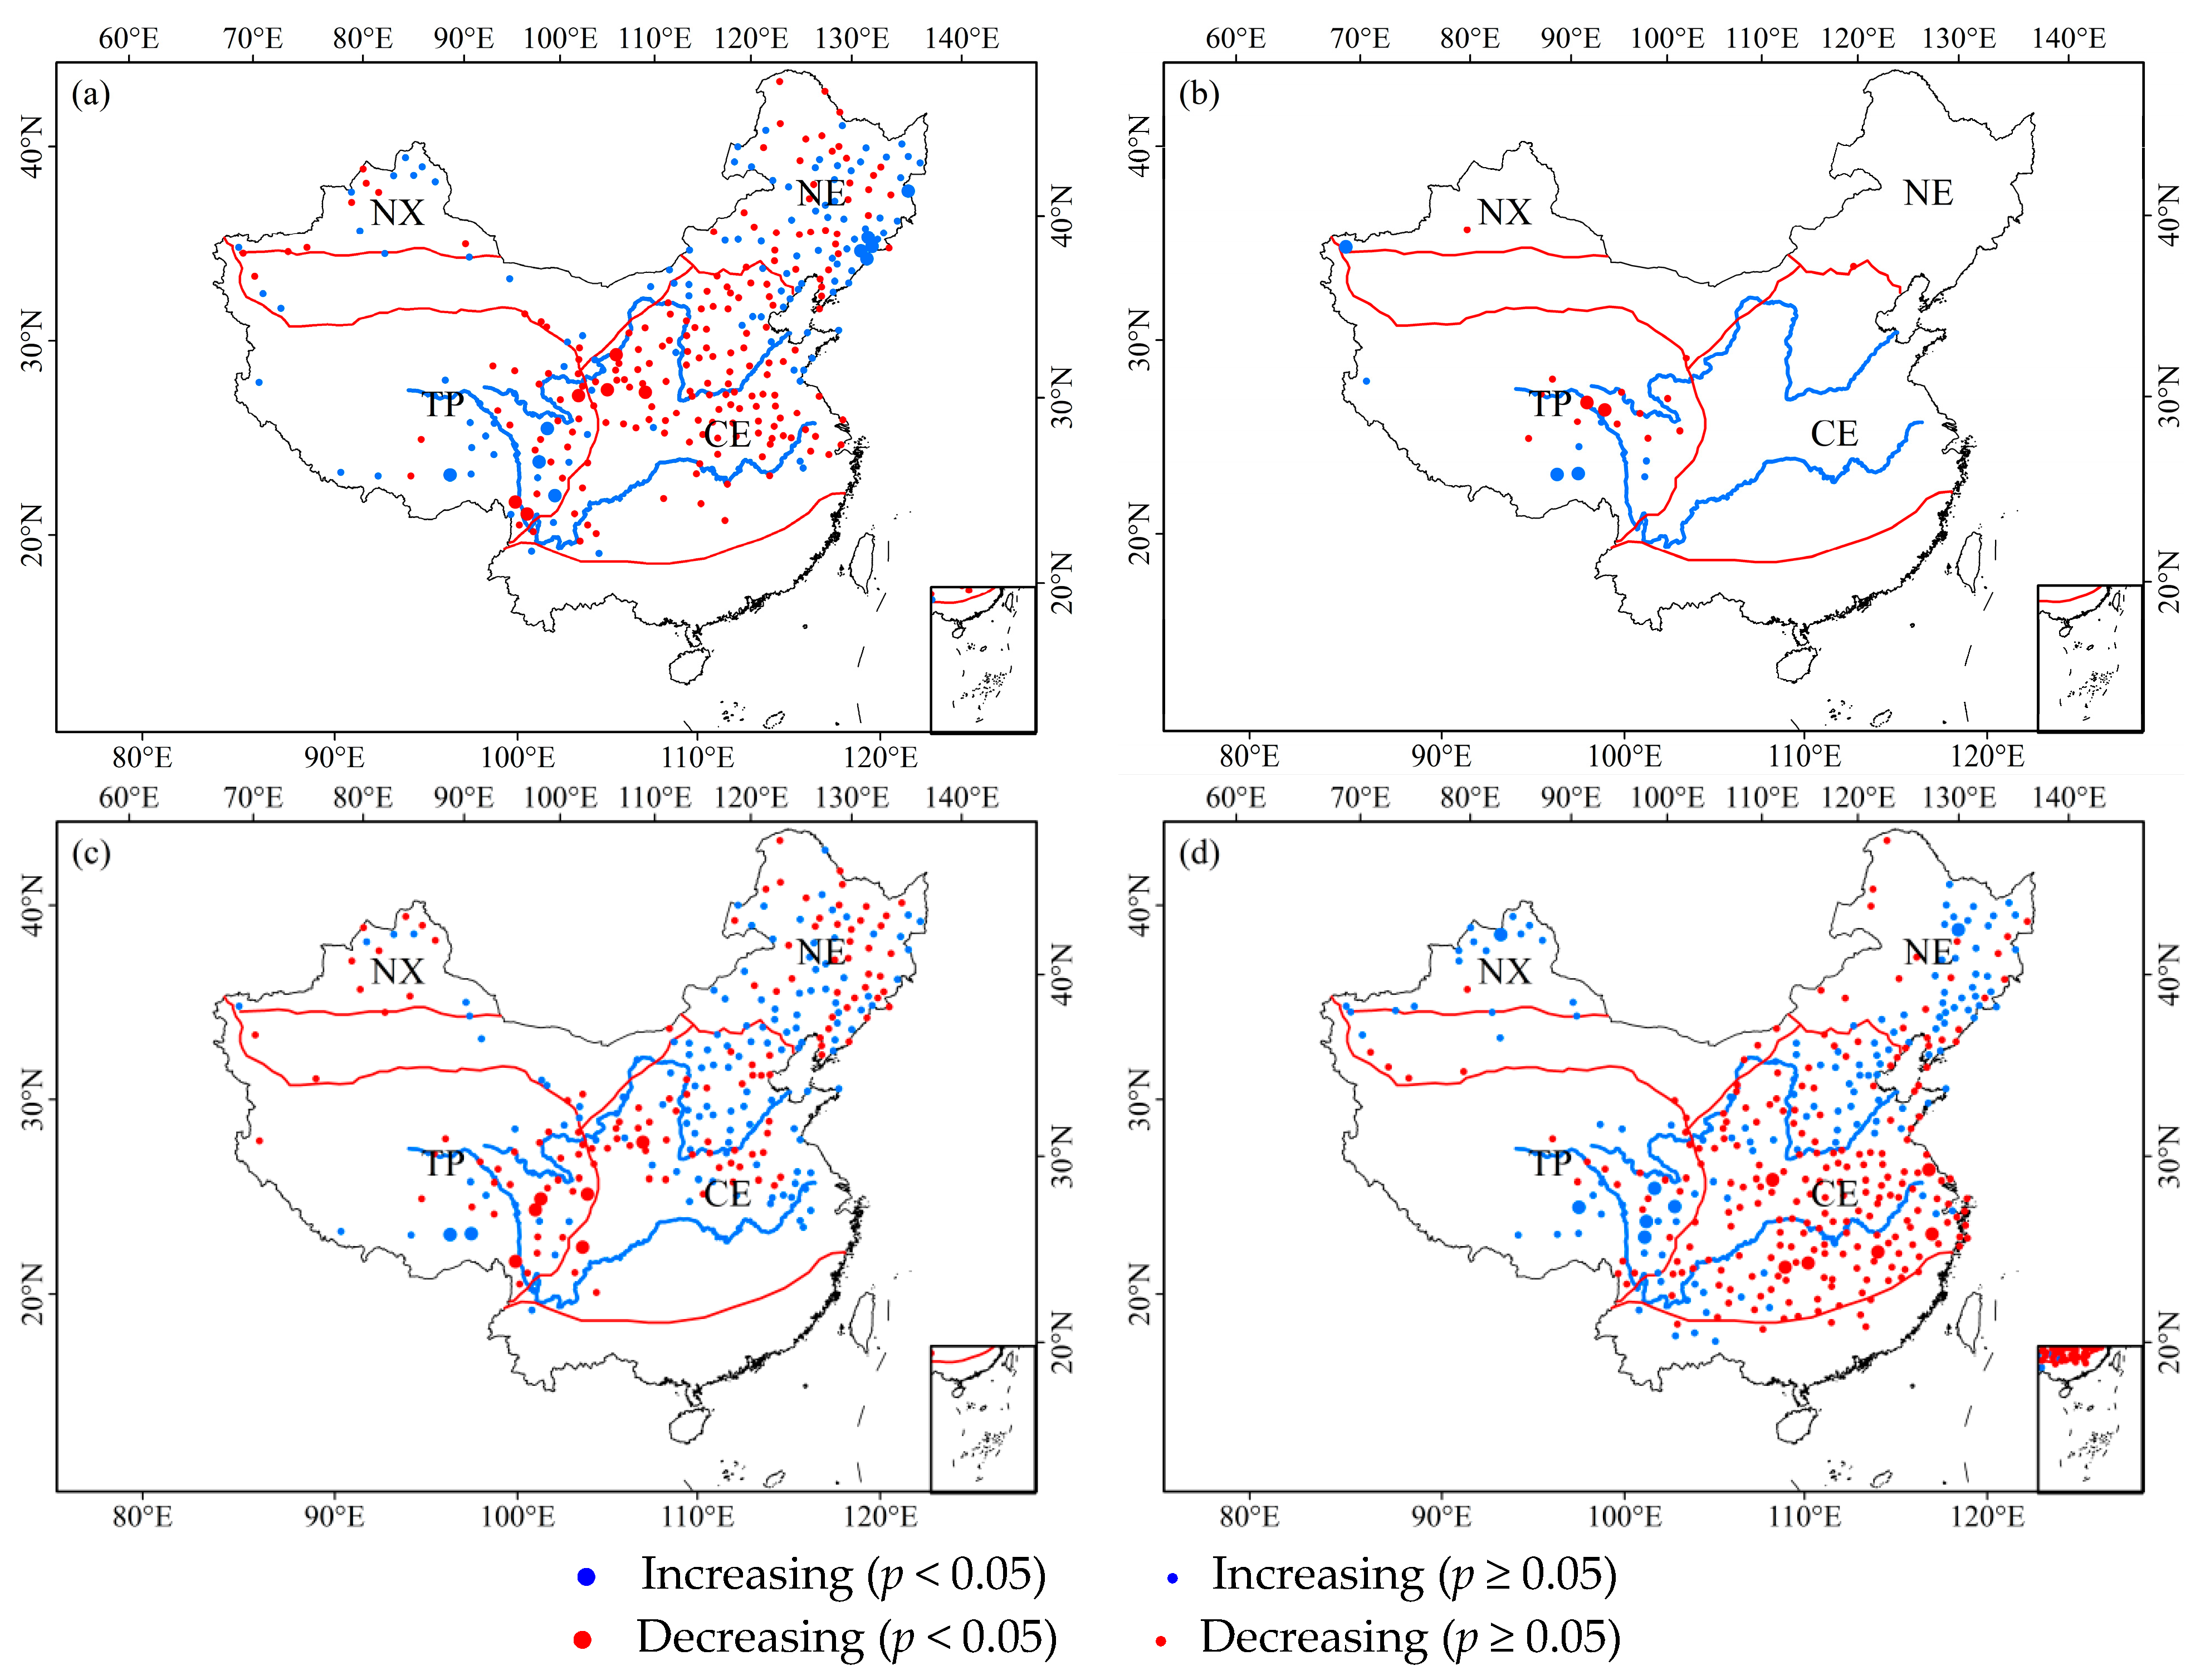
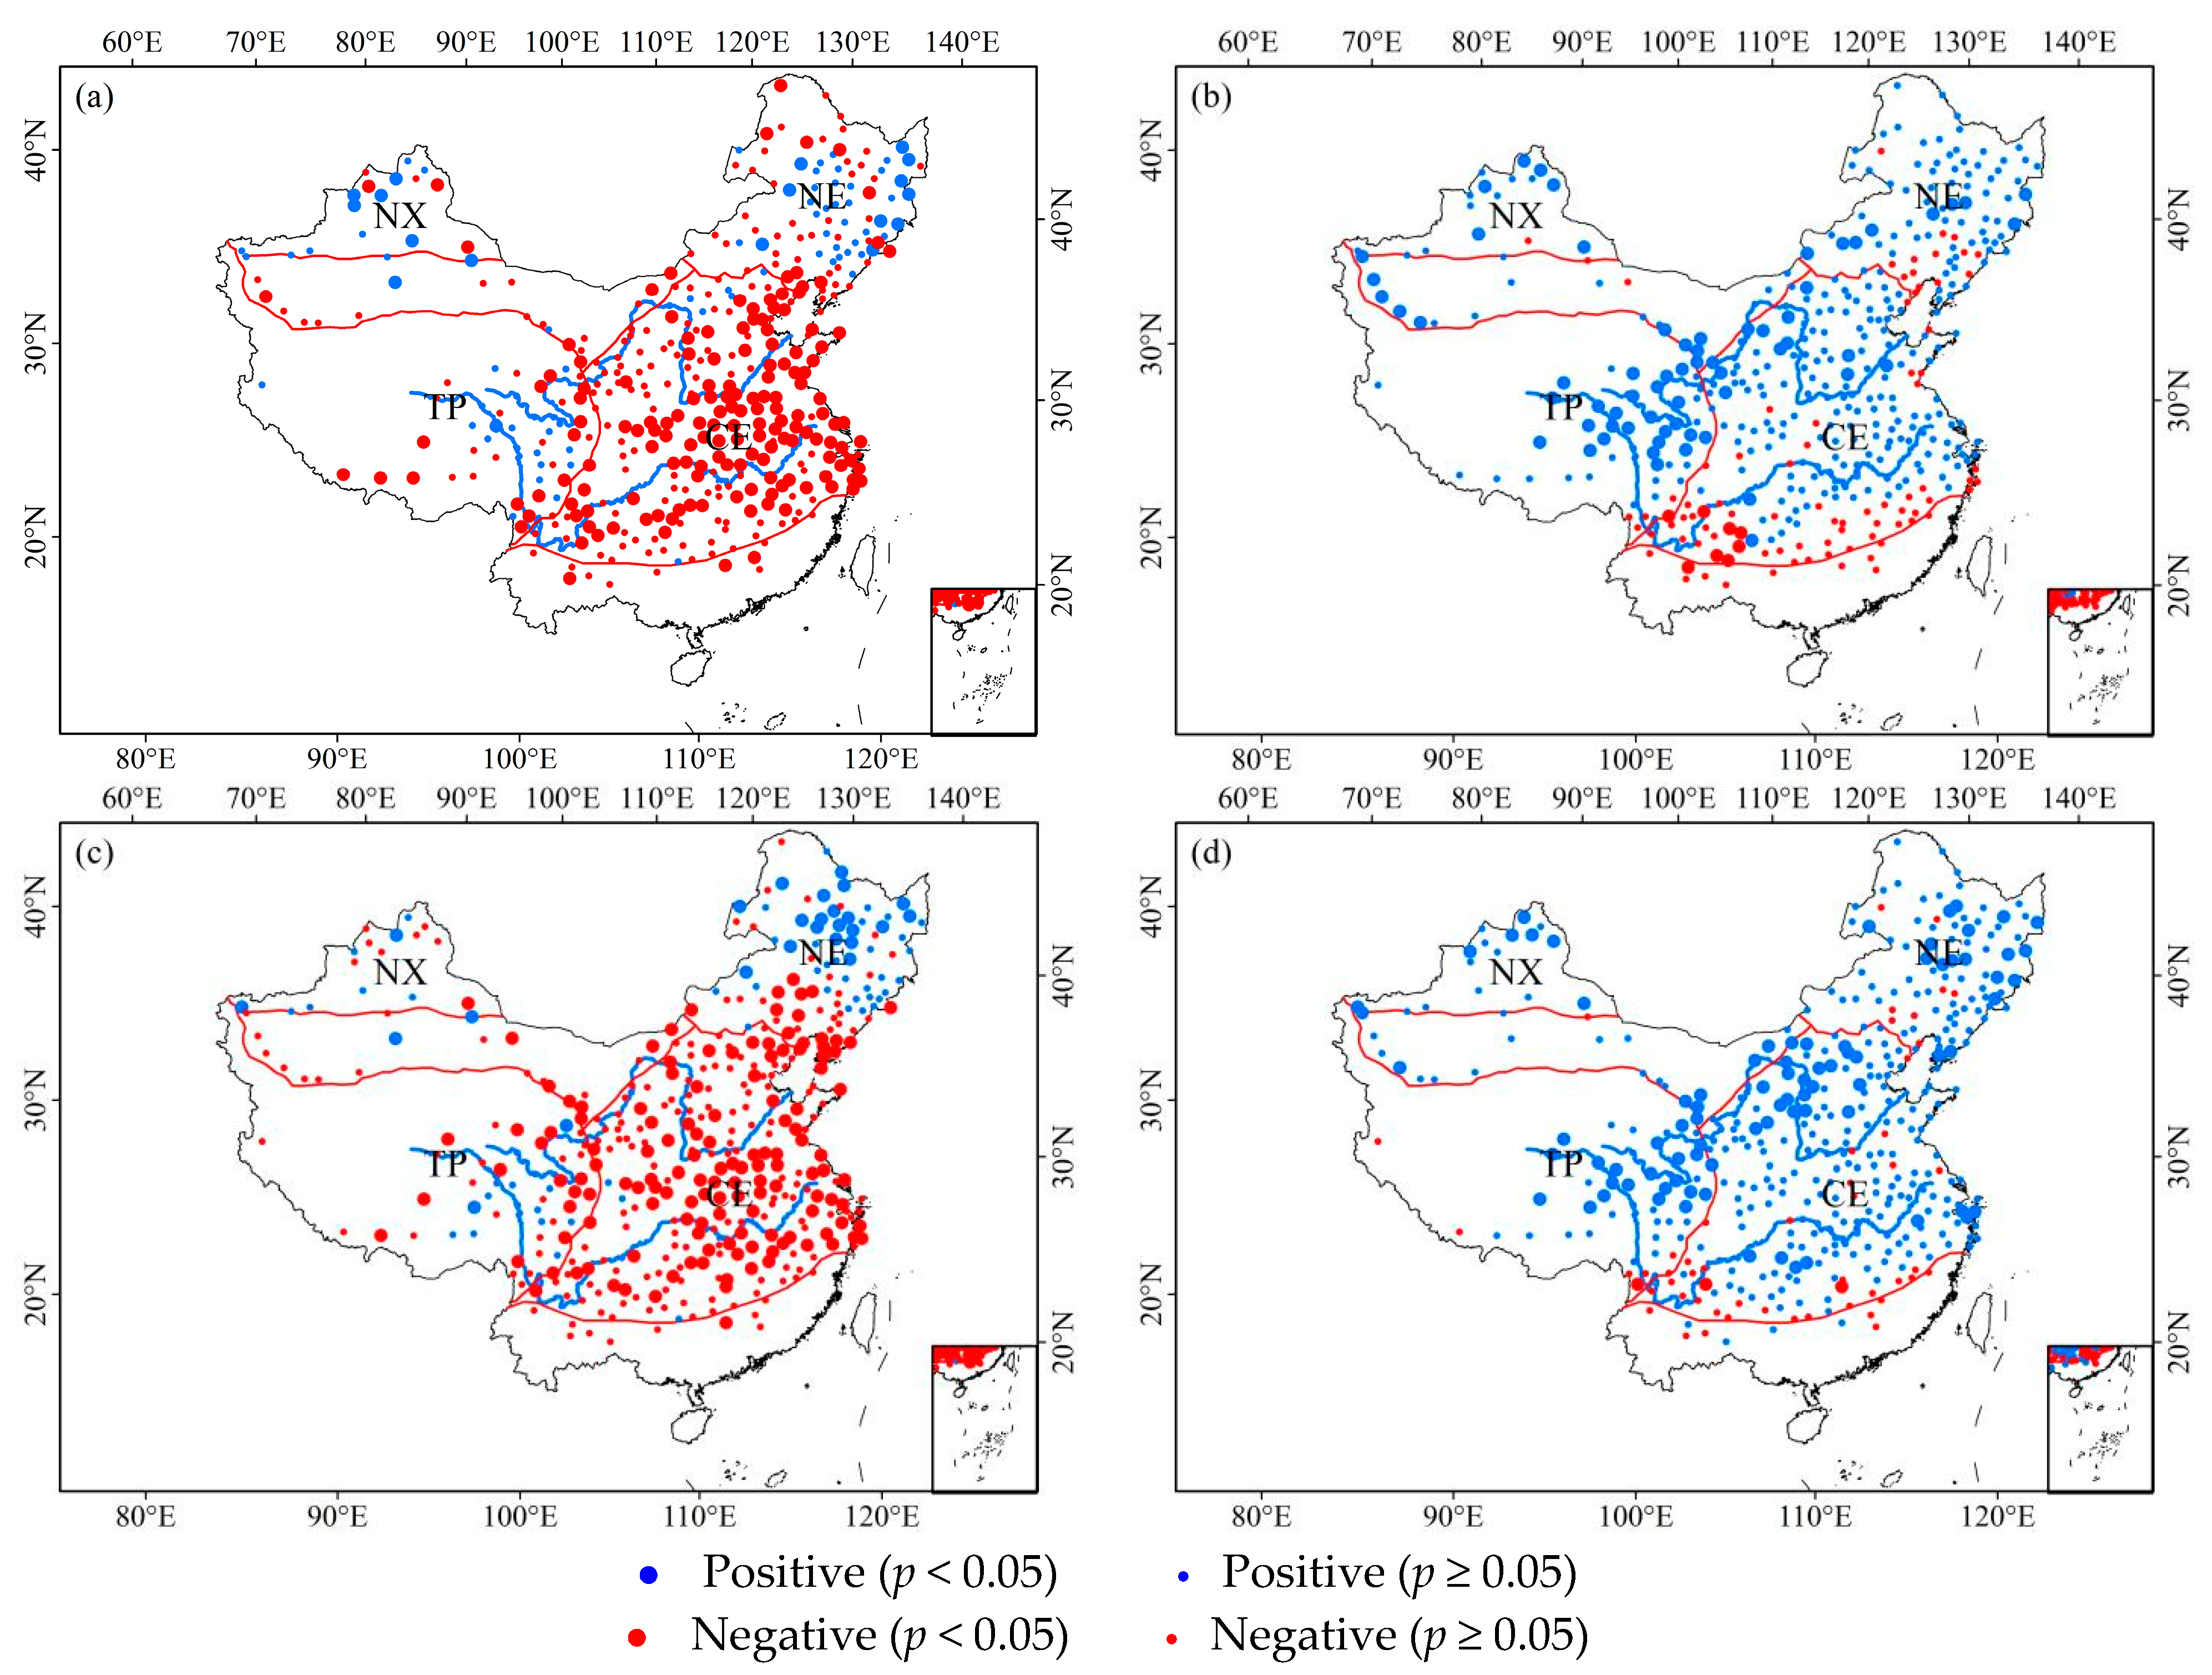
In spring and autumn, ROS events were concentrated mainly in TP, NX, and the Changbai Mountains, with TP experiencing the highest frequency (Figure 3a,c). In summer, ROS events occasionally occurred in the southeast part of TP (Figure 3b). In winter, ROS events occurred frequently in the Altay Mountains and Tacheng Prefecture, the Hengduan Mountains, Changbai Mountains, and MLYRP (Figure 3d).
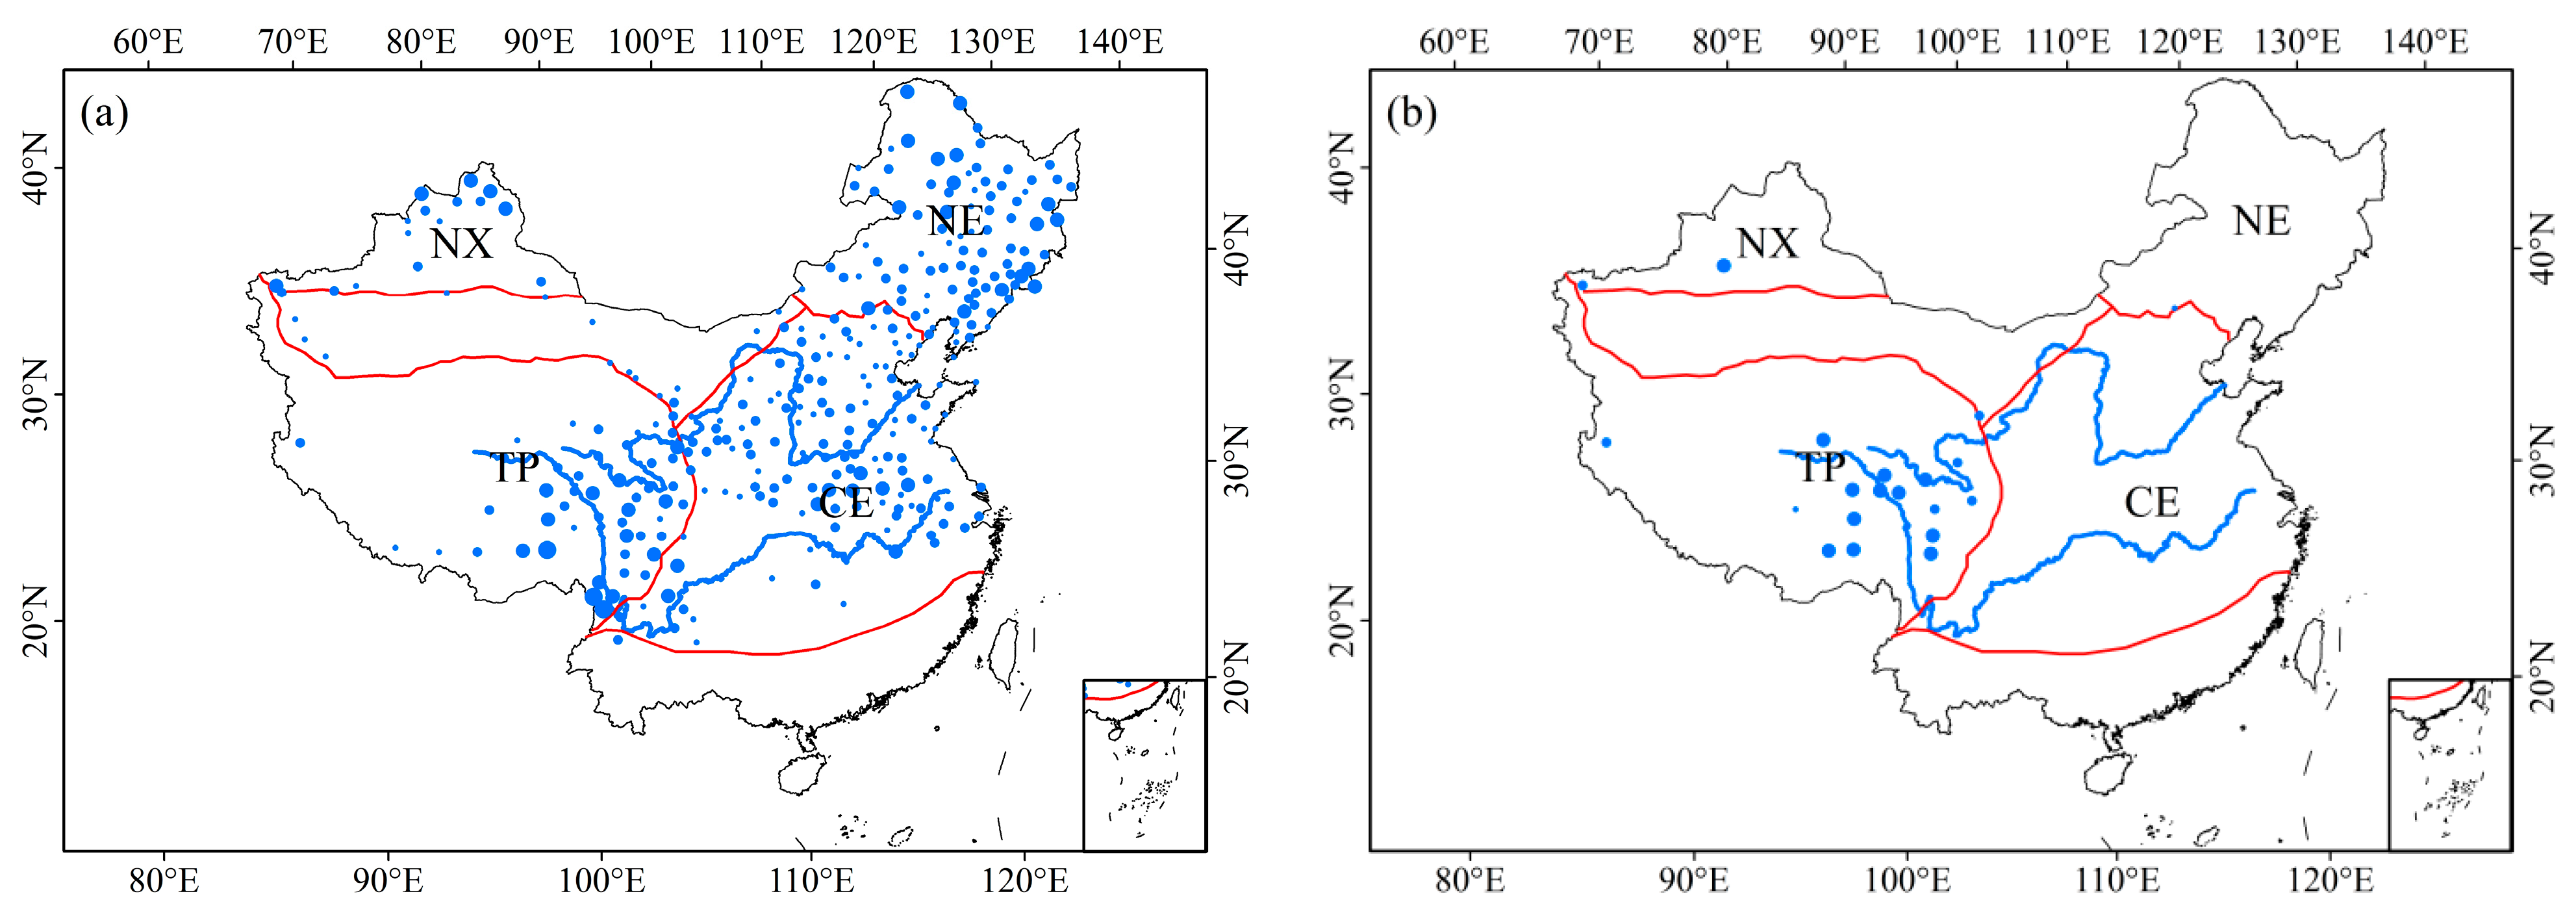
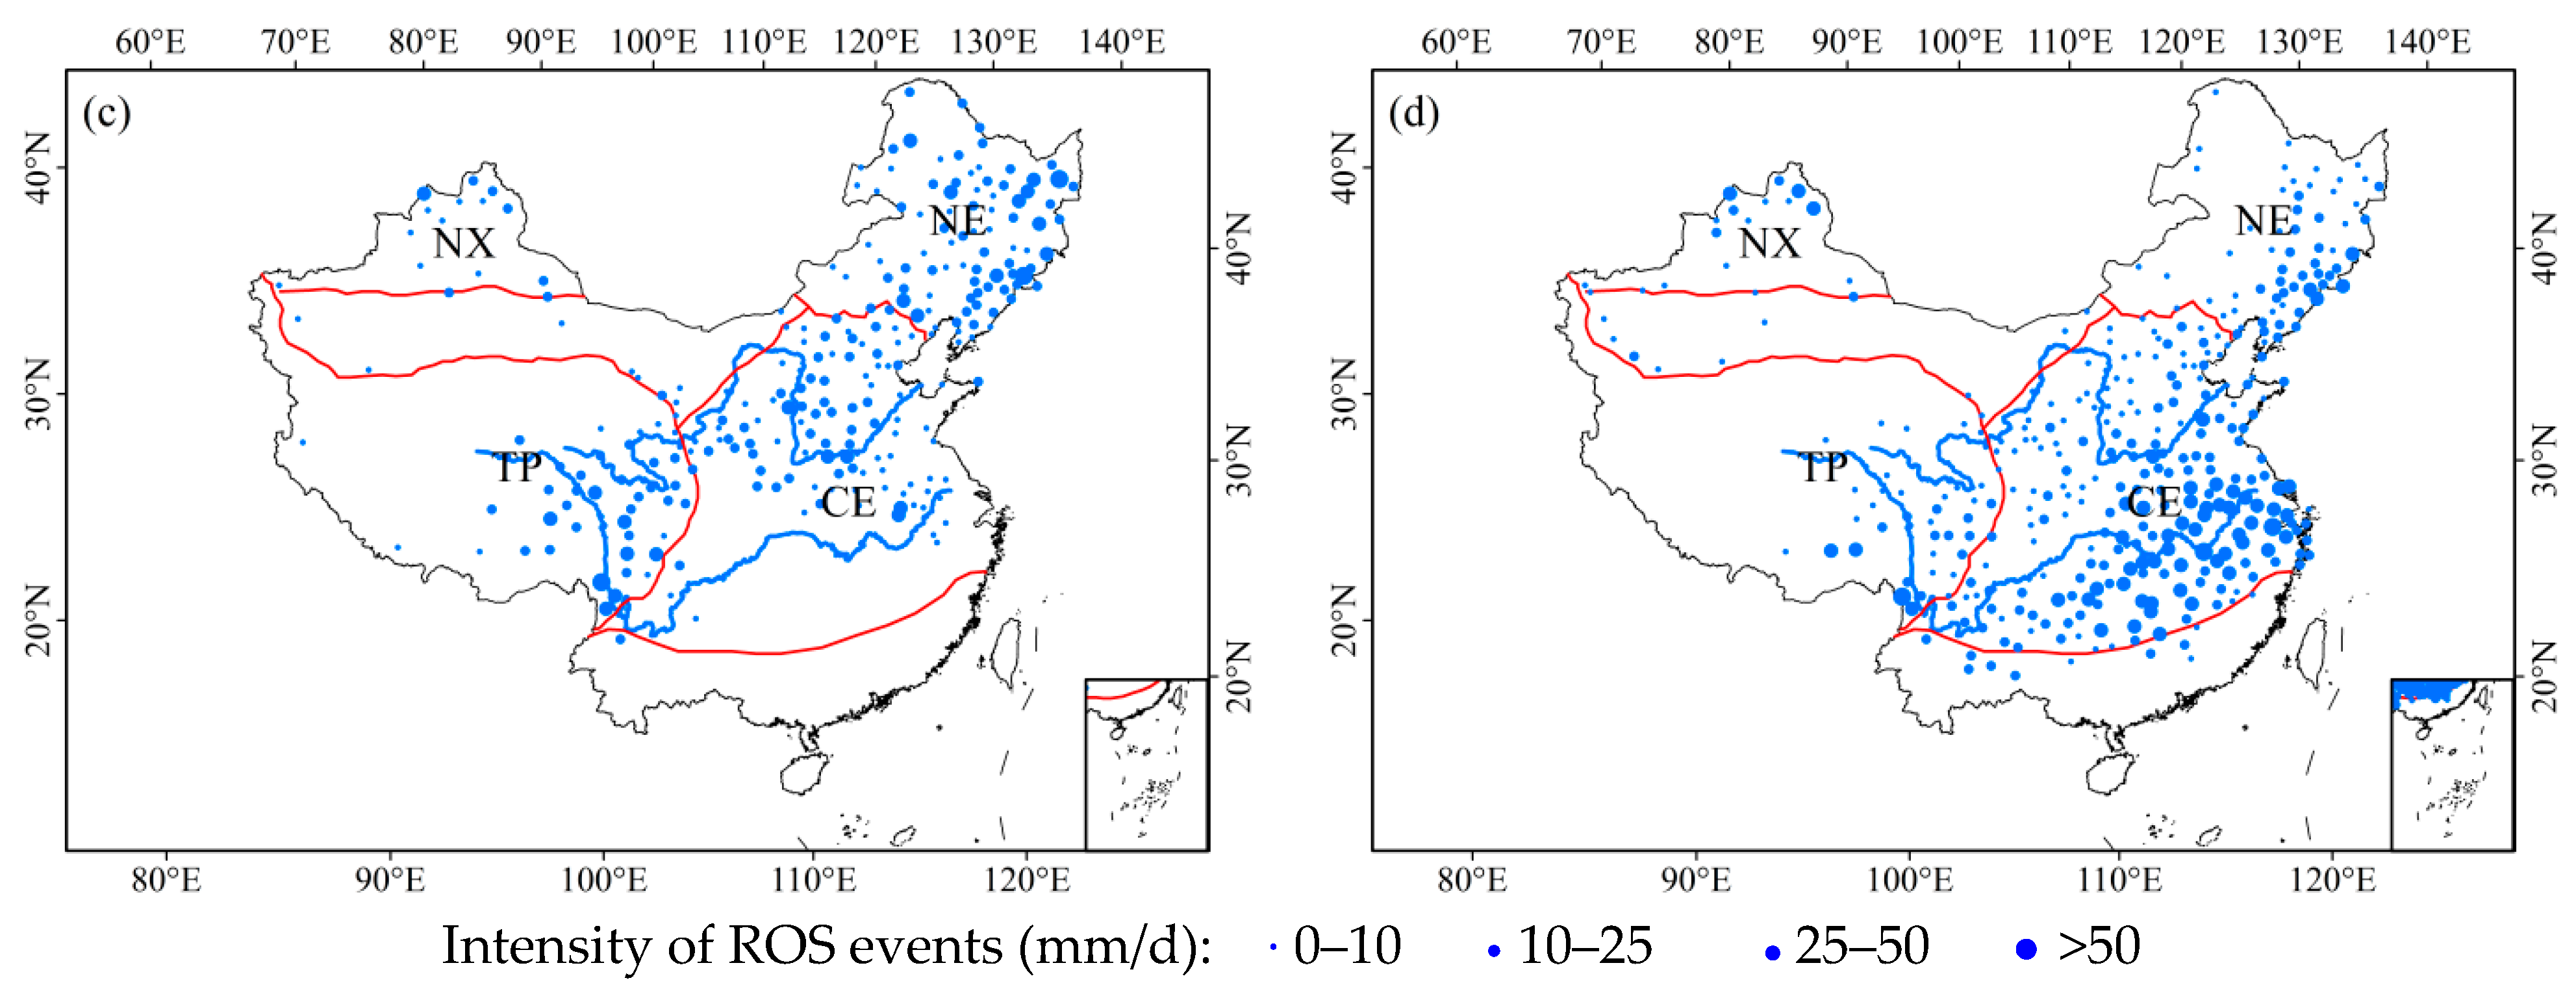
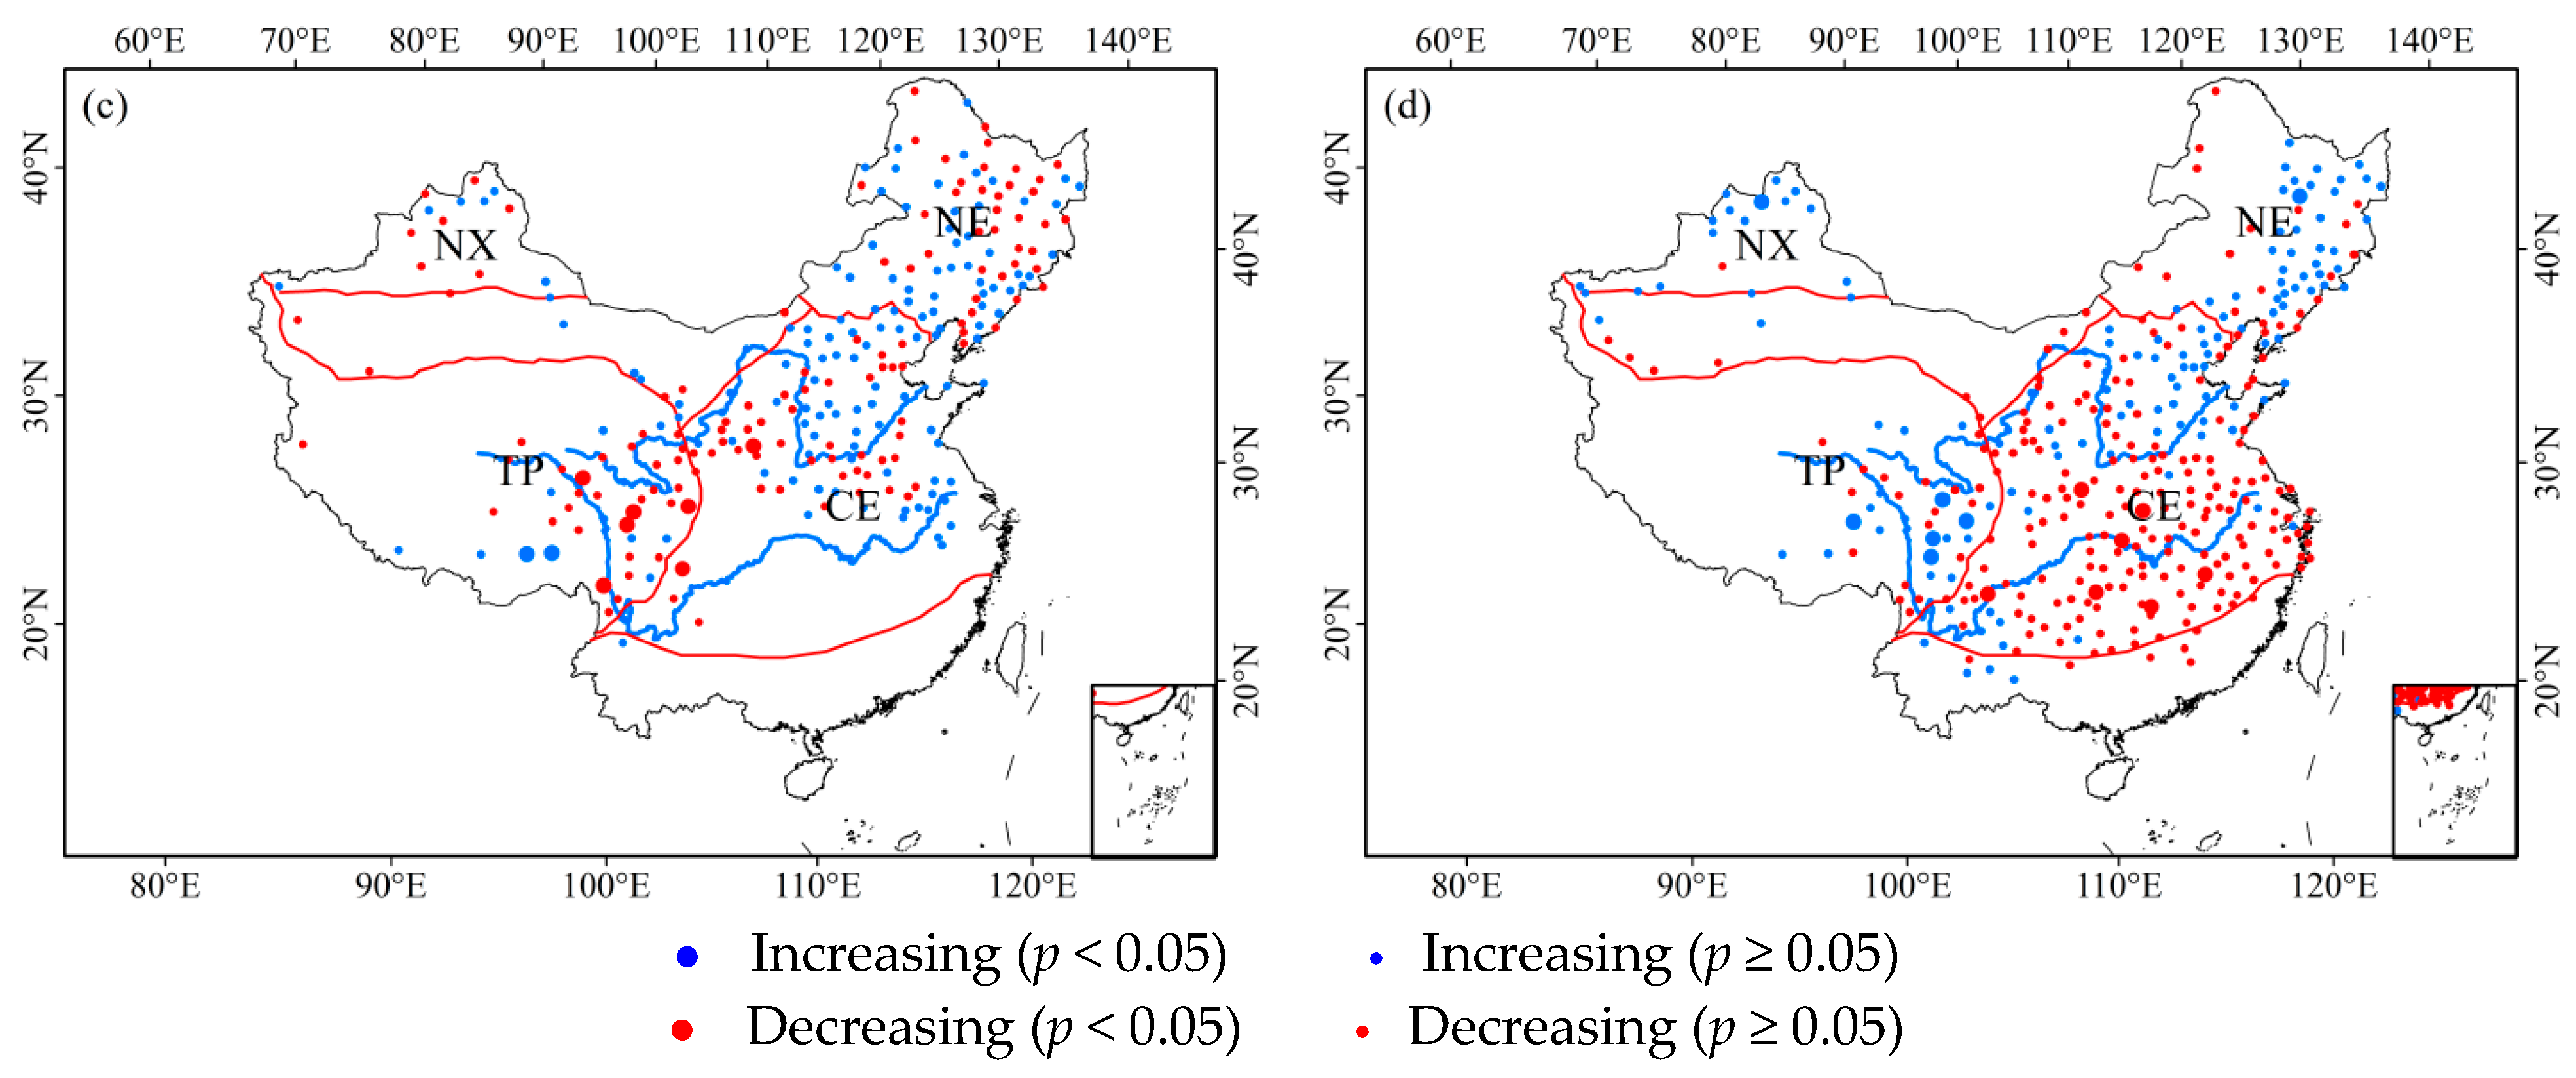
Figure 3 shows that the seasonality distribution of the number of ROS events varies widely, as does their intensities (Figure 4). In spring, the intensity of ROS events was greater in the Altay Mountains, Ili River Valley, the southeast part of TP, Changbai Mountains, and Daxing’an Mountains, and reached 25 mm/d and above. In summer, although ROS events occasionally occurred in the southeast of TP, their intensities could reach 25–50 mm/d. In autumn, in the southeast part of TP, the Changbai Mountains, and Xiaoxing’an Mountains, the intensity of ROS events could reach 25 mm/d and above. In winter, the more intense ROS events (greater than or equal to 25 mm/d) were mainly concentrated in MLYRP due to the influence of air temperature.
In summary, the probability of ROS flooding was higher in spring in the southeast part of TP, the Altay Mountains, and Ili River Valley, and needs to be taken seriously.

3.2. Trends in ROS Events in China

3.2.1. Inter-Annual Trends

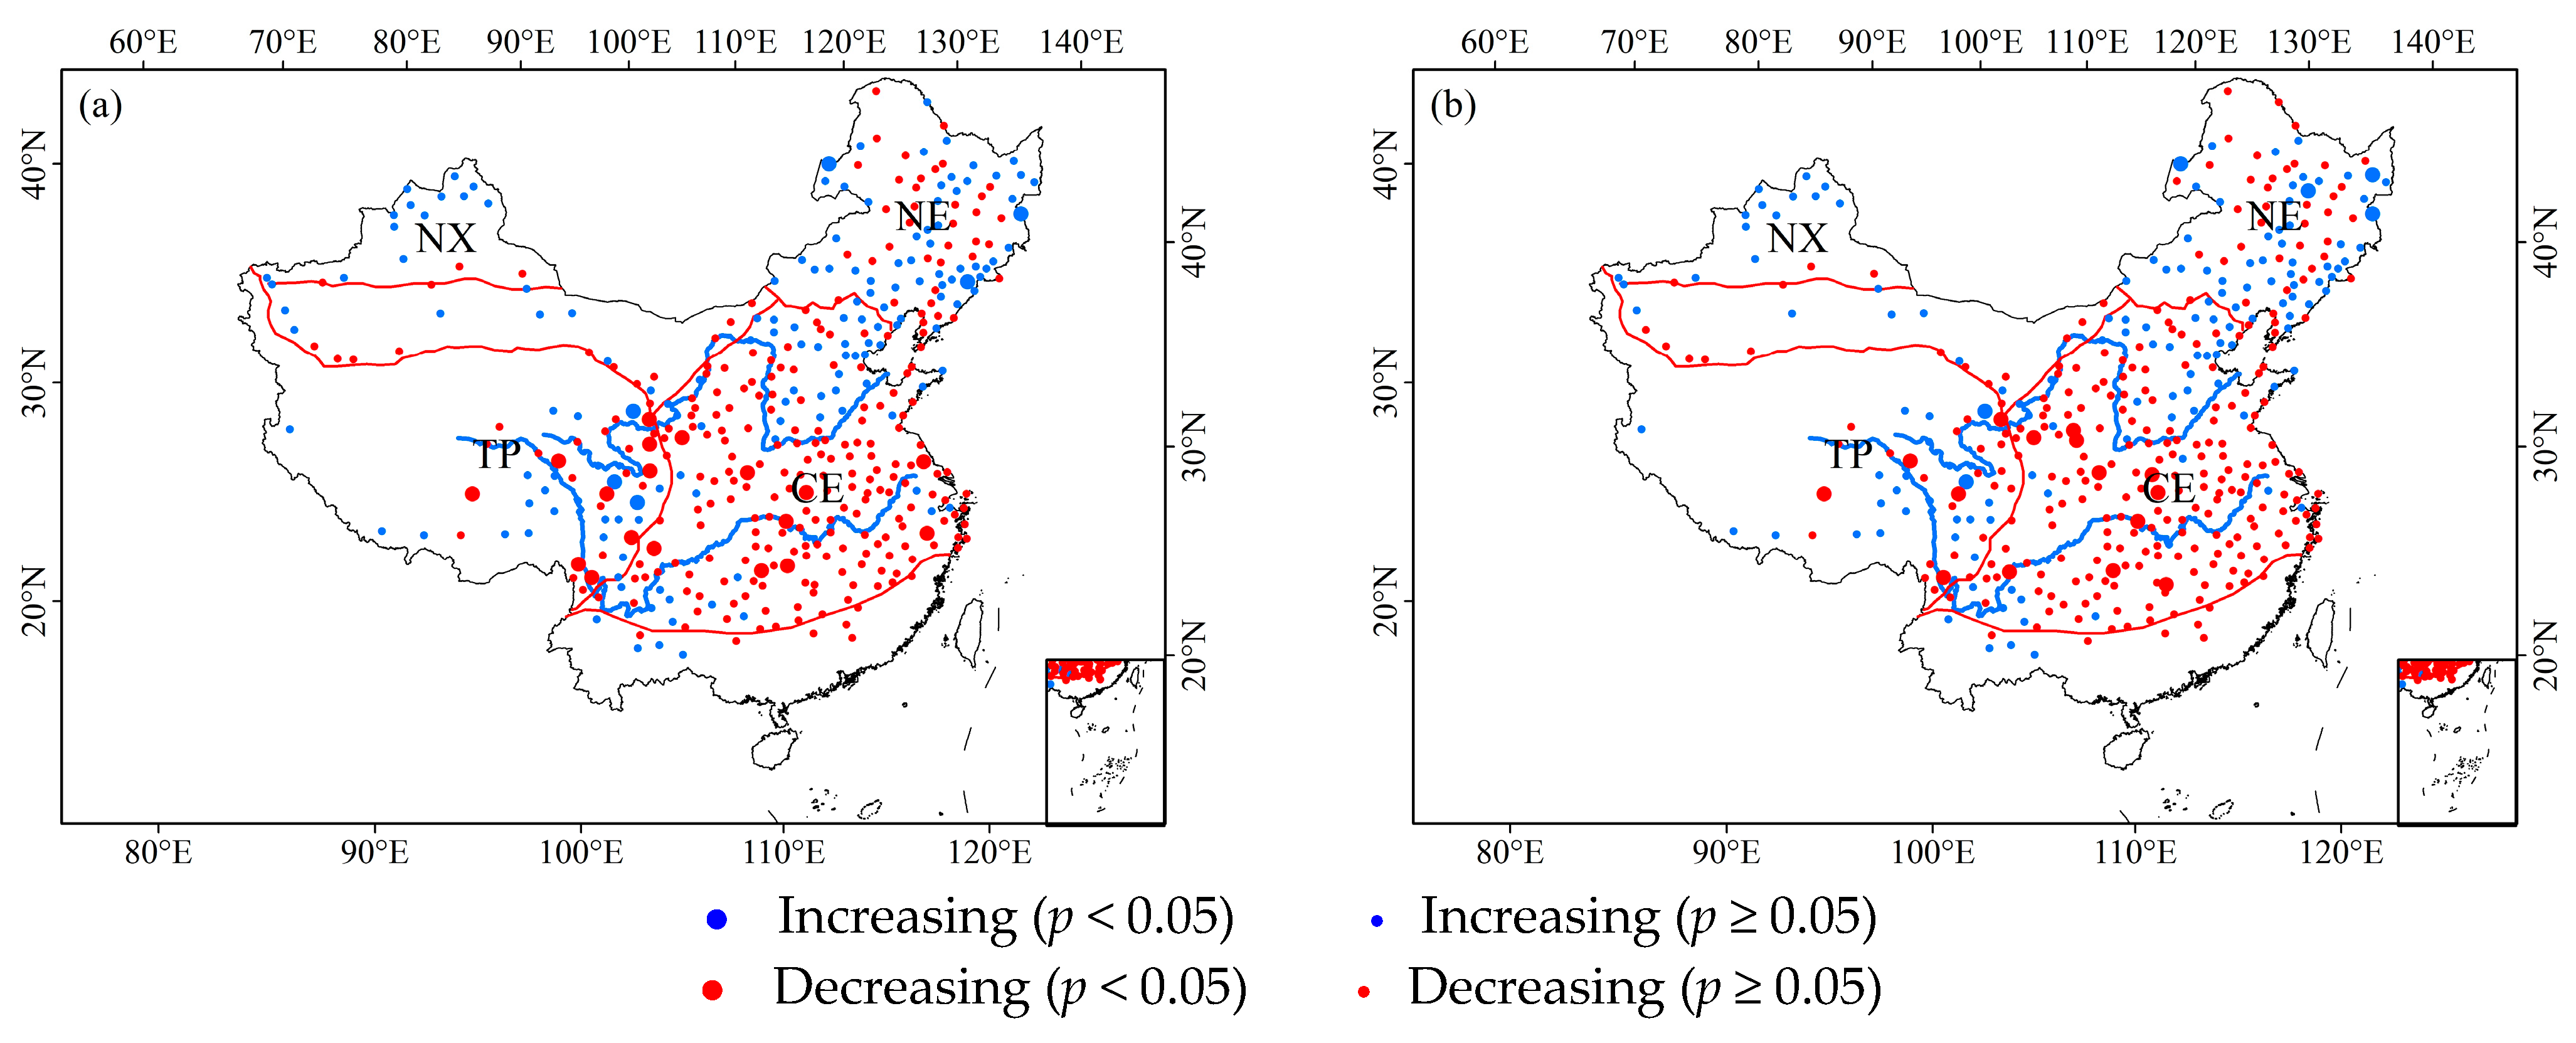
In the past 43 years, the number of ROS events has been increasing in NX and the Changbai Mountains, especially in the Changbai Mountains (Figure 5a). However, the number of ROS events has been decreasing in CE and the southeast part of TP, especially in the southeast part of TP (Figure 5a). The trend in the intensity of ROS events was generally consistent with that of the frequency of ROS events (Figure 5a,b).

3.2.2. Seasonality Trends

In spring, the number of ROS events increased significantly (p < 0.05) in the Changbai Mountains and the southeast part of TP (Figure 6a). In autumn, the number of ROS events in the southeast part of TP decreased significantly (p < 0.05) (Figure 6c). In winter, the number of ROS events significantly (p < 0.05) increased in the Altay Mountains and the southeast part of TP, but decreased significantly (p < 0.05) in MLYRP (Figure 6d).
The trend in the intensity of ROS events was generally consistent with that of the total of ROS events (Figure 6 and Figure 7). This consistency indicated that the number and intensity of ROS events were simultaneously increasing again in the Changbai Mountains and the southeast part of TP in spring, and in the Altay Mountains and the southeast part of TP in winter, and also showed that the risk of disasters associated with ROS events was intensifying.

3.3. Factors Influencing Changes in ROS Events

The results showed that in NX, NE, and TP, the changes in the number of ROS events were mainly affected by snow cover days and rainfall days. Specifically, the number of ROS events in these regions increased with an increase in the snow cover days and rainfall days (Figure 8). However, in CE, changes in the number of ROS events were mainly influenced by snow cover days. Specifically, the number of ROS events in this region increased with an increase in the snow cover days (Figure 8).
Similar to the case of the number of ROS events, air temperature had no direct effect on the changes in the intensity of ROS events (Figure 9a). In NX, NE, and TP, the intensity of ROS events increased with increasing snow water equivalent and quantity of rainfall (Figure 9b,c). However, in CE, the intensity of ROS events increased with increasing snow water equivalent (Figure 9b,c).
Figure 8 and Figure 9 show the main drivers of the number and intensity of ROS events. To further clarify the impact of each factor on the number and intensity of ROS events, we analyzed the trends in the main drivers, as shown in Figure 10. The results show that in CE, snow cover days and snow water equivalent decreased significantly (p < 0.05), and rainfall days and quantity of rainfall increased, but not significantly. In TP, snow cover days and snow water equivalent decreased significantly (p < 0.05), and rainfall days and quantity of rainfall increased significantly (p < 0.05). In NE, snow cover days decreased significantly (p < 0.05) in the Daxing’an Mountains and Xiaoxing’an Mountains; rainfall days showed a slight increasing trend throughout NE; snow water equivalent increased significantly (p < 0.05) in the Daxing’an Mountains and Xiaoxing’an Mountains; and quantity of rainfall increased significantly (p < 0.05) in the Daxing’an Mountains and Changbai Mountains. In NX, snow cover days, rainfall days, and quantity of rainfall all increased significantly (p < 0.05), and snow water equivalent decreased slightly.
Comprehensive analysis of Figure 5, Figure 8, Figure 9 and Figure 10 showed that the decrease in the number of ROS events in CE (e.g., MLYRP) and TP was caused by the decrease in snow cover days, and the decrease in the intensity of ROS events was caused by the decrease in snow water equivalent. The change in the number of ROS events in NE (e.g., the Changbai Mountains) was mainly affected by the change in snow cover days, and the change in the intensity of ROS events was mainly affected by the change in snow water equivalent. The increase in the number of ROS events in NX (e.g., the Altay Mountains) was mainly affected by the increase in rainfall days, and the increase in the intensity of ROS events was mainly affected by the increase in quantity of rainfall.
In summary, we need to focus on regions where the number and intensity of ROS events are significantly increasing. In these regions, disasters caused by ROS events will become increasingly frequent (e.g., floods or water shortages). When using hydrological models to simulate and set up water resource management methods, the adverse effects of ROS events must be taken into account.

4. Discussion

4.1. Spatial and Temporal Distribution of ROS Events in China

Zhou et al. [24] showed that ROS events in China were mainly distributed in TP, NX, NE, and eastern China, with the Changbai Mountains and Xiaoxing’an Mountains experiencing the most frequent ROS events. This was different from the results of the present study. The results of this study showed that ROS events in China were mainly concentrated in the Altay Mountains, the northern part of the Tianshan Mountains, Ili River Valley, the northern part of Tacheng Prefecture, the southeast part of TP, the Qilian Mountains, Daxing’an Mountains, Xiaoxing’an Mountains, Changbai Mountains, Loess Plateau, and MLYRP. The reasons for this discrepancy may be the following: (1) Differences in data quality. Zhou et al. [24] used MODIS reanalysis data in their study, while this study used station observation data. Compared with the station observation data, the MODIS reanalysis data have a large error due to the influence of cloud cover. High-altitude areas in particular, due to the influence of mountains, are often cloudy throughout the year, resulting in poor accuracy of reanalysis data. (2) The time span is different. The study by Zhou et al. [24] covered 2001–2018 with a time span of 18 years, while the present study analyzed the spatial and temporal distribution of ROS events in China over the past 43 years (1978–2020), with a difference of 25 years in the time span.
Moreover, the study by Li et al. [26] showed that ROS events in China were mainly distributed in the southeast part of TP, the northern part of Xinjiang, the northeast part of NE and Inner Mongolia, and the transition zone between North China and South China. This was different from the results of this study. The reason for this difference may be the different definitions of ROS events. Li et al. [26] defined a daily ROS event as daily rainfall and snow depth both greater than 0 mm, whereas this study defines a daily ROS event as ≥1 mm of rainfall falling on ≥1 cm of snow cover during a 24 h period, and the snow depth must have been >0 cm on the previous day. Because rainfall data obtained were based on the precipitation type differentiation method of Ding et al. [30], the daily rainfall is smaller with higher error. Therefore, setting the rainfall threshold to 1 mm can effectively reduce the uncertainty caused by data errors. In addition, the ROS events determined from the daily-scale rainfall and snow depth data may include the situation of rainfall followed by snowfall on the same day, and this situation is more common in central and eastern China during the cold season. Therefore, setting the previous day’s snow depth to be >0 cm in the definition of ROS events can eliminate fake ROS events.

4.2. Spatiotemporal Changes in ROS Events and Their Driving Factors in China

Zhou et al. [24] showed that the number of ROS events in China decreased in the areas below 3000 m above sea level in NX, areas below 4000 m above sea level in TP, and the Daxing’an Mountains. However, it has increased in areas between 3000 and 4000 m above sea level in the Tianshan Mountains, areas between 4000 and 5500 m above sea level in the southeastern part of TP, and the Changbai Mountains. This is quite different from the results of this study. Our results suggested that the number of ROS events in China increased in NX and the Changbai Mountains. However, there was a decrease in CE, and in the southeastern part of TP. The reasons for this difference are the same as those that caused the differences in the spatial and temporal distributions of ROS events between this study and the study by Zhou et al. [24]. However, although both this study and Li et al. [26] used station observation data and had more overlapping years in the time series, the results of the spatial and temporal variations of ROS events were very different, or even opposite. For example, in CE, Li et al. [26] showed a significant increase in the number of ROS events, whereas our results were consistent with those of Zhou et al. [24], which showed a decrease in the number of ROS events. This discrepancy, or even opposite result, seems to indicate that there was a problem in our research. Yet, careful analysis reveals that snow cover days in the south of the Yangtze River have significantly decreased due to the influence of global warming (Figure 10a). This decrease shows that the number of ROS events will also decrease because snow accumulation is one of the necessary conditions for ROS events to occur. The main reason why our findings were contrary to those of Li et al. [26] was the difference in the definition of ROS events and the method of trend analysis. In our study, we excluded fake ROS events by definition to avoid the effect of including fake ROS events in the calculation on the trend analysis of ROS events. Moreover, the effect of the 0 value on the trend analysis was effectively avoided by the use of Spearman’s rank correlation coefficient in the trend analysis. This was because we found that the 0-value had a large effect on the results of trend analysis, and could even lead to the opposite trend. Therefore, suitable and appropriate trend analysis methods are crucial for the results.
There were also significant differences between the results of this study and that of Li et al. [26] in terms of the driving factors. For example, Li et al. [26] concluded that changes in ROS events in North China were mainly influenced by rainfall days, while the results of the present study show that changes in ROS events in North China were mainly driven by changes in snow cover days. Similar differences were observed in some other regions. The main reason for this difference is the definition of ROS events and the method of analyzing the driving factors. When the definition of ROS events cannot exclude fake ROS events, the results of the ROS event driver analysis are affected. The factors influencing ROS events are relatively complex. In analysis of the influencing factors, it is necessary to carry out a detrending process beforehand. On this basis, the influence of other factors is removed through a partial correlation analysis model.

4.3. Limitations and Further Work

Although station observational data may currently be the most reliable, the distribution of stations in China’s high-altitude regions is relatively sparse (Table 1). Conversely, the abundant snow cover in these high-altitude regions provides more opportunities for ROS events to occur, resulting in frequent ROS events in high-altitude areas. Therefore, this study may have underestimated the number and intensity of ROS events.
Furthermore, this study only provided a preliminary exploration of the spatiotemporal variations and driving mechanisms of ROS events in China. However, the factors affecting ROS event variations are complex and diverse. Future research is needed to investigate the impact of ROS events on regional water resources and the mechanisms underlying the disasters they trigger.

5. Conclusions

This study analyzed the spatiotemporal changes and driving mechanisms of ROS events and their intensities in China based on daily snow depth data and meteorological data from 513 stations between 1978 and 2020. The results showed that the middle and lower Yangtze River Plain in winter was also a frequent occurrence area for ROS events, but it was often overlooked. The number and intensity of ROS events in the Changbai Mountains in spring and in the Altay Mountains and the southeast part of TP in winter significantly (p < 0.05) increased, leading to heightened ROS flood risks. Conversely, the number and intensity of ROS events in MLYRP in winter significantly (p < 0.05) decreased. The driving factors for the changes in ROS events and their intensities varied across different regions. Overall, in snow-rich regions, changes in the number and intensity of ROS events were driven by rainfall days and quantity of rainfall, respectively. In regions with abundant rainfall, changes in the number and intensity of ROS events were driven by snow cover days and snow water equivalent, respectively. Air temperature had no direct impact on ROS events and their intensities. The results of this study provide reliable evidence for water resource management and disaster prevention and mitigation in China.

Author Contributions

Z.Y.: Writing—original draft, Methodology, Investigation, Formal analysis, Conceptualization. R.C.: Writing—review and editing, Methodology, Project administration, Funding acquisition, Formal analysis. X.W.: Formal analysis, Data curation. Z.L.: Writing—review and editing, Funding acquisition. X.L.: Writing—review and editing. G.L.: Data curation, Funding acquisition. All authors have read and agreed to the published version of the manuscript.

Funding

This study was funded by the National Key R&D Program of China (2024YFF0808602), the Gansu Provincial Science and Technology Program (25JRRA409), the National Natural Sciences Foundation of China (42171145), the National Natural Sciences Foundation of China (42171147), the Gansu Provincial Science and Technology Planning Project (24ZD13FA004), the Scientific Research Fund of Hunan Provincial Education Department (22A0497), and the Talent Introduction and Cultivation Program of Gansu Academy of Sciences (2025QD-20).

Data Availability Statement

Datasets used in this study can be found here: http://data.cma.cn/ (accessed on 15 July 2021).

Acknowledgments

We are very grateful to the anonymous reviewers for their valuable comments, which have been key to improving the manuscript.

Conflicts of Interest

The authors declare that they have no known conflicts of interest or personal relationships that could influence the work reported in this paper.

References

  1. Pan, C.G.; Kirchner, P.B.; Kimball, J.S.; Kim, Y.; Du, J. Rain-on-snow events in Alaska, their frequency and distribution from satellite observations. Environ. Res. Lett. 2018, 13, 075004. [Google Scholar] [CrossRef]
  2. Singh, P.; Spitzbart, G.; Hübl, H.; Weinmeister, H.W. Hydrological response of snowpack under rain-on-snow events: A field study. J. Hydrol. 1997, 202, 1–20. [Google Scholar] [CrossRef]
  3. Conway, H.; Raymond, C.F. Snow stability during rain. J. Glaciol. 1993, 39, 635–642. [Google Scholar] [CrossRef]
  4. Huntington, T.G.; Hodgkins, G.A.; Keim, B.D.; Dudley, R.W. Changes in the proportion of precipitation occurring as snow in New England (1949–2000). J. Clim. 2004, 17, 2626–2636. [Google Scholar] [CrossRef]
  5. Marks, D.; Link, T.; Winstral, A.; Garen, D. Simulating snowmelt processes during rain-on-snow over a semi-arid mountain basin. Ann. Glaciol. 2001, 32, 195–202. [Google Scholar] [CrossRef]
  6. Yang, Z.W.; Chen, R.S.; Liu, Y.W.; Zhao, Y.N.; Liu, Z.W.; Liu, J.F. The impact of rain-on-snow events on the snowmelt process: A field study. Hydrol. Process. 2023, 37, e15019. [Google Scholar] [CrossRef]
  7. Rennert, K.J.; Roe, G.; Putkonen, J.; Bitz, C.M. Soil thermal and ecological impacts of rain on snow events in the circumpolar Arctic. J. Clim. 2009, 22, 2302–2315. [Google Scholar] [CrossRef]
  8. Anderson, E.A. Development and testing of snow pack energy balance equations. Water Resour. Res. 1968, 4, 19–37. [Google Scholar] [CrossRef]
  9. Myers, D.T.; Ficklin, D.L.; Robeson, S.M. Incorporating rain-on-snow into the SWAT model results in more accurate simulations of hydrologic extremes. J. Hydrol. 2021, 603, 126972. [Google Scholar] [CrossRef]
  10. Putkonen, J.; Roe, G.J. Rain-on-snow events impact soil temperatures and affect ungulate survival. Geophys. Res. Lett. 2003, 30, 1188. [Google Scholar] [CrossRef]
  11. Cohen, J.; Ye, H.; Jones, J. Trends and variability in rain-on-snow events. Geophys. Res. Lett. 2015, 42, 7115–7122. [Google Scholar] [CrossRef]
  12. Pomeroy, J.W.; Fang, X.; Marks, D.G. The cold rain-on-snow event of June 2013 in the Canadian Rockies-characteristics and diagnosis. Hydrol. Process. 2016, 30, 2899–2914. [Google Scholar] [CrossRef]
  13. Vahedifard, F.; AghaKouchak, A.; Ragno, E.; Shahrokhabadi, S.; Mallakpour, I. Lessons from the Oroville dam. Science 2017, 355, 1139–1140. [Google Scholar] [CrossRef] [PubMed]
  14. Sezen, C.; Šraj, M.; Medved, A.; Bezak, N. Investigation of rain-on-snow floods under climate change. Appl. Sci. 2020, 10, 1242. [Google Scholar] [CrossRef]
  15. Stimberis, J.; Rubin, C.M. Glide avalanche response to an extreme rain-on-snow event, Snoqualmie Pass, Washington, USA. J. Glaciol. 2011, 57, 468–474. [Google Scholar] [CrossRef]
  16. McCabe, G.J.; Clark, M.P.; Hay, L.E. Rain-on-snow events in the western United States. Bull. Am. Meteorol. Soc. 2007, 88, 319–328. [Google Scholar] [CrossRef]
  17. Musselman, K.N.; Lehner, F.; Ikeda, K.; Clark, M.P.; Prein, A.F.; Liu, C.; Barlage, M.; Rasmussen, R. Projected increases and shifts in rain-on-snow flood risk over western North America. Nat. Clim. Change 2018, 8, 808–812. [Google Scholar] [CrossRef]
  18. Freudiger, D.; Kohn, I.; Stahl, K.; Weiler, M. Large-scale analysis of changing frequencies of rain-on-snow events with flood-generation potential. Hydrol. Earth Syst. Sci. 2014, 18, 2695–2709. [Google Scholar] [CrossRef]
  19. Barnett, T.P.; Adam, J.C.; Lettenmaier, D.P. Potential impacts of a warming climate on water availability in snow-dominated regions. Nature 2005, 438, 303–309. [Google Scholar] [CrossRef] [PubMed]
  20. Li, P.J.; Mi, D.S. Distribution of snow cover in China. J. Glaciol. Geocryol. 1983, 5, 9–18. (In Chinese) [Google Scholar]
  21. Wang, C.X.; Li, D.L. Spatial-temporal variations of snow cover days and the maximum depth of snow cover in China during recent 50 years. J. Glaciol. Geocryol. 2012, 34, 247–256. (In Chinese) [Google Scholar]
  22. Ke, C.Q.; Li, X.C.; Xie, H.; Ma, D.H.; Liu, X.; Kou, C. Variability in snow cover phenology in China from 1952 to 2010. Hydrol. Earth Syst. Sci. 2016, 20, 755–770. [Google Scholar] [CrossRef]
  23. Tan, X.J.; Wu, Z.N.; Mu, X.M.; Gao, P.; Zhao, G.J.; Sun, W.Y.; Gu, C.J. Spatiotemporal changes in snow cover over China during 1960–2013. Atmos. Res. 2019, 218, 183–194. [Google Scholar] [CrossRef]
  24. Zhou, G.; Zhang, D.H.; Wan, J.H.; Cui, M.Y.; Zhang, S.Q. Mapping reveals contrasting change patterns of rain-on-snow events in China during 2001 to 2018. J. Hydrol. 2023, 617, 129089. [Google Scholar] [CrossRef]
  25. Yang, Z.W.; Chen, R.S.; Liu, Z.W.; Zhao, Y.N.; Liu, Y.W.; Wu, W.T. Spatiotemporal variability of rain-on-snow events in the arid region of Northwest China. J. Arid Land 2024, 16, 483–499. [Google Scholar] [CrossRef]
  26. Li, S.Y.; Luo, C.J.; Lu, H. The spatial and temporal distribution of rain-on-snow events and their driving factors in China. Hydrol. Process. 2025, 39, e70098. [Google Scholar] [CrossRef]
  27. Groisman, P.Y.; Sun, B.; Vose, R.S.; Lawrimore, J.H.; Whitfield, P.H.; Førland, E.; Hanssen-Bauer, I.; Serreze, M.C.; Razuvaev, V.N.; Alekseev, G.V. Contemporary climate changes in high latitudes of the Northern Hemisphere: Daily time resolution. In Proceedings of the 14th Symposium on Global Change and Climate Variations, Long Beach, CA, USA, 9–13 February 2003. [Google Scholar]
  28. Morán-Tejeda, E.; López-Moreno, J.I.; Stoffel, M.; Beniston, M. Rain-on-snow events in Switzerland: Recent observations and projections for the 21st century. Clim. Res. 2016, 71, 111–125. [Google Scholar] [CrossRef]
  29. Würzer, S.; Jonas, T.; Wever, N.; Lehning, M. Influence of initial snowpack properties on runoff formation during rain-on-snow events. J. Hydrometeorol. 2016, 17, 1801–1815. [Google Scholar] [CrossRef]
  30. Ding, B.H.; Yang, K.; Qin, J.; Wang, L.; Chen, Y.Y.; He, X.B. The dependence of precipitation types on surface elevation and meteorological conditions and its parameterization. J. Hydrol. 2014, 513, 154–163. [Google Scholar] [CrossRef]
  31. Jennings, K.S.; Winchell, T.S.; Livneh, B.; Molotch, N.P. Spatial variation of the rain–snow temperature threshold across the Northern Hemisphere. Nat. Commun. 2018, 9, 1148. [Google Scholar] [CrossRef] [PubMed]
  32. Sun, F.; Chen, Y.; Li, Y.; Li, Z.; Duan, W.; Zhang, Q.; Chuan, W. Incorporating relative humidity improves the accuracy of precipitation phase discrimination in High Mountain Asia. Atmos. Res. 2022, 271, 106094. [Google Scholar] [CrossRef]
  33. Ye, H.C.; Cohen, J.; Rawlins, M. Discrimination of solid from liquid precipitation over northern Eurasia using surface atmospheric conditions. J. Hydrometeorol. 2013, 14, 1345–1355. [Google Scholar] [CrossRef]
  34. Murray, F.W. On the computation of saturation vapor pressure. J. Appl. Meteorol. 1967, 6, 203–204. [Google Scholar] [CrossRef]
  35. Yue, S.; Pilon, P.; Cavadias, G. Power of the Mann–Kendall and Spearman’s rho tests for detecting monotonic trends in hydrological series. J. Hydrol. 2002, 259, 254–271. [Google Scholar] [CrossRef]
  36. Pradhanang, S.M.; Frei, A.; Zion, M.; Schneiderman, E.M.; Steenhuis, T.S.; Pierson, D. Rain-on-snow runoff events in New York. Hydrol. Process. 2013, 27, 3035–3049. [Google Scholar] [CrossRef]
  37. Tang, Q.H.; Liu, Y.B.; Zhang, C.; Su, F.G.; Li, Y.; Gao, Y.H.; Li, W.H.; Chen, D.L. Research progress on moisture source change of prscipitation over the Tibetan Plateau and its surrounding areas. Trans. Atmos. Sci. 2020, 43, 1002–1009. (In Chinese) [Google Scholar] [CrossRef]
  38. Li, Y.; Su, F.G.; Tang, Q.H.; Gao, H.K.; Yan, H.D.; Peng, H.; Xiao, S.B. Contributions of moisture sources to precipitation in the major drainage basins in the Tibetan Plateau. Sci. China Earth Sci. 2022, 65, 1088–1103. [Google Scholar] [CrossRef]
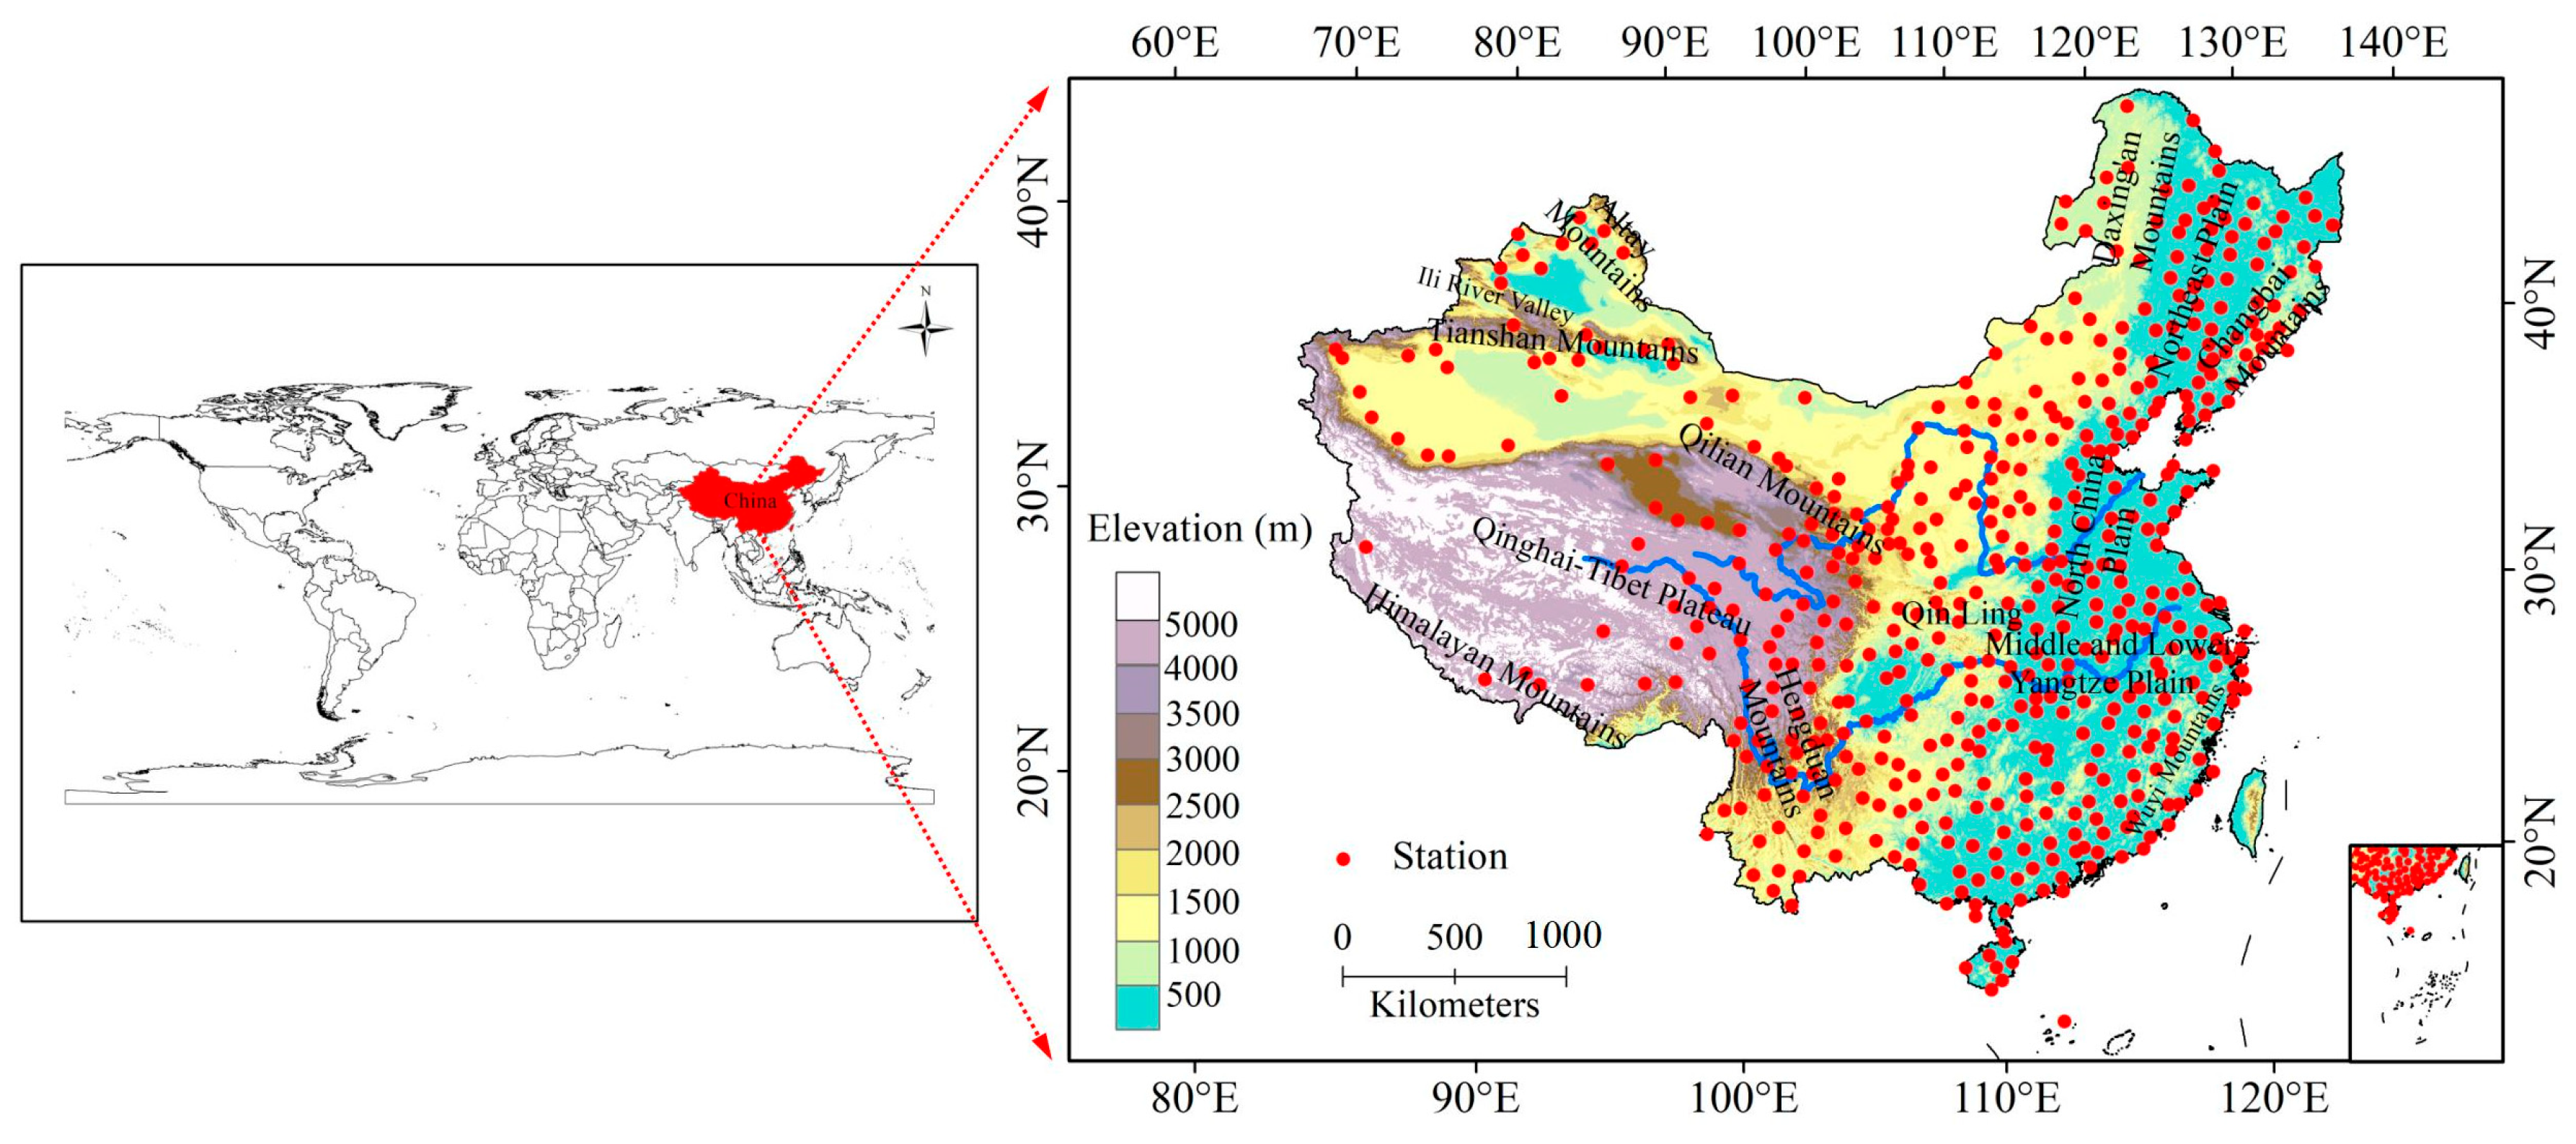
Figure 1. Spatial distribution of the 513 stations, major mountain ranges, and plains in China.
Water 17 02114 g001
Figure 2. Spatial distributions of the total (a) and intensity (b) of ROS events in China during 1978–2020. NE, TP, NX, and CE represent Northeast China, the Qinghai–Tibet Plateau, northern Xinjiang, and central and eastern China, respectively.
Water 17 02114 g002
Figure 3. Spatial distribution of the number of ROS events in spring (a), summer (b), autumn (c), and winter (d) in China from 1978 to 2020. NE, TP, NX, and CE represent Northeast China, the Qinghai–Tibet Plateau, northern Xinjiang, and central and eastern China, respectively.
Water 17 02114 g003aWater 17 02114 g003b
Figure 4. Spatial distribution of the intensity of ROS events in spring (a), summer (b), autumn (c), and winter (d) in China from 1978 to 2020. NE, TP, NX, and CE represent Northeast China, the Qinghai–Tibet Plateau, northern Xinjiang, and central and eastern China, respectively.
Water 17 02114 g004aWater 17 02114 g004b
Figure 5. Inter-annual trends in the number (a) and intensity (b) of ROS events in China from 1978 to 2020. NE, TP, NX, and CE represent Northeast China, the Qinghai–Tibet Plateau, northern Xinjiang, and central and eastern China, respectively.
Water 17 02114 g005
Figure 6. Trends in the totals of ROS events in spring (a), summer (b), autumn (c), and winter (d) in China from 1978 to 2020. NE, TP, NX, and CE represent Northeast China, the Qinghai–Tibet Plateau, northern Xinjiang, and central and eastern China, respectively.
Water 17 02114 g006
Figure 7. Trends in the intensity of ROS events in spring (a), summer (b), autumn (c), and winter (d) in China from 1978 to 2020. NE, TP, NX, and CE represent Northeast China, the Qinghai–Tibet Plateau, northern Xinjiang, and central and eastern China, respectively.
Water 17 02114 g007aWater 17 02114 g007b
Figure 8. Partial correlation coefficient of the number of ROS events with air temperature (a), snow cover days (b), rainfall days (c), and snowfall-to-precipitation ratio (d) at the 417 stations with ROS events in the cold season in China from 1978 to 2020. NE, TP, NX, and CE represent Northeast China, the Qinghai–Tibet Plateau, northern Xinjiang, and central and eastern China, respectively.
Water 17 02114 g008
Figure 9. Partial correlation coefficient of the intensity of ROS events with air temperature (a), snow water equivalent (b), and quantity of rainfall (c) at the 417 stations with ROS events in the cold season in China from 1978 to 2020. NE, TP, NX, and CE represent Northeast China, the Qinghai–Tibet Plateau, northern Xinjiang, and central and eastern China, respectively.
Water 17 02114 g009
Figure 10. Inter-annual trends in snow cover days (a), rainfall days (b), snow water equivalent (c), and quantity of rainfall (d) at the 417 stations with ROS events in the cold season in China from 1978 to 2020. NE, TP, NX, and CE represent Northeast China, the Qinghai–Tibet Plateau, northern Xinjiang, and central and eastern China, respectively.
Water 17 02114 g010
Table 1. Number of stations at different altitudes in China.
RegionElevation (m)Number of Stations
China0–500284
500–100061
1000–150075
1500–200028
2000–250014
2500–300016
>300035
Disclaimer/Publisher’s Note: The statements, opinions and data contained in all publications are solely those of the individual author(s) and contributor(s) and not of MDPI and/or the editor(s). MDPI and/or the editor(s) disclaim responsibility for any injury to people or property resulting from any ideas, methods, instructions or products referred to in the content.