
Intelligent Flood Scene Understanding Using Computer Vision-Based Multi-Object Tracking


Abstract
1. Introduction
- Capturing the evolving nature of flood events in real time;
- Continuously tracking and consistently identifying moving objects;
- Recovering and re-identifying objects temporarily occluded by waves, debris, or infrastructure within the camera view;
- Enabling continuous tracking of the same target across different camera views or during a drone’s flight.
- A deep learning and computer vision-based MOT method is proposed for intelligent flood scene analysis across continuous video frames;
- To address the unique challenges of flood scenes compared to conventional environments, we propose a MOT method that integrates an optical-flow-based module for trajectory prediction and a deep re-identification (ReID) module for handling long-term occlusions in flood scenarios;
- The proposed method achieves state-of-the-art performance across multiple evaluation metrics in both performance testing and field applications.
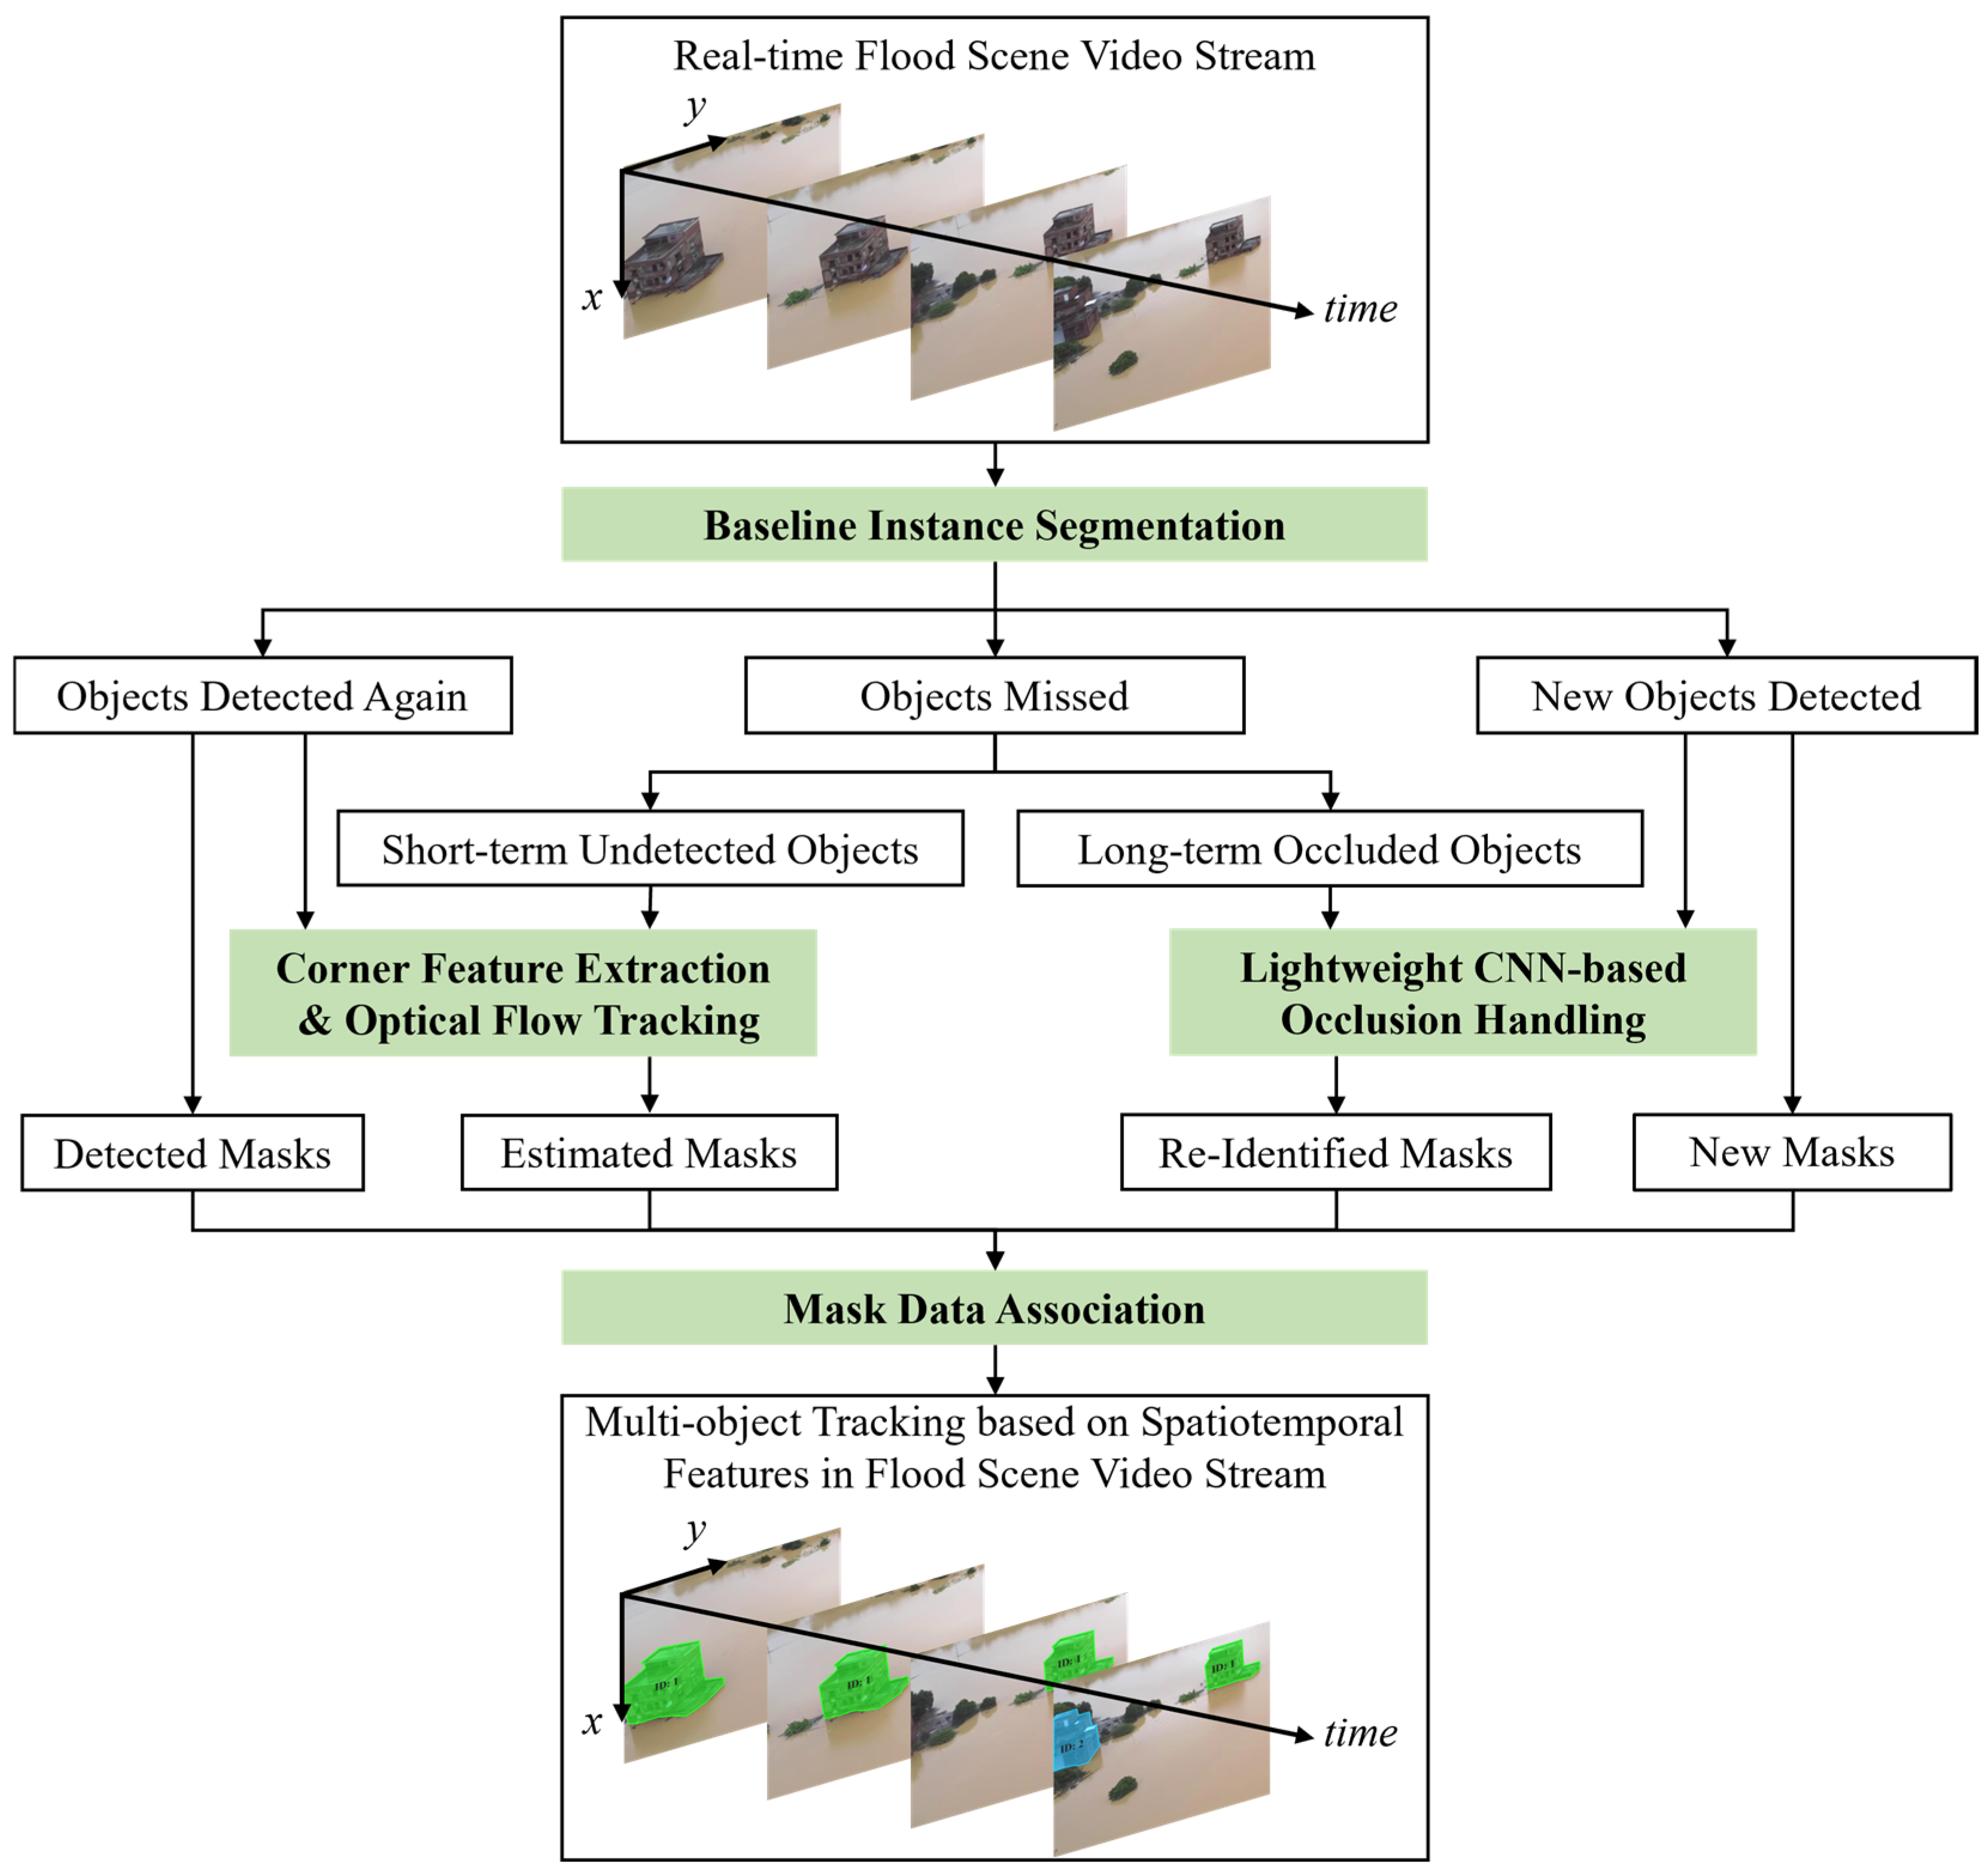
2. Methodology
2.1. Baseline Instance Segmentation and Data Association
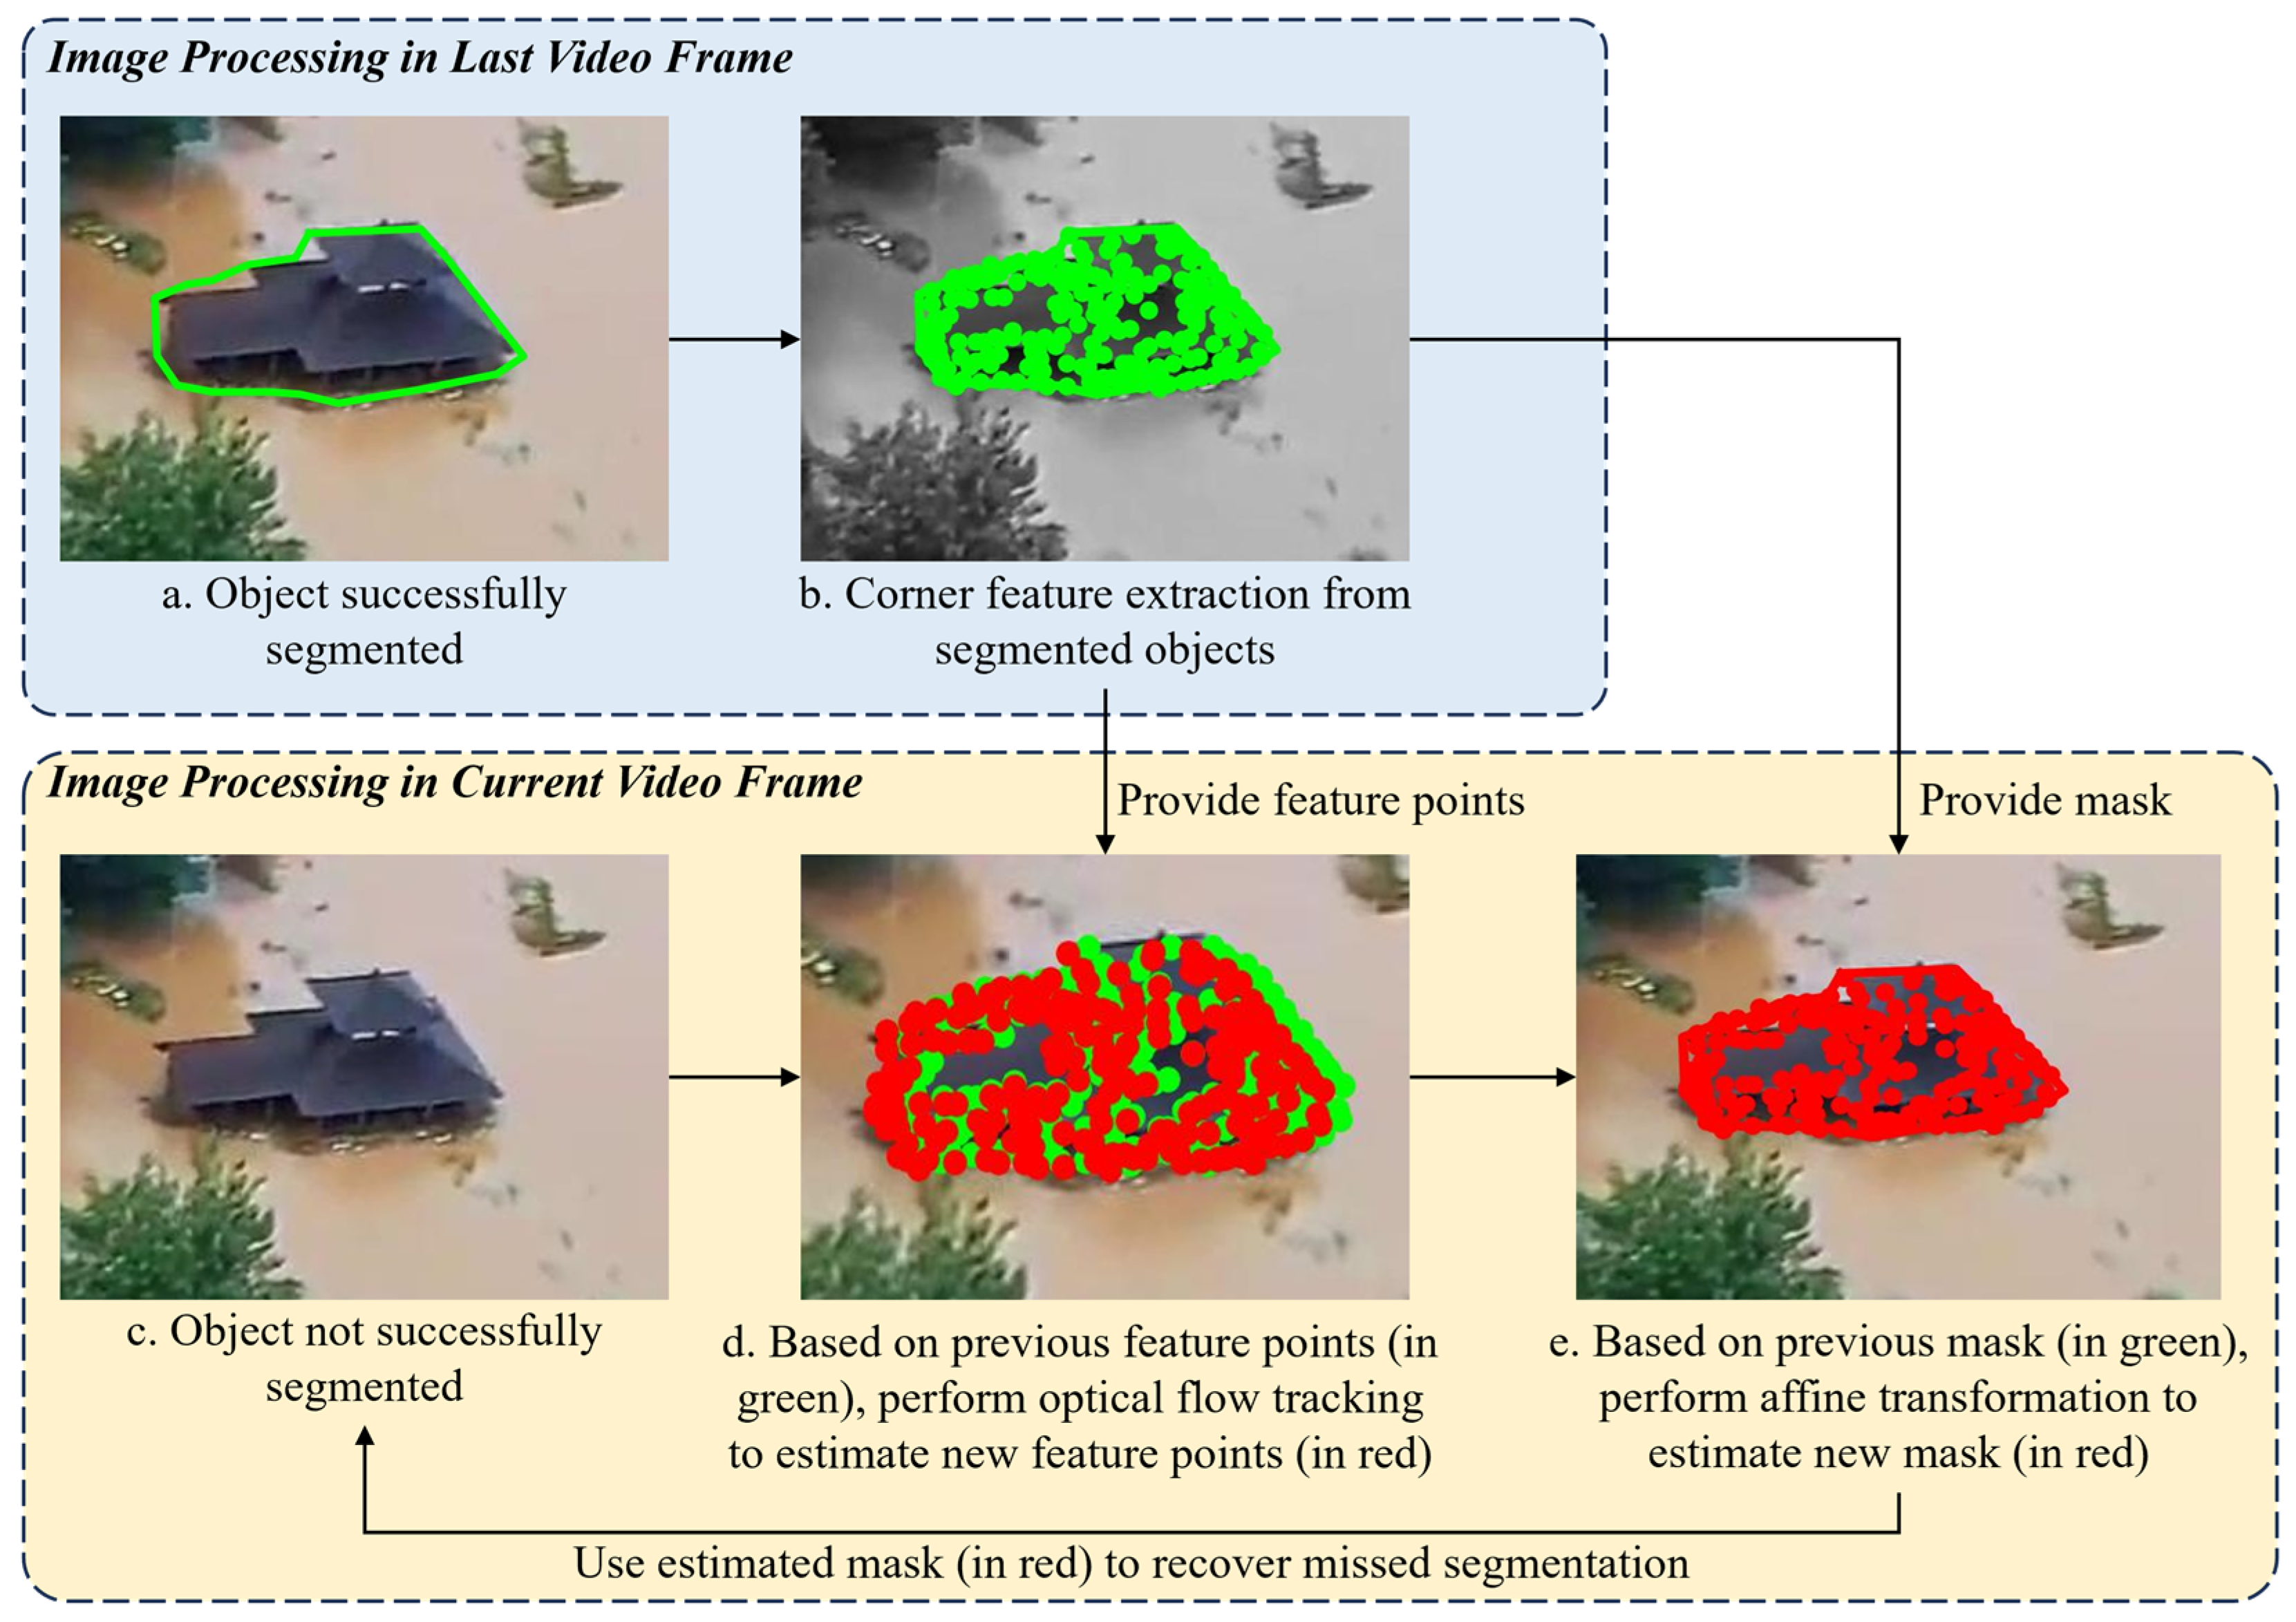
2.2. Corner Feature Extraction and Optical Flow Tracking
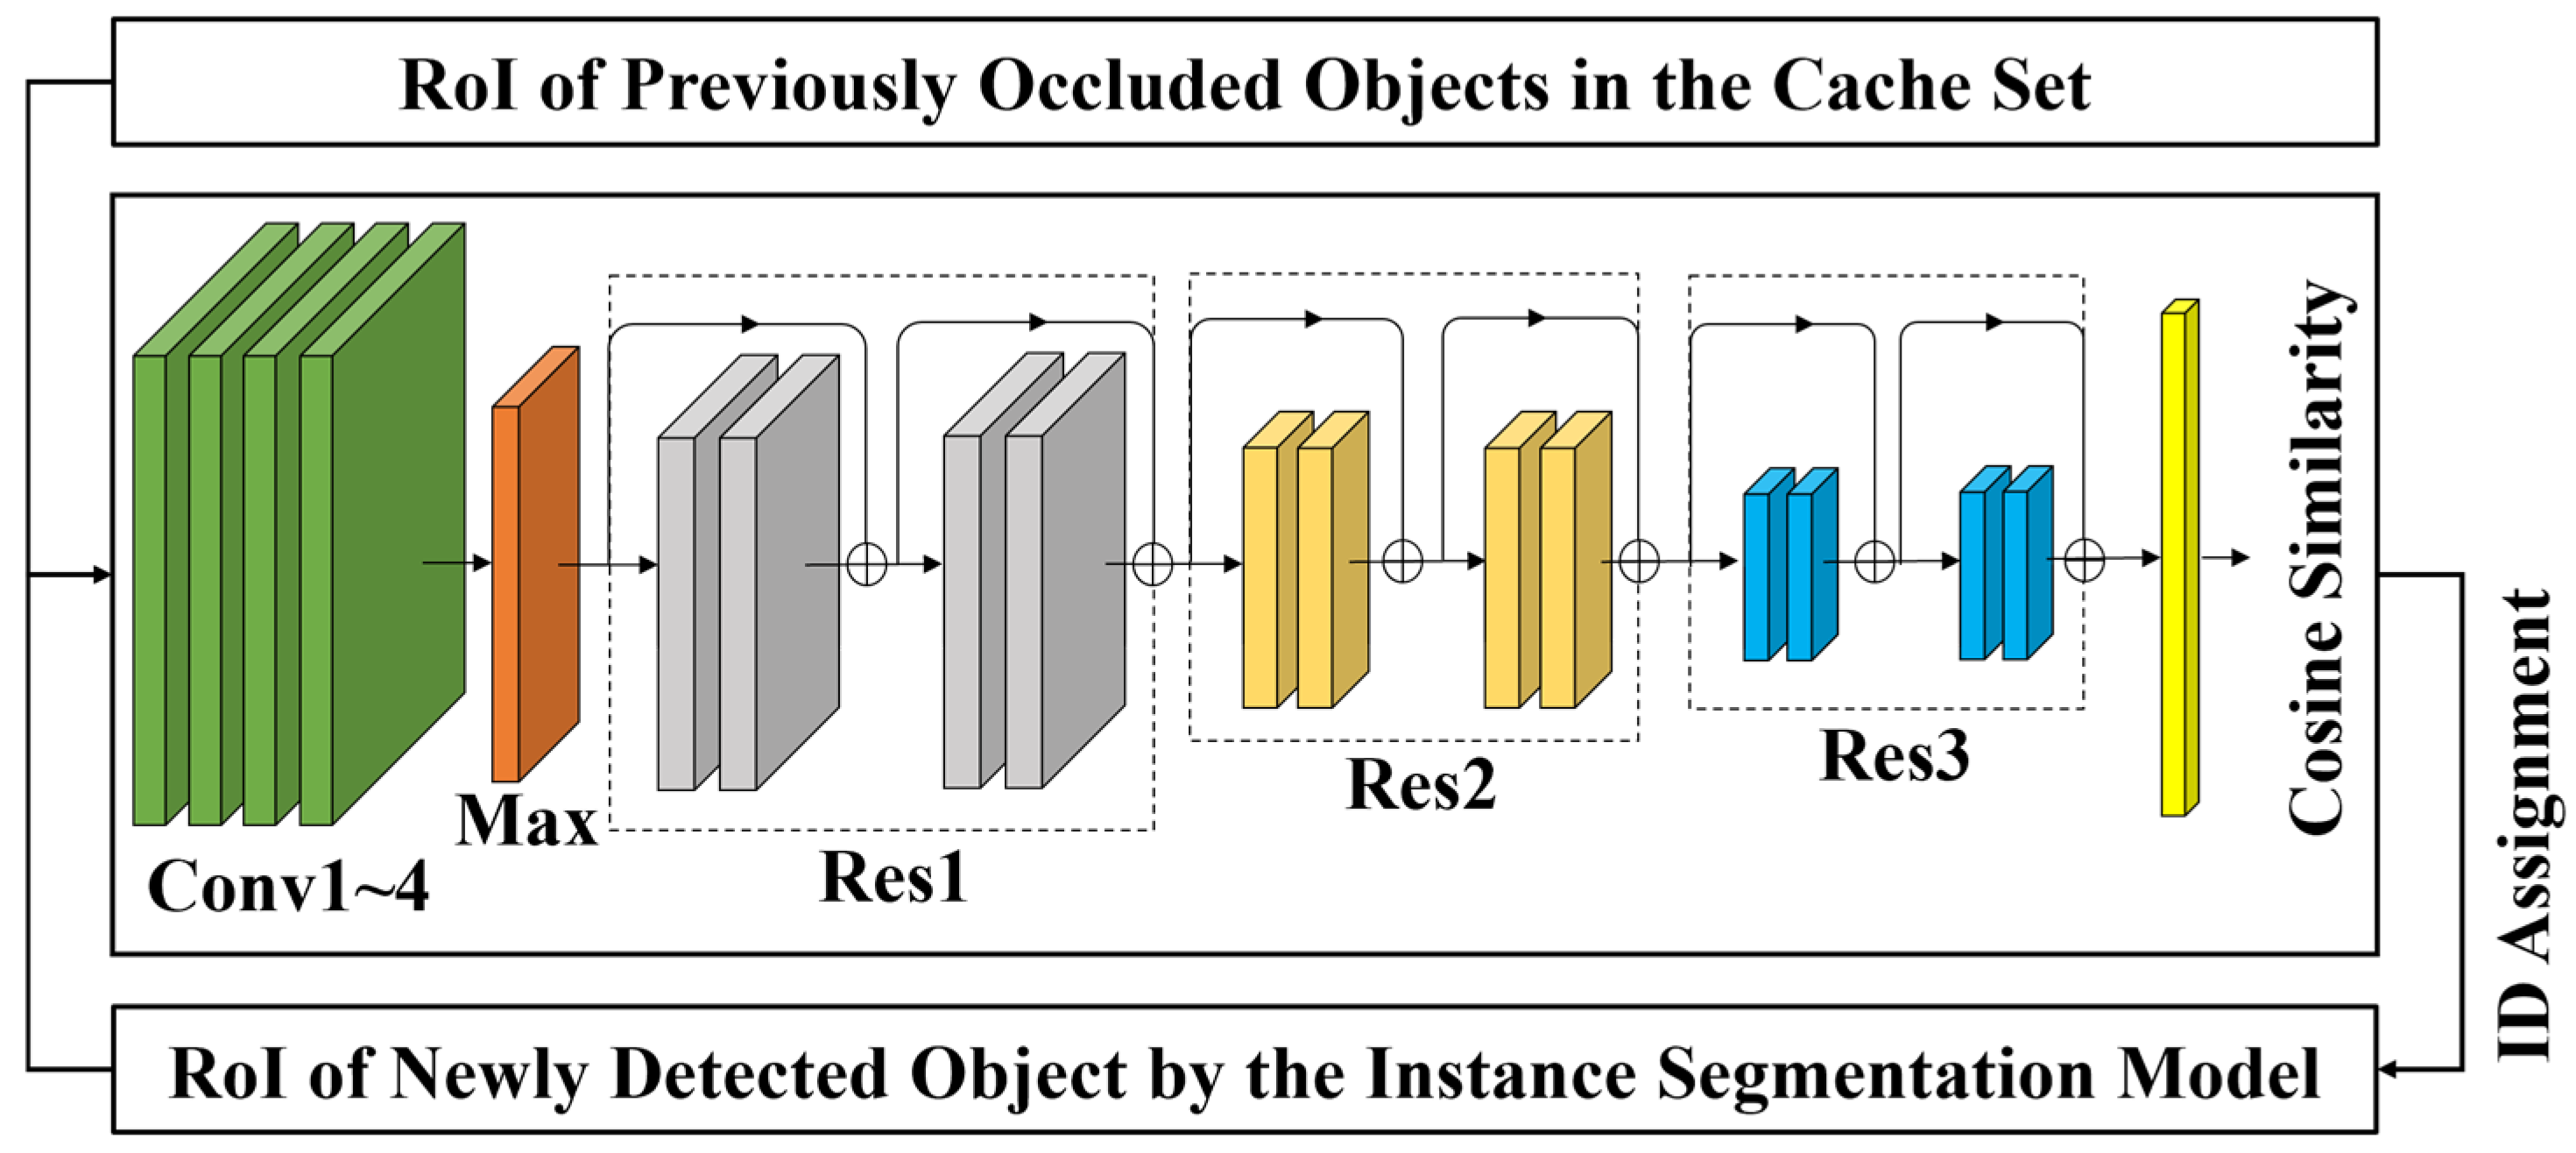
2.3. Lightweight CNN-Based Occlusion Handling
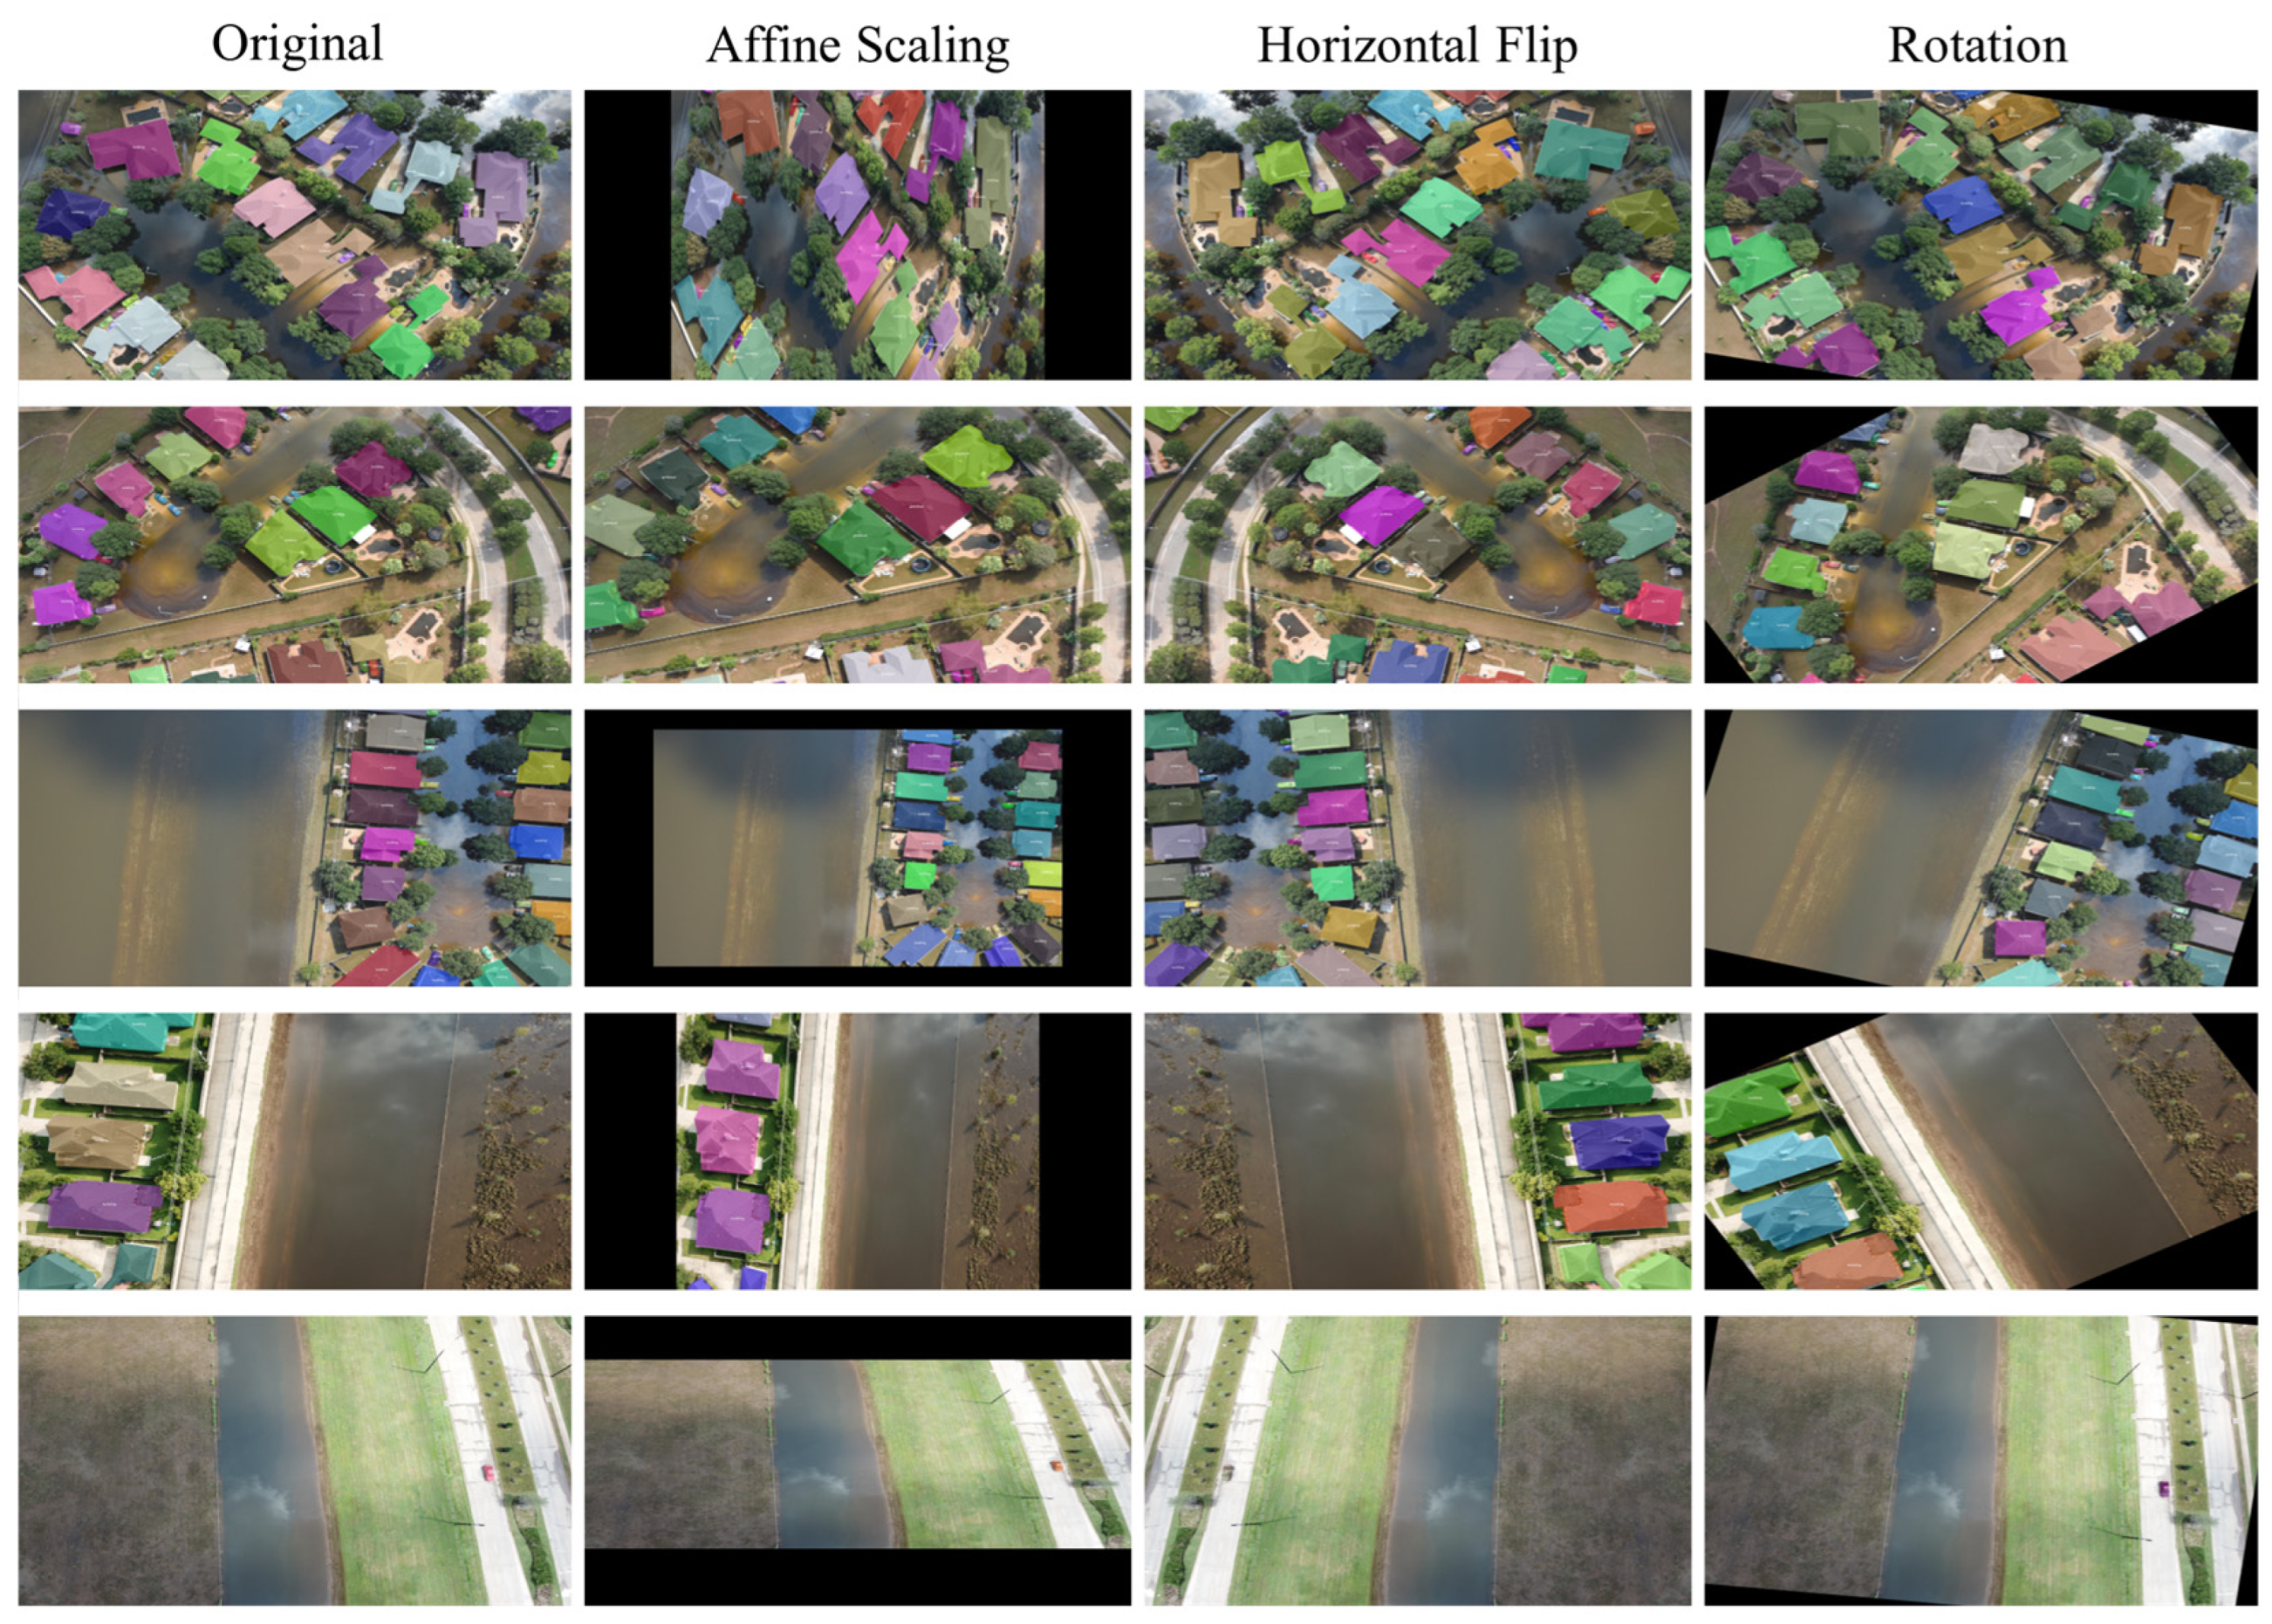
2.4. Pre-Processing
3. Results
3.1. Evaluation of Baseline Instance Segmentation Networks
3.2. Evaluation of Occlusion Handling Network
3.3. Evaluation of MOT Incorporating Optical Flow Tracking
3.4. Field Application
4. Discussion
4.1. Summary of Results and Implications
4.2. Research Limitations and Future Research
5. Conclusions
Author Contributions
Funding
Data Availability Statement
Acknowledgments
Conflicts of Interest
Abbreviations
| MOT | Multi-Object Tracking |
| ReID | Re-Identification |
| AI | Artificial Intelligence |
| DLBCV | Deep Learning-Based Computer Vision |
| UAV | Unmanned Aerial Vehicle |
| mAP | mean Average Precision |
| IoU | Intersection over Union |
| YOLO | You Look Only Once |
| COCO | Common Objects in Context |
| PR | Precision–Recall |
| CNN | Convolutional Neural Network |
| TP | True Positive |
| FP | False Positive |
| FN | False Negative |
| SGD | Stochastic Gradient Descent |
| DSConv | Distributed Shift Convolution |
References
- Romero, T.Q.; Leandro, J. A method to devise multiple model structures for urban flood inundation uncertainty. J. Hydrol. 2022, 604, 127246. [Google Scholar] [CrossRef]
- Henderson, F.; Steiner, A.; Farmer, J.; Whittam, G. Challenges of community engagement in a rural area: The impact of flood protection and policy. J. Rural. Stud. 2020, 73, 225–233. [Google Scholar] [CrossRef]
- Goldschmidt, K.H.; Kumar, S. Humanitarian operations and crisis/disaster management: A retrospective review of the literature and framework for development. Int. J. Disaster Risk Reduct. 2016, 20, 1–13. [Google Scholar] [CrossRef]
- Iqbal, U.; Perez, P.; Li, W.; Barthelemy, J. How computer vision can facilitate flood management: A systematic review. Int. J. Disaster Risk Reduct. 2021, 53, 102030. [Google Scholar] [CrossRef]
- Zhang, Y.; Liu, P.; Chen, L.; Xu, M.; Guo, X.; Zhao, L. A new multi-source remote sensing image sample dataset with high resolution for flood area extraction: GF-FloodNet. Int. J. Digit. Earth 2023, 16, 2522–2554. [Google Scholar] [CrossRef]
- DeVries, B.; Huang, C.; Armston, J. Rapid and robust monitoring of flood events using Sentinel-1 and Landsat data on the Google Earth Engine. Remote Sens. Environ. 2020, 240, 111664. [Google Scholar] [CrossRef]
- Wan, J.; Xue, F.; Shen, Y.; Song, H.; Shi, P.; Qin, Y.; Yang, T.; Wang, Q.J. Automatic segmentation of urban flood extent in video image with DSS-YOLOv8n. J. Hydrol. 2025, 655, 132974. [Google Scholar] [CrossRef]
- Sun, J.; Xu, C.; Zhang, C.; Zheng, Y.; Wang, P.; Liu, H. Flood scenarios vehicle detection algorithm based on improved YOLOv9. Multimed. Syst. 2025, 31, 74. [Google Scholar] [CrossRef]
- LeCun, Y.; Bengio, Y.; Hinton, G. Deep learning. Nature 2015, 521, 436–444. [Google Scholar] [CrossRef] [PubMed]
- Jackson, J.; Yussif, S.B.; Patamia, R.A.; Sarpong, K.; Qin, Z. Flood or non-flooded: A comparative study of state-of-the-art models for flood image classification using the FloodNet dataset with uncertainty offset analysis. Water 2023, 15, 875. [Google Scholar] [CrossRef]
- Iqbal, U.; Riaz, M.Z.B.; Barthelemy, J.; Hutchison, N.; Perez, P. Floodborne objects type recognition using computer vision to mitigate blockage originated floods. Water 2022, 14, 2605. [Google Scholar] [CrossRef]
- Pally, R.J.; Samadi, S. Application of image processing and convolutional neural networks for flood image classification and semantic segmentation. Environ. Model. Softw. 2022, 148, 105285. [Google Scholar] [CrossRef]
- Rahnemoonfar, M.; Chowdhury, T.; Sarkar, A.; Varshney, D.; Yari, M.; Murphy, R.R. FloodNet: A high resolution aerial imagery dataset for post flood scene understanding. IEEE Access 2021, 9, 89644–89654. [Google Scholar] [CrossRef]
- Zhao, J.; Wang, X.; Zhang, C.; Hu, J.; Wan, J.; Cheng, L.; Shi, S.; Zhu, X. Urban waterlogging monitoring and recognition in low-light scenarios using surveillance videos and deep learning. Water 2025, 17, 707. [Google Scholar] [CrossRef]
- Wang, Y.; Shen, Y.; Salahshour, B.; Cetin, M.; Iftekharuddin, K.; Tahvildari, N.; Huang, G.; Harris, D.K.; Ampofo, K.; Goodall, J.L. Urban flood extent segmentation and evaluation from real-world surveillance camera images using deep convolutional neural network. Environ. Model. Softw. 2024, 173, 105939. [Google Scholar] [CrossRef]
- Rahnemoonfar, M.; Chowdhury, T.; Murphy, R. RescueNet: A high resolution UAV semantic segmentation benchmark dataset for natural disaster damage assessment. Sci. Data 2023, 10, 913. [Google Scholar] [CrossRef] [PubMed]
- Jafari, N.H.; Li, X.; Chen, Q.; Le, C.-Y.; Betzer, L.P.; Liang, Y. Real-time water level monitoring using live cameras and computer vision techniques. Comput. Geosci. 2021, 147, 104642. [Google Scholar] [CrossRef]
- Liang, Y.; Li, X.; Tsai, B.; Chen, Q.; Jafari, N. V-FloodNet: A video segmentation system for urban flood detection and quantification. Environ. Model. Softw. 2023, 5, 105586. [Google Scholar] [CrossRef]
- Muhadi, N.A.; Abdullah, A.F.; Bejo, S.K.; Mahadi, M.R.; Mijic, A. Image segmentation methods for flood monitoring system. Water 2020, 12, 1825. [Google Scholar] [CrossRef]
- Notarangelo, N.; Hirano, K.; Albano, R.; Sole, A. Transfer learning with convolutional neural networks for rainfall detection in single images. Water 2021, 13, 588. [Google Scholar] [CrossRef]
- Hassan, S.; Mujtaba, G.; Rajput, A.; Fatima, N. Multi-object tracking: A systematic literature review. Multimed. Tools Appl. 2024, 83, 43439–43492. [Google Scholar] [CrossRef]
- Yu, E.; Li, Z.; Han, S.; Wang, H. Relationtrack: Relation-aware multiple object tracking with decoupled representation. IEEE Trans. Multimed. 2022, 25, 3686–3697. [Google Scholar] [CrossRef]
- Liang, C.; Zhang, Z.; Zhou, X.; Li, B.; Zhu, S.; Hu, W. Rethinking the competition between detection and reid in multiobject tracking. IEEE Trans. Image Process 2022, 31, 3182–3196. [Google Scholar] [CrossRef] [PubMed]
- Bergmann, P.; Meinhardt, T.; Leal-Taixe, L. Tracking without bells and whistles. In Proceedings of the IEEE/CVF International Conference on Computer Vision, Seoul, Republic of Korea, 27 October–2 November 2019. [Google Scholar] [CrossRef]
- He, J.; Huang, Z.; Wang, N.; Zhang, Z. Learnable graph matching: Incorporating graph partitioning with deep feature learning for multiple object tracking. In Proceedings of the IEEE/CVF Conference on Computer Vision and Pattern Recognition, Nashville, TN, USA, 20–25 June 2021; pp. 5295–5305. [Google Scholar] [CrossRef]
- Du, Y.; Zhao, Z.; Song, Y.; Zhao, Y.; Su, F.; Gong, T.; Meng, H. StrongSORT: Make DeepSORT great again. IEEE Trans. Multimed. 2023, 25, 8725–8737. [Google Scholar] [CrossRef]
- Wojke, N.; Bewley, A.; Paulus, D. Simple online and realtime tracking with a deep association metric. In Proceedings of the 2017 IEEE International Conference on Image Processing (ICIP), Beijing, China, 17–20 September 2017; pp. 3645–3649. [Google Scholar] [CrossRef]
- Alkandary, K.; Yildiz, A.S.; Meng, H. A comparative study of YOLO series (v3–v10) with DeepSORT and StrongSORT: A real-time tracking performance study. Electronics 2025, 14, 876. [Google Scholar] [CrossRef]
- Sim, H.-S.; Cho, H.-C. Enhanced DeepSORT and StrongSORT for multicattle tracking with optimized detection and re-identification. IEEE Access 2025, 13, 19353–19364. [Google Scholar] [CrossRef]
- He, K.; Gkioxari, G.; Dollár, P.; Girshick, R. Mask R-CNN. In Proceedings of the IEEE International Conference on Computer Vision, Venice, Italy, 22–29 October 2017; pp. 2980–2988. [Google Scholar] [CrossRef]
- Dai, J.; Qi, H.; Xiong, Y.; Li, Y.; Zhang, G.; Hu, H.; Wei, Y. Deformable convolutional networks. In Proceedings of the IEEE International Conference on Computer Vision, Venice, Italy, 22–29 October 2017; pp. 764–773. [Google Scholar] [CrossRef]
- Cai, Z.; Vasconcelos, N. Cascade R-CNN: Delving into high quality object detection. In Proceedings of the IEEE Conference on Computer Vision and Pattern Recognition, Salt Lake City, UT, USA, 18–23 June 2018; pp. 6154–6162. [Google Scholar] [CrossRef]
- Lin, T.-Y.; Maire, M.; Belongie, S.; Hays, J.; Perona, P.; Ramanan, D.; Dollár, P.; Zitnick, C.L. Microsoft COCO: Common Objects in Context. In Proceedings of the European Conference on Computer Vision, Zurich, Switzerland, 6–12 September 2014; pp. 740–755. [Google Scholar] [CrossRef]
- Heydarian, M.; Doyle, T.E.; Samavi, R. MLCM: Multi-Label Confusion Matrix. IEEE Access 2022, 10, 19083–19095. [Google Scholar] [CrossRef]
- Zheng, L.; Shen, L.; Tian, L.; Wang, S.; Wang, J.; Tian, Q. Scalable person re-identification: A benchmark. In Proceedings of the IEEE International Conference on Computer Vision, Santiago, Chile, 7–13 December 2015; pp. 1116–1124. [Google Scholar] [CrossRef]
- Yan, X.; Jin, R.; Zhang, H.; Gao, H.; Xu, S. Computer vision-based intelligent monitoring of disruptions due to construction machinery arrival delay. J. Comput. Civ. Eng. 2025, 39, 04025011. [Google Scholar] [CrossRef]
- Milan, A.; Leal-Taixé, L.; Reid, I.; Roth, S.; Schindler, K. MOT16: A benchmark for multi-object tracking. arXiv 2016, arXiv:1603.00831. [Google Scholar] [CrossRef]
- Luiten, J.; Osep, A.; Dendorfer, P.; Torr, P.; Geiger, A.; Leal-Taixé, L.; Leibe, B. HOTA: A higher order metric for evaluating multi-object tracking. Int. J. Comput. Vis. 2020, 129, 548–578. [Google Scholar] [CrossRef] [PubMed]
- Kirillov, A.; Girshick, R.; He, K.; Dollár, P. Panoptic feature pyramid networks. In Proceedings of the IEEE/CVF Conference on Computer Vision and Pattern Recognition, Long Beach, CA, USA, 15–20 June 2019; pp. 6392–6401. [Google Scholar] [CrossRef]
- Patro, S.; Chatterjee, C.; Mohanty, S.; Singh, R.; Raghuwanshi, N.S. Flood inundation modeling using MIKE FLOOD and remote sensing data. J. Indian Soc. Remote Sens. 2009, 37, 107–118. [Google Scholar] [CrossRef]
- Corti, M.; Francioni, M.; Abbate, A.; Papini, M.; Longoni, L. Analysis and modelling of the September 2022 flooding event in the Misa Basin. Ital. J. Eng. Geol. Environ. 2024, 1, 69–76. [Google Scholar] [CrossRef]

| References | Key Features | Major Advantages | |
|---|---|---|---|
| Objectives | Visual Recognition Tasks | ||
| [19] | Flood monitoring | Semantic segmentation |
|
| [17] | Water level monitoring | Semantic segmentation |
|
| [13] | Post-flood scene understanding | Image classification, semantic segmentation, and visual question answering |
|
| [20] | Rainfall detection | Image classification |
|
| [12] | Water level and aspect ratio monitoring for flood severity and risk estimation | Object detection and instance segmentation |
|
| [11] | Foodborne objects type recognition | Object detection |
|
| [16] | Disaster damage assessment | Semantic segmentation |
|
| [18] | Water level and inundation depth estimation | Instance segmentation and video object segmentation |
|
| [15] | Urban flood extent segmentation | Semantic segmentation |
|
| [8] | Vehicle detection in flood scenarios | Object detection |
|
| [7] | Urban flood extent segmentation | Semantic segmentation |
|
| [14] | Urban waterlogging monitoring | Semantic segmentation |
|
| Video | Tracker | Evaluation Metrics | |||||
|---|---|---|---|---|---|---|---|
| HOTA (%) | DetA (%) | AssA (%) | LocA (%) | IDF1 (%) | IDSWs | ||
| #01 | StrongSORT | 72.21 | 72.21 | 72.21 | 81.15 | 97.75 | 0 |
| Proposed MOT | 74.01 | 74.01 | 74.01 | 81.10 | 99.68 | 0 | |
| #02 | StrongSORT | 61.73 | 53.62 | 71.06 | 86.78 | 76.36 | 3 |
| Proposed MOT | 65.89 | 57.41 | 75.63 | 86.89 | 79.58 | 3 | |
| #03 | StrongSORT | 58.63 | 54.26 | 63.53 | 81.46 | 79.78 | 1 |
| Proposed MOT | 58.11 | 53.28 | 63.57 | 81.68 | 78.44 | 0 | |
| #04 | StrongSORT | 73.09 | 72.36 | 73.90 | 82.77 | 95.21 | 0 |
| Proposed MOT | 75.85 | 75.03 | 76.81 | 82.81 | 97.13 | 0 | |
| #05 | StrongSORT | 31.56 | 24.14 | 52.71 | 75.11 | 38.69 | 5 |
| Proposed MOT | 33.81 | 25.50 | 53.80 | 74.79 | 43.42 | 3 | |
| #06 | StrongSORT | 63.99 | 61.74 | 66.57 | 81.21 | 88.84 | 2 |
| Proposed MOT | 69.18 | 67.31 | 71.45 | 81.24 | 93.28 | 2 | |
| #07 | StrongSORT | 75.54 | 75.23 | 75.86 | 84.34 | 95.76 | 0 |
| Proposed MOT | 76.27 | 76.13 | 76.43 | 84.38 | 96.34 | 0 | |
| #08 | StrongSORT | 77.27 | 73.64 | 82.34 | 81.09 | 98.69 | 2 |
| Proposed MOT | 78.72 | 75.00 | 83.93 | 81.11 | 99.63 | 1 | |
| #09 | StrongSORT | 72.19 | 72.19 | 72.19 | 79.51 | 98.36 | 1 |
| Proposed MOT | 72.83 | 72.83 | 72.83 | 79.39 | 99.00 | 1 | |
| #10 | StrongSORT | 77.21 | 77.01 | 77.42 | 83.49 | 98.15 | 0 |
| Proposed MOT | 78.97 | 78.78 | 79.16 | 83.48 | 99.32 | 0 | |
| Video | Tracker | Evaluation Metrics | |||||
|---|---|---|---|---|---|---|---|
| HOTA (%) | DetA (%) | AssA (%) | LocA (%) | IDF1 (%) | IDSWs | ||
| #01 | StrongSORT | 70.14 | 70.14 | 70.14 | 81.02 | 96.35 | 0 |
| Proposed MOT | 71.90 | 71.90 | 71.90 | 80.97 | 97.65 | 0 | |
| #02 | StrongSORT | 64.93 | 59.91 | 70.37 | 87.10 | 81.67 | 2 |
| Proposed MOT | 69.77 | 65.02 | 74.86 | 87.20 | 85.63 | 2 | |
| #03 | StrongSORT | 58.93 | 54.29 | 64.20 | 81.59 | 79.67 | 1 |
| Proposed MOT | 58.21 | 53.21 | 63.94 | 81.77 | 78.38 | 0 | |
| #04 | StrongSORT | 72.50 | 71.71 | 73.39 | 82.67 | 94.94 | 0 |
| Proposed MOT | 75.69 | 74.81 | 76.72 | 82.68 | 97.13 | 0 | |
| #05 | StrongSORT | 32.83 | 25.13 | 53.06 | 75.20 | 39.44 | 5 |
| Proposed MOT | 35.29 | 26.61 | 54.89 | 75.22 | 44.32 | 3 | |
| #06 | StrongSORT | 62.89 | 58.75 | 67.61 | 81.27 | 86.14 | 2 |
| Proposed MOT | 70.01 | 66.27 | 74.32 | 81.52 | 92.24 | 2 | |
| #07 | StrongSORT | 74.72 | 73.48 | 75.98 | 84.83 | 94.26 | 0 |
| Proposed MOT | 75.82 | 74.91 | 76.75 | 84.90 | 95.17 | 0 | |
| #08 | StrongSORT | 77.43 | 73.68 | 82.75 | 81.09 | 98.69 | 2 |
| Proposed MOT | 78.90 | 75.07 | 84.38 | 81.11 | 99.63 | 1 | |
| #09 | StrongSORT | 72.23 | 72.23 | 72.23 | 79.68 | 98.87 | 0 |
| Proposed MOT | 72.85 | 72.85 | 72.85 | 79.58 | 99.25 | 0 | |
| #10 | StrongSORT | 77.61 | 77.57 | 77.66 | 83.58 | 98.15 | 0 |
| Proposed MOT | 79.28 | 79.23 | 79.33 | 83.52 | 99.32 | 0 | |
| Video | Tracker | Evaluation Metrics | |||||
|---|---|---|---|---|---|---|---|
| HOTA (%) | DetA (%) | AssA (%) | LocA (%) | IDF1 (%) | IDSWs | ||
| #01 | StrongSORT | 72.60 | 72.60 | 72.60 | 80.82 | 98.14 | 0 |
| Proposed MOT | 74.24 | 74.24 | 74.24 | 80.78 | 99.34 | 0 | |
| #02 | StrongSORT | 70.48 | 68.96 | 72.03 | 87.37 | 88.55 | 3 |
| Proposed MOT | 75.42 | 74.16 | 76.71 | 87.50 | 92.12 | 2 | |
| #03 | StrongSORT | 58.94 | 54.36 | 64.08 | 81.48 | 79.89 | 0 |
| Proposed MOT | 58.41 | 53.42 | 64.06 | 81.70 | 78.70 | 0 | |
| #04 | StrongSORT | 72.38 | 71.54 | 73.32 | 82.81 | 94.80 | 1 |
| Proposed MOT | 75.55 | 74.61 | 76.65 | 82.86 | 96.99 | 0 | |
| #05 | StrongSORT | 32.68 | 25.04 | 53.13 | 75.18 | 40.75 | 6 |
| Proposed MOT | 34.46 | 26.64 | 53.42 | 75.03 | 43.15 | 2 | |
| #06 | StrongSORT | 64.37 | 60.45 | 68.79 | 81.43 | 88.32 | 0 |
| Proposed MOT | 70.54 | 67.12 | 74.41 | 81.43 | 93.72 | 2 | |
| #07 | StrongSORT | 75.30 | 74.93 | 75.70 | 84.48 | 95.26 | 2 |
| Proposed MOT | 76.19 | 76.06 | 76.35 | 84.50 | 96.00 | 0 | |
| #08 | StrongSORT | 77.02 | 73.29 | 82.23 | 80.88 | 98.69 | 1 |
| Proposed MOT | 78.49 | 74.67 | 83.85 | 80.90 | 99.63 | 1 | |
| #09 | StrongSORT | 72.05 | 72.05 | 72.05 | 79.47 | 98.87 | 0 |
| Proposed MOT | 72.65 | 72.65 | 72.65 | 79.37 | 99.25 | 0 | |
| #10 | StrongSORT | 78.03 | 77.97 | 78.09 | 84.17 | 98.15 | 0 |
| Proposed MOT | 79.72 | 79.67 | 79.77 | 84.09 | 99.32 | 0 | |
| Baseline Network | Tracker | Evaluation Metrics | ||||||
|---|---|---|---|---|---|---|---|---|
| HOTA (%) | DetA (%) | AssA (%) | LocA (%) | IDF1 (%) | IDSWs | FPS 1 | ||
| Mask R-CNN | StrongSORT | 66.34 | 63.64 | 70.78 | 81.69 | 86.76 | 14 | 8.6 |
| Proposed MOT | 68.36 | 65.53 | 72.76 | 81.69 | 88.58 | 10 | 14.5 | |
| Deformable CNN | StrongSORT | 66.42 | 63.69 | 70.74 | 81.80 | 86.82 | 12 | 8.2 |
| Proposed MOT | 68.77 | 65.99 | 72.99 | 81.85 | 88.87 | 8 | 14.3 | |
| Cascade R-CNN | StrongSORT | 67.38 | 65.12 | 71.20 | 81.81 | 88.14 | 13 | 8.1 |
| Proposed MOT | 69.57 | 67.32 | 73.21 | 81.82 | 89.82 | 7 | 14.4 | |
Disclaimer/Publisher’s Note: The statements, opinions and data contained in all publications are solely those of the individual author(s) and contributor(s) and not of MDPI and/or the editor(s). MDPI and/or the editor(s) disclaim responsibility for any injury to people or property resulting from any ideas, methods, instructions or products referred to in the content. |
© 2025 by the authors. Licensee MDPI, Basel, Switzerland. This article is an open access article distributed under the terms and conditions of the Creative Commons Attribution (CC BY) license (https://creativecommons.org/licenses/by/4.0/).
Share and Cite
Yan, X.; Zhu, Y.; Wang, Z.; Xu, B.; He, L.; Xia, R. Intelligent Flood Scene Understanding Using Computer Vision-Based Multi-Object Tracking. Water 2025, 17, 2111. https://doi.org/10.3390/w17142111
Yan X, Zhu Y, Wang Z, Xu B, He L, Xia R. Intelligent Flood Scene Understanding Using Computer Vision-Based Multi-Object Tracking. Water. 2025; 17(14):2111. https://doi.org/10.3390/w17142111
Chicago/Turabian StyleYan, Xuzhong, Yiqiao Zhu, Zeli Wang, Bin Xu, Liu He, and Rong Xia. 2025. "Intelligent Flood Scene Understanding Using Computer Vision-Based Multi-Object Tracking" Water 17, no. 14: 2111. https://doi.org/10.3390/w17142111
APA StyleYan, X., Zhu, Y., Wang, Z., Xu, B., He, L., & Xia, R. (2025). Intelligent Flood Scene Understanding Using Computer Vision-Based Multi-Object Tracking. Water, 17(14), 2111. https://doi.org/10.3390/w17142111