
Developing a Remote Sensing-Based Approach for Agriculture Water Accounting in the Amman–Zarqa Basin

 ,
,  , ,
, ,  ,
,  and
and
Abstract
1. Introduction
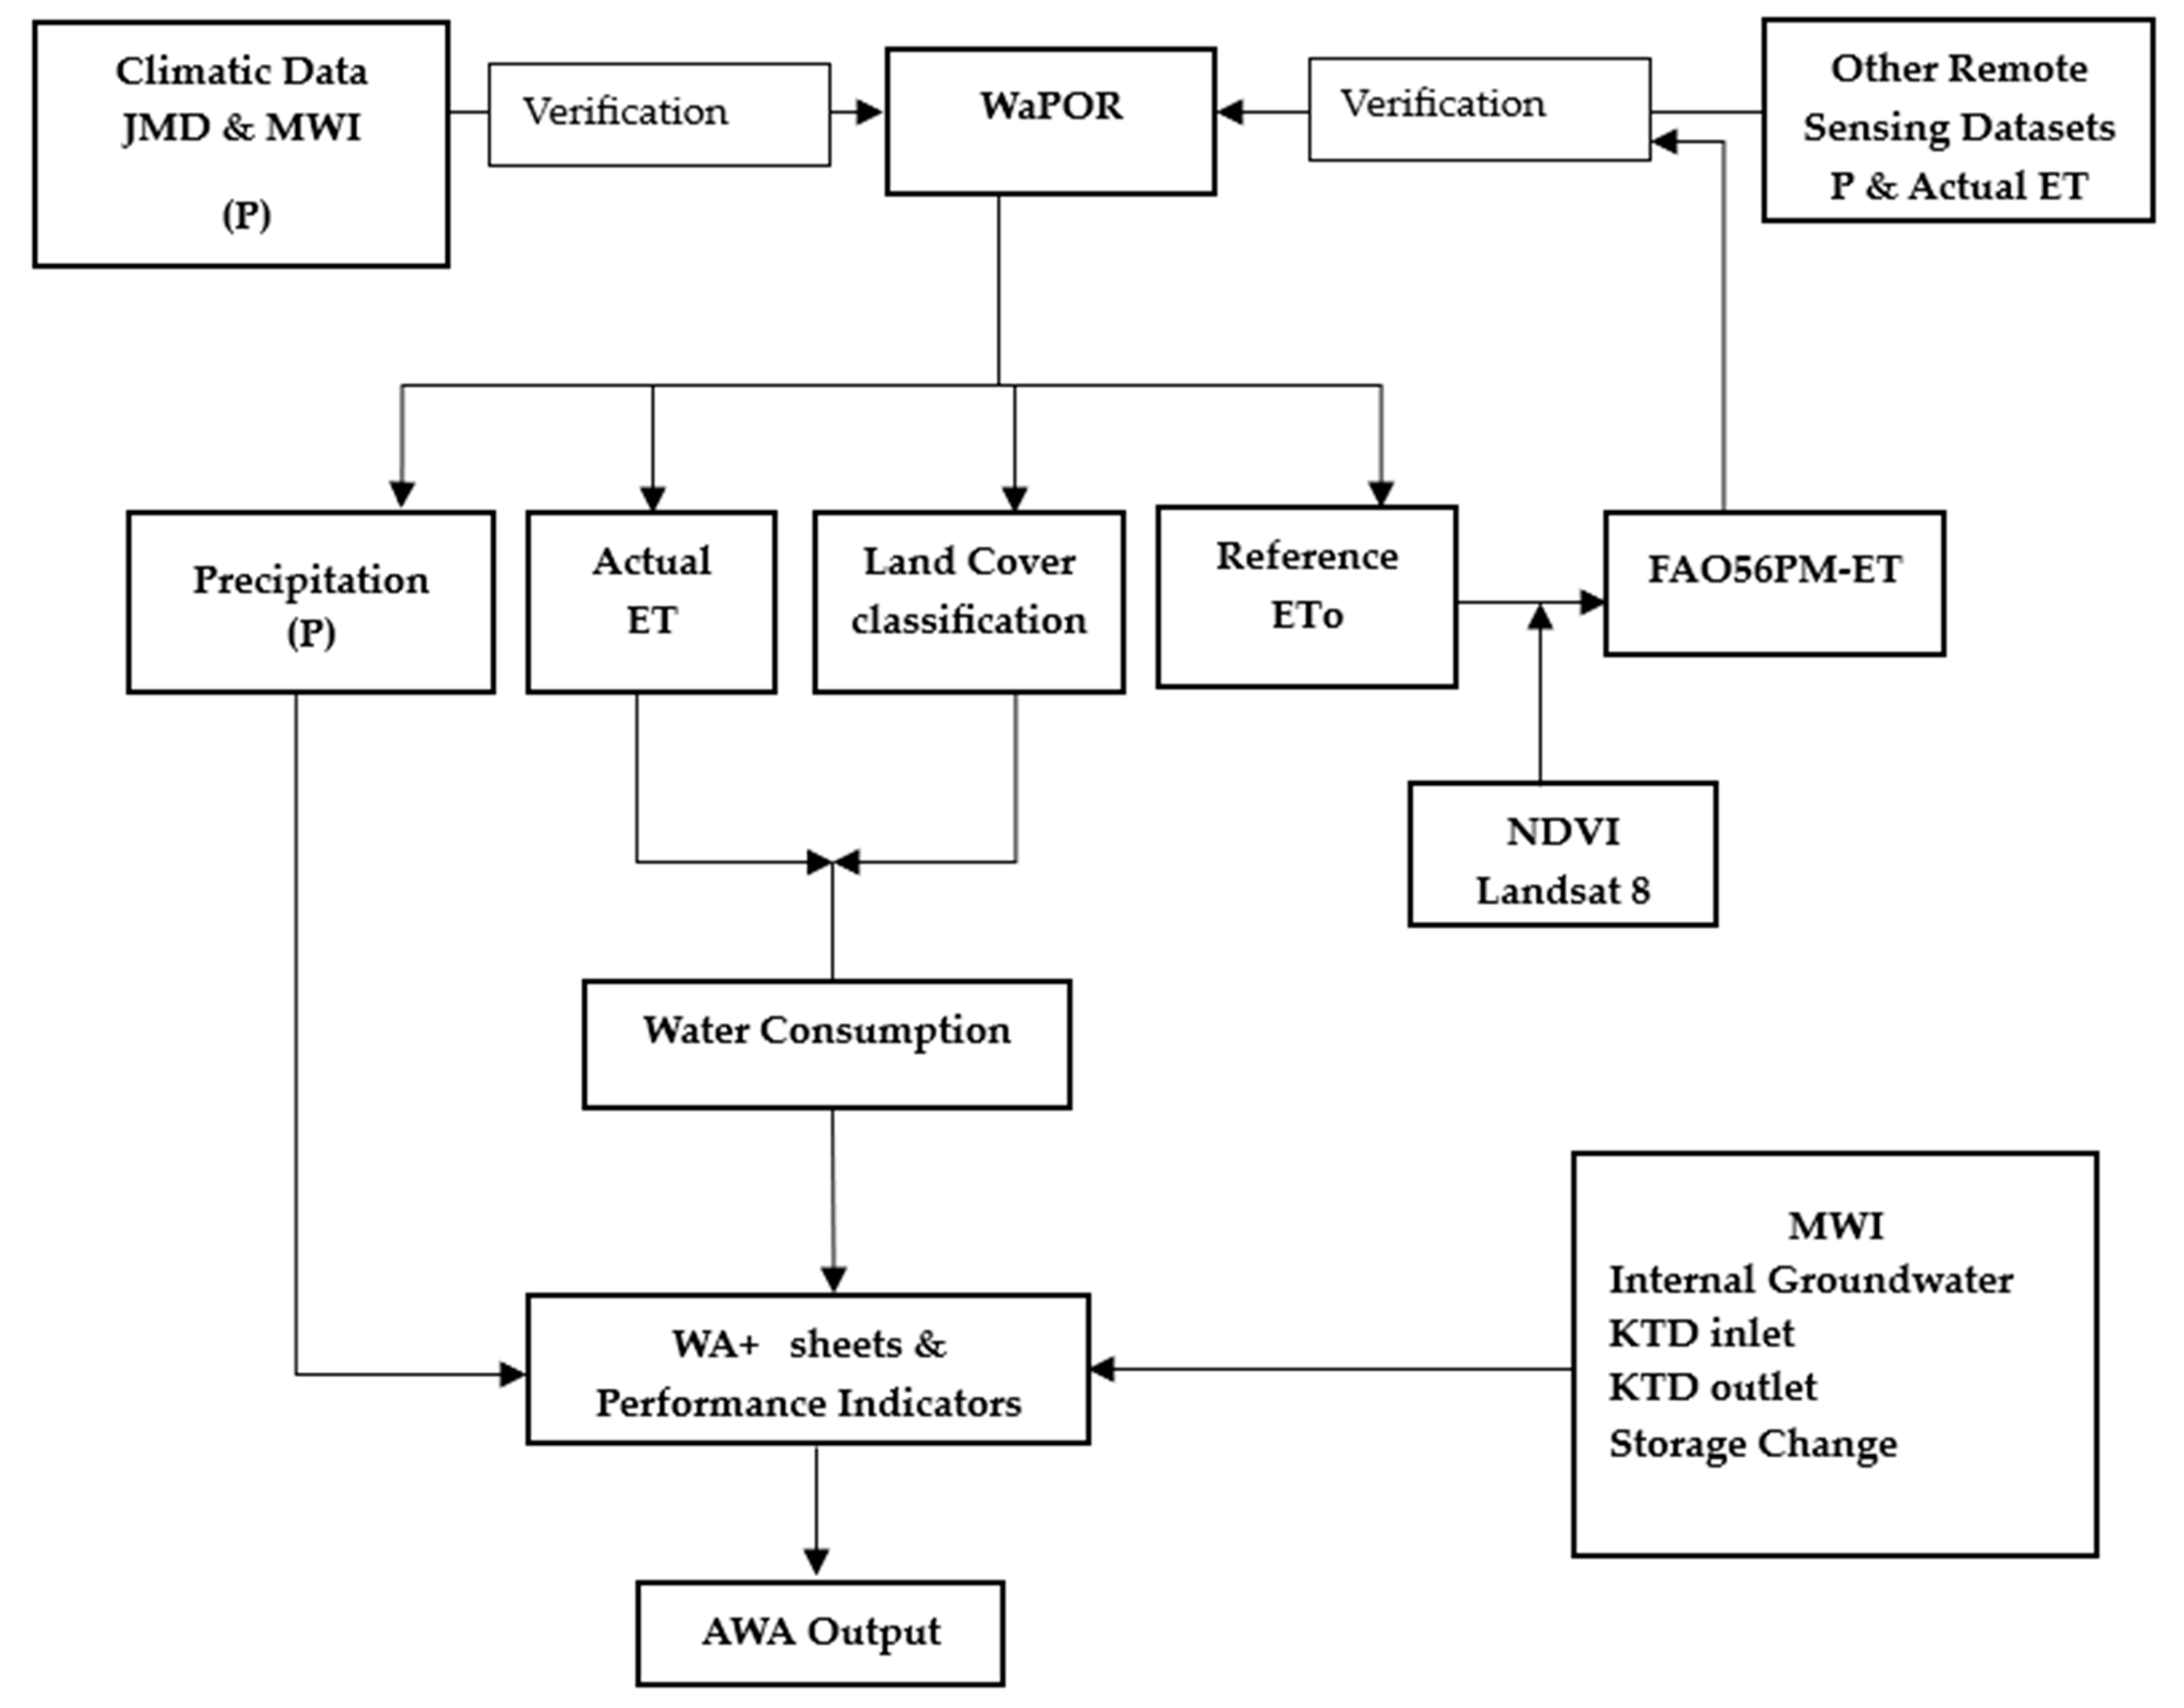
2. Materials and Methods
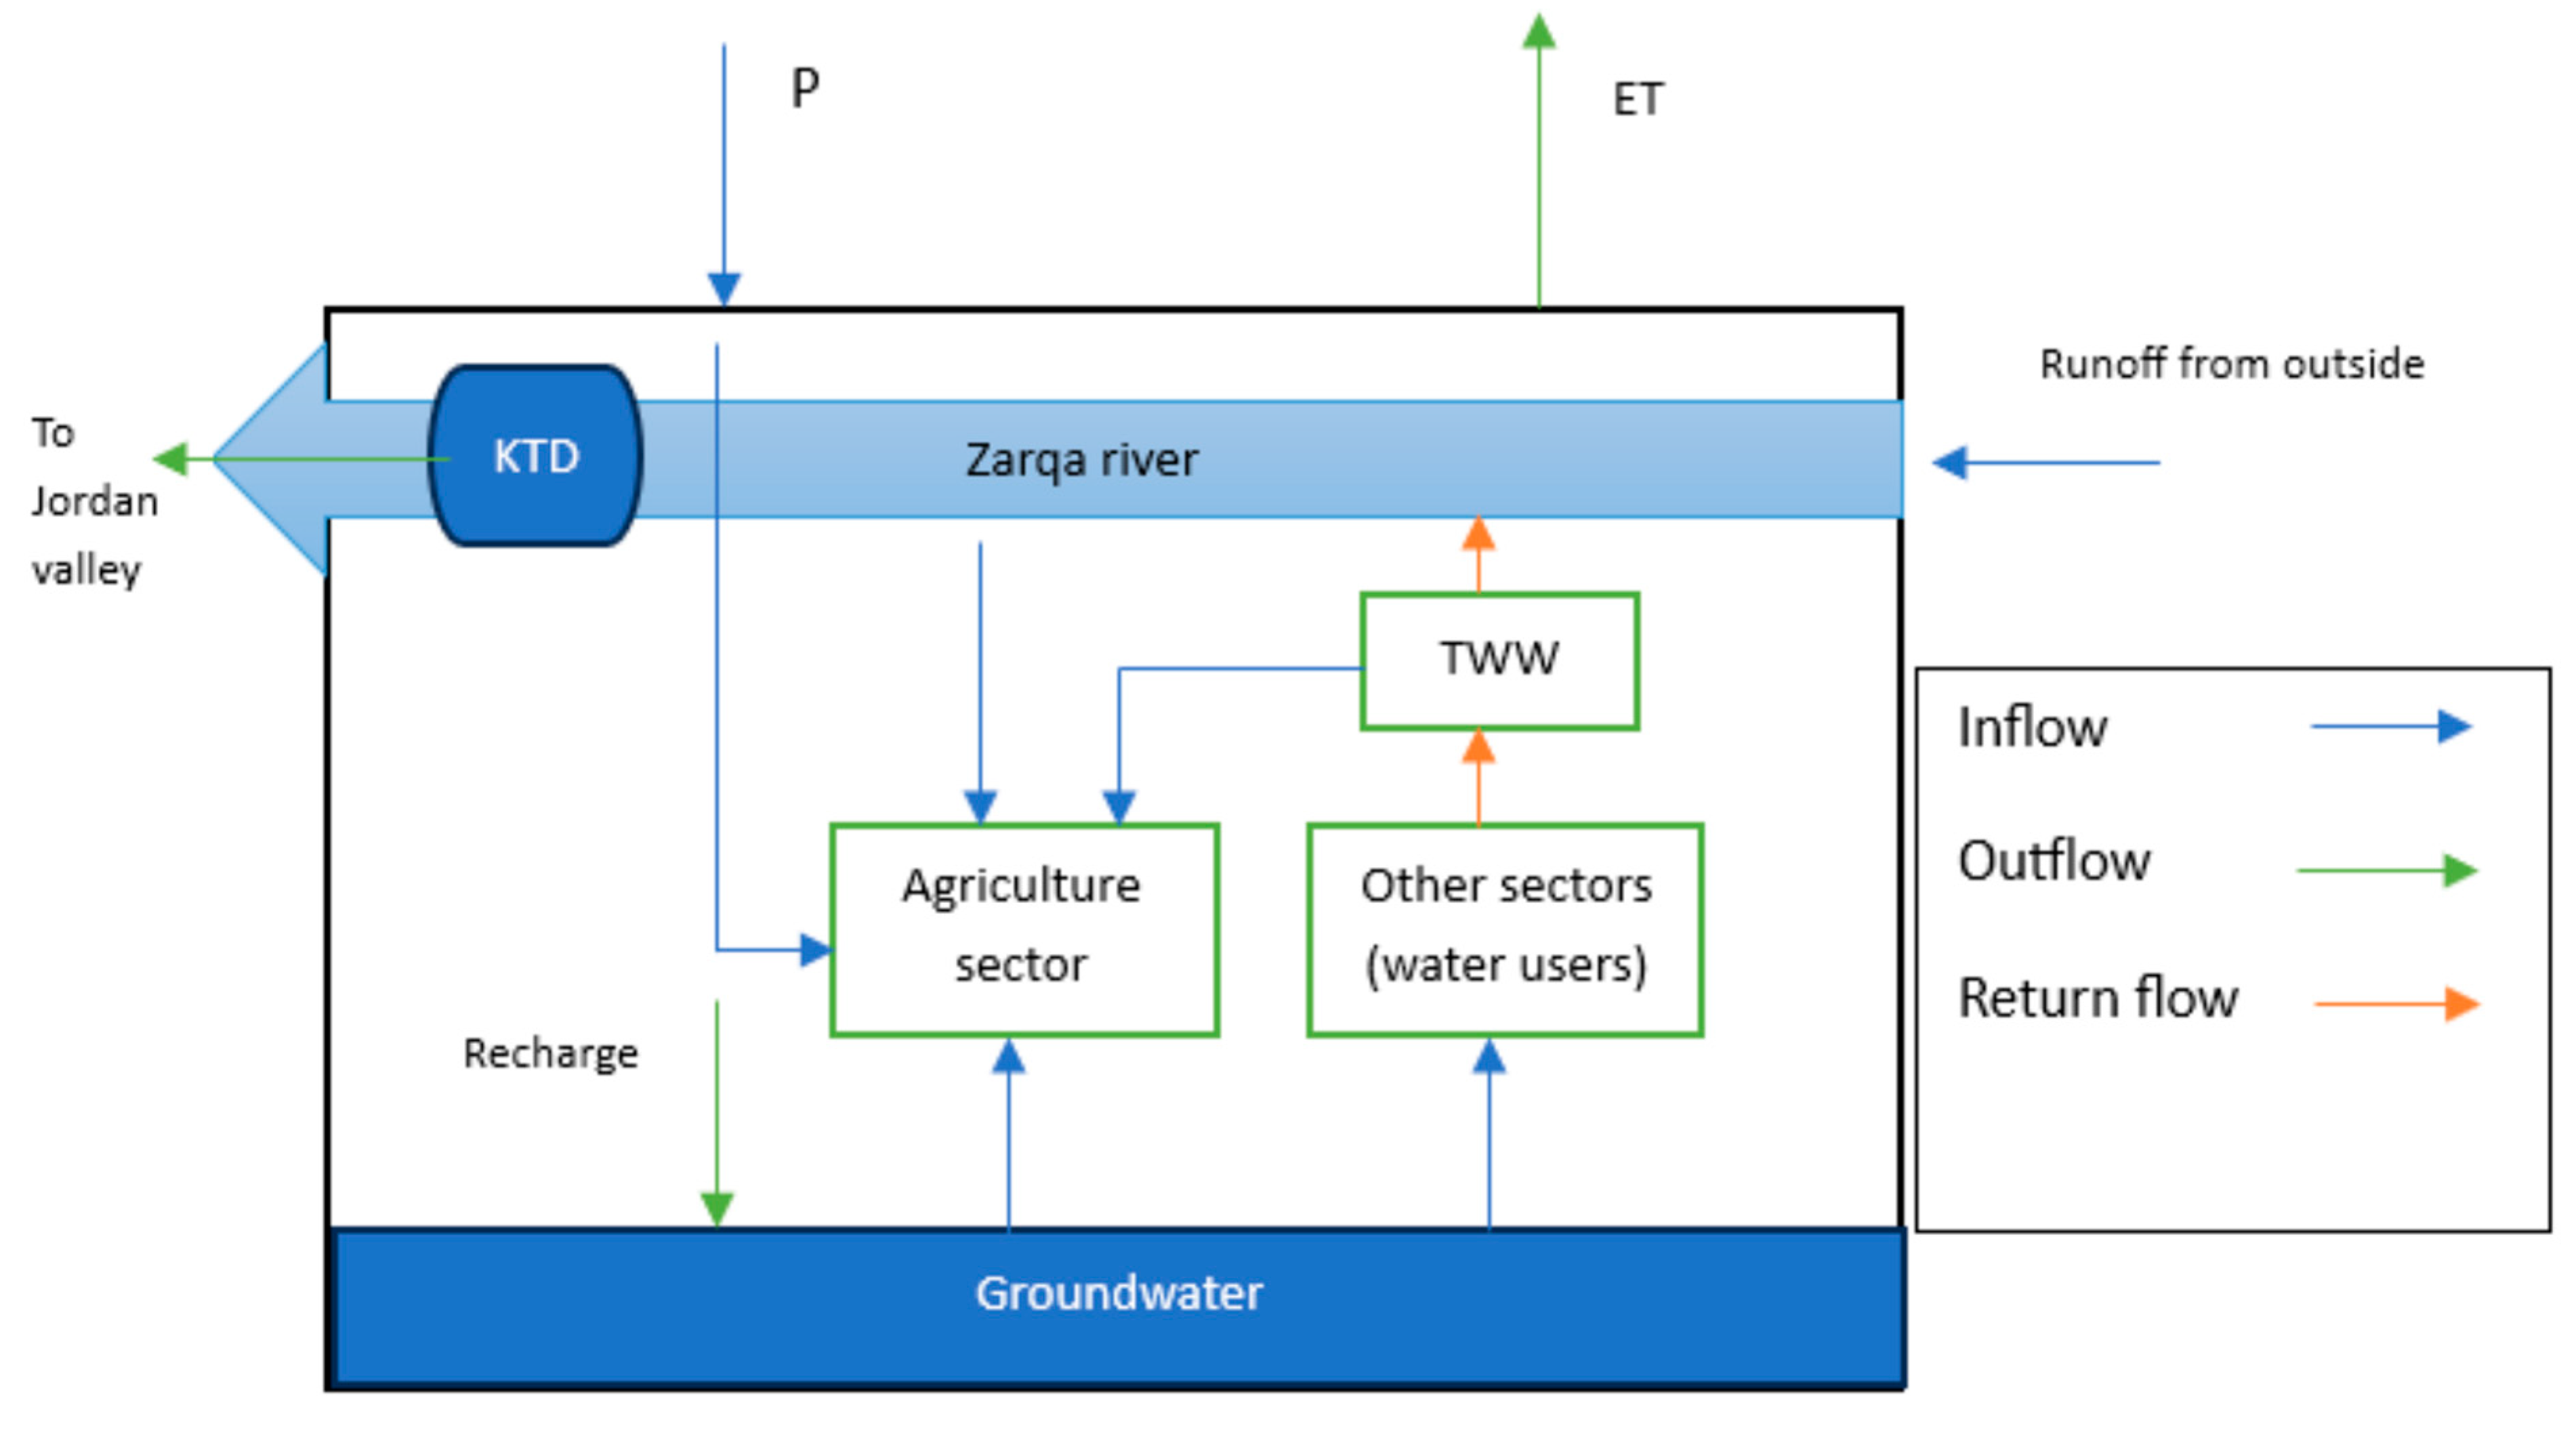
2.1. Study Area
2.2. Data Collection and Processing
2.2.1. Calculation of Water Inflows
2.2.2. Calculation of Water Outflows
2.3. WA+ Analytical Framework
3. Results
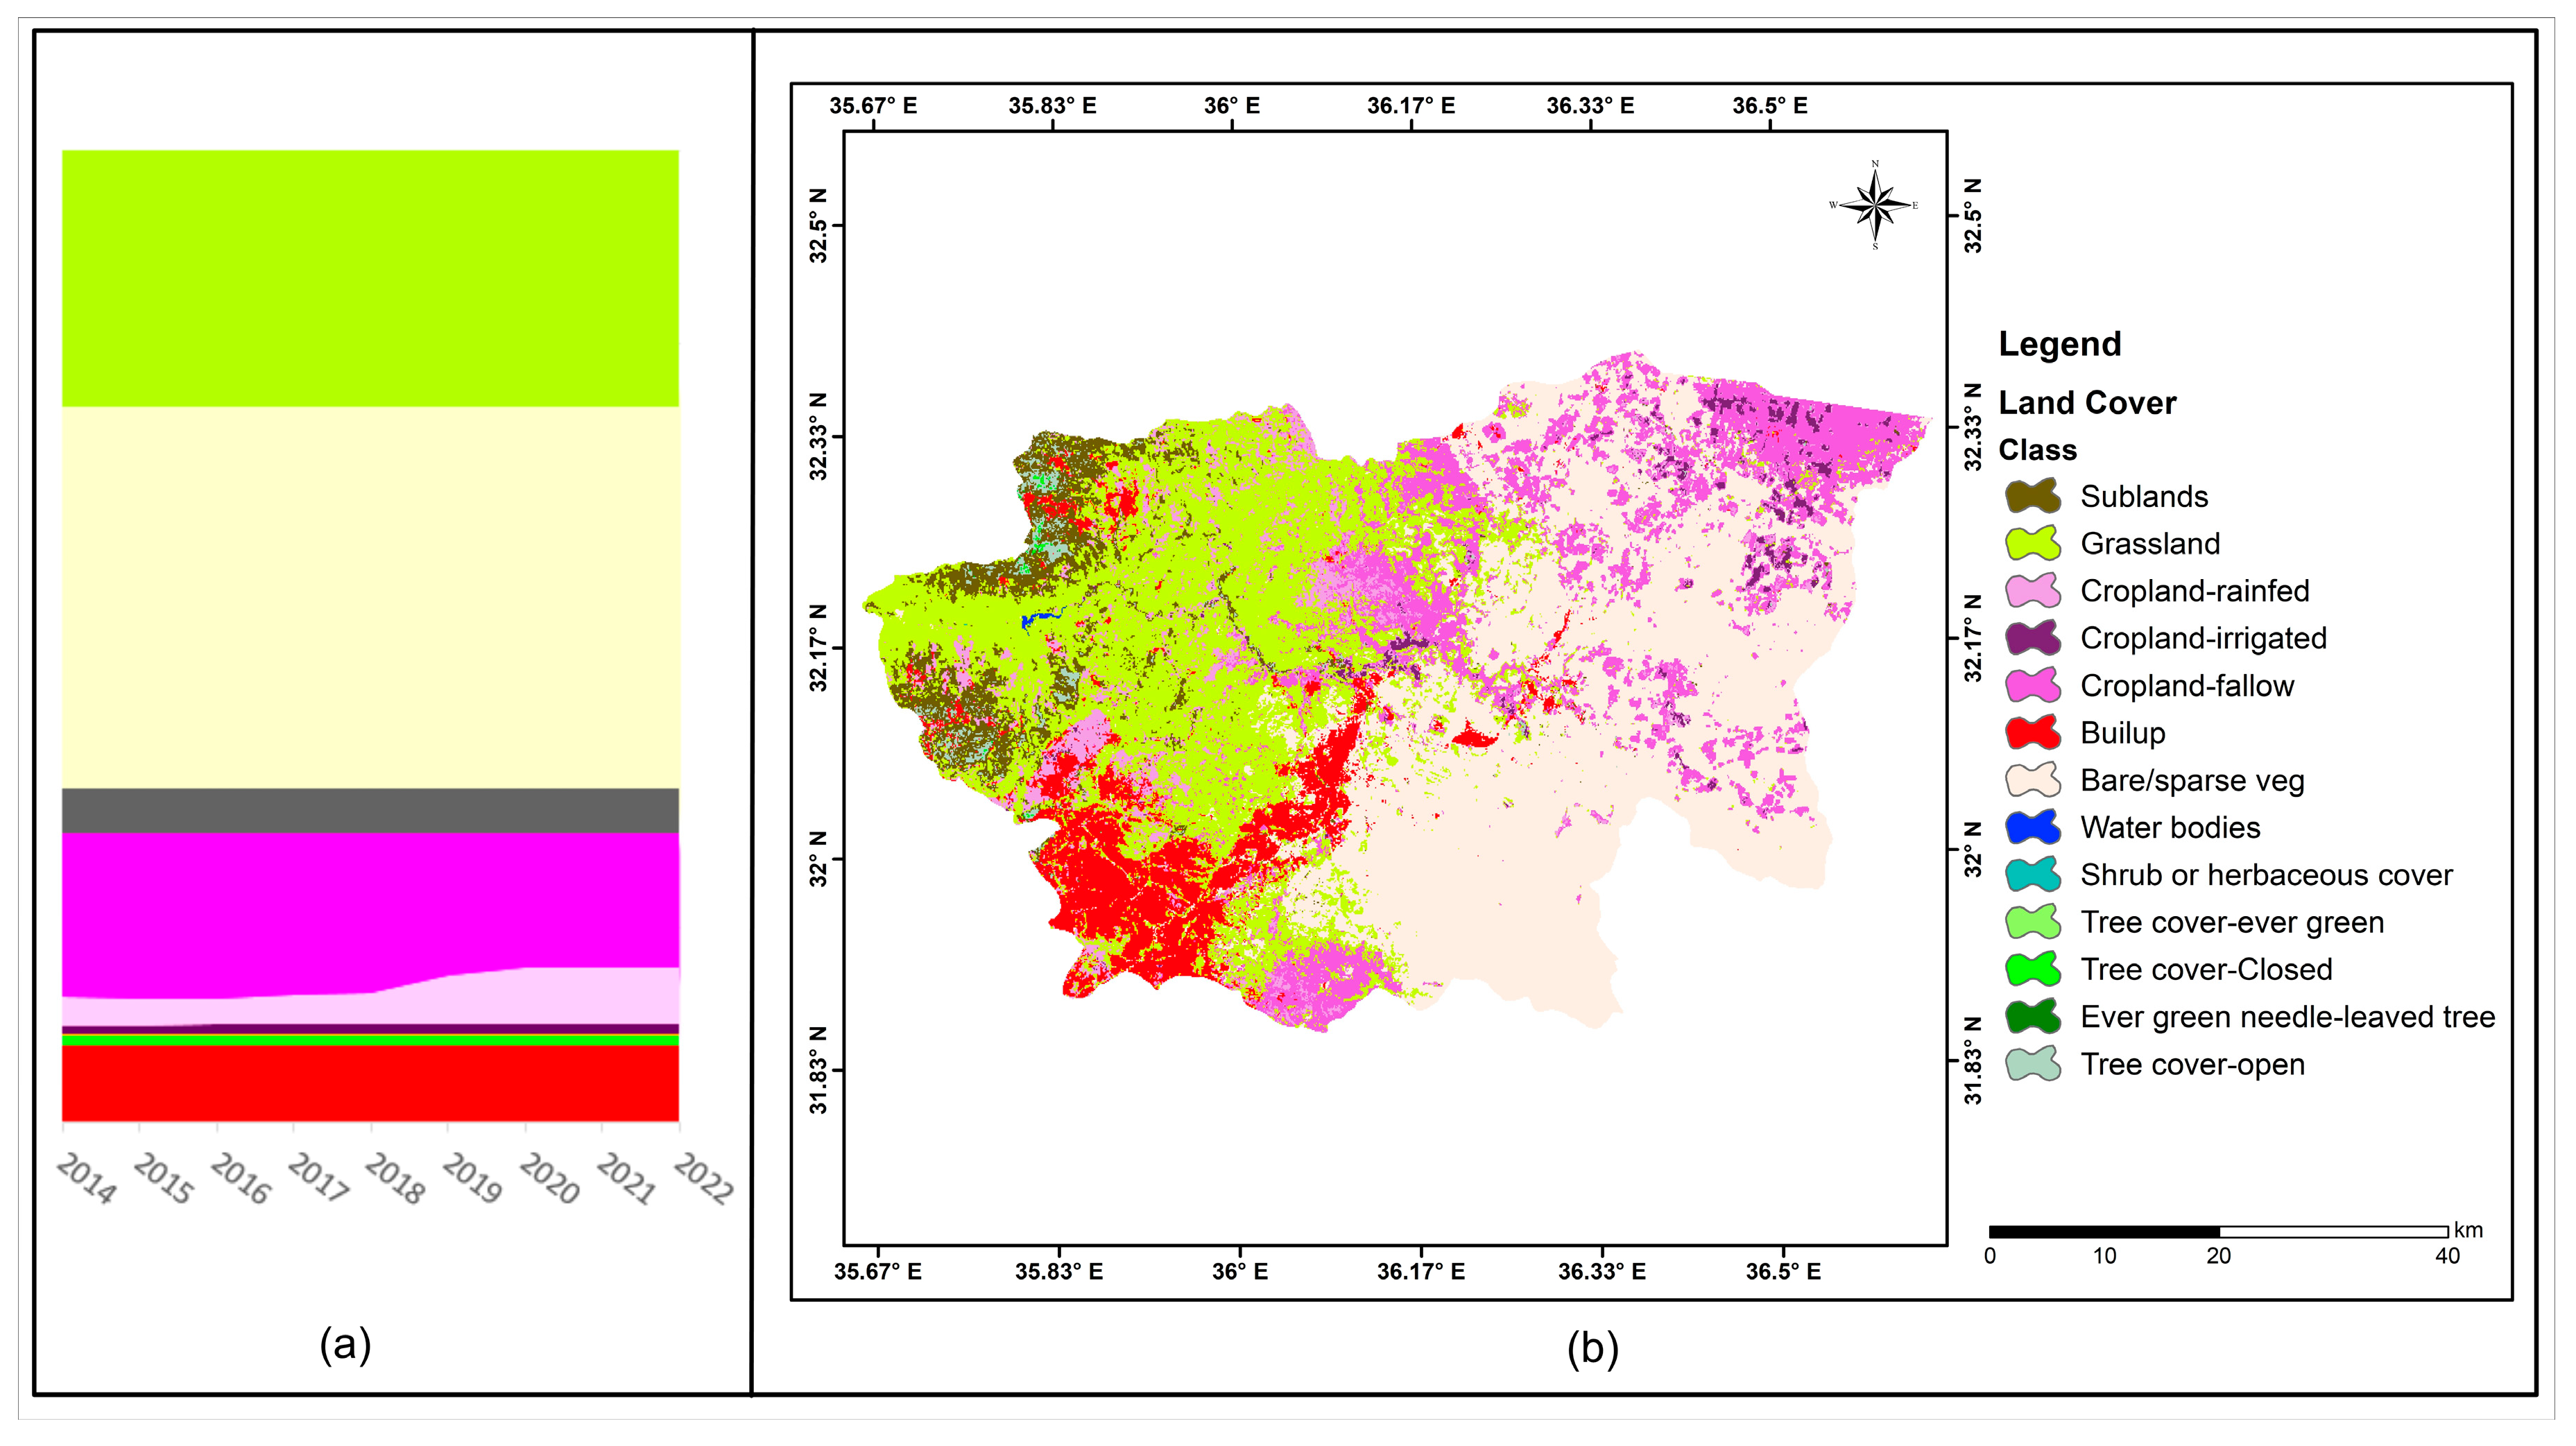
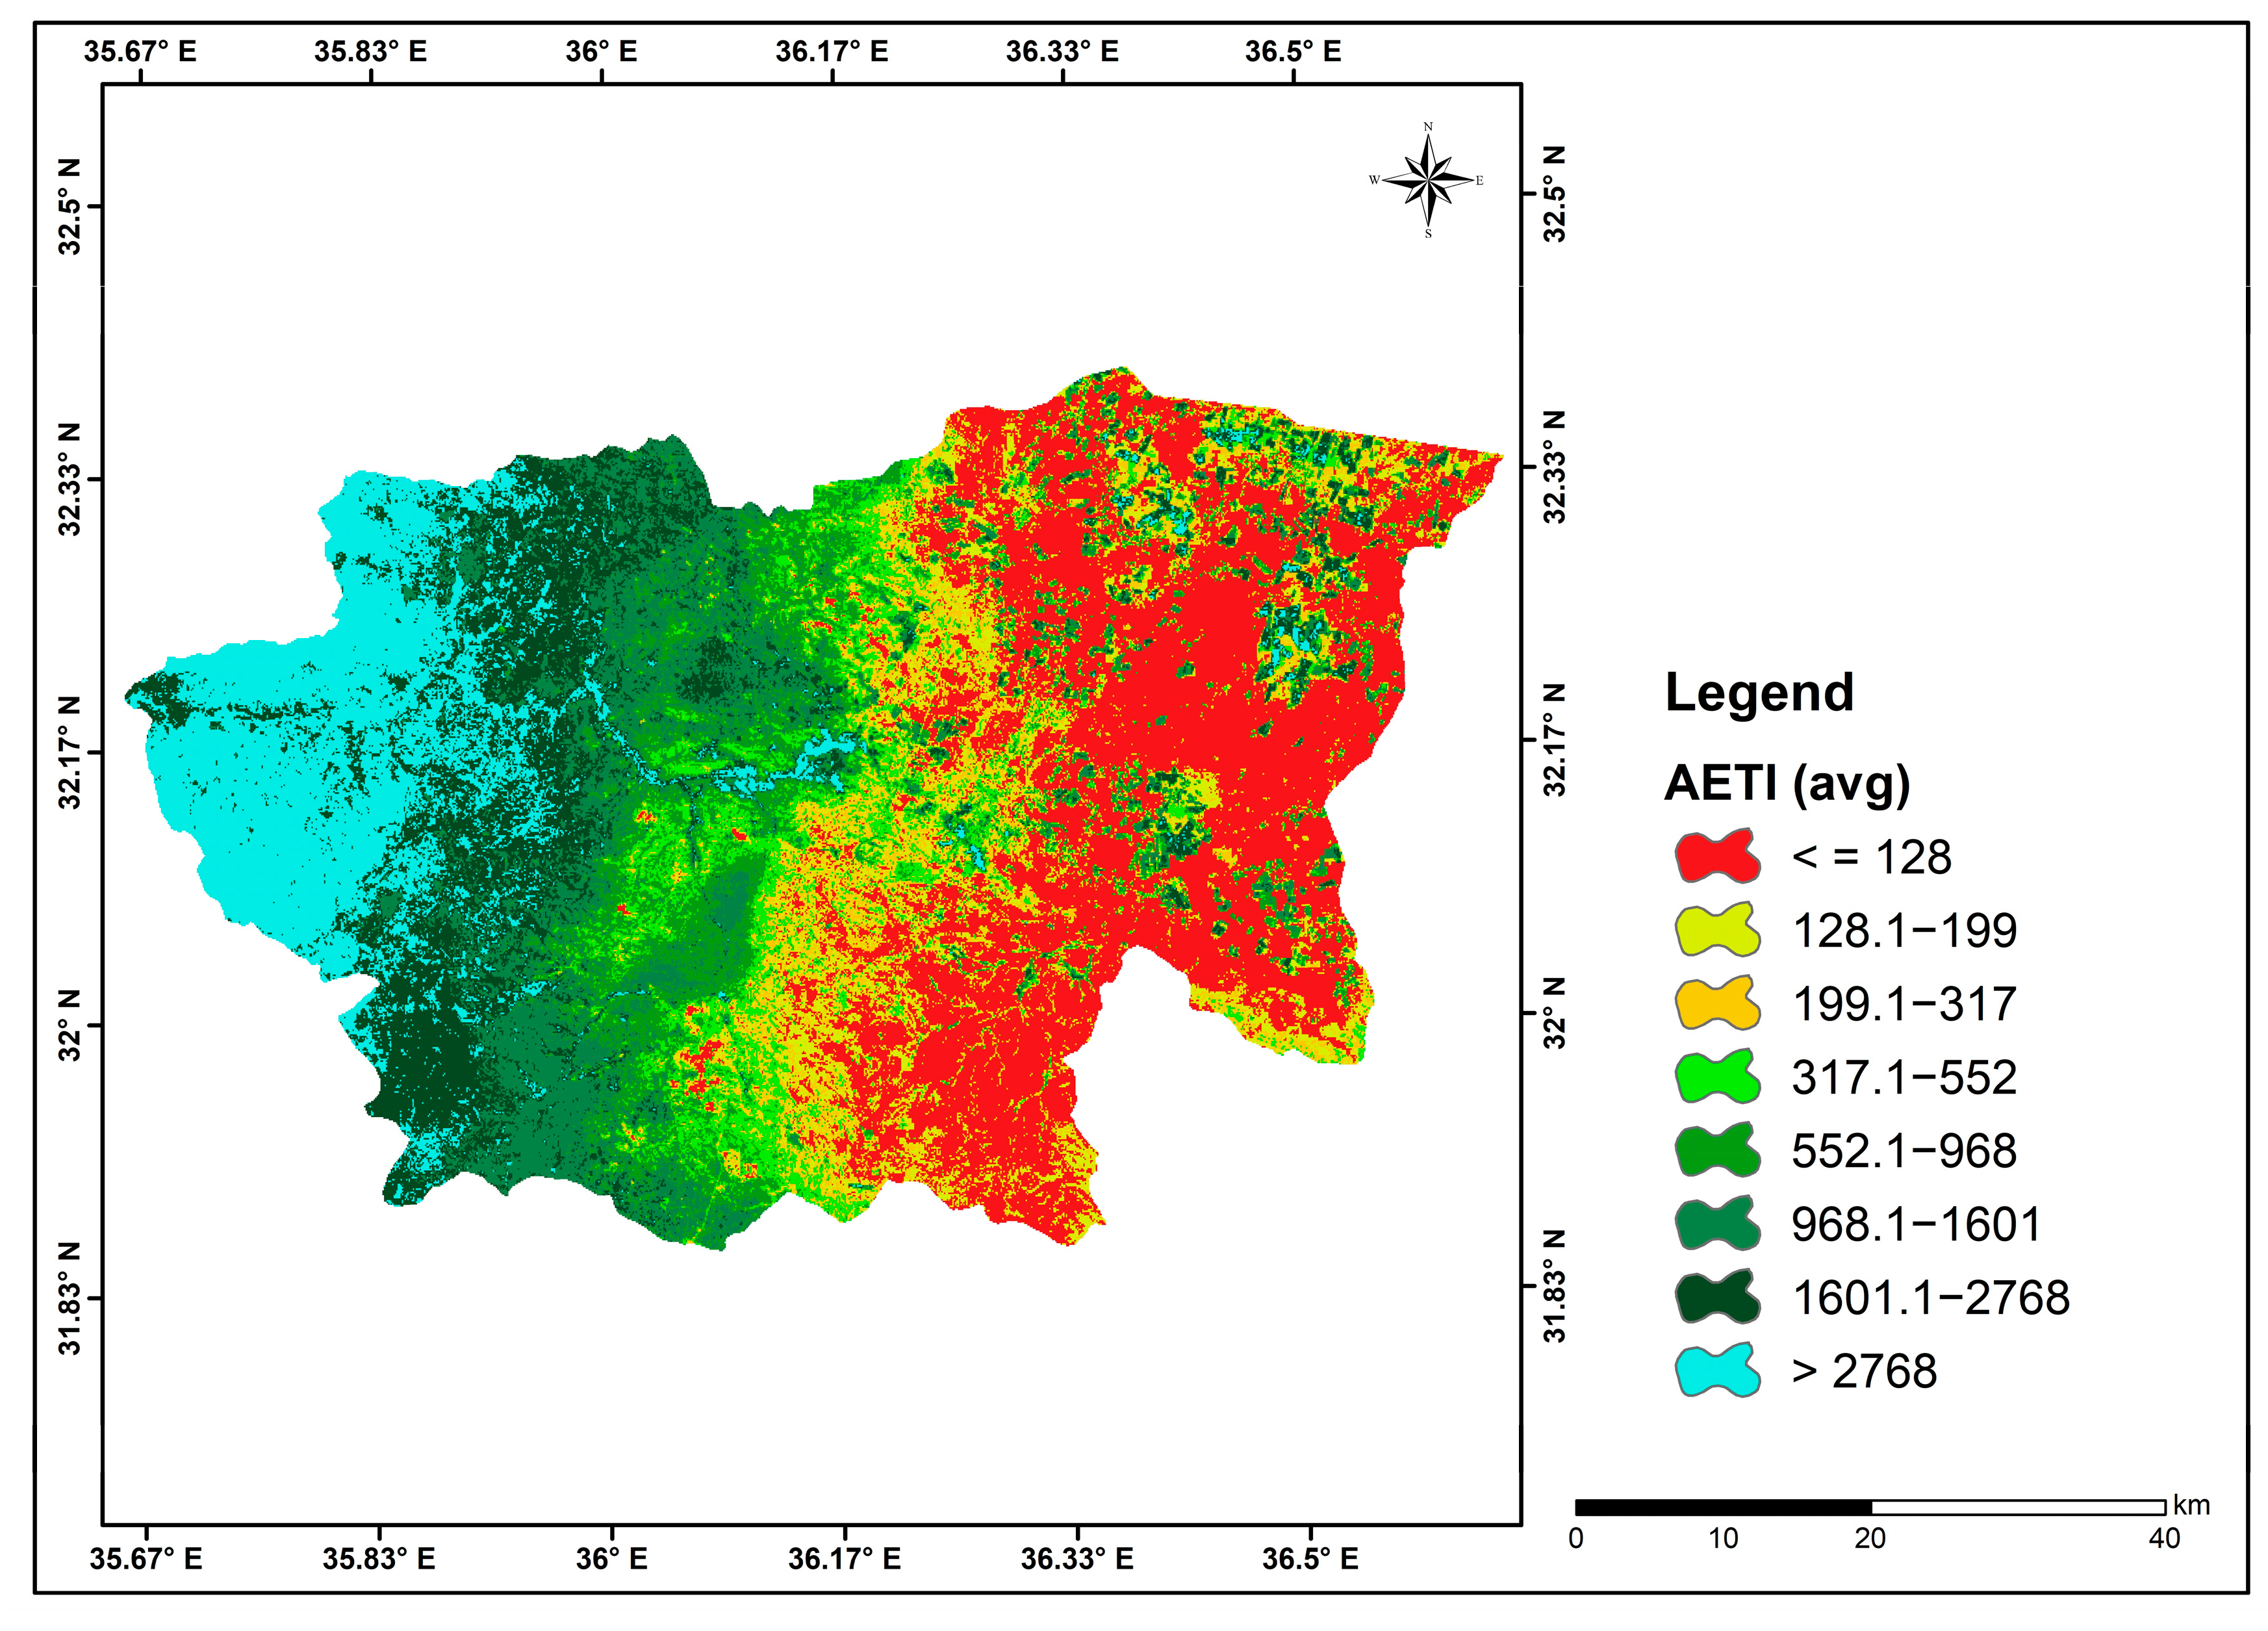
3.1. Land Cover and Water Use Categories
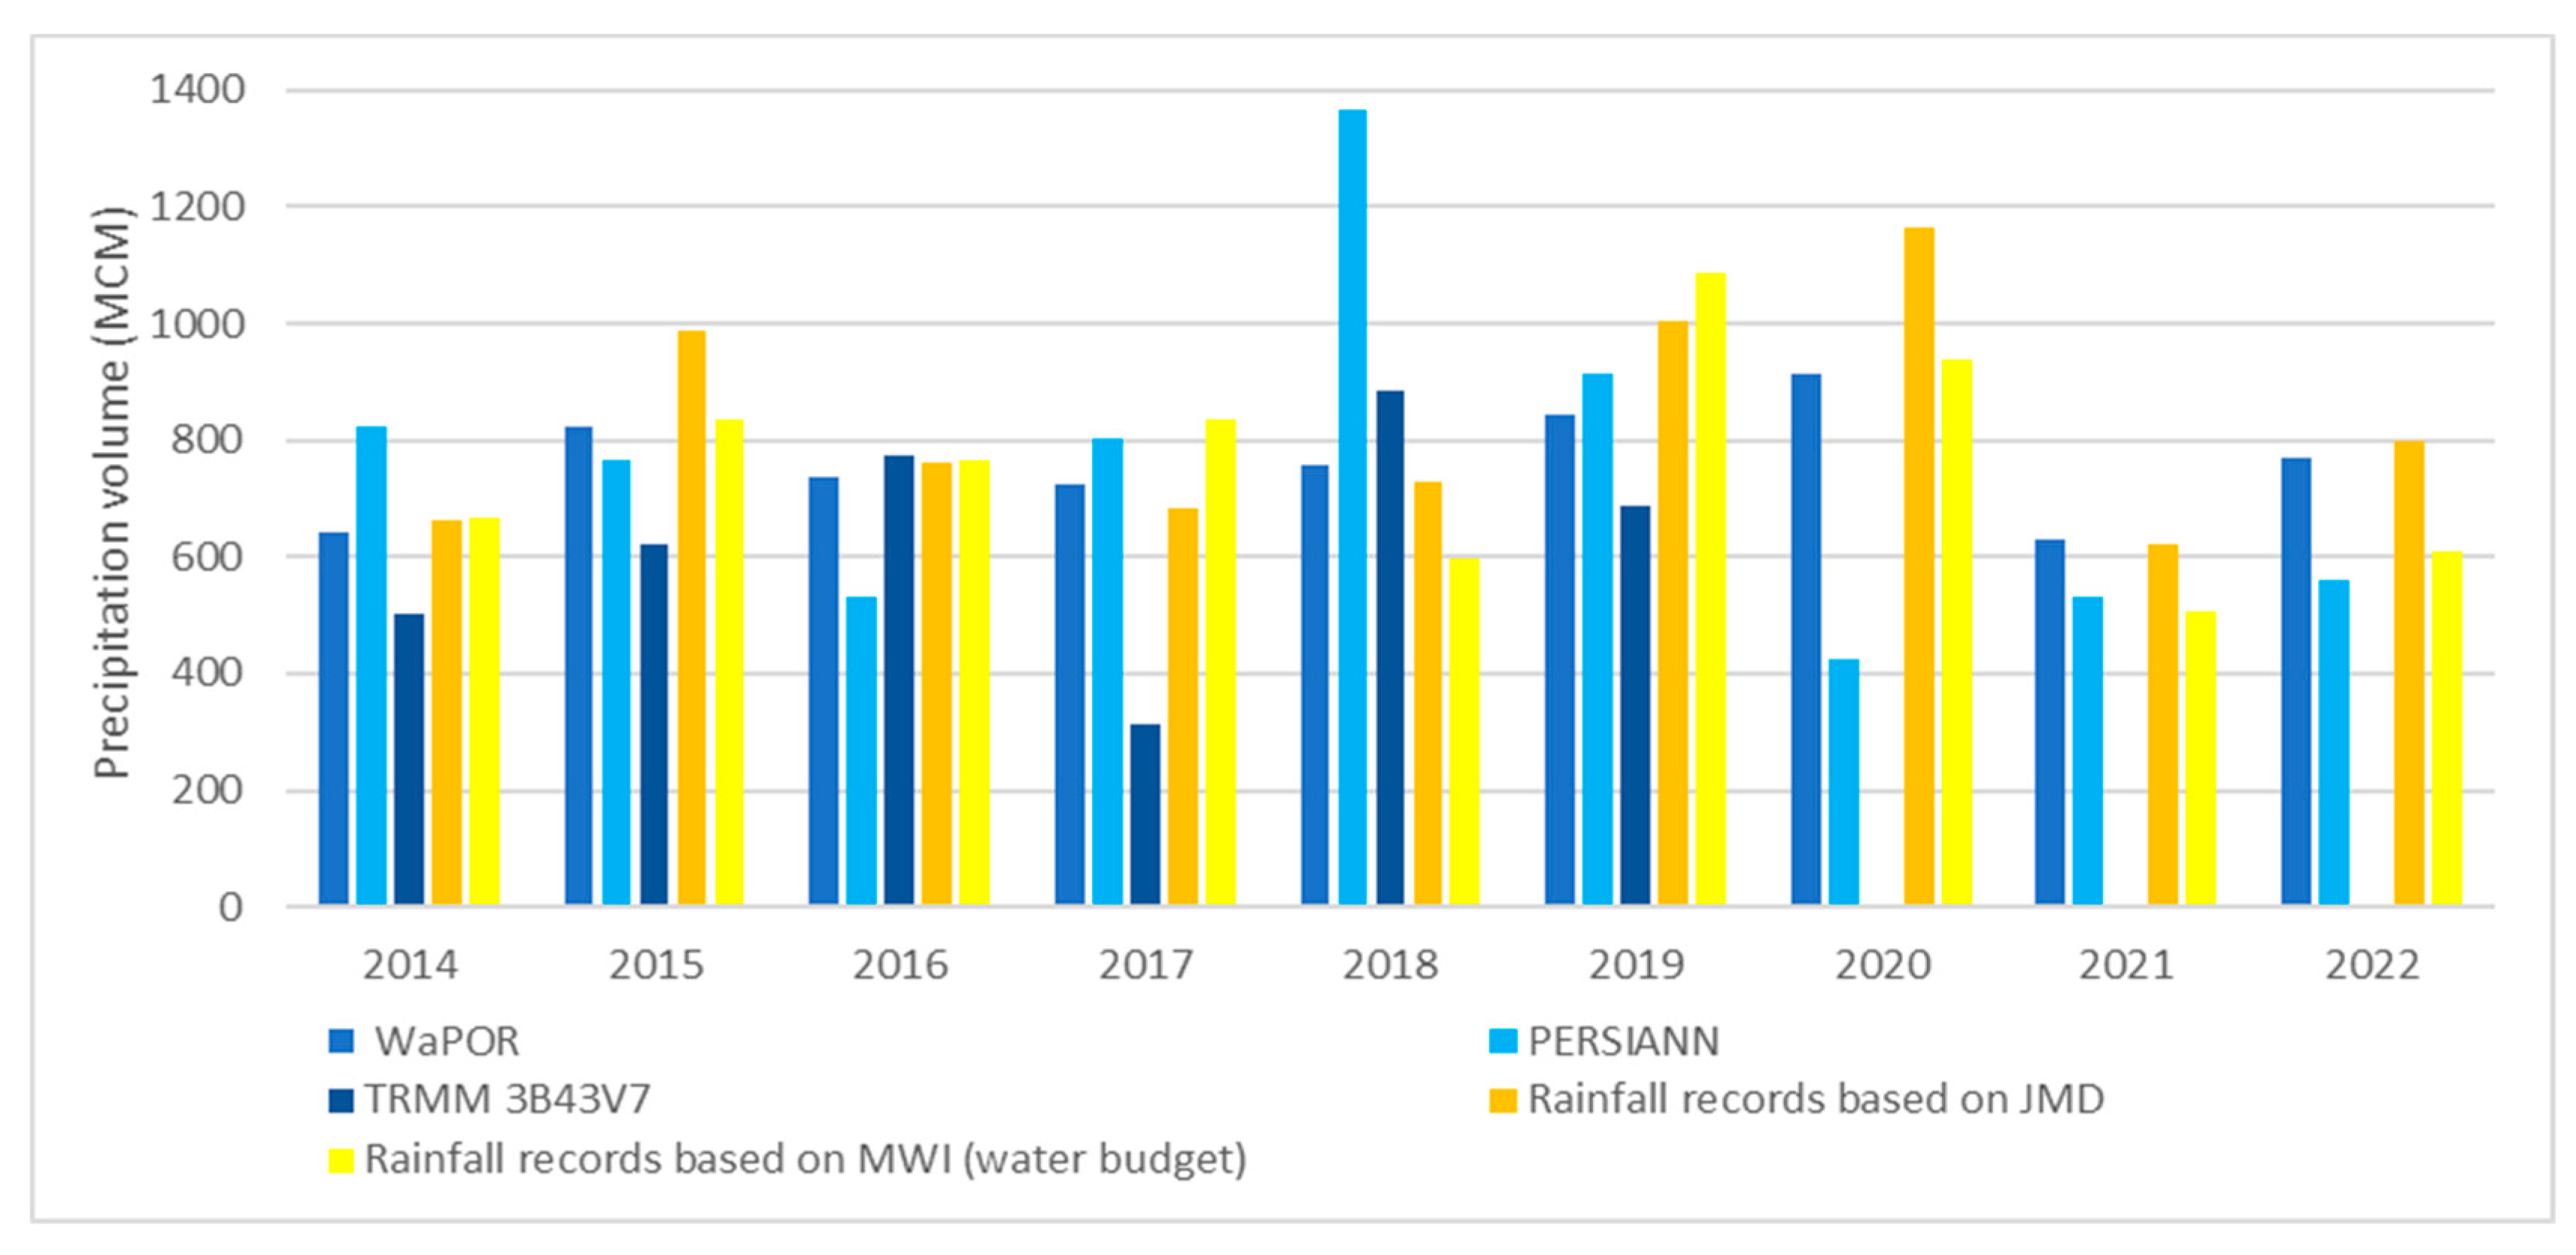
3.2. Water Inflows
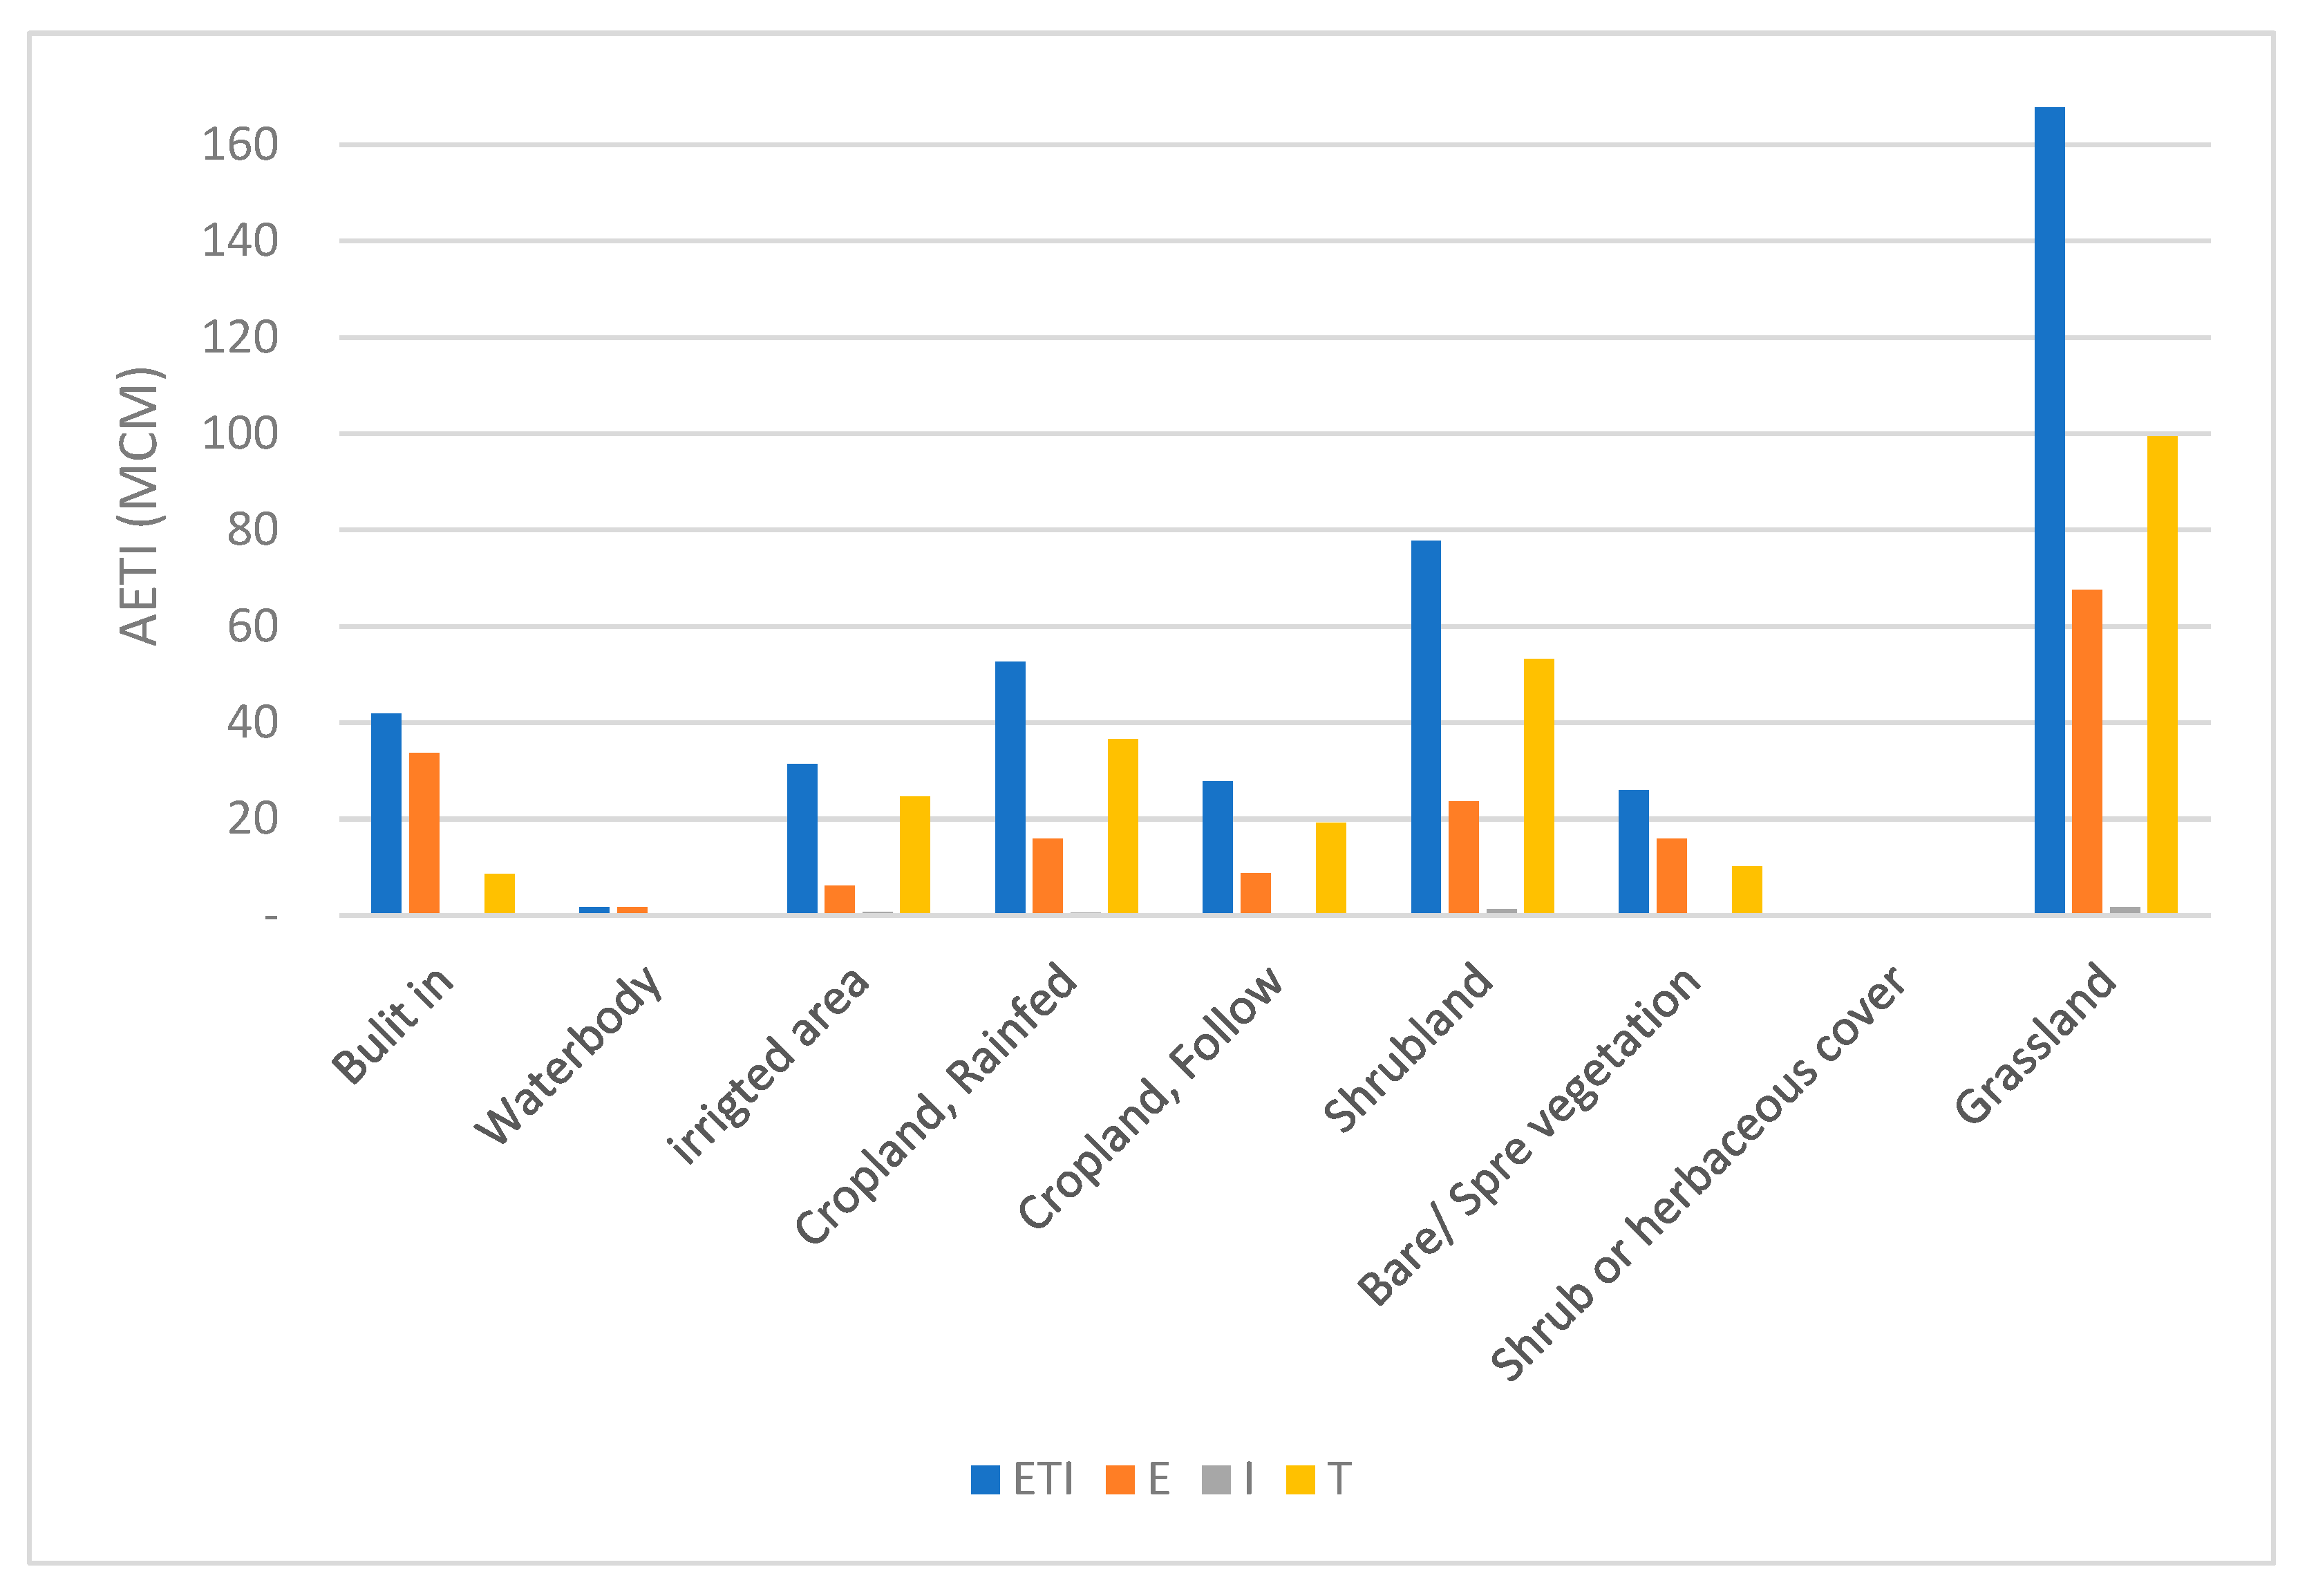
3.3. Water Outflows
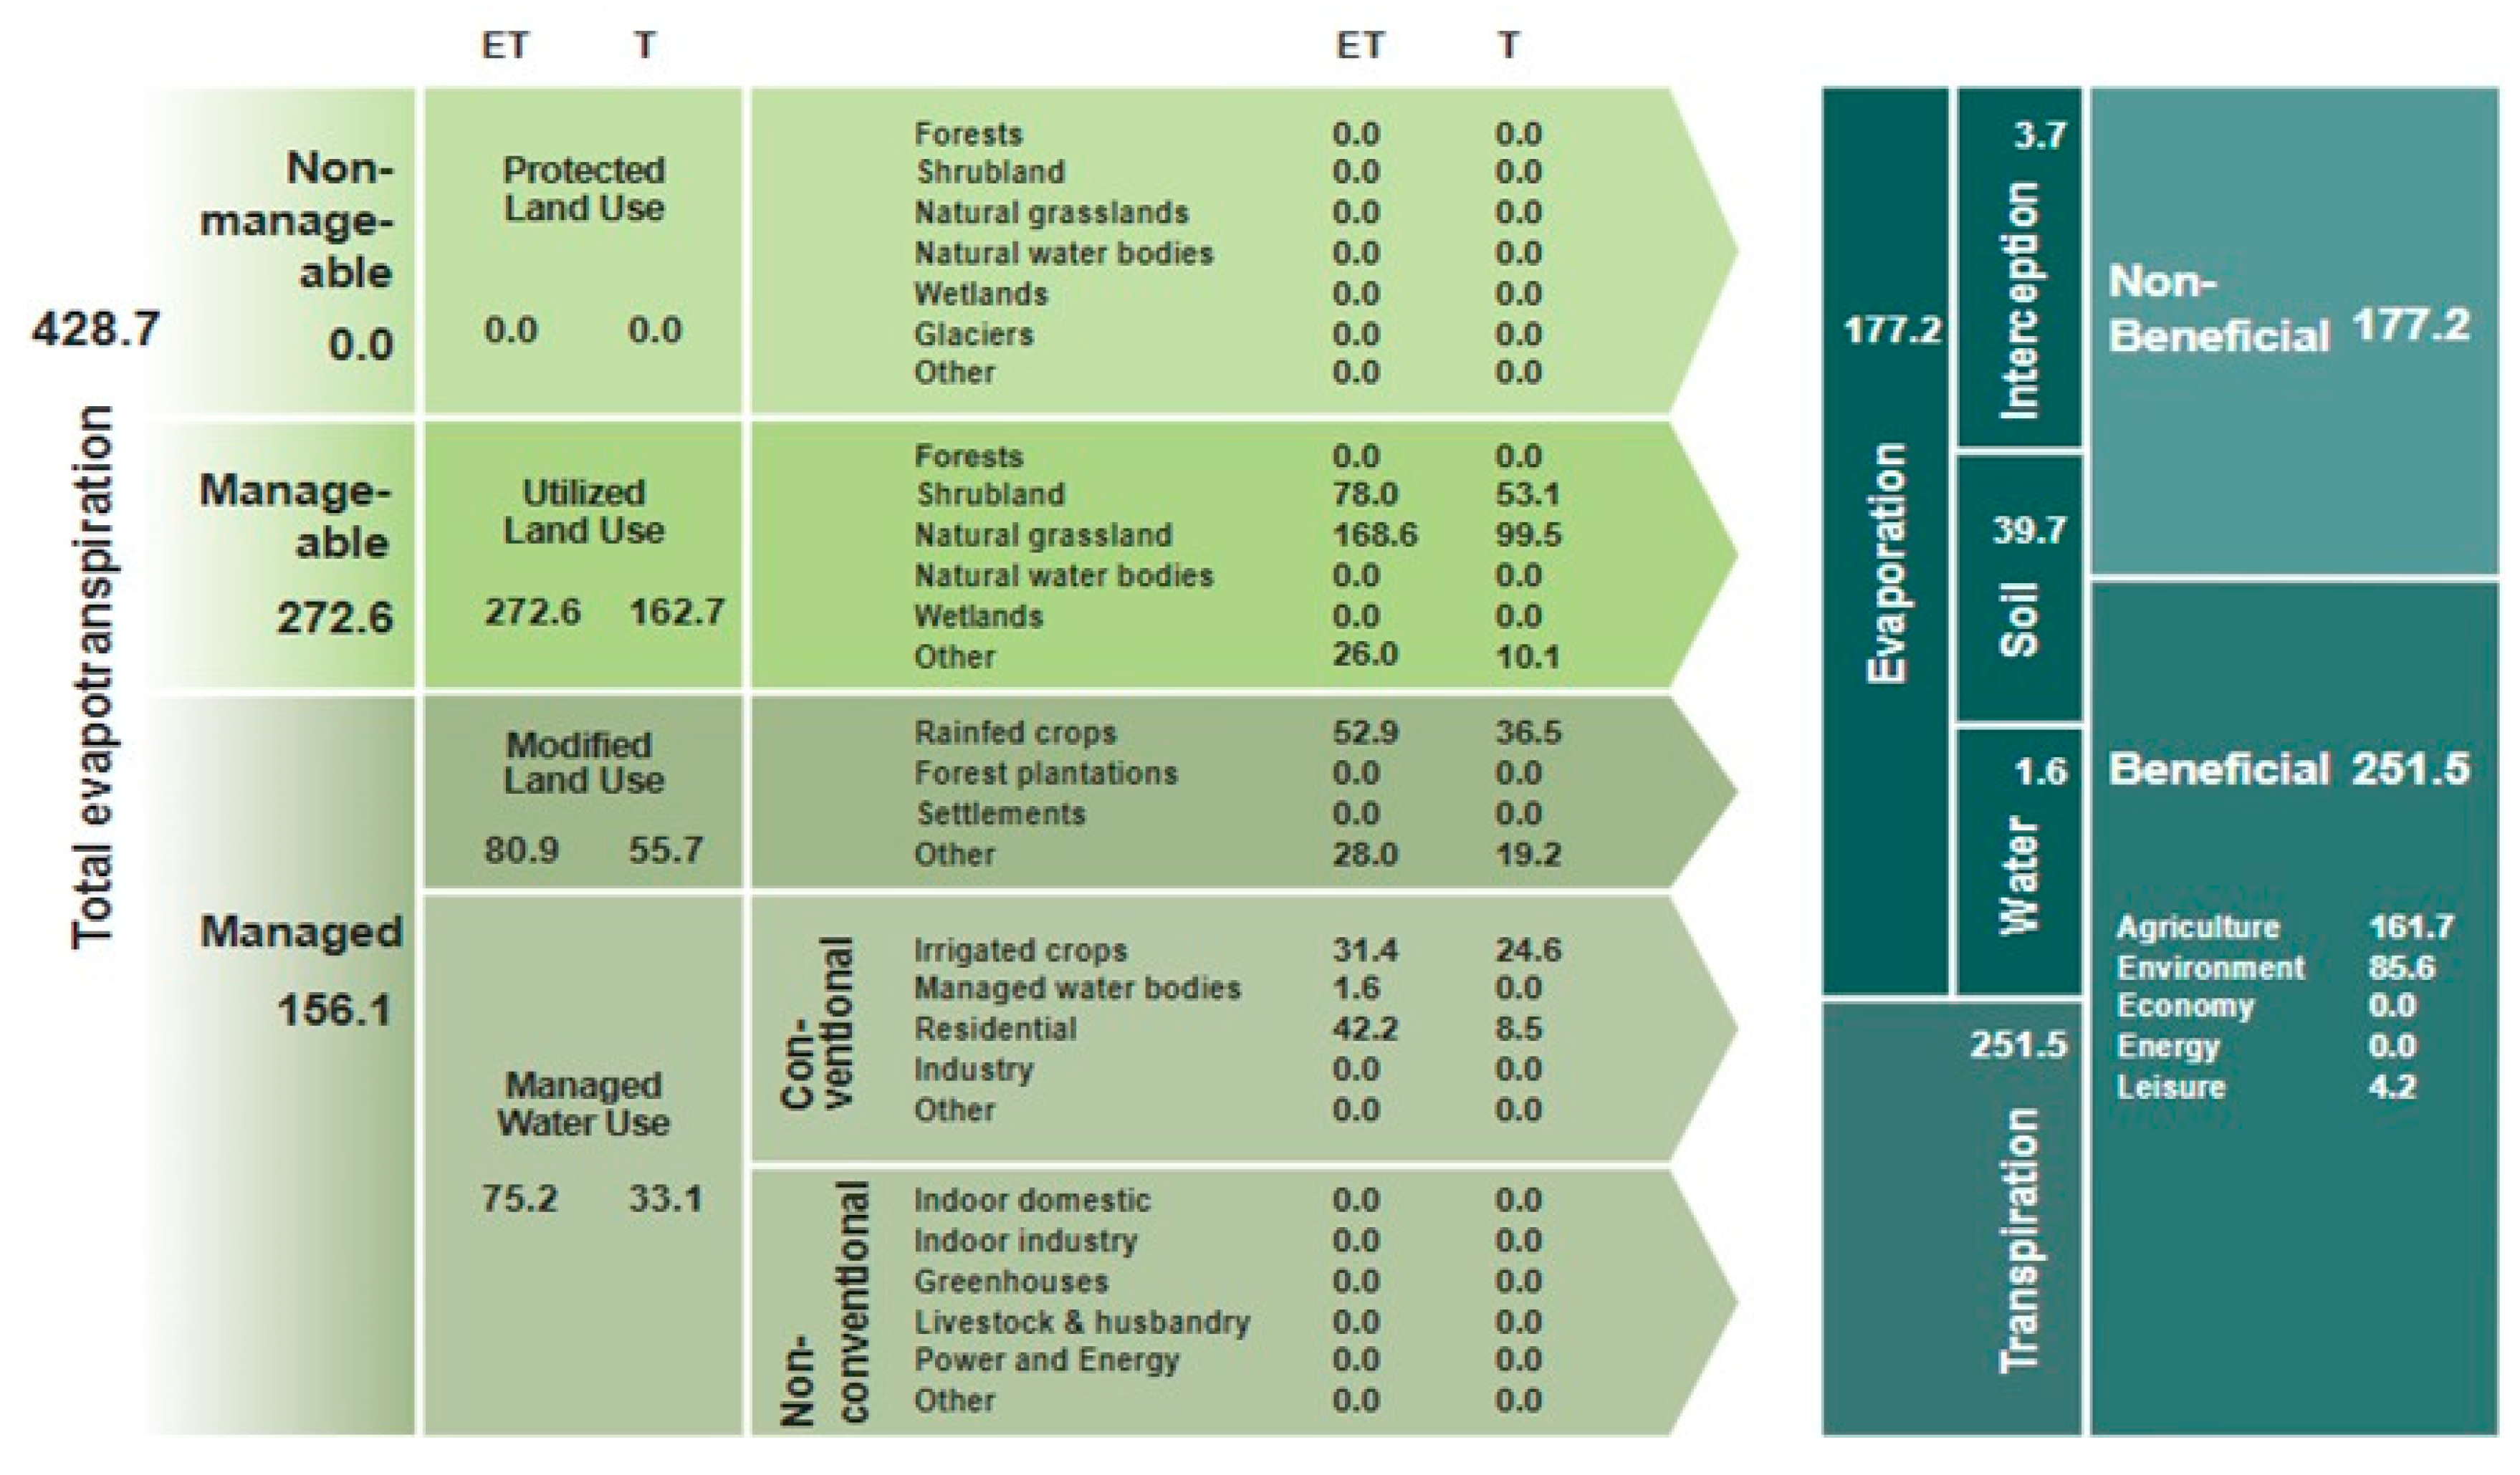
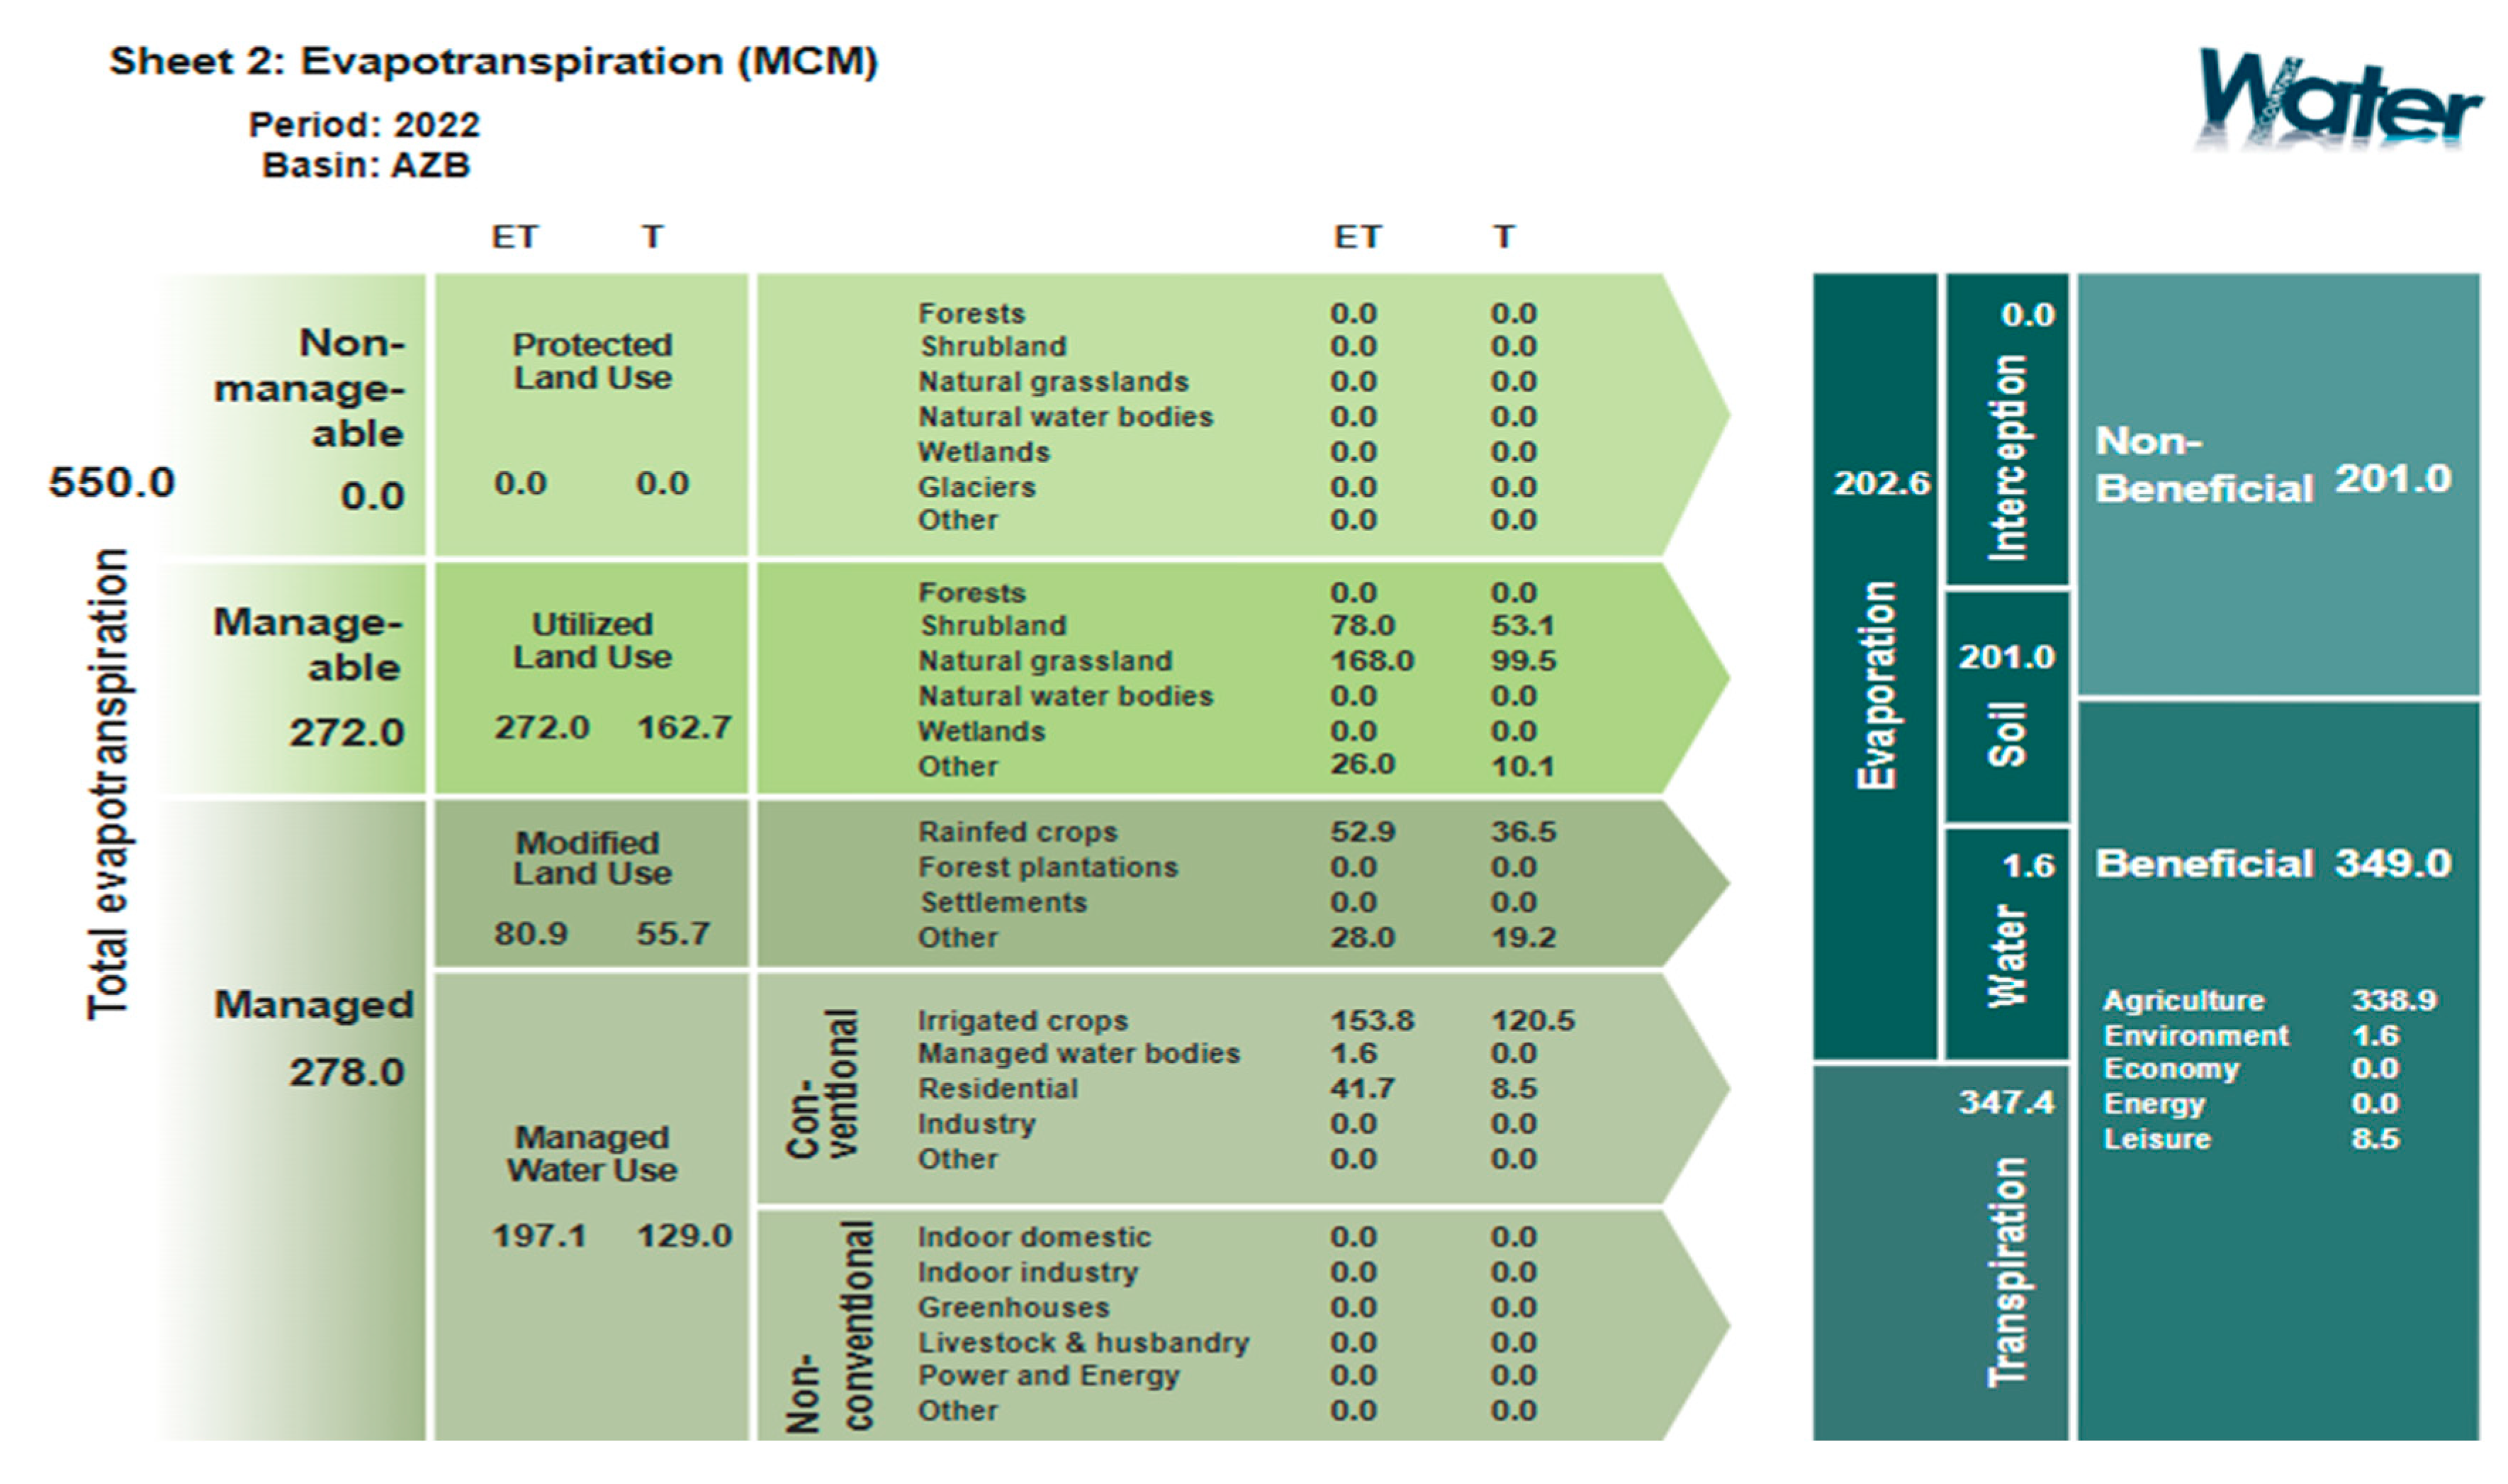
3.4. AWA Outputs
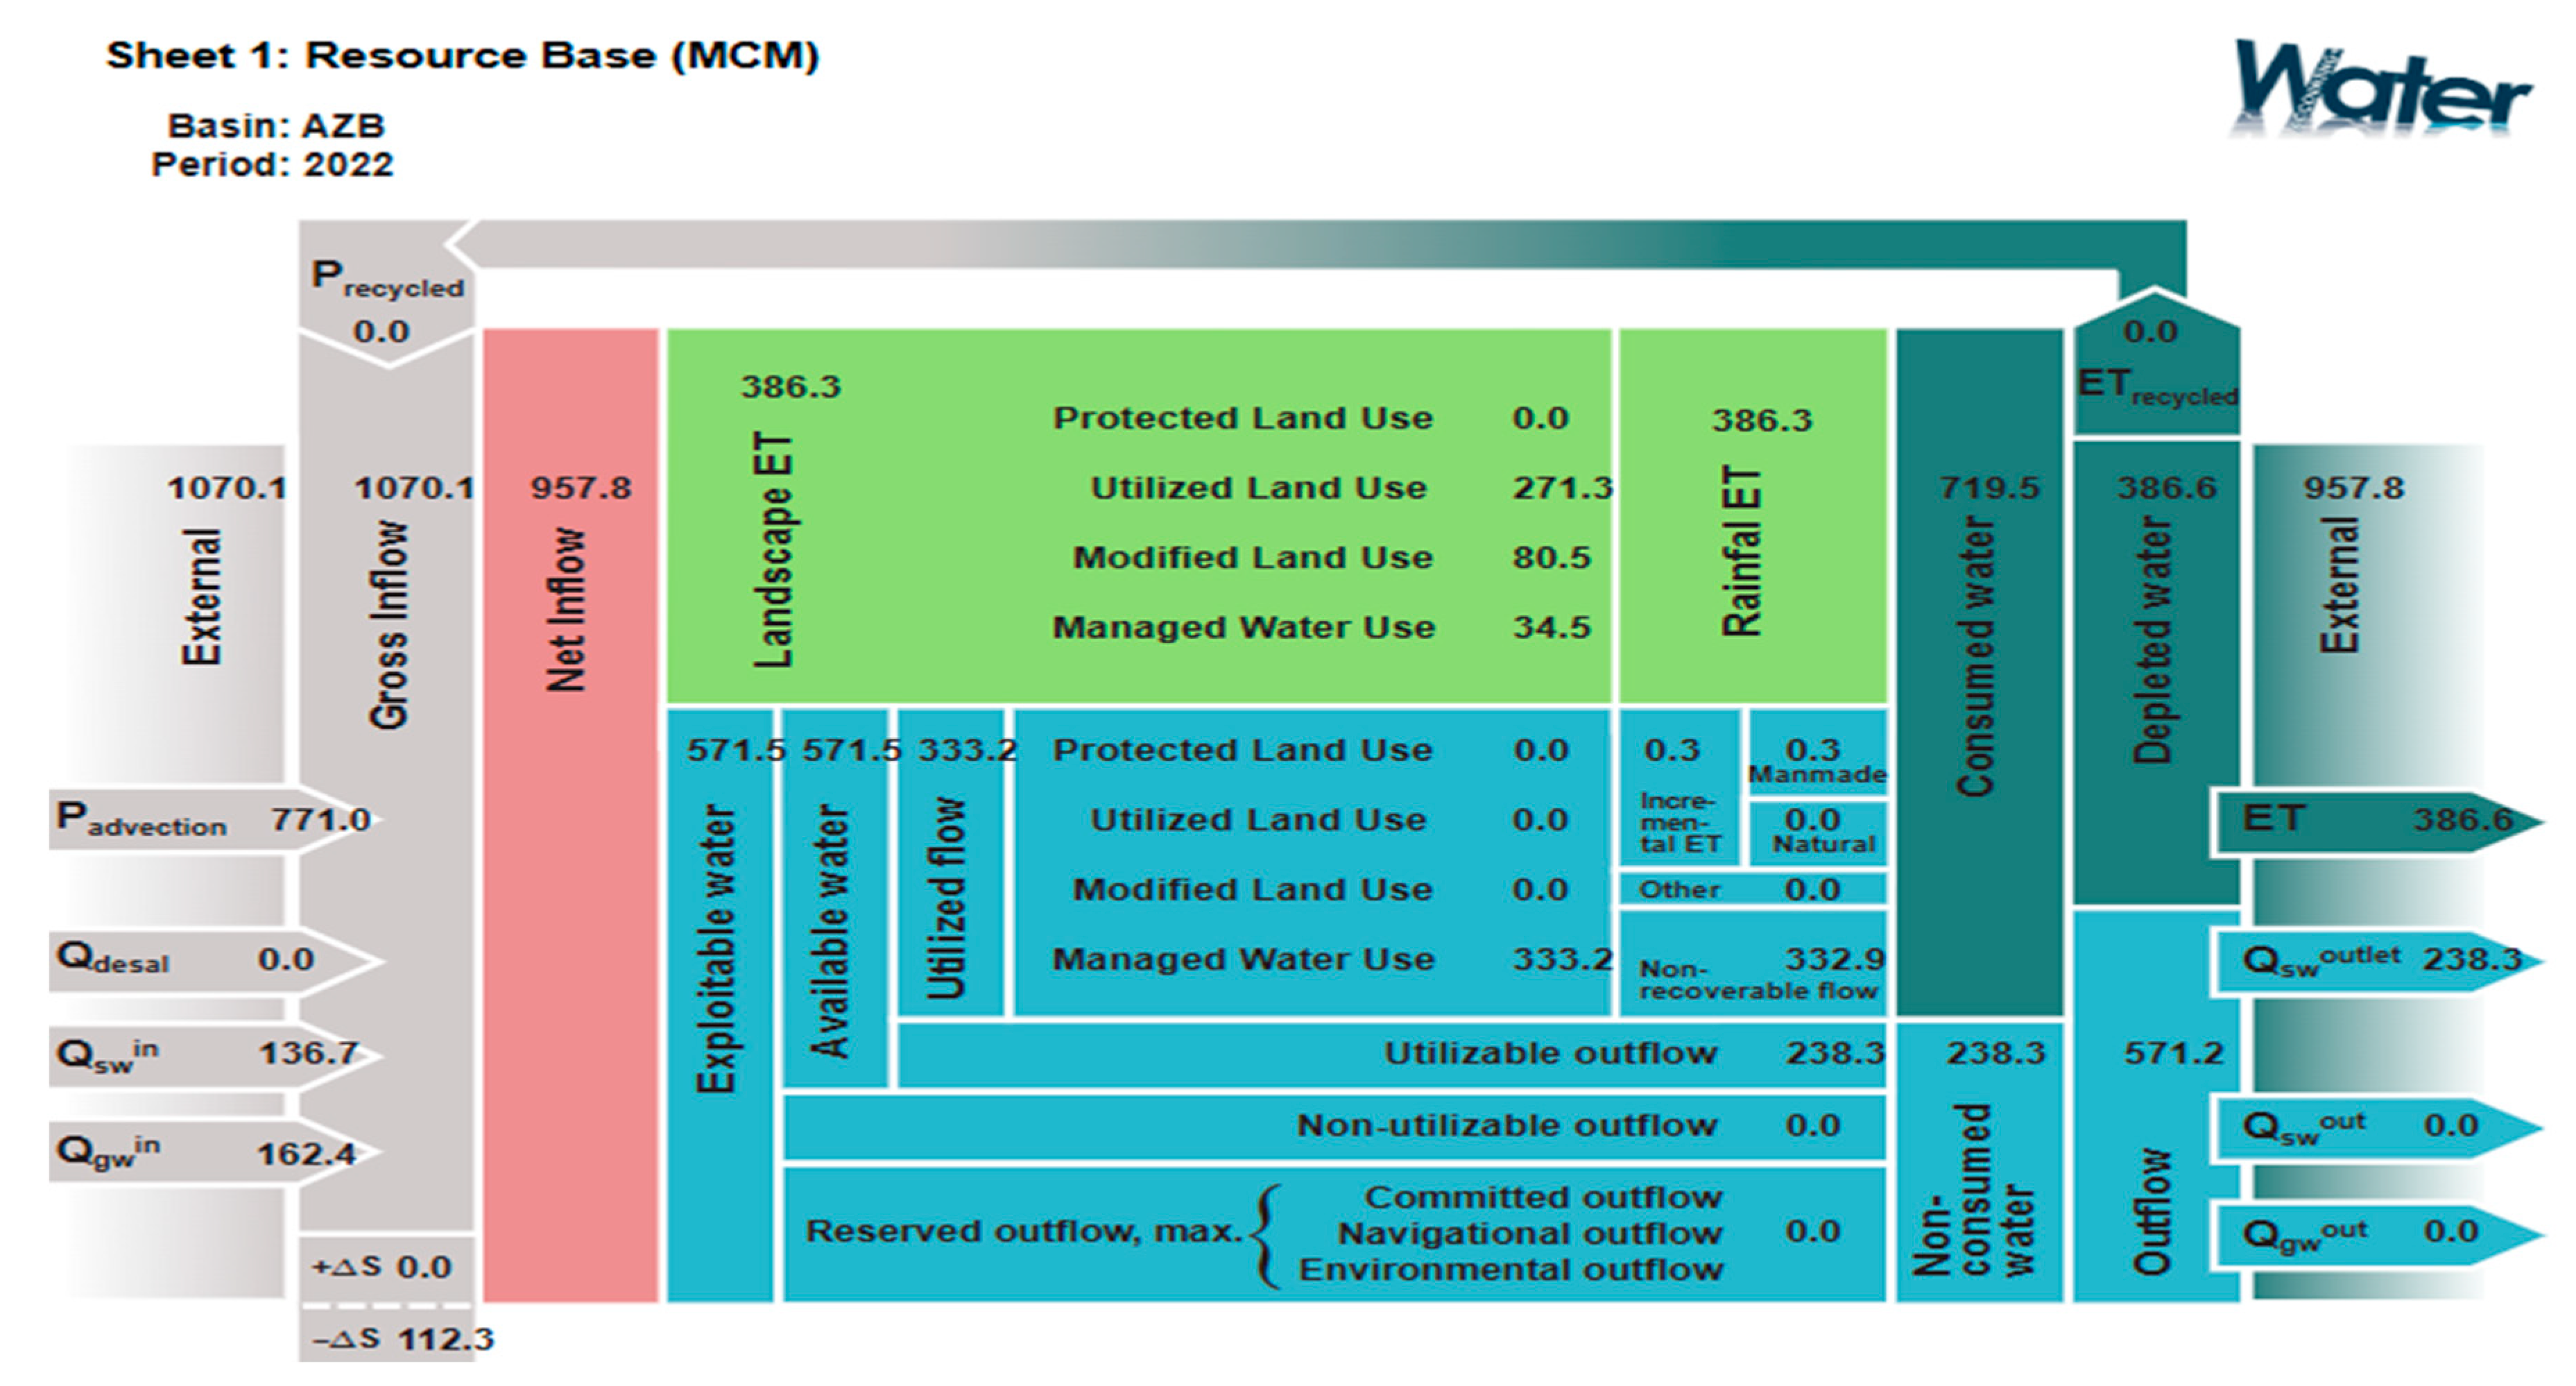
3.4.1. Resource Base Sheet
3.4.2. Evapotranspiration Sheet
4. Discussion
4.1. WaPOR Data Assessment
4.2. Remote Sensing Data and Water Accounting
5. Conclusions
Author Contributions
Funding
Data Availability Statement
Acknowledgments
Conflicts of Interest
References
- Duc, N.H.; Kumar, P.; Long, P.T.; Meraj, G.; Lan, P.P.; Almazroui, M.; Avtar, R. A Systematic Review of Water Governance in Asian Countries: Challenges, Frameworks, and Pathways Toward Sustainable Development Goals. Earth Syst. Environ. 2024, 8, 181–205. [Google Scholar] [CrossRef]
- Zou, H.; Wang, F.; Zeng, Z. Next-generation water-saving strategies for greenhouses using a nexus approach with modern technologies. Nat. Commun. 2025, 16, 2091. [Google Scholar] [CrossRef] [PubMed]
- Wada, Y.; Flörke, M.; Hanasaki, N.; Eisner, S.; Fischer, G.; Tramberend, S.; Satoh, Y.; van Vliet, M.T.H.; Yillia, P.; Ringler, C.; et al. Modelling global water use for the 21st century: The Water Futures and Solutions (WFaS) initiative and its approaches. Geosci. Model Dev. 2016, 9, 175–222. [Google Scholar] [CrossRef]
- Al-Omari, A.; Quraan, S.; Al-Salihi, A.; Abdulla, F. A Water Management Support System for Amman Zarqa Basin in Jordan. Water Resour. Manag. 2009, 23, 3165–3189. [Google Scholar] [CrossRef]
- Al-Bakri, J.; D’urso, G.; Calera, A.; Abdalhaq, E.; Altarawneh, M.; Margane, A. Remote sensing for agricultural water management in Jordan. Remote Sens. 2023, 15, 235. [Google Scholar] [CrossRef]
- MWI (Ministry of Water and Irrigation, Jordan). National Water Strategy 2023–2040 Summary; MWI: Amman, Jordan, 2023. Available online: https://www.mwi.gov.jo/EBV4.0/Root_Storage/AR/EB_Ticker/National_Water_Strategy_2023-2040_Summary-English_-ver2.pdf (accessed on 10 October 2024). (In Arabic)
- Al-Addous, M.; Bdour, M.; Alnaief, M.; Rabaia, S.; Schweimanns, N. Water Resources in Jordan: A Review of Current Challenges and Future Opportunities. Water 2023, 15, 3729. [Google Scholar] [CrossRef]
- Hlavaty, H. Water Management Initiative: Review of Water Scarcity Ranking Methodologies; A Report Prepared for Tetra Tech; USAID Water Management Initiative (WMI): Amman, Jordan, 2018. [Google Scholar]
- Loucks, D.; Van Beek, E. Water Resource Systems Planning and Management: An Introduction to Methods, Models, and Applications, 1st ed.; Springer: Cham, Switzerland, 2017. [Google Scholar]
- MWI (Ministry of Water and Irrigation). National Water Budget for Year 2014–2023; MWI: Amman, Jordan, 2023. Available online: https://www.mwi.gov.jo/Default/Ar (accessed on 25 August 2024). (In Arabic)
- Amdar, N.; Seyoum, S.; Al-Bakri, J.; Rutten, M.; Jewitt, G.; Mul, M. Developing a water budget for the Amman-Zarqa basin using water accounting plus and the pixel-based soil water balance model. Model Earth Syst. Environ. 2024, 10, 6997–7017. [Google Scholar] [CrossRef]
- Shilpakar, R.L.; Bastiaanssen, W.G.M.; Molden, D.J. A remote sensing-based approach for water accounting in the East Rapti River Basin, Nepal. Himal. J. Sci. 2011, 7, 15–30. [Google Scholar] [CrossRef]
- Al-Bakri, J.; D’Urso, G.; Batchelor, C.; Abukhalaf, M.; Alobeiaat, A.; Al-Khreisat, A.; Vallee, D. Remote Sensing-Based Agricultural Water Accounting for the North Jordan Valley. Water 2022, 14, 1198. [Google Scholar] [CrossRef]
- Batchelor, C.; Hoogeveen, J.; Faurès, J.; Peiser, L. Water Accounting and Auditing: A Sourcebook; FAO Water Report-43; FAO (Food and Agriculture Organization): Rome, Italy, 2016; p. 232. [Google Scholar]
- Abdelkader, M.; Al-Amoud, A.; El Alfy, M.; El-Feky, A.; Saber, M. Assessment of flash flood hazard based on morphometric aspects and rainfall-runoff modeling in Wadi Nisah, central Saudi Arabia. Remote Sens. Appl. Soc. Environ. 2021, 23, 100562. [Google Scholar] [CrossRef]
- Ghorbanpour, A.; Afshar, A.; Hessels, T.; Duan, Z. Water and productivity accounting using WA+ framework for sustainable water resources management: Case study of northwestern Iran. Phys. Chem. Earth Parts A/B/C 2022, 128, 103245. [Google Scholar] [CrossRef]
- Karimi, P.; Bastiaanssen, W.G.M.; Molden, D. Water accounting plus (WA+)—A water accounting procedure for complex river basins based on satellite measurements. Hydrol. Earth Syst. Sci. 2013, 17, 2459–2472. [Google Scholar] [CrossRef]
- Available online: https://www.wateraccounting.org/ (accessed on 5 July 2024).
- Dembélé, M.; Salvadore, E.; Zwart, S.; Ceperley, N.; Mariéthoz, G.; Schaefli, B. Water accounting under climate change in the transboundary Volta River Basin with a spatially calibrated hydrological model. J. Hydrol. 2023, 626, 130092. [Google Scholar] [CrossRef]
- Blatchford, M.; Mannaerts, C.; Njuki, S.; Nouri, H.; Zeng, Y.; Pelgrum, H.; Wonink, S.; Karimi, P. Evaluation of WaPOR V2 evapotranspiration products across Africa. Hydrol. Process 2020, 34, 3200–3221. [Google Scholar] [CrossRef]
- Liao, S.; Khan, A. Exploring Future Hybrid Accounting: A Review of Water Accounting and Management Research, Australasian Accounting. Bus. Financ. J. 2022, 16, 103–115. [Google Scholar] [CrossRef]
- Shammout, M.; Shatanawi, K.; Al-Bakri, J.; Abualhaija, M. Impact of Land Use/Cover Changes on the Flow of the Zarqa River in Jordan. J. Ecol. Eng. 2021, 22, 40–50. [Google Scholar] [CrossRef] [PubMed]
- FAO. WaPOR Database Methodology: Version 2 Release; FAO: Rome, Italy, 2020; p. 90. [Google Scholar] [CrossRef]
- Cheema, M.; Bastiaanssen, W. Local calibration of remotely sensed rainfall from the TRMM satellite for different periods and spatial scales in the Indus Basin. Int. J. Remote Sens. 2011, 33, 2603–2627. [Google Scholar] [CrossRef]
- Karimi, P.; Bastiaanssen, W.; Molden, D.; Cheema, M. Basin-wide water accounting based on remote sensing data: An application for the Indus Basin. Hydrol. Earth Syst. Sci. 2013, 17, 2473–2486. [Google Scholar] [CrossRef]
- Singh, V.; Singh, S.; Kumar, N.; Kumar, P.; Gupta, P.; Singh, P.; Gašparović, M.; Ray, R.; Saito, O. Water Accounting Using Satellite Products and Water Accounting Plus Framework in a Semi-Arid Betwa River Basin, India. Water 2022, 14, 3473. [Google Scholar] [CrossRef]
- Al-Bakri, J.T.; Shawash, S.; Ghanim, A.; Abdelkhaleq, R. Geospatial Techniques for Improved Water Management in Jordan. Water 2016, 8, 132. [Google Scholar] [CrossRef]
- Zhang, Y.; Kong, D.; Gan, R.; Chiew, F.H.; McVicar, T.R.; Zhang, Q.; Yang, Y. Coupled estimation of 500 m and 8-day resolution global evapotranspiration and gross primary production in 2002–2017. Remote Sens. Environ. 2019, 222, 165–182. [Google Scholar] [CrossRef]
- Allen, R.; Pereira, L.; Raes, D.; Smith, M. FAO Irrigation and Drainage Paper No. 56—Crop Evapotranspiration; FAO: Rome, Italy, 1998. [Google Scholar]
- Zanaga, D.; Van De Kerchove, R.; Daems, D.; De Keersmaecker, W.; Brockmann, C.; Kirches, G.; Wevers, J.; Cartus, O.; Santoro, M.; Fritz, S.; et al. ESA WorldCover 10 m 2021 v200. 2022. Available online: https://zenodo.org/records/7254221 (accessed on 29 June 2025).
- Congalton, R.G. A review of assessing the accuracy of classifications of remotely sensed data. Remote Sens. Environ. 1991, 37, 35–46. [Google Scholar] [CrossRef]
- Bastiaanssen, W.; Karimi, P.; Rebelo, L.; Duan, Z.; Senay, G.; Muthuwatte, L.; Smakhtin, V. Earth observation-based assessment of the water production and water consumption of Nile Basin agro-ecosystems. Remote Sens. 2014, 6, 10306–10334. [Google Scholar] [CrossRef]
- FAO; IHE Delft. Water Accounting in the Jordan River Basin; FAO WaPOR Water Accounting Reports; FAO: Rome, Italy, 2020. [Google Scholar]
- Abo Romman, Z.; Al-Bakri, J.; Al Kuisi, M. Comparison of methods for filling in gaps in monthly rainfall series in arid regions. Int. J. Climatol. 2021, 41, 6674–6689. [Google Scholar] [CrossRef]
- Al-Kilani, M.R.; Rahbeh, M.; Al-Bakri, J.; Tadesse, T.; Knutson, C. Evaluation of Remotely Sensed Precipitation Estimate from the NASAPOWER Project for Drought Detection over Jordan. Earth Syst. Environ. 2021, 5, 561–573. [Google Scholar] [CrossRef]
- Karimi, P.; Bastiaanssen, W.G.M. Spatial evapotranspiration, rainfall and land use data in water accounting—Part 1: Review of the accuracy of the remote sensing data. Hydrol. Earth Syst. Sci. 2015, 19, 507–532. [Google Scholar] [CrossRef]
- Ta’ani, R. Development of a National Information System-Jordan, A Data Management Report on Development, Installation, Testing and Commissioning of the MWI-WIS; EU-ENPI Project 2015/366-808; MWI: Amman, Jordan, 2017. [Google Scholar]
- Sun, Q.; Miao, C.; Duan, Q.; Ashouri, H.; Sorooshian, S.; Hsu, K.-L. A review of global precipitation data sets: Data sources, estimation, and inter-comparisons. Rev. Geophys. 2018, 56, 79–107. [Google Scholar] [CrossRef]
- Tiruye, A.; Ditthakit, P.; Quoc, B.; Wipulanusat, W.; Weesakul, U.; Thongkao, S. Assessing Water Consumption Pattern and Delivery Irrigation Performance Indicators Using the WaPOR Portal under Data-Limited Conditions, Ethiopia. Eng. Sci. 2024, 28, 1046. [Google Scholar] [CrossRef]
- Al-Kilani, M.R.; Al-Bakri, J.; Rahbeh, M.; Knutson, C.; Tadesse, T.; Abdelal, Q. Agricultural drought assessment in data-limited arid regions using open-source remotely sensed data: A case study from Jordan. Theor. Appl. Climatol. 2025, 156, 89. [Google Scholar] [CrossRef]
- Tiruye, A.; Ditthakit, P.; Thongkao, S.; Wipulanusat, W.; Weesakul, U. Comparing WaPOR and ERA5-Land: Innovative Estimations of Precipitation and Evapotranspiration in the Tana Basin, Ethiopia. Earth Syst. Environ. 2024, 8, 1225–1246. [Google Scholar] [CrossRef]
- FAO; IHE Delft. Water Accounting in the Awash River Basin; FAO WaPOR Water Accounting Reports; FAO: Rome, Italy, 2020. [Google Scholar]


| Dataset Name | Source | Spatial Resolution | Temporal Resolution | Data Series |
|---|---|---|---|---|
| PERSIANN | CHRS at University of California. https://chrsdata.eng.uci.edu/ (accessed on 20 December 2024). | 25 km | Daily | 2000–onwards |
| CHIRPS | Developed by the Climate Hazards Group at UC Santa Barbara https://www.chc.ucsb.edu/data/chirps (accessed on 10 August 2024). | 5 km | Daily | 1981–onwards |
| TRMM 3B43V7 | NASA and JAXA https://disc.gsfc.nasa.gov/datasets/TRMM_3B43_7/summary?keywords=TRMM_3B43_7 (accessed on 4 December 2024). | 25 km | Daily | January 1998–December 2019 |
| Dataset Name | Source | Spatial Resolution | Temporal Resolution | Data Series |
|---|---|---|---|---|
| GLDAS | NASA GESDISC | 25 km | Daily | 1 January 2000–11 January 2024 |
| MODIS16A2 | NASA’s MODIS sensor on Terra and Aqua satellites | 500 m | 8-day | 1 January 2001–2 January 202 |
| Penman Monteith-Leuning V2 | Based on work by Zhang et al. [28] (CSIRO, Canberra, Australia) | 500 m | Daily | 2 January 2000–11 January 2020 |
| SMAP | NASA SMAP mission | 9 km | 3 hourly, daily | 3 January 2015–11 January 2024 |
| TerraClimate | University of Idaho | 4 km | Monthly | 1 January 1958–11 January 2023 |
| Indicator | Description | Formula |
|---|---|---|
| ET Fraction % | Indicates which portion of the total inflow of water is consumed and which part is converted into renewable resources. A value higher than 100% indicates over-exploitation or a dependency on external resources. | |
| Stationarity Index % | It is an indication of the depletion of water resources. Positive values indicate that water is added to the groundwater and/or surface water storage. Negative values indicate depletion of the storage. | |
| Basin Closure % | Defines the percentage of total available water resources that were consumed and/or stored within the basin. A value of 100% indicates that all available water is consumed and/or stored in the basin. | |
| Available Water | The total amount of water that is available to be managed. | =exploitable water − ΔS |
| Managed Water | Total amount of water that was abstracted for managed water use. | =Incremental ET of MWU |
| Managed Fraction % | Percentage of water that was managed from the total amount of water that is available. | |
| Transpiration fraction | The part of ET that was transpired by plants, which is a biophysical process. | |
| Beneficial fraction | Relates beneficial E and T to the total ET in a basin. | |
| Agricultural ET fraction | The fraction of ET from agricultural activities. | |
| Irrigated ET fraction | Irrigated ET fraction describes the portion of agricultural ET that is related to irrigated agriculture. |
| Reference | |||||||||||||
|---|---|---|---|---|---|---|---|---|---|---|---|---|---|
| Zone | 30 | 41 | 42 | 50 | 60 | 80 | 126 | Total | |||||
| WaPOR | Grassland | 30 | 65,283 | 12,669 | 2250 | 5455 | 17,086 | 143 | 5699 | 108,585 | |||
| Cropland—rainfed | 41 | 11,831 | 24,025 | 10,855 | 4297 | 16,794 | 102 | 60 | 67,964 | ||||
| Cropland—irrigated | 42 | 59 | 336 | 3397 | 26 | 99 | 4 | 3 | 3924 | ||||
| Urban | 50 | 660 | 933 | 137 | 23,006 | 2752 | 1 | 93 | 27,582 | ||||
| Bare/sparsely vegetated | 60 | 3750 | 7385 | 4288 | 6140 | 114,539 | 76 | 0 | 136,178 | ||||
| Water | 80 | 7 | 3 | 0 | 0 | 1 | 135 | 0 | 146 | ||||
| Tree cover | 126 | 366 | 712 | 320 | 83 | 162 | 2 | 1872 | 3517 | ||||
| Total | 81,956 | 46,063 | 21,247 | 39,007 | 151,433 | 463 | 7727 | 347,896 | |||||
| Producer accuracy | 79.6 | 52.3 | 15.9 | 59 | 75.6 | 29.1 | 24.2 | ||||||
| User Accuracy | 60.1 | 35.3 | 86.6 | 83.4 | 84.1 | 92.5 | 53.2 | ||||||
| Kappa hat | 0.48 | 0.25 | 0.86 | 0.81 | 0.72 | 0.92 | 0.52 | ||||||
| Overall accuracy % | 66.74 | Kappa hat classification% | 0.54 | ||||||||||
| Dataset | Pearson r | 95% Confidence Interval | RMSE | MAE |
|---|---|---|---|---|
| Rainfall records—JMD | 0.95 | [0.89, 0.99] | 97.5 | 73.4 |
| Rainfall records—MWI | 0.74 | [0.18, 0.88] | 127.2 | 96.2 |
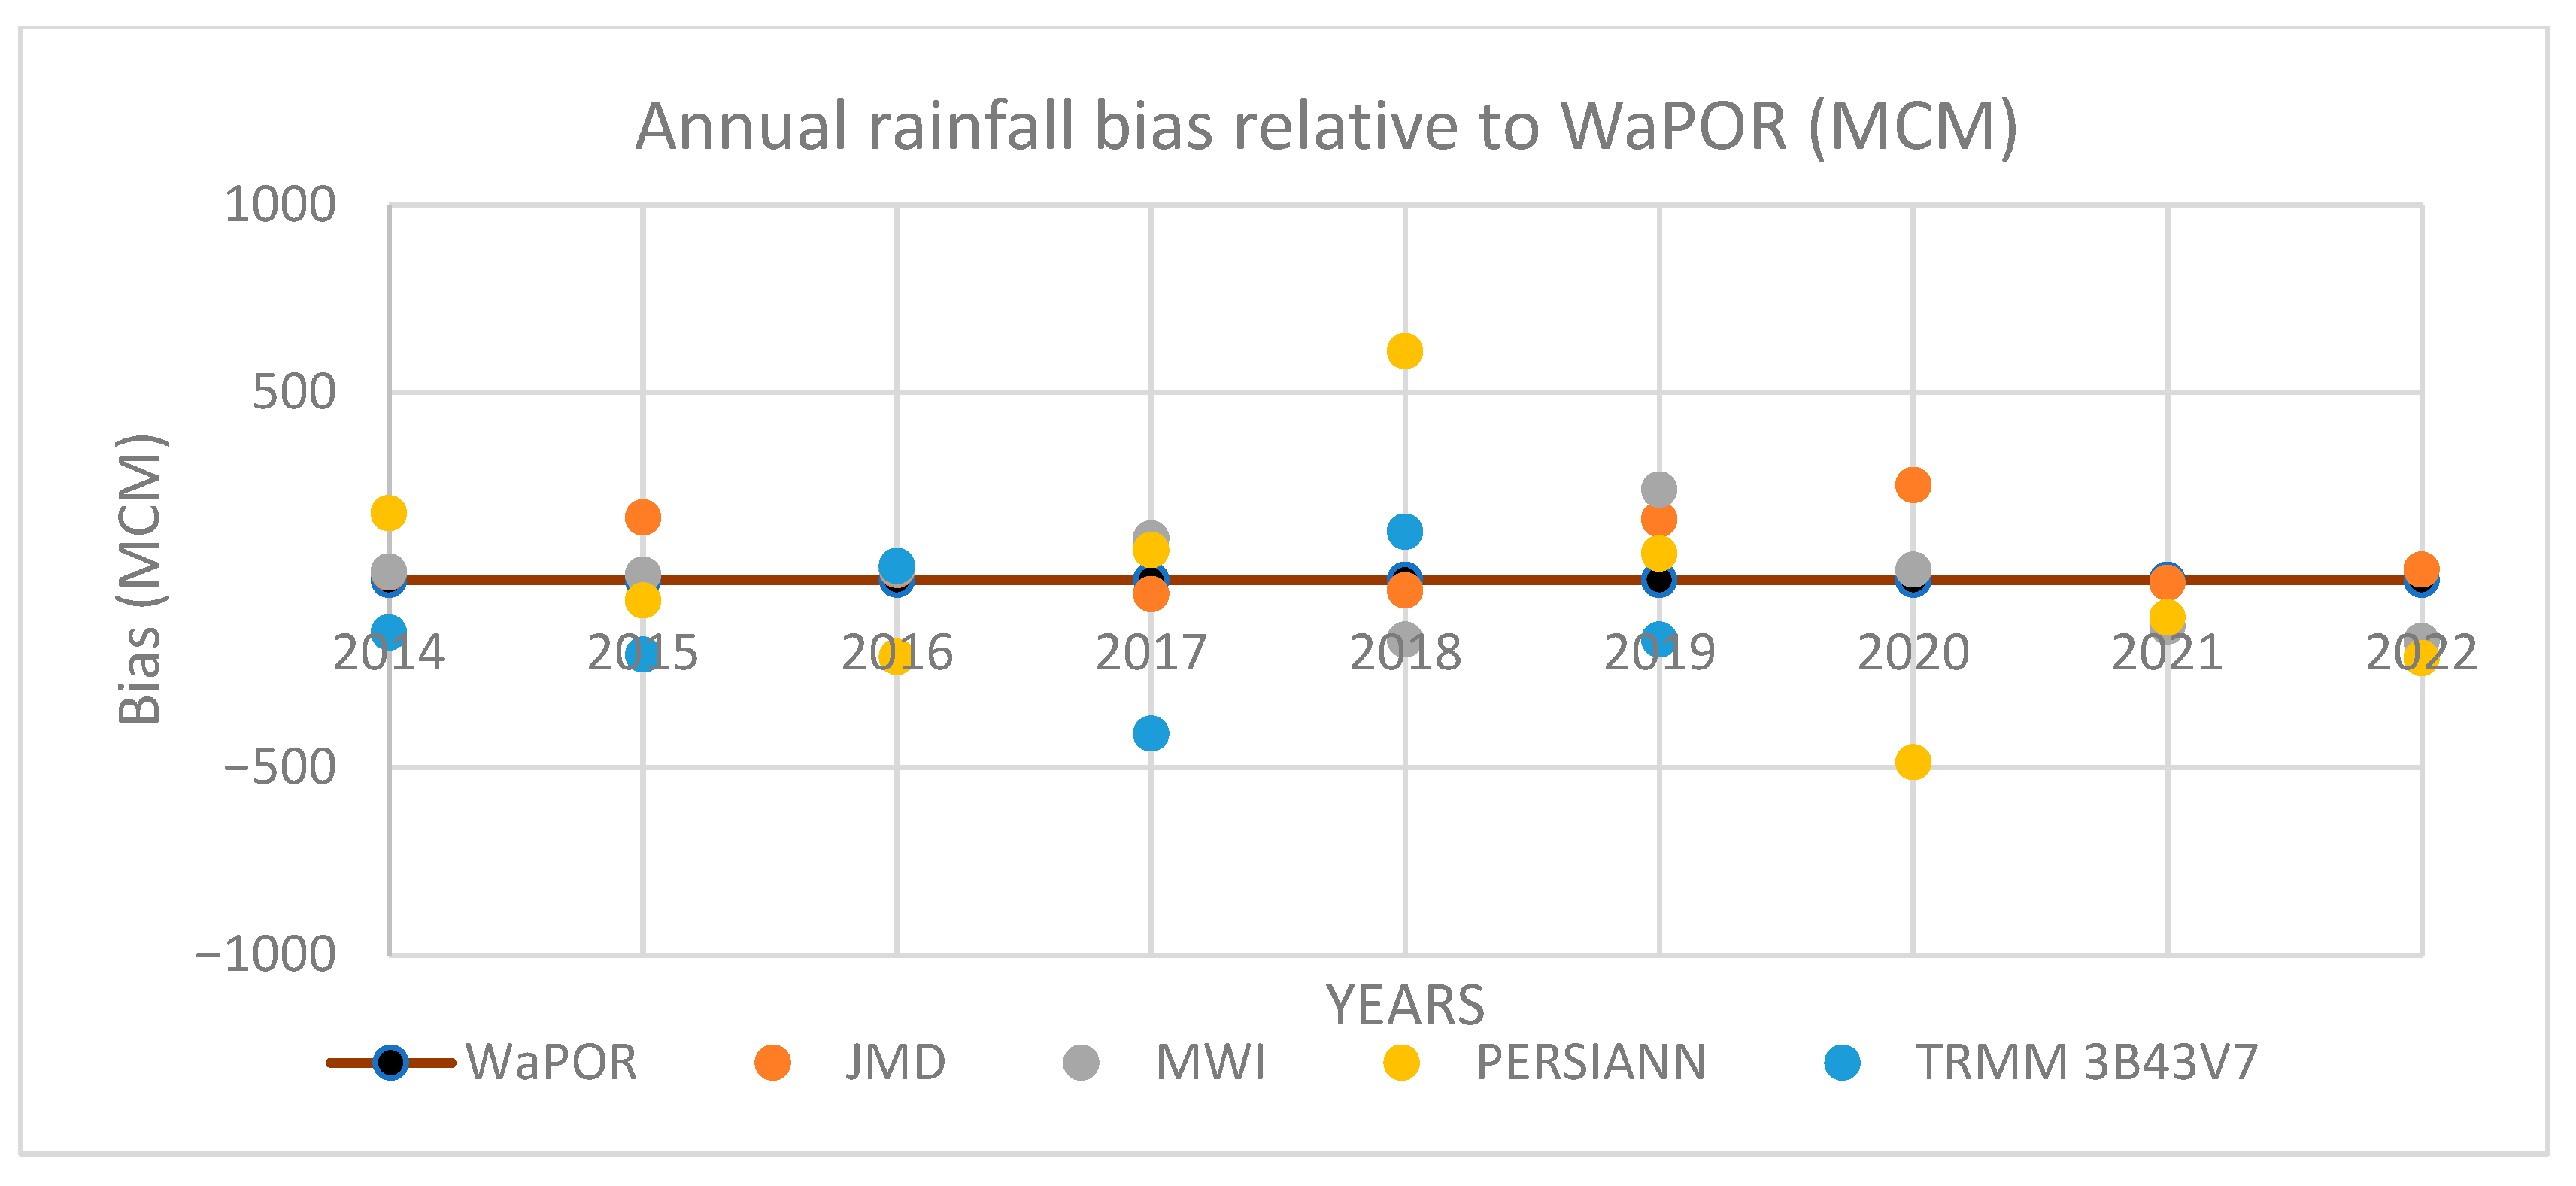
| PERSIANN | 0.12 | [−0.53, 0.17] | 276.9 | 199.6 |
| TRMM | 0.36 | [0.28, 0.88] | 212.3 | 179.0 |
| Outflow | 2014 | 2015 | 2016 | 2017 | 2018 | 2019 | 2020 | 2021 | 2022 |
|---|---|---|---|---|---|---|---|---|---|
| ET—MWU | 50.5 | 54.7 | 51.8 | 55.9 | 67.2 | 74.6 | 87.8 | 75.3 | 74.9 |
| ET—Irrigated area | 19.5 | 22.5 | 21.7 | 23.3 | 26.0 | 29.7 | 37.6 | 31.4 | 31.4 |
| ET—ULU | 165.4 | 229.6 | 179.2 | 190.9 | 233.3 | 320.6 | 362.8 | 265.5 | 271.3 |
| ET—MLU | 50.7 | 81.5 | 54.3 | 59.4 | 71.4 | 98.0 | 127.6 | 74.3 | 80.5 |
| SWout—KTD | 124.1 | 131.5 | 132.4 | 141.8 | 130.0 | 147.7 | 169.1 | 139.3 | 133.8 |
| Dataset Source | Pearson (r) | 95% Confidence Interval | RMSE | MAE |
|---|---|---|---|---|
| FAO56PM_ET | 0.94 | [0.71, 0.98] | 26.8 | 35.2 |
| Water Budget | 0.40 | [−0.17, 0.85] | 282.5 | 315.5 |
| ET_GLDAS | 0.37 | [−0.09, 0.89] | 185.6 | 226.7 |
| ET_MODIS_500M | 0.87 | [0.54, 0.95] | 267.6 | 272.0 |
| ET_PM_Leuning | 0.56 | [0.35, 0.99] | 256.7 | 274.7 |
| ET_SMAP | 0.53 | [−0.12, 0.99] | 300.2 | 318.8 |
| ET_TerraClimate | 0.66 | [0.38, 0.99] | 294.5 | 321.3 |
| Fluxes | Min. | Max. | Average | Equation or Flux Source |
|---|---|---|---|---|
| Precipitation (P) | 630.6 | 912.4 | 759.9 | Obtained from WaPOR |
| Qsw in | 115.8 | 1309 | 268.4 | Surface water in the inlet of KTD includes TWW and inflow from Zarqa River |
| Qgw in | 159.4 | 177.8 | 165.9 | Groundwater is pumped for all sectors |
| Change in storage ΔS | −204 | −75 | −119.6 | Storage and outflow in KTD |
| Gross inflow | 927.5 | 1228.4 | 1063.4 | =P+ Qsw in + Qgw in |
| Net inflow | 762.1 | 1061.3 | 943.8 | =gross inflow ± ΔS |
| Landscape ET (ET green) | 219.4 | 498.5 | 330.0 | =total ET -MWU |
| Exploitable water | 411.9 | 728.8 | 613.7 | =Net inflow—Landscape ET |
| Utilized flow (MWU blue) | 47.1 | 79.7 | 59.9 | =Total ET MWU—ET MWU green |
| Available water | 411.9 | 728.8 | 613.7 | =Exploitable water—reserved outflow |
| Consumed water | 266.6 | 578.2 | 389.9 | =total ET (WaPOR) |
| Resource Base Sheet | Evapotranspiration Sheet | |||||||
|---|---|---|---|---|---|---|---|---|
| Year | ET Fraction | Basin Closure | Managed Water MCM | Managed Fraction | Transpiration Fraction | Beneficial Fraction | Agricultural ET Fraction | Irrigated ET Fraction |
| 2014 | 28.5 | 7.4 | 47.2 | 17.7 | 55.3 | 55.3 | 36.1 | 7.3 |
| 2015 | 32.6 | 6.9 | 49.6 | 13.6 | 58.5 | 58.5 | 38.8 | 6.2 |
| 2016 | 27.3 | 6.5 | 47.1 | 16.5 | 57.6 | 57.6 | 37.7 | 7.6 |
| 2017 | 30.5 | 8.9 | 51.8 | 16.9 | 54.0 | 53.9 | 35.8 | 7.6 |
| 2018 | 34.5 | 8.9 | 60.8 | 16.4 | 44.7 | 44.7 | 29.5 | 7.0 |
| 2019 | 42.5 | 10.9 | 69.6 | 14.1 | 56.6 | 56.6 | 36.5 | 6.0 |
| 2020 | 47.1 | 15.2 | 79.7 | 13.8 | 60.4 | 60.4 | 39.8 | 6.5 |
| 2021 | 44.8 | 15.8 | 64.9 | 15.6 | 60.8 | 60.8 | 38.7 | 7.6 |
| 2022 | 39.9 | 11.4 | 68.0 | 15.9 | 58.7 | 58.9 | 37.7 | 7.3 |
| Average | 36.4 | 10.2 | 59.9 | 15.6 | 56.3 | 56.3 | 36.7 | 7.0 |
| 2022 Corrected | 67.2 | 58 | 333.2 | 46.3 | 63.7 | 63.5 | 62.0 | 28.0 |
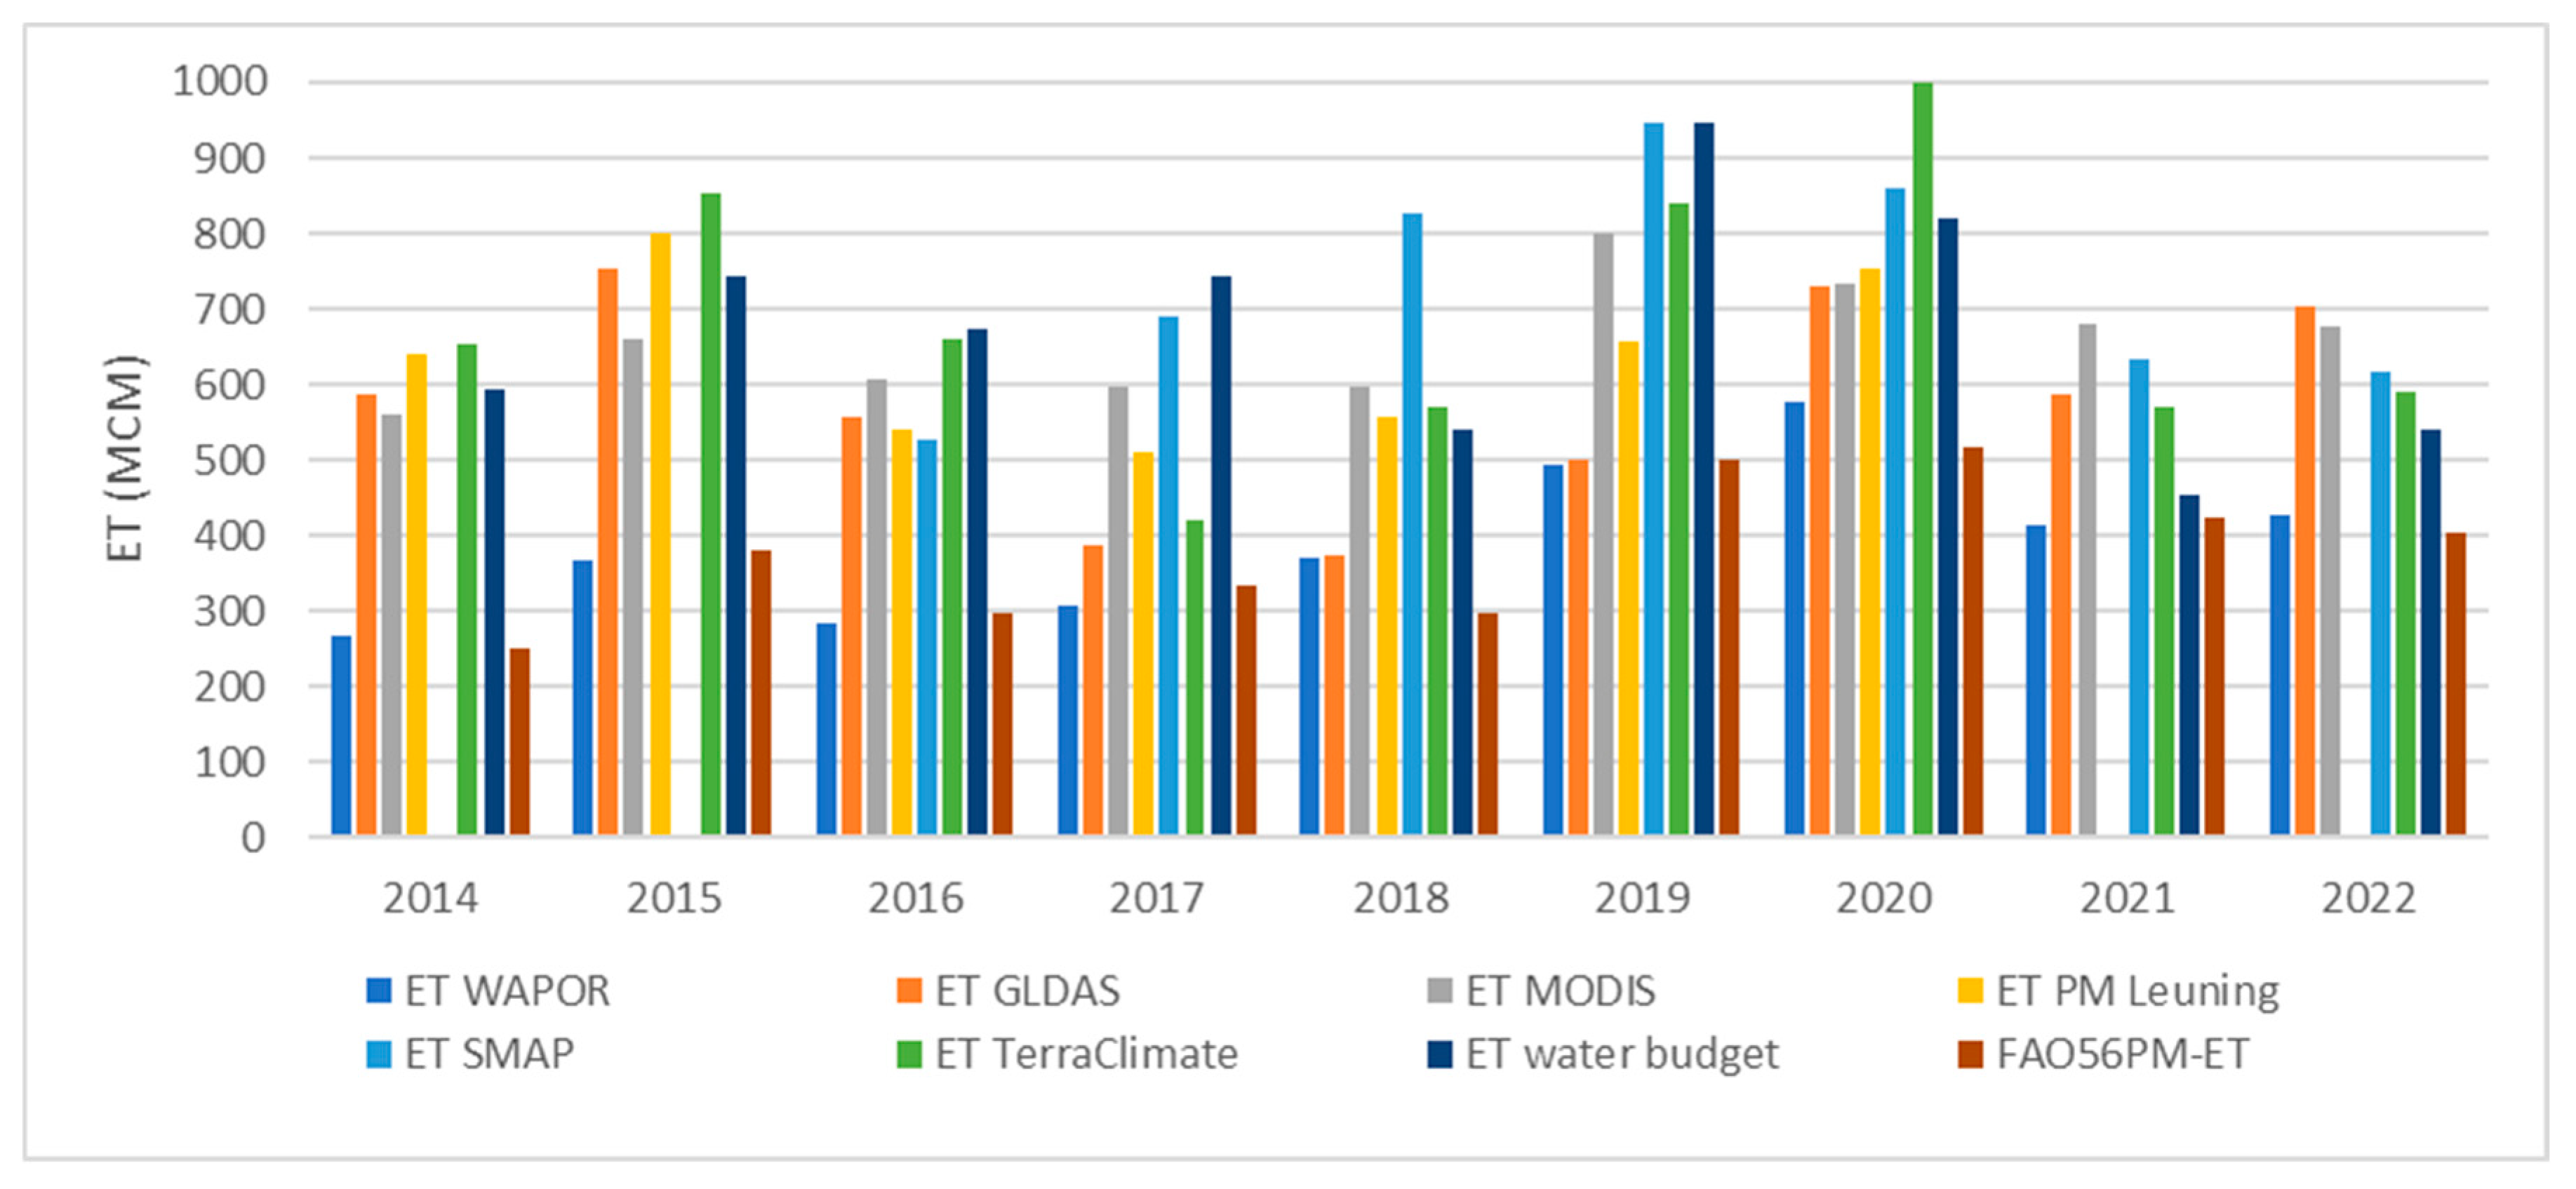
| ET Sheet | 2014 | 2015 | 2016 | 2017 | 2018 | 2019 | 2020 | 2021 | 2022 |
|---|---|---|---|---|---|---|---|---|---|
| Total ET | 267 | 366 | 285 | 306 | 372 | 493 | 578 | 415 | 429 |
| Manageable | 165 | 230 | 179 | 191 | 233 | 321 | 363 | 265 | 273 |
| Managed | 101 | 136 | 106 | 115 | 139 | 173 | 215 | 150 | 156 |
| Non-Beneficial | 119 | 152 | 121 | 141 | 206 | 214 | 229 | 163 | 177 |
| Beneficial | 148 | 214 | 164 | 165 | 166 | 279 | 349 | 252 | 252 |
Disclaimer/Publisher’s Note: The statements, opinions and data contained in all publications are solely those of the individual author(s) and contributor(s) and not of MDPI and/or the editor(s). MDPI and/or the editor(s) disclaim responsibility for any injury to people or property resulting from any ideas, methods, instructions or products referred to in the content. |
© 2025 by the authors. Licensee MDPI, Basel, Switzerland. This article is an open access article distributed under the terms and conditions of the Creative Commons Attribution (CC BY) license (https://creativecommons.org/licenses/by/4.0/).
Share and Cite
Al-Omoush, R.A.; Al-Bakri, J.T.; Abdelal, Q.; Al-Kilani, M.R.; Hamdan, I.; Aljarrah, A. Developing a Remote Sensing-Based Approach for Agriculture Water Accounting in the Amman–Zarqa Basin. Water 2025, 17, 2106. https://doi.org/10.3390/w17142106
Al-Omoush RA, Al-Bakri JT, Abdelal Q, Al-Kilani MR, Hamdan I, Aljarrah A. Developing a Remote Sensing-Based Approach for Agriculture Water Accounting in the Amman–Zarqa Basin. Water. 2025; 17(14):2106. https://doi.org/10.3390/w17142106
Chicago/Turabian StyleAl-Omoush, Raya A., Jawad T. Al-Bakri, Qasem Abdelal, Muhammad Rasool Al-Kilani, Ibraheem Hamdan, and Alia Aljarrah. 2025. "Developing a Remote Sensing-Based Approach for Agriculture Water Accounting in the Amman–Zarqa Basin" Water 17, no. 14: 2106. https://doi.org/10.3390/w17142106
APA StyleAl-Omoush, R. A., Al-Bakri, J. T., Abdelal, Q., Al-Kilani, M. R., Hamdan, I., & Aljarrah, A. (2025). Developing a Remote Sensing-Based Approach for Agriculture Water Accounting in the Amman–Zarqa Basin. Water, 17(14), 2106. https://doi.org/10.3390/w17142106