Article

Tracing Sulfate Sources of Surface Water and Groundwater in Liuyang River Basin Based on Hydrochemistry and Environmental Isotopes

by
Lei Wang
1,2,3,
Yi Li
4,
Yanpeng Zhang
1,2,*,
Wei Liu
3 and
Hongxin Zhang
1,2
1
Department of Hydrogeology and Water Resources, Wuhan Center of China Geological Survey, Wuhan 430205, China
2
Key Laboratory of Eco-Hydrogeological Process of River and Lake Wetlands in Changjiang Reaches, China Geological Survey, Wuhan 430205, China
3
Institute of Geological Survey, China University of Geosciences, Wuhan 430074, China
4
Hydrogeology Engineering Geology Brigade of Hubei Geological Bureau, Jingzhou 434020, China
*
Author to whom correspondence should be addressed.
Water 2025, 17(14), 2105; https://doi.org/10.3390/w17142105
Submission received: 11 June 2025 / Revised: 3 July 2025 / Accepted: 9 July 2025 / Published: 15 July 2025
(This article belongs to the Special Issue Groundwater Quality and Contamination at Regional Scales)

Abstract

Sulfate as a potential pollution source in the water environment of the basin, identifying sulfate sources and migration mechanisms is essential for protecting the water environment and ensuring sustainable water management. Liuyang River is a primary tributary of the Xiangjiang River. It has experienced progressively intensifying anthropogenic influences in recent decades, manifested by sustained sulfate concentration increases. However, the sulfate sources and their contributions were not clear. This study used hydrochemistry and multi-isotopes methods combined with Simmr model to study the hydrochemical characteristics, sulfate sources, and migration–transformation processes of surface water and groundwater. The results showed that the hydrochemical types of surface water were HCO3-Ca and HCO3·SO4-Ca·Mg, and groundwater were HCO3-Ca, HCO3-Ca·Mg, and HCO3·SO4-Ca. Ions in the water primarily originated from carbonate and silicate rocks dissolution and sulfide oxidation, augmented by mining operations, sewage discharge, and chemical production. The analyses of hydrochemistry, isotopes, and Simmr model revealed that surface water sulfate originated from soil sulfate (35.70%), sulfide oxidation (26.56%), sewage (16.58%), and atmospheric precipitation (12.45%). Groundwater sulfate was derived predominantly from sewage (34.96%), followed by soil sulfate (28.09%), atmospheric precipitation (17.35%), and sulfide oxidation (12.25%). Sulfate migration and transformation were controlled by the natural environment and anthropogenic impacts. When unaffected by human activities, sulfate mainly originated from soil and atmospheric precipitation, relating to topography, geological conditions, agricultural activities, and precipitation intensity. However, in regions with intense human activities, contributions from sewage and sulfide oxidation significantly increased due to the influences of mining and industrial activities.

1. Introduction

Surface water and groundwater in river basins serve as crucial water supply sources for human society and industrial-agricultural development, with their environmental quality being of paramount importance [1,2,3]. In recent decades, China’s rapid economic growth has substantially increased water demands for industrial manufacturing and agricultural production. This has exacerbated irrational exploitation of water resources, resulting in extensive contamination of surface water and groundwater while severely threatening water security and sustainable environmental development [4,5]. Dissolved sulfate (SO42−) is a key chemical component in water bodies that reflects water quality. Sulfate originates from natural sources (evaporite dissolution, sulfide oxidation, soil, seawater intrusion, and atmospheric precipitation) and anthropogenic pollutants (industrial and domestic sewage, agricultural fertilizers, and mining drainage) [6,7,8]. Variation in sulfate concentrations significantly impacts sulfur biogeochemical cycling, induces water acidification and acid rain formation [9,10,11], and generates toxic compounds (e.g., hydrogen sulfide) that endanger public health and water environment [12,13].
Due to the existence of multiple potential sources of sulfate, it is difficult to accurately distinguish the sources only by using conventional hydrochemical methods. For example, ion ratio relationships (e.g., SO42−/Cl, SO42−/Ca2+) cannot accurately identify the influences of natural and anthropogenic factors on sulfate concentrations [14]. Sulfur isotope of sulfate (δ34SSO4) serves as a natural tracer for sulfate source identification, undergoing minimal isotopic fractionation during biogeochemical processes [15,16]. The values of δ34SSO4 in water preserve the inherent isotopic characteristics of their sources [17]. Therefore, δ34SSO4 is widely used to identify sulfate sources [18]. For instance, Han et al. applied δ34SSO4 to identify sulfate sources in the Daweijia area of Dalian, China, indicating fertilizers as primary sources in Quaternary groundwater [19]. However, overlapping δ34SSO4 ranges among different sources limit the accuracy of sulfate isotope tracing [20]. Zhang et al. utilized δ34SSO4 to trace sulfate sources in the Yiluo River, revealing overlapping isotopic ranges between gypsum and domestic sewage, which made these sources difficult to distinguish [21]. The value of δ18OSO4 is related to the ratio of oxygen derived from water and oxygen [22,23]. Combining δ18OSO4 with δ34SSO4 can resolve these limitations and significantly improves sulfate source identification accuracy [24]. For example, Otero et al. applied δ34SSO4 and δ18OSO4 to groundwater in the Llobregat potash mining basin, identifying potassium fertilizers production and mine tailing drainage as predominant sulfate sources [25]. This dual-isotope approach has been extensively employed to investigate sulfate sources and migration processes in water environment [26,27].
The Liuyang River, a primary tributary of the Xiangjiang River, holds exceptional significance for regional water supply. The basin features fireworks manufacturing, and mining and agricultural activities are also active. Surface water and groundwater receive sulfate inputs from both natural processes and anthropogenic activities, with sulfate concentrations demonstrating significant influence from mining, industrial production, and agricultural activities [28]. However, few studies have addressed sulfate source tracing in the Liuyang River Basin, and pollution sources and contributions of sulfate remain unclear. To address these challenges, surface water and groundwater samples were collected from the Liuyang River Basin. Hydrochemistry combined with multi-isotopes (δ34SSO4, δ18OSO4, δDH2O, δ18OH2O) was employed to identify various sources of sulfate. The Stable Isotope Mixing Models in R (Simmr) was utilized to quantify contributions from different sources of sulfate. Sulfate migration–transformation was elucidated based on topography, land use types, and geological conditions. This study comprehensively revealed the impacts of human activities and natural processes on sulfate in water bodies. It is of great significance for the environmental protection and the sustainable utilization of water resources in the basin. By identifying sulfate sources, contributions and migration-transformation processes via hydrochemical-isotopic approaches, this research provides a scientific basis for water pollution prevention and management in the basin.

2. Materials and Methods
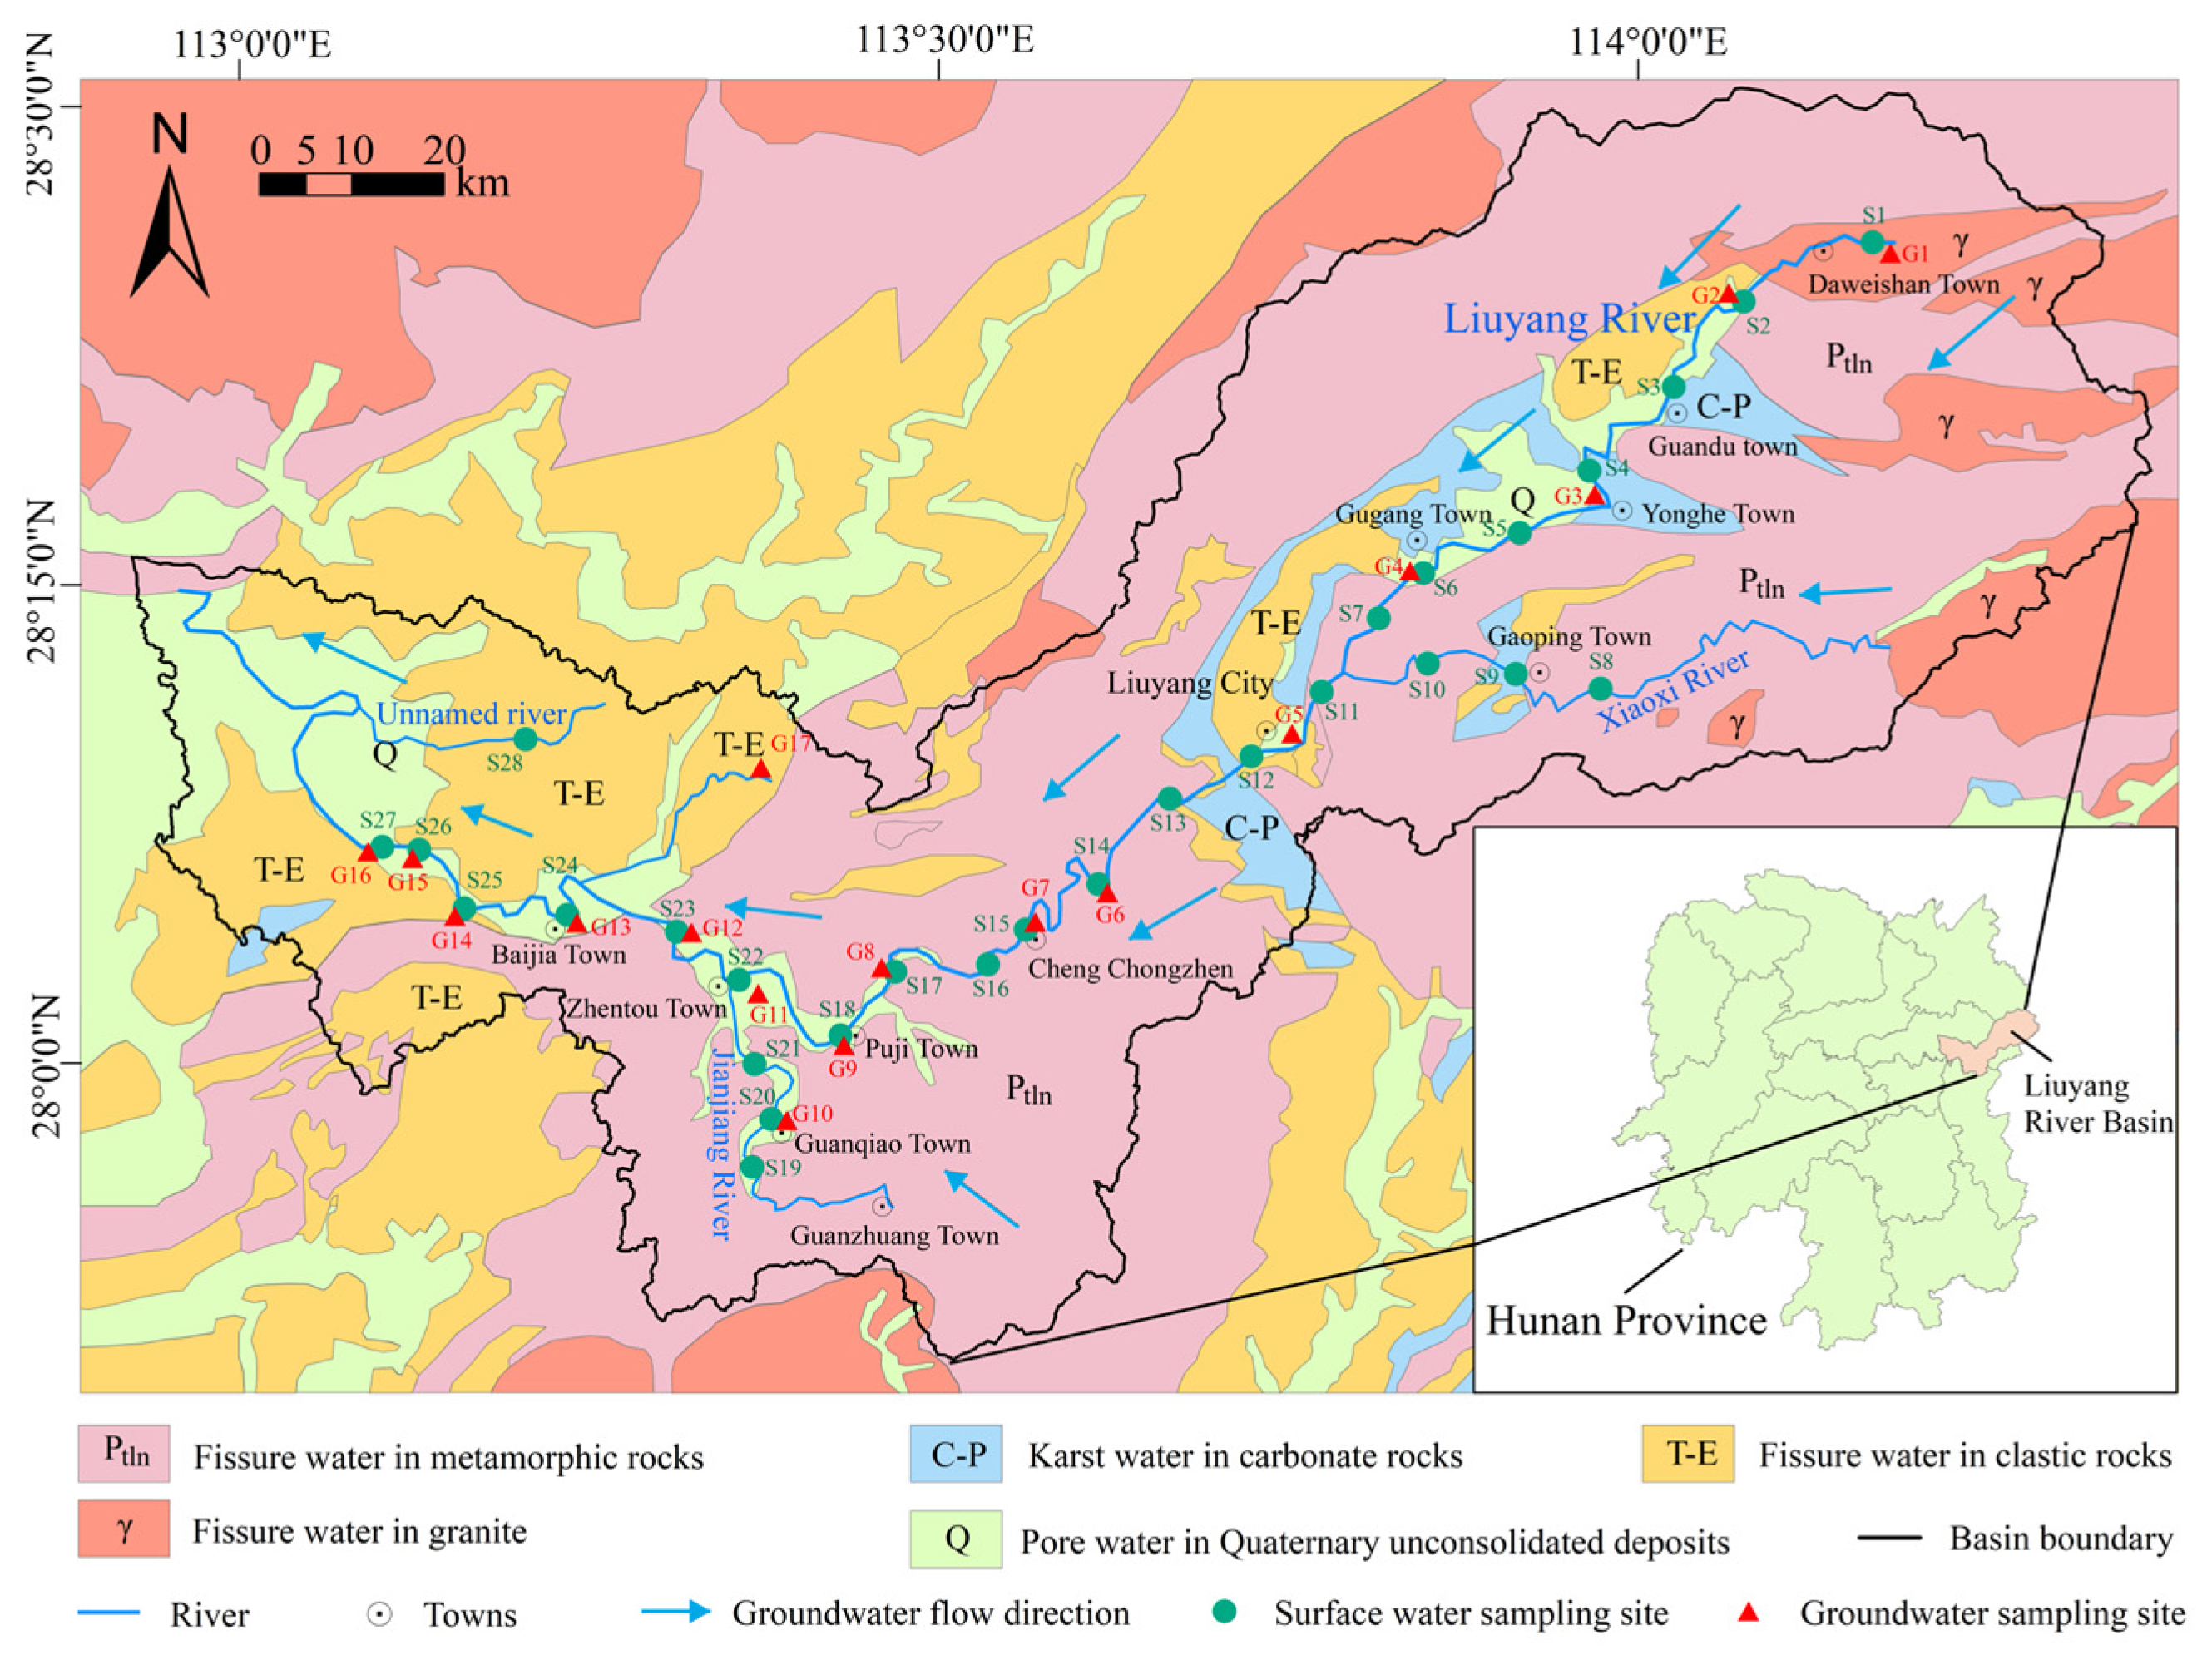
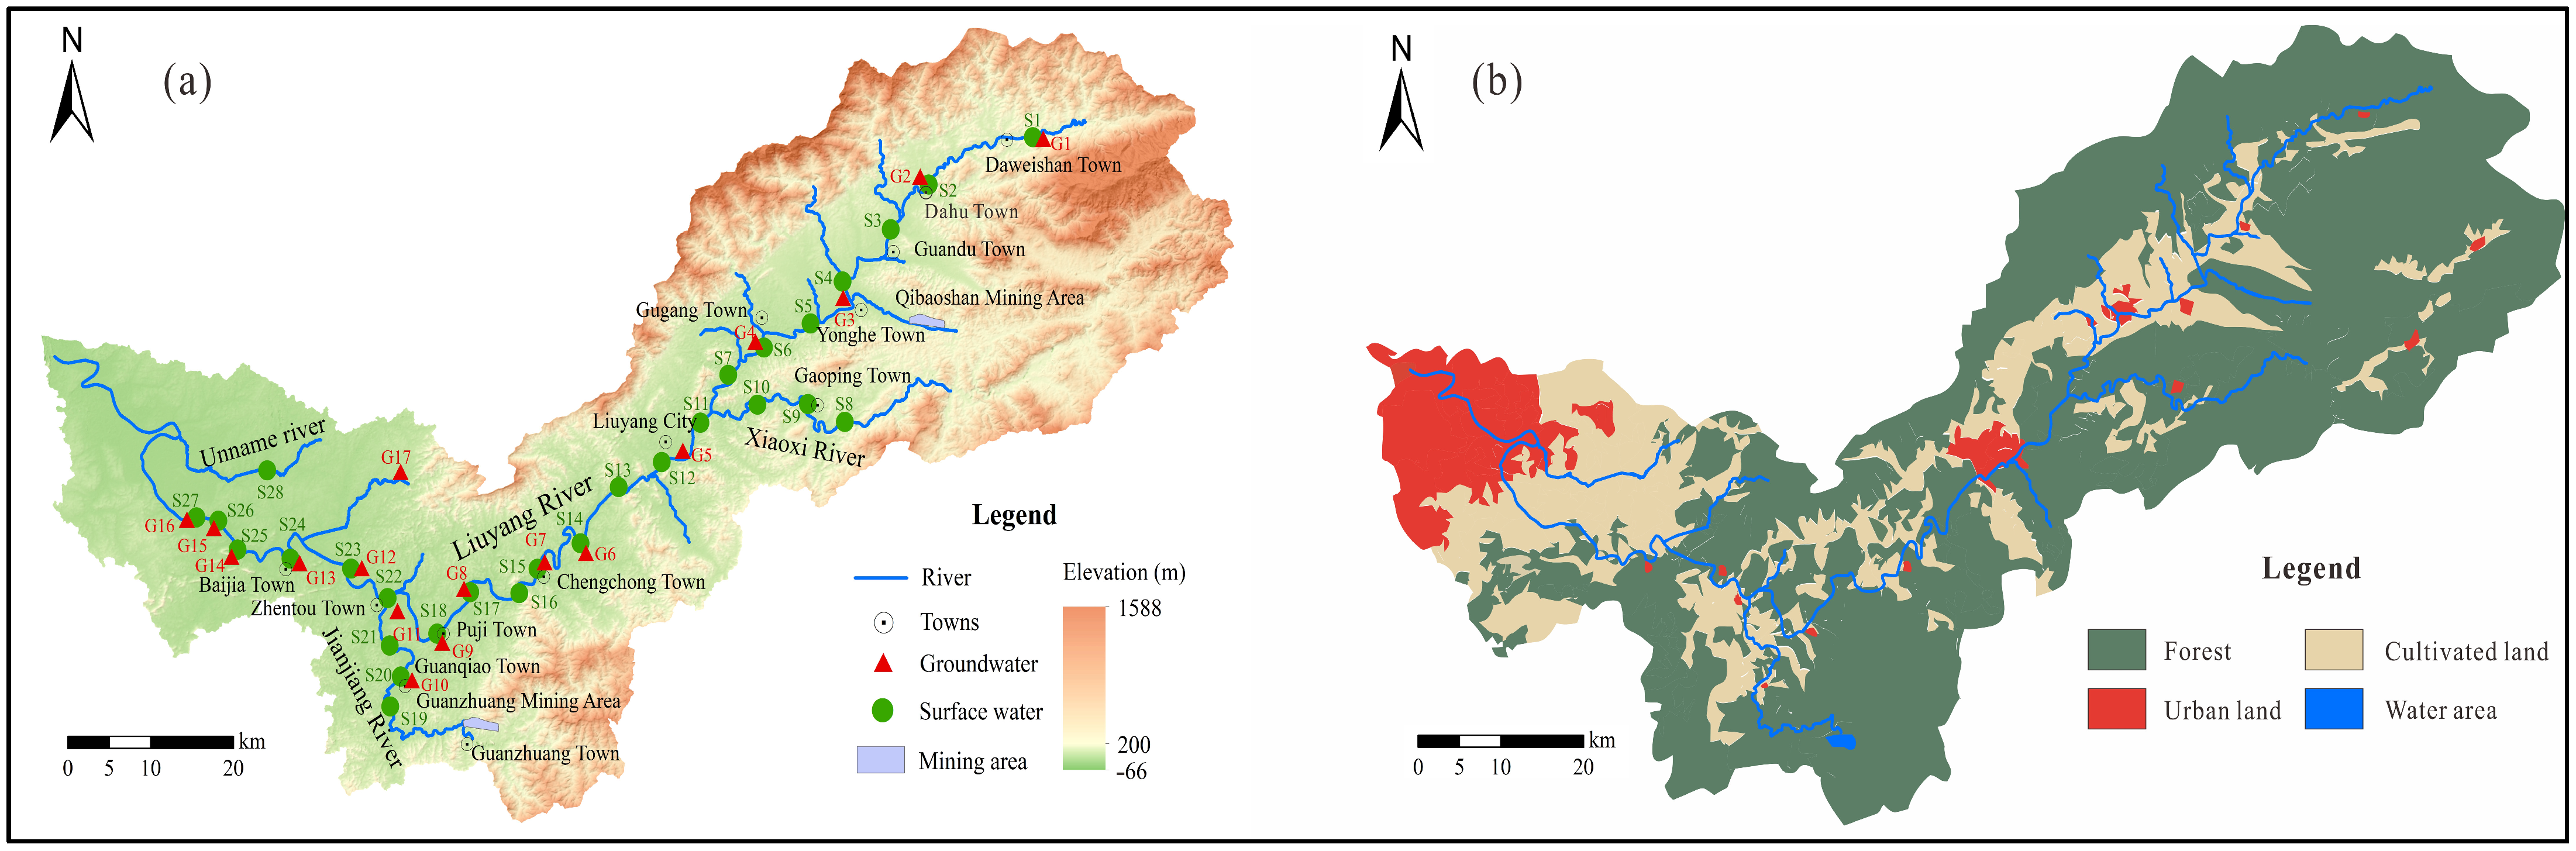
2.1. Study Area

The Liuyang River Basin is situated in eastern Hunan Province, China. Its trunk stream (the Liuyang River) serves as a primary tributary of the Xiangjiang River. Originating from the northern foothills of Dawei Mountain within the Luoxiao Mountain Range, the Liuyang River extends 234.8 km in total length and drains a catchment area of 4665 km2. The basin exhibits diverse geomorphological features, characterized by a northeast to southwest topographic gradient. The upstream, spanning from Shuangjiangkou to eastern of Daweishan Town, features mountainous terrain. The midstream, extending from Shuangjiangkou to Zhentou Town, transitions to hilly landscapes, while the downstream (west of Zhentou Town) comprises extensive alluvial plains. There are also larger tributaries, such as Xiaoxi River and Jianjiang River developed within the basin. Climatically classified as a subtropical monsoon zone, the basin receives a multi-year average precipitation of 1345.7 mm, 47.7% of which occurs from May to July.
The Liuyang River Basin exposes relatively complete stratigraphy, spanning from the Pre-Sinian to Quaternary. The oldest units comprise the Pre-Sinian Banxi and Lengjiaxi Groups, consisting of metamorphic rocks that extensively outcrop in the study area. Clastic rocks of Devonian, Cretaceous, and Paleogene are predominantly distributed in the downstream. Carboniferous-Permian carbonate rocks occur along the Xiaoxi River, and Liuyang River upstream and downstream. Quaternary unconsolidated deposits concentrate along the river valley in the upstream and downstream. Limited exposures of Yanshanian magmatic rocks, primarily acidic and intermediate-acidic lithology, are localized in the headwater of Liuyang River and Xiaoxi River.
Within the basin, groundwater is classified into four aquifer types by aquifer media: weathered fissure water in metamorphic rocks, weathered fissure water in clastic rocks, karst water in carbonate rocks, and pore water in Quaternary unconsolidated deposits. weathered fissure water is widely distributed in the study area. Quaternary pore water is distributed along the surface water, while karst water predominantly emerges in the upstream and midstream. Groundwater recharge modes include atmospheric precipitation infiltration, recharge from surface water percolation, and lateral inflow from adjacent aquifers. Regionally, groundwater flows along a NE-SW direction (Figure 1).

2.2. Sample Collection and Analysis

Surface water and groundwater samples were collected in the study area in November 2023 (Figure 1). Surface water sampling adhered to the following principles: sampling points were evenly distributed along the river course with additional sites at tributaries-trunk stream confluences; all surface water samples (n = 28) were collected from mid-channel locations, including 21 from the trunk stream, 3 from Xiaoxi River, 3 from Jianjiang River, and 1 from Unnamed River. Groundwater samples were sourced from wells (n = 17) proximate to surface water sites, extracted from shallow aquifers. During sampling, a multiparameter water quality probe (Eureka Manta+30, Austin, TX, USA) recorded in situ measurements of pH, dissolved oxygen (DO), electrical conductivity (EC), and oxidation-reduction potential (ORP).
Anion, cation, and water stable isotope (δDH2O, δ18OH2O) samples were stored in 50 mL amber high-density polyethylene (HDPE) bottles. Samples for the analysis of δ34SSO4 and δ18OSO4 were collected in 1.5 L amber HDPE bottles. All samples were filtered through 0.45 μm cellulose acetate membranes prior to preservation. Cation samples were acidified with 2–4 mL ultrapure HNO3 to pH < 2, anion samples were sealed unpreserved and refrigerated at 4 °C. Sulfate isotope samples were acidified with 1 mL ultrapure HCl to pH <2 in the laboratory, followed by supersaturated BaCl2 addition to convert dissolved SO42− to BaSO4. The precipitate was rinsed with deionized water to remove Cl, filtered through 0.22 μm membranes, and dried at 850 °C for 2 h in a muffle furnace.
Figure 1. Hydrogeological conditions and distribution of sampling sites in the study area.
Water 17 02105 g001
The concentrations of HCO3 were determined via titration, while other anions were analyzed using ion chromatography (Dionex ICS-3000, Sunnyvale, CA, USA). Cation concentrations were quantified through inductively coupled plasma optical emission spectrometry (Thermo ICAP-6300, Waltham, MA, USA), achieving measurement precision better than 2%. Total dissolved solids (TDS) were measured gravimetrically by drying and weighing. δDH2O and δ18OH2O were analyzed using a laser-based liquid water isotope analyzer (IWA-35EP, LICA United Technology Co. Ltd., Beijing, China), with analytical precisions surpassing 0.1‰ and 0.5‰, respectively. δ34SSO4 and δ18OSO4 were determined via gas-source isotope ratio mass spectrometry (Thermo Delta V Advantage, Waltham, MA, USA and MAT253, Jacksonville, FL, USA), attaining precisions better than 0.2‰ and 0.5‰. All analyses were conducted at the laboratory in Wuhan Center of China Geological Survey.

2.3. The Stable Isotope Mixing Models in R (Simmr)

Simmr, a Bayesian mixing framework based on Dirichlet distributions, employs probabilistic source apportionment through R implementation to quantify proportional contributions of multiple sulfate sources [29]. Unlike conventional linear mixing models requiring fixed end-member mean values, Simmr inputs end-member ranges, thereby enhancing analytical capability for complex source mixtures. The model structure is formally expressed as
X ij = k = 1 k P k S jk + C jk + ε ij
S jk ~ N μ jk , ω jk 2
C jk ~ N λ jk , τ jk 2
ε ij ~ N 0 , σ j 2
where Xij is the isotopic value j of sample i (j = δ34SSO4 and δ18OSO4 in this study). Sjk is the isotopic value j of source k, characterized by its mean μjk and standard deviation ω2jk. Pk quantifies the proportional contribution of source k (k is potential source of sulfate). Cjk, the isotopic fractionation factor for the isotope j in source k, is defined by its mean λjk and standard deviation τ2jk, this term may be disregarded when significant isotopic fractionation is absent. The residual error εij, with a mean of 0 and standard deviation of σ2j, accounts for unquantified variability in sample i.

3. Results and Discussion

3.1. Hydrochemical Characteristics

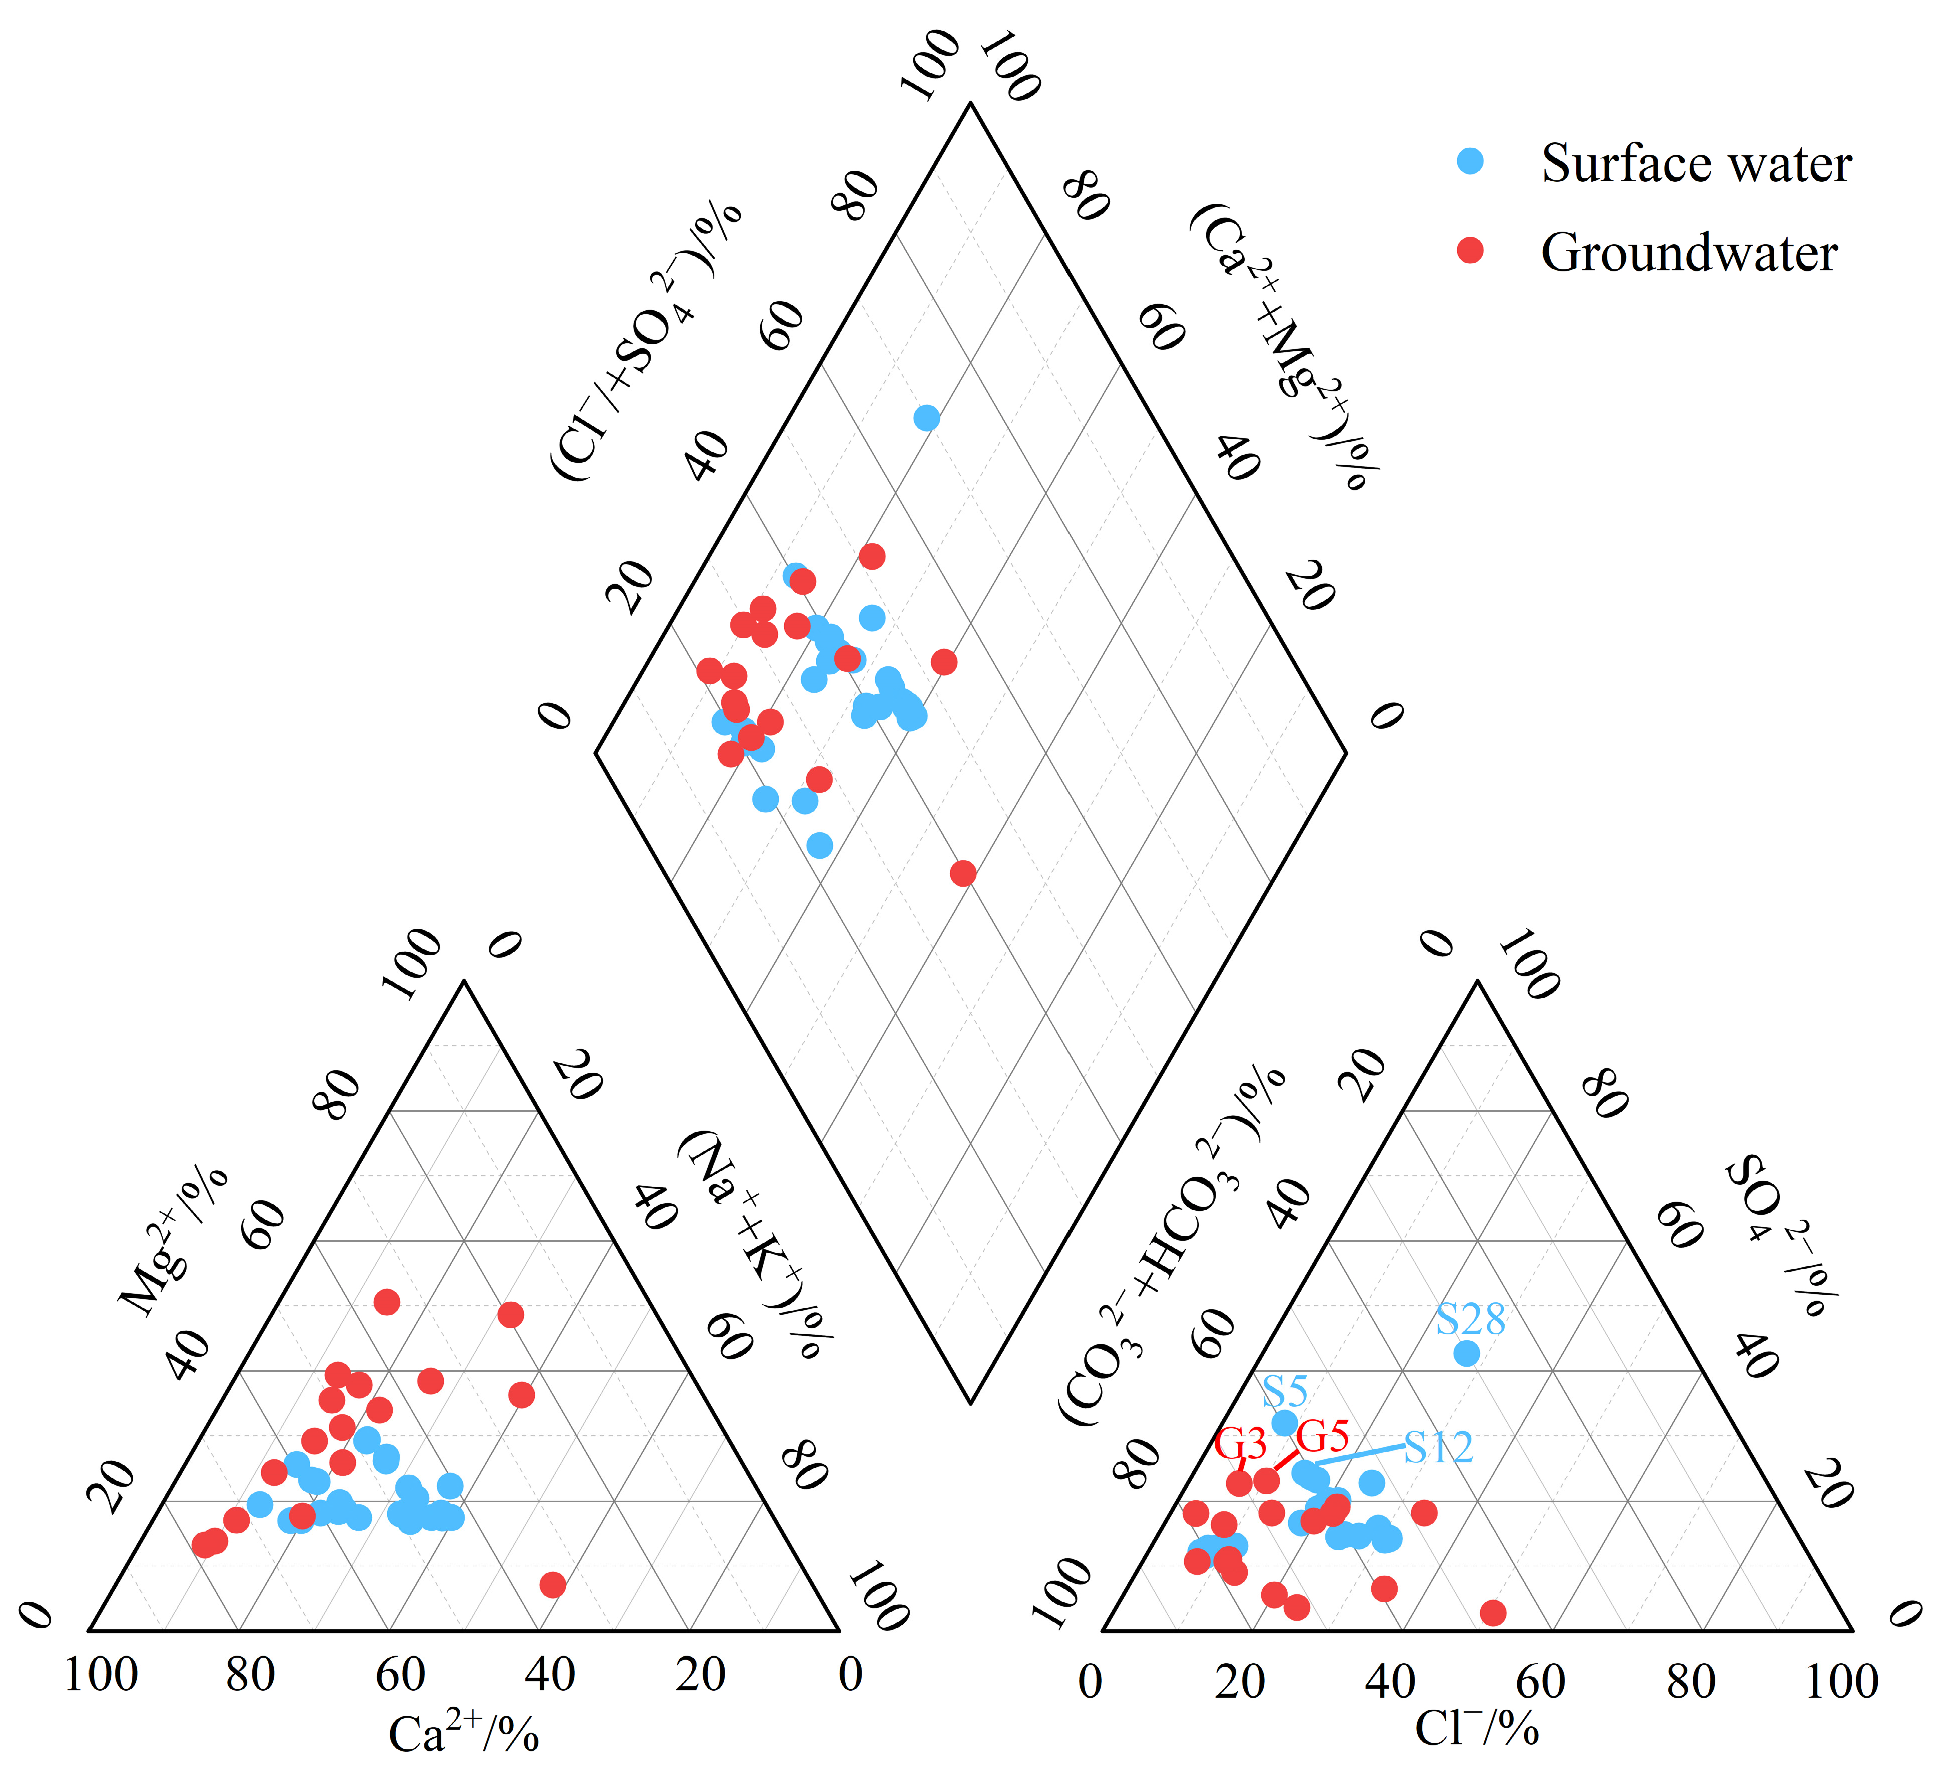
3.1.1. Hydrochemical Compositions and Types

The TDS values in surface water ranged from 48.70 to 262.00 mg·L−1, with an average of 134.45 mg·L−1. The EC values varied between 75.00 and 518.20 μS·cm−1, averaging 281.47 μS·cm−1. Groundwater exhibited higher TDS (186.07 mg·L−1) and EC (351.79 μS·cm−1) compared to surface water, suggesting more intensive water-rock interactions (Table 1). The maximum, minimum, and average concentrations of cations and anions are shown in Table 1. In surface water, average concentrations of cations were manifested as Ca2+ > Na+ > Mg2+ > K+, while anions followed the concentration gradient: HCO3 > SO42− > Cl > NO3. In groundwater, Ca2+ and HCO3 exhibit the highest average concentrations, followed by Na+, Mg2+, SO42−, and NO3, K+, and Cl having the lowest concentrations. Along the flow path, surface water showed a gradually increase trend in both cation and anion concentrations. In the upstream, Ca2+, HCO3, and SO42− of groundwater exhibited higher concentrations than the midstream and downstream. K+ concentrations remained relatively stable spatially. Na+, Mg2+, Cl, and NO3 concentrations showed an initial increase followed by a gradual decrease.
Ions in the surface water and groundwater were dominated by HCO3and Ca2+. Hydrochemical types of surface water in the upstream were primarily HCO3-Ca, transitioning to mixed HCO3·Cl-Ca·Na and HCO3·SO4-Ca·Mg in the midstream, and finally to HCO3·Cl-Ca·Na in the downstream. Hydrochemical types in groundwater were more complex. The upstream included HCO3-Ca and HCO3·SO4-Ca types; the midstream and downstream were dominated by HCO3-Ca·Mg type with minor HCO3·SO4-Ca type, some samples showed elevated Na+, SO42−, and Cl. Specifically, SO42 was the dominant anion in sample S28. Samples S5, G3 (located downstream of mine) and G5, S12 (near Liuyang city) displayed a HCO3·SO4-Ca type, indicating the effluents from mining activities and industrial sewage (Figure 2).

3.1.2. Sulfate Characteristics

The sulfate concentrations in surface water ranged from 4.41 to 76.70 mg·L−1, with an average of 19.06 mg·L−1. Historical data from three key monitoring sections in the Liuyang River Basin (Huanghuadong, Xiaoxi, and Sanshuichang) showed average sulfate concentrations of 5.98 mg·L−1, 7.58 mg·L−1, and 2.50 mg·L−1, respectively [30]. It indicates a rising trend in recent years, likely linked to intensified human activities. Spatially, surface water in the upstream exhibited the widest sulfate variability (4.41–37.20 mg·L−1), followed by midstream (17.20–32.60 mg·L−1) and downstream (17.90–19.30 mg·L−1). Notably, sulfate levels in Xiaoxi River (5.86 mg·L−1) and Jianjiang River (12.93 mg·L−1) were significantly lower than in the trunk stream, while the unnamed river showed an exceptionally high concentration of 76.70 mg·L−1. Pronounced variation in the upstream suggests multiple sulfate sources, whereas the minimal fluctuation of downstream implies dominance by a single source. Groundwater sulfate concentrations (0.81–58.50 mg·L−1) were slightly lower than those in the surface water. In the upstream, groundwater exhibited higher sulfate levels (23.29 mg·L−1) compared to midstream (19.48 mg·L−1) and downstream (14.86 mg·L−1), with a gradual decline along the flow path (Figure 3).
For surface water, the minimum sulfate concentration (4.41 mg·L−1) was recorded at the headwater site (S1), attributable to its location in a granite-dominated area with minimal human activity and limited sulfate inputs. In contrast, the maximum sulfate concentration (76.70 mg·L−1) was found in an unnamed river (S28), likely due to industrial sewage discharge with high sulfate concentrations in the upstream of this river. Along the flow path, sulfate concentrations initially increased, then slightly decreased and stabilized. This pattern is linked to mining drainage in the upstream and sewage discharge in the midstream urban areas [31,32]. In groundwater, the lowest sulfate concentration (0.81 mg·L−1) occurred northwest of Zhentou Town (G12), potentially resulting from dilution or bacterial sulfate reduction (BSR) [33]. The highest concentration (58.50 mg·L−1) was detected in Liuyang city (G5), likely influenced by urban industrial effluents and mining drainage. Compared to surface water, groundwater sulfate concentrations exhibited a broader variation range, reflecting the control of complex lithology and hydrogeological conditions (Figure 4).

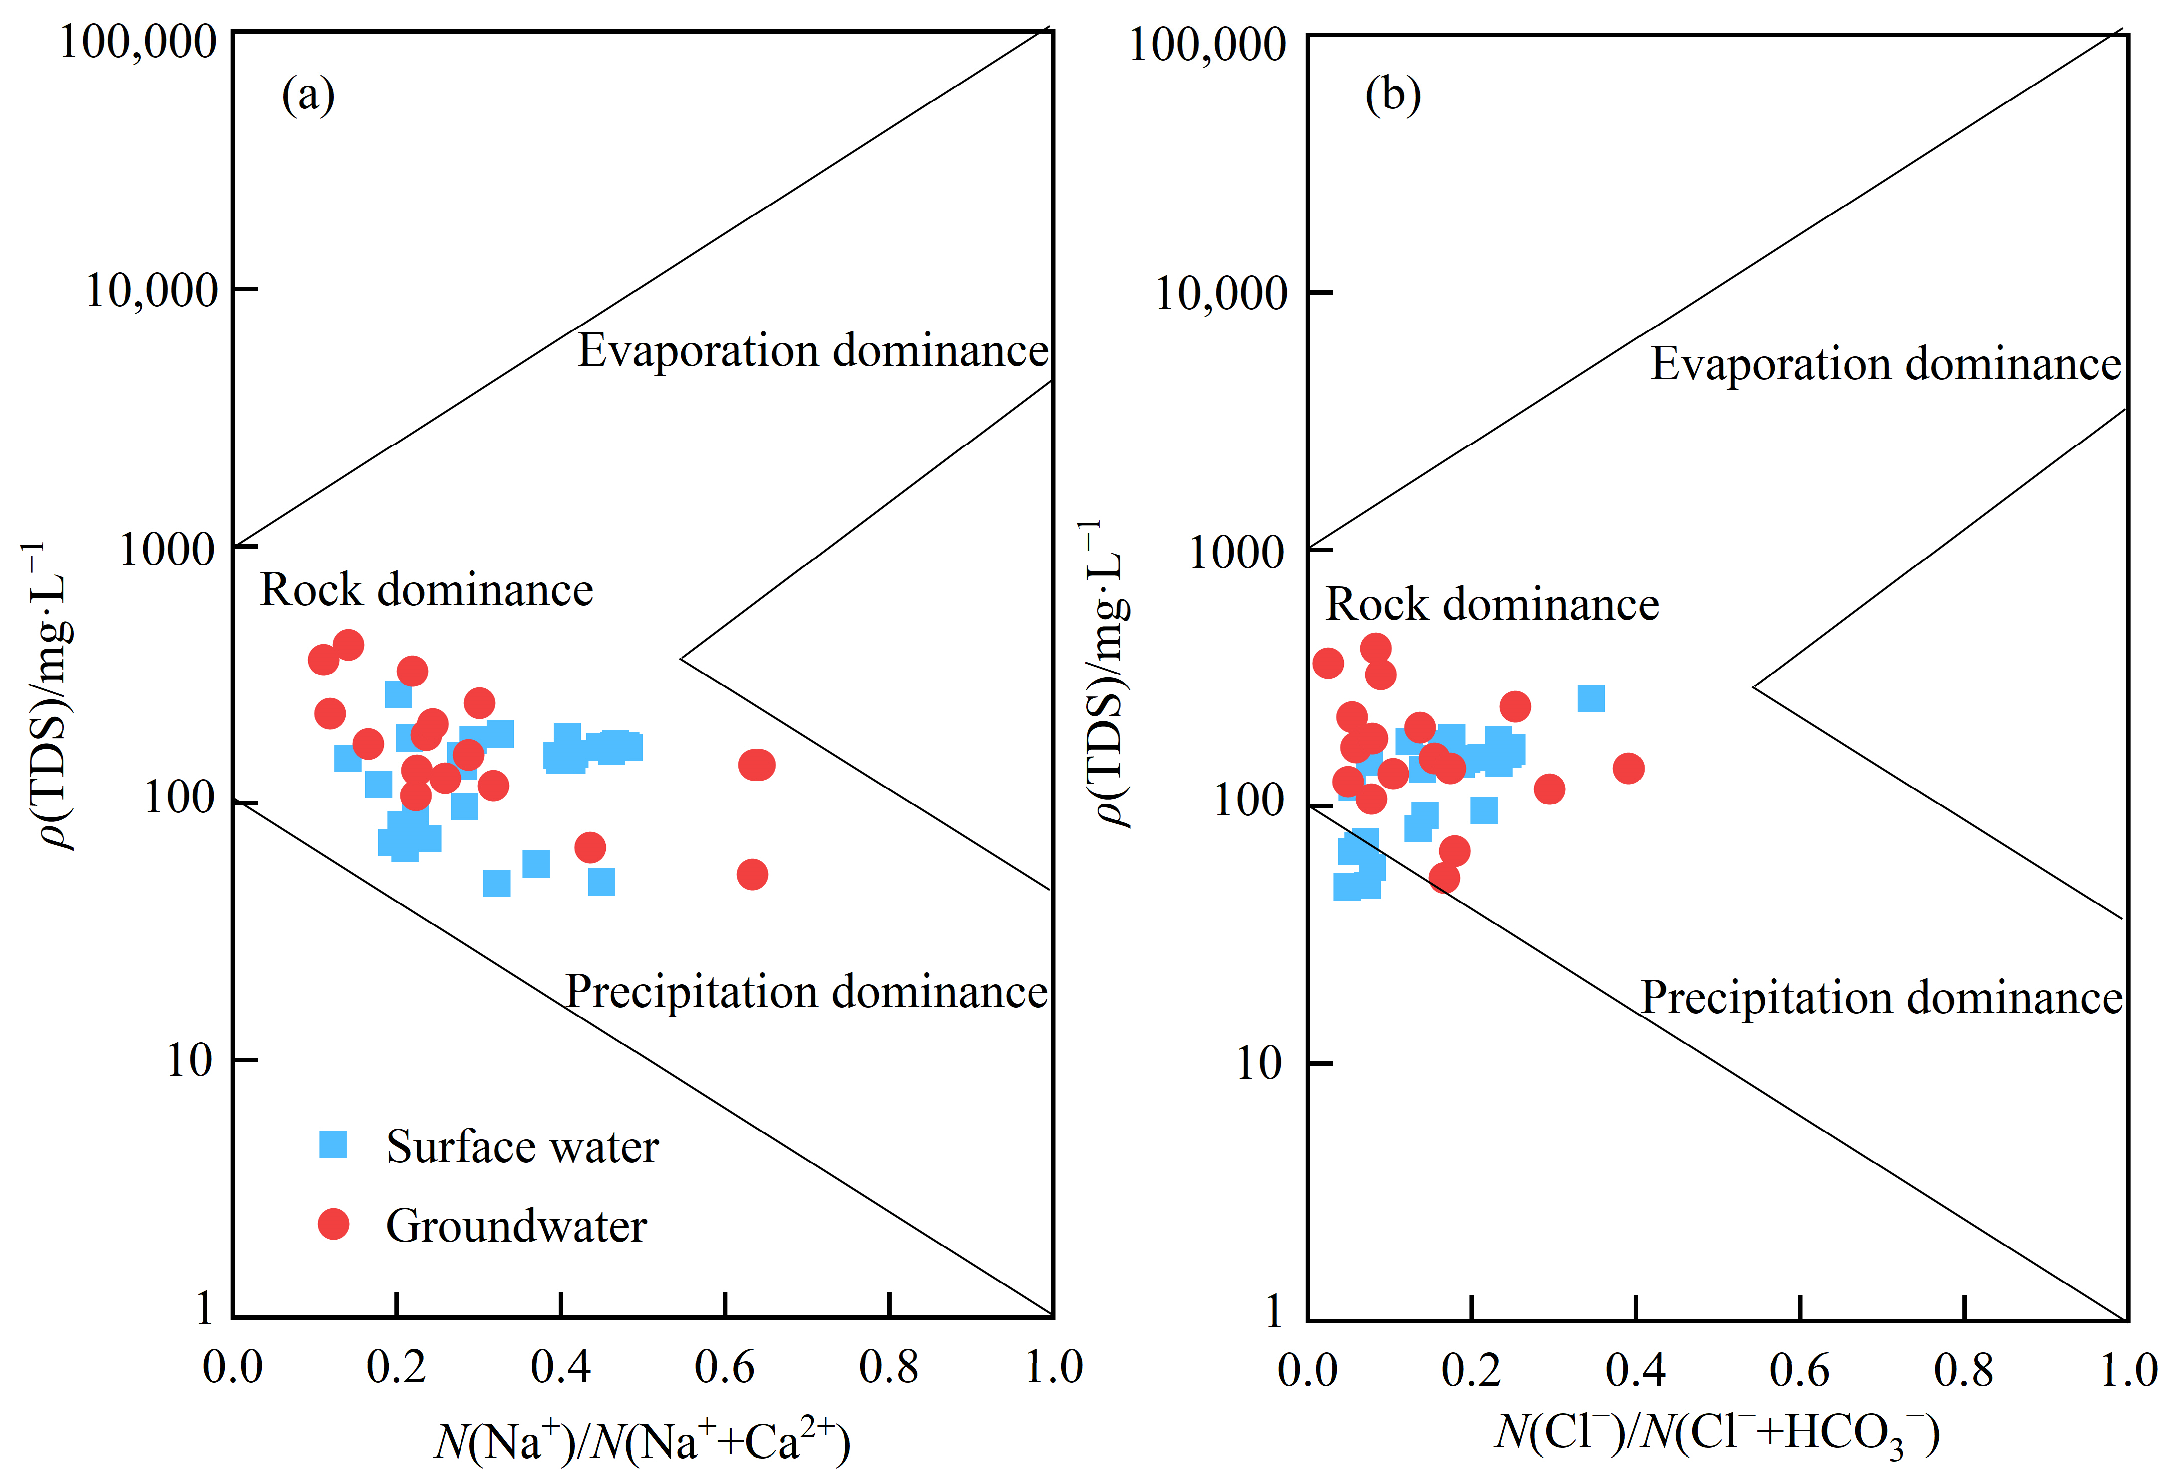
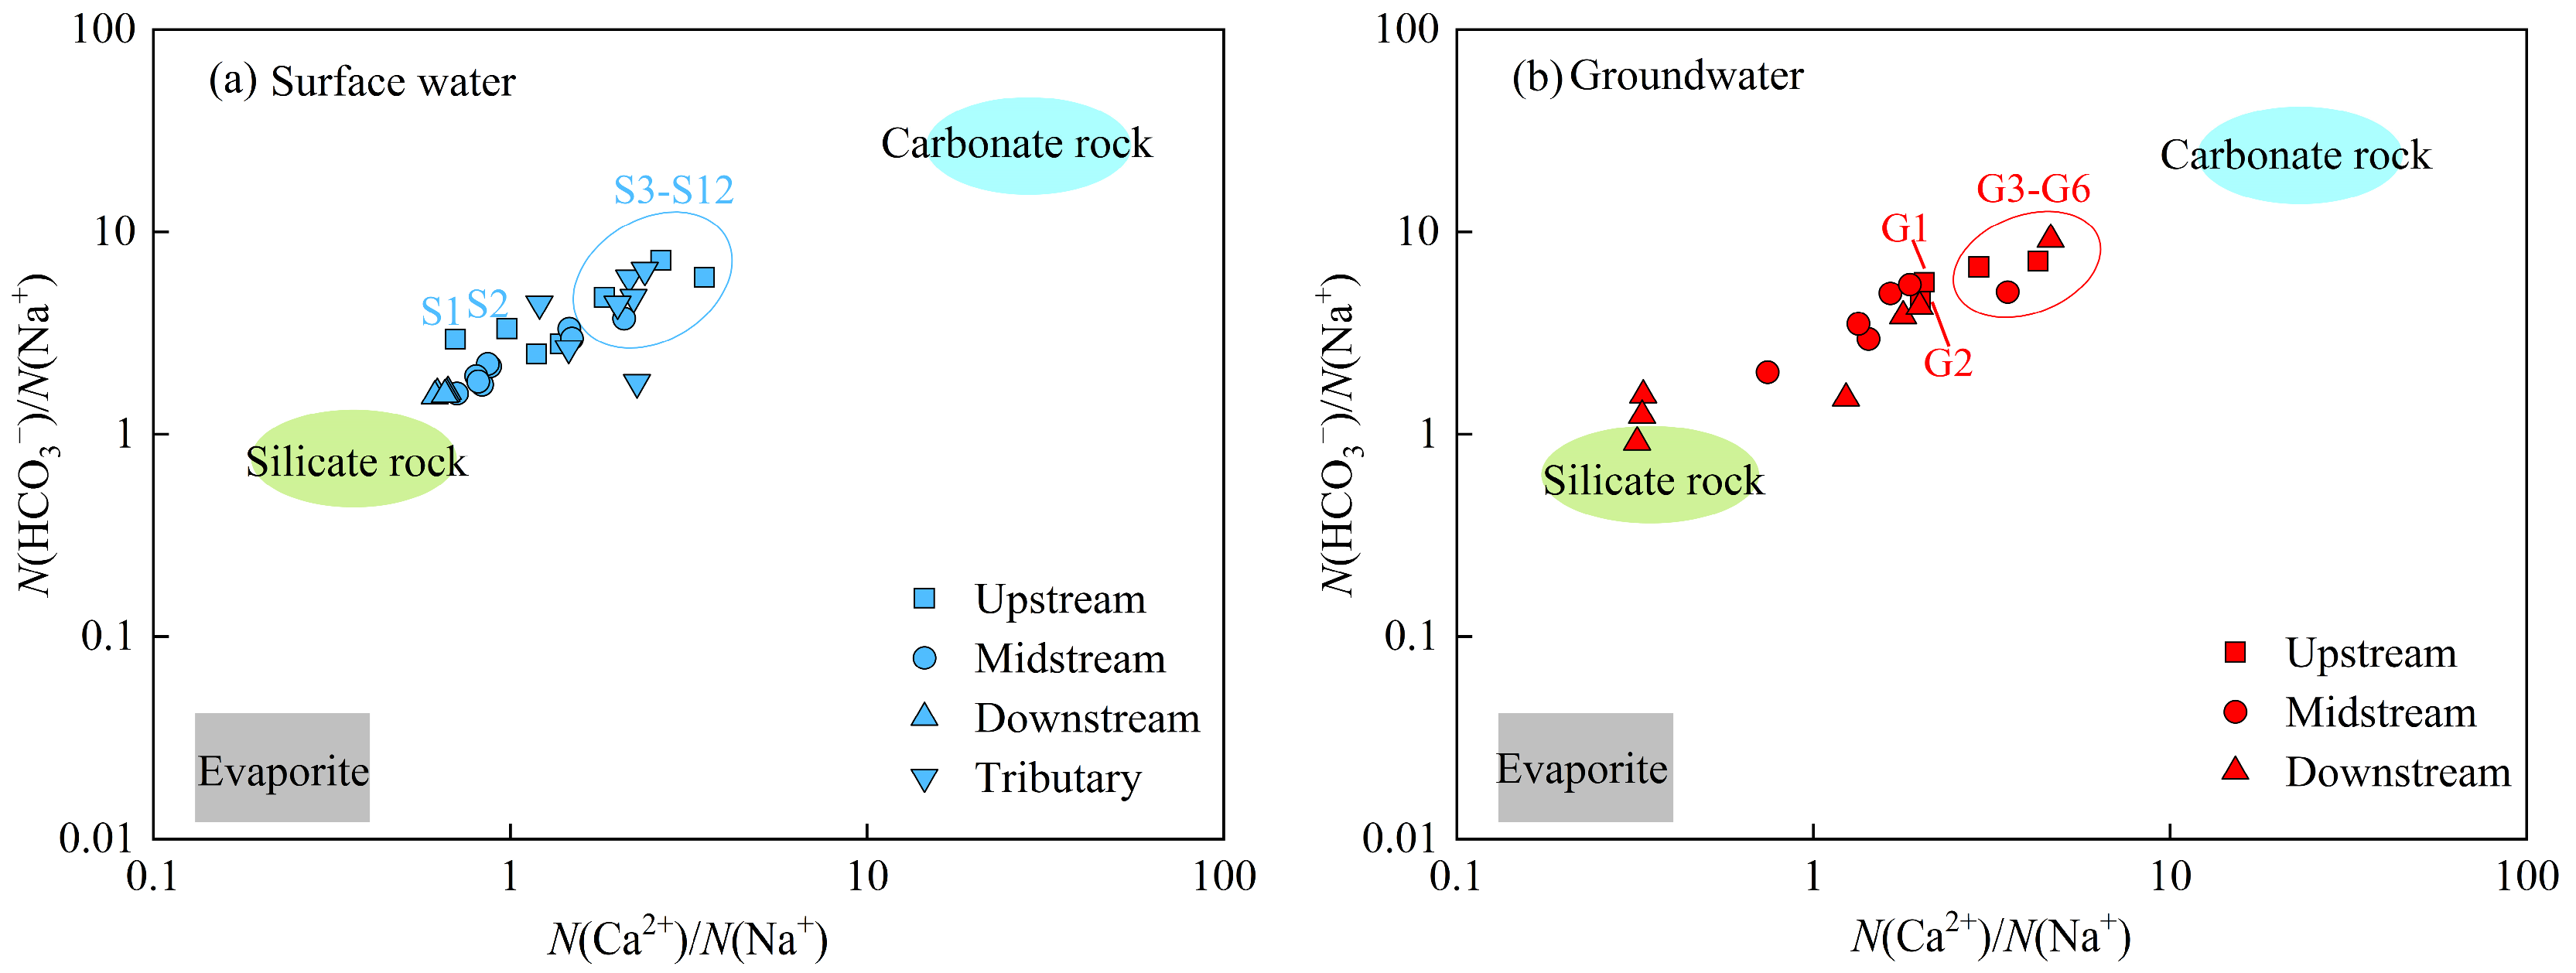
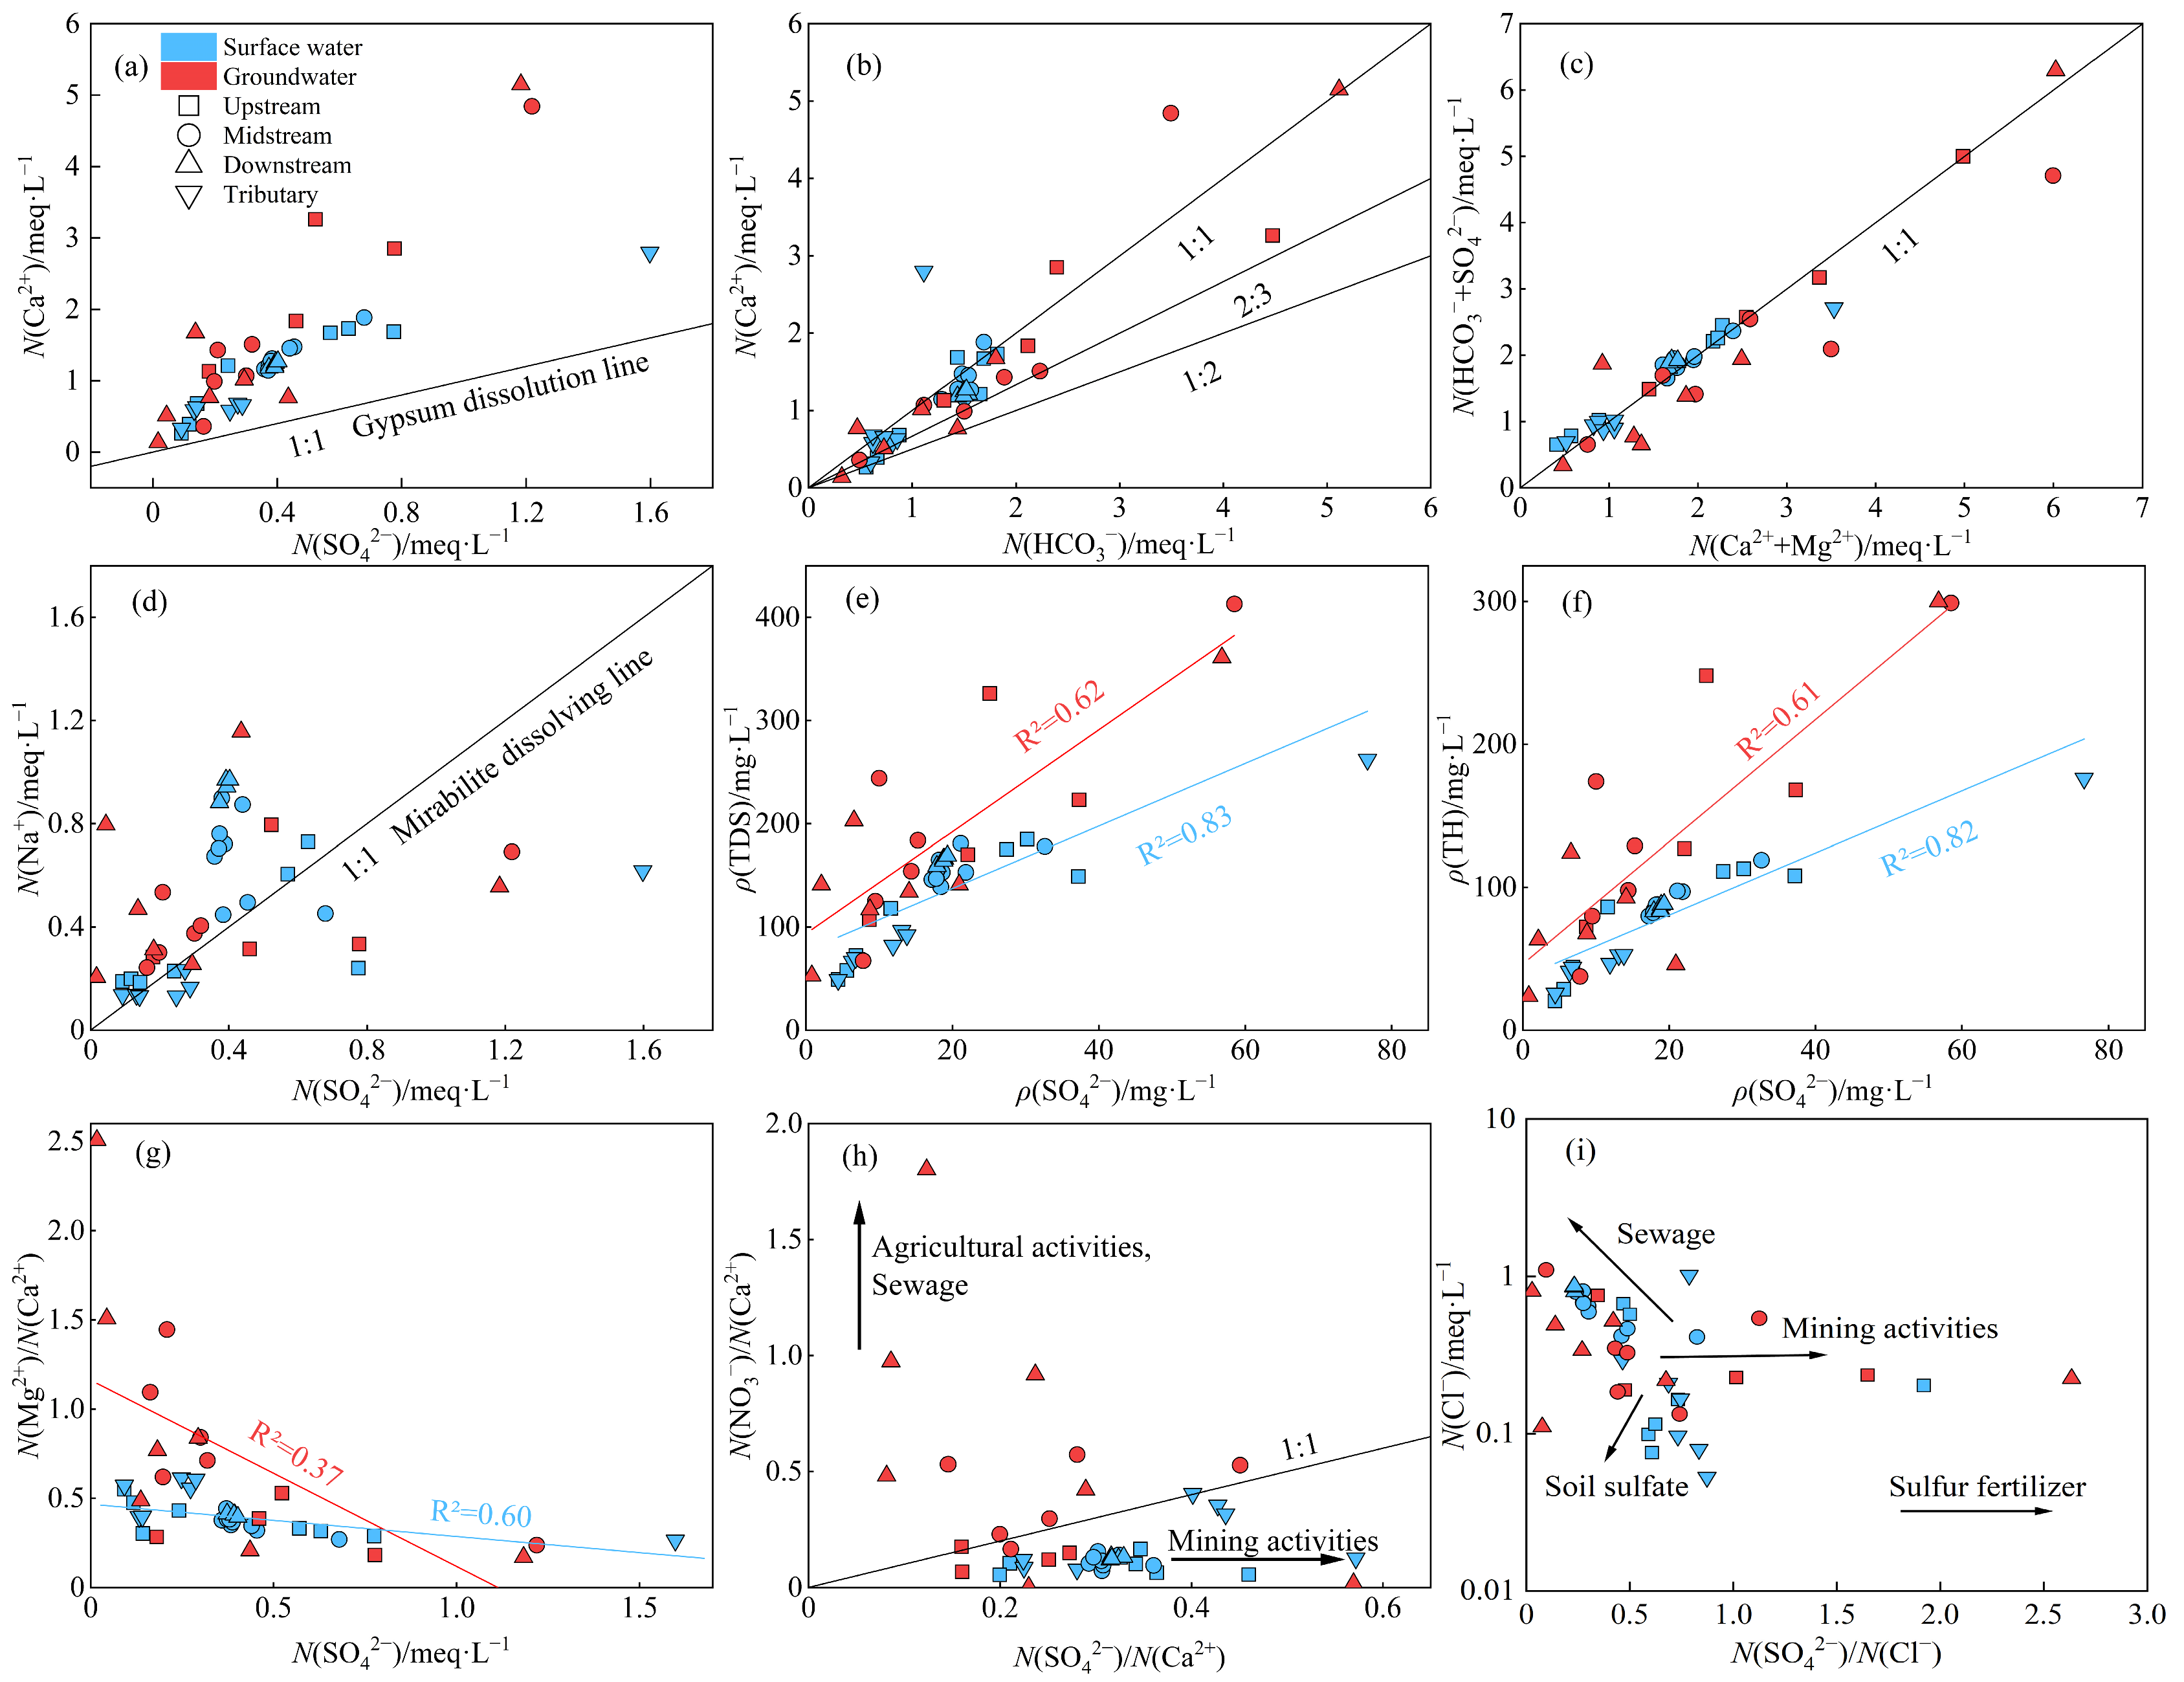
3.2. Hydrochemical Analysis of Sulfate Sources

Gibbs diagram is a tool for preliminary analysis of hydrochemical controls by rock weathering, precipitation, and evaporation [34]. All surface water samples in the study area fall within the rock-dominated field, distant from the evaporation and precipitation dominance fields. This indicates that the hydrochemical composition of surface water is primarily governed by rock weathering processes. For groundwater, most samples cluster in the rock-dominated domain, with a few approaching the precipitation dominance field. This distribution suggests that water–rock interactions dominate groundwater chemistry, and some groundwater is affected by atmospheric precipitation (Figure 5).
To further distinguish different types of water–rock interactions, Gaillardet et al. delineated typical HCO3/Na+ and Ca2+/Na+ ratio ranges for carbonate rocks, silicate rocks, and evaporites [35]. In the study area, surface water samples plot between the silicate and carbonate rocks end members, positioned closer to the silicate domain. Groundwater samples also fall within the silicate–carbonate transition zone but exhibit stronger influence from carbonate dissolution. Evaporite dissolution shows a negligible impact on the hydrochemical characteristics in the study area (Figure 6). Along the flow path, samples S1–S2 and G1–G2 plot near the silicate dissolution end member, while S3–S12 and G3–G6 occupy intermediate positions between silicate and carbonate domains, reflecting increased carbonate dissolution effects. Subsequently, both surface water and groundwater gradually shift back toward silicate-dominated signatures, consistent with the exposed lithology of the basin.
Water–rock interactions serve as a significant source of sulfate in water bodies. Analyzing ionic ratios associated with these processes enables identification of sulfate sources [36]. Water–rock interactions associated with sulfate primarily involve the dissolution of evaporite such as gypsum (CaSO4·2H2O) and mirabilite (Na2SO4·10H2O), and the oxidation of sulfide including pyrite (FeS2) [37]. As observed in Figure 7a, all surface water and groundwater samples plot above the gypsum dissolution line, with groundwater samples positioned farther from this line than surface water. This indicates limited Ca2+ and SO42− contributions from gypsum dissolution, and there are other Ca2+ and SO42− sources in the water bodies. Most water samples in the study area plot between the calcite (CaCO3) and dolomite (CaMg(CO3)2) dissolution lines (Figure 7b), implying Ca2+ and HCO3 predominantly originate from the dissolution of calcite and dolomite. Individual samples plotting above the calcite dissolution line may be attributed to gypsum dissolution, sulfuric acid-induced carbonate dissolution, or cation exchange processes. The milligram equivalent ratio of [SO42−] + [HCO3] and [Ca2+] + [Mg2+] provide preliminary evidence for sulfuric acid involvement in rock weathering [38]. A 1:1 ratio indicates the dissolution of carbonate rocks by sulfuric acid. Most surface water and groundwater samples align along the 1:1 line (Figure 7c), suggesting combined weathering effects from both carbonic acid and sulfuric acid. Groundwater samples in the middle and lower reaches plot below this line are due to reverse cation exchange processes or Ca-Mg silicate minerals dissolution. Figure 7d reveals a scattered distribution of samples across the mirabilite dissolution line, with no significant correlation between Na+ and SO42− concentrations, only individual surface water samples in the tributary plot near the mirabilite dissolution line. These findings suggest negligible contributions from mirabilite dissolution to sulfate in the basin.
The study area’s stratigraphy contains abundant pyrite. Mining activities expose pyrite to the atmosphere, generating sulfate and H+ through oxidation processes. Water polluted by pyrite leachate shows elevated SO42−, TDS, total hardness (TH) and Fe2+ coupled with depressed pH [39]. Sulfuric acid derived from sulfide oxidation further accelerates carbonate weathering, establishing correlations between SO42− and Mg2+/Ca2+ ratios. Surface water exhibits strong positive correlations between SO42− and both TDS (R2 = 0.83) and TH (R2 = 0.82) (p < 0.01), while weaker associations are observed in groundwater (Figure 7e,f). Sample S4, affected by mine drainage in Qibaoshan mining area, exhibited abrupt increases in SO42−, TDS, and TH compared to sample S3 in the upstream. As the Jianjiang River (S19–S21) receives discharge from Guanzhuang mining area, its hydrochemical characteristics showed depressed pH values (mean 6.9) and elevated Fe2+ concentrations (0.06 mg·L−1) compared to other samples. Furthermore, surface water samples exhibit strong negative correlations between SO42− and Mg2+/Ca2+ ratios (R2 = 0.76), contrasted with moderate correlations in groundwater (R2 = 0.41) (Figure 7g). These findings indicate sulfide oxidation as the predominant source of sulfate, exerting more significant impact on surface water than groundwater.
Anthropogenic activities significantly influence sulfate concentrations in both surface water and groundwater. Primary anthropogenic sources include industrial and domestic sewage, agricultural activities, and mining drainage. The SO42−/Ca2+ and NO3/Ca2+ ratios serve as effective tracers for distinguishing impacts from diverse human activities on hydrochemical characteristics [40,41]. As shown in Figure 7h, all surface water samples plot below the 1:1 line, with SO42−/Ca2+ ratios exceeding NO3/Ca2+ ratios, indicating that mining activities have a significant impact on sulfate concentrations in surface water. This effect was particularly pronounced at sites S5–S7 and S19–S21 due to direct drainage inputs from Qibaoshan and Guanzhuang mining areas. Conversely, groundwater in the mid-lower reaches predominantly clusters above the 1:1 line. This indicates the influences of agricultural activities and sewage, related to the dense town and farmland in the mid-lower reaches. Some groundwater samples (G2–G4) are located below the 1:1 line, as is related to their proximity to the mining area.
The analysis of SO42−/Cl ratios and Cl concentrations provides evidence for anthropogenic sulfate source identification. Sulfur fertilizers application elevates SO42−/Cl ratios with depressed Cl levels, whereas mining activities induce high SO42−/Cl ratios without significant Cl variation. Sewage inputs typically manifest as Cl enrichment with reduced SO42−/Cl ratios, while low values in SO42−/Cl ratios and Cl concentrations indicate natural source like soil or precipitation [42]. Figure 7i reveals concurrent influences from soil sulfate, mining activities, and sewage, with sulfur fertilizers demonstrating negligible impact. Surface water in the upper reaches, Xiaoxi River, and Jianjiang River exhibited dual control by soil sulfate and mining-derived inputs. Soil sulfate and sewage influences increased in the middle and lower reaches. Groundwater was predominantly influenced by sewage infiltration and soil, with mining-impacted exceptions at samples G3–G4.

3.3. Isotopic Analysis of Sulfate Sources

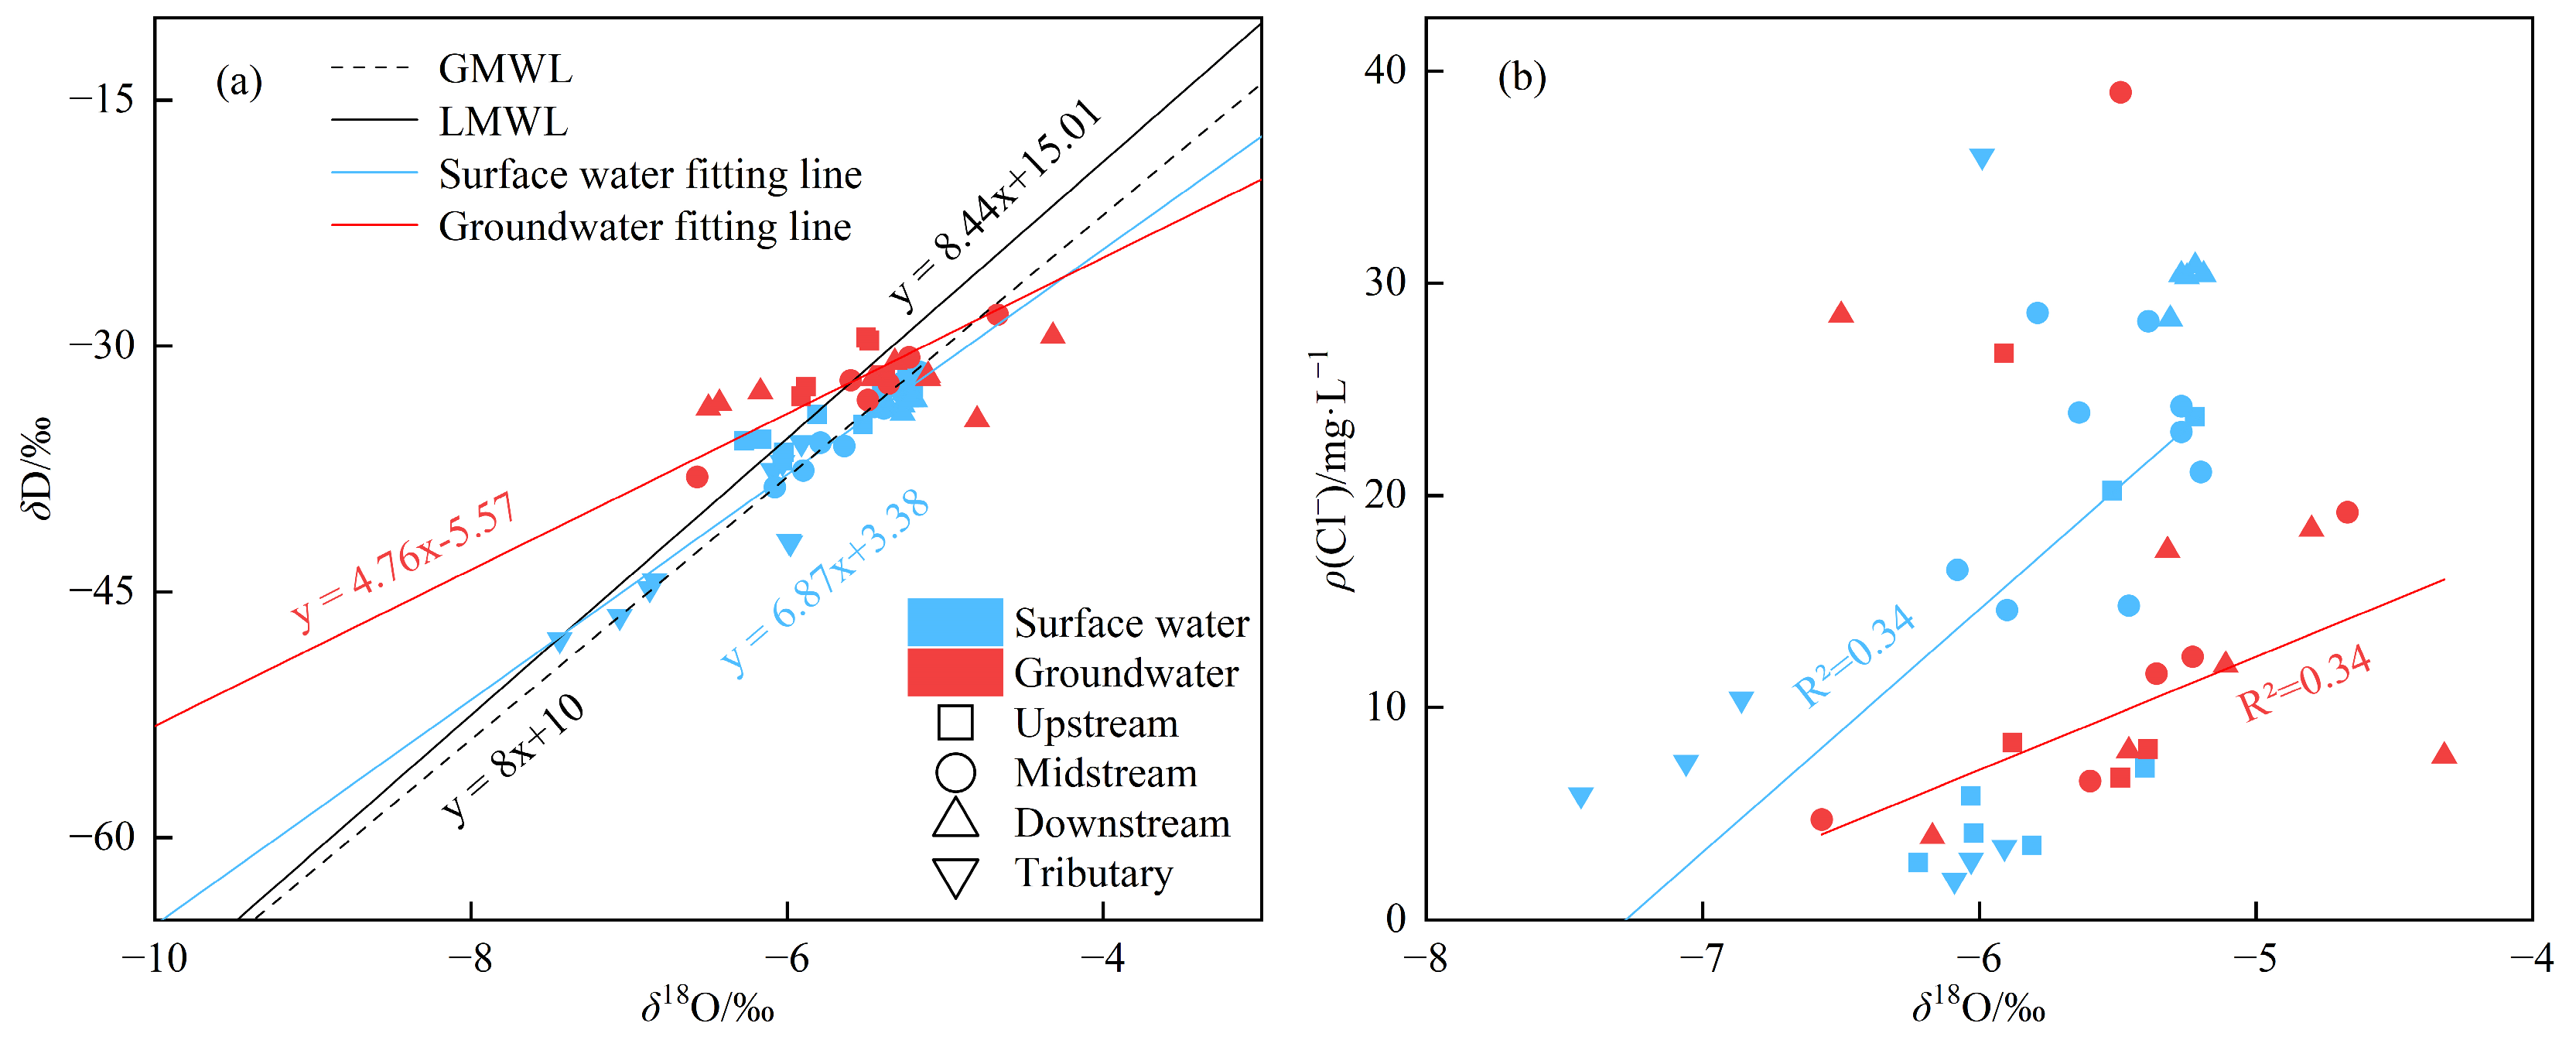
3.3.1. Analysis of Hydrogen and Oxygen Isotopes

δD and δ18O isotopes in water bodies serve as effective tracers for identifying recharge sources and hydraulic connectivity between surface water and groundwater, while also indicating atmospheric precipitation influences on sulfate [43,44]. Surface water in the study area exhibited δD and δ18O ranges of −47.86‰ to −31.60‰ and −7.44‰ to −5.16‰, averaging −36.25‰ and −5.77‰, respectively. Spatially, upper, middle, and lower reaches along with tributaries demonstrated diverse isotopic compositions, with average δD values of −34.63‰, −34.88‰, −33.59‰, and −41.99‰, and corresponding δ18O values of −5.74‰, −5.51‰, −5.26‰ and −6.47‰. The δD values of groundwater samples ranged from −47.86‰ to −31.60‰, with an average of −32.03‰, while the δ18O values ranged from −7.44‰ to −5.16‰, averaging −5.52‰. Spatially, upstream, midstream, and downstream exhibited average δD values of −31.39‰, −32.41‰ and −32.31‰, with corresponding δ18O average of −5.59‰, −5.49‰ and −5.47‰, respectively (Table 2).
Due to the lack of local precipitation isotope values, Changsha’s meteoric water line (LMWL: δD = 8.44δ18O + 15.01 [45]) was adopted as the regional reference. The global meteoric water line (GMWL) is defined as δD = 8δ18O + 10. Surface water and groundwater samples exhibit significant linear correlations between δD and δ18O. Surface water predominantly plot along the GMWL with minor deviations toward the lower right of the LMWL, implying atmospheric precipitation recharge and limited evaporation. Most groundwater samples were near the LMWL, indicating the recharge from atmospheric precipitation. Samples in the downstream show a deviation relative to the LMWL, and a δ18O drift phenomenon exists, suggesting the influence of water–rock interactions and evaporation (Figure 8a). The relationship of δ18O and Cl can indicate the intensity of evaporation [46]. Figure 8b reveals weak positive correlations between Cl concentrations and δ18O values, indicating that evaporation effects were limited.
Hydraulic connectivity exists between surface water and groundwater in the upper, middle, and lower reaches. Groundwater in the downstream exhibited significantly enriched δD and δ18O values relative to mid-upper reaches, suggesting limited hydraulic connectivity with midstream and upstream. Surface water in the upstream exhibited more depleted isotopic signatures than adjacent groundwater, with progressive enrichment along the runoff path. This indicates that groundwater recharges to surface water in the upstream. Sample G5 in the midstream demonstrated marked isotopic enrichment relative to nearby samples S11–S13, revealing poor hydraulic connection. Conversely, isotopic similarities between samples S14–S18 and G6–G10 expressed active surface water-groundwater exchange. In the downstream, surface water exhibited minimal isotopic variation, while groundwater displayed progressive δD and δ18O enrichment, reflecting weak hydraulic connectivity (Figure 8a).

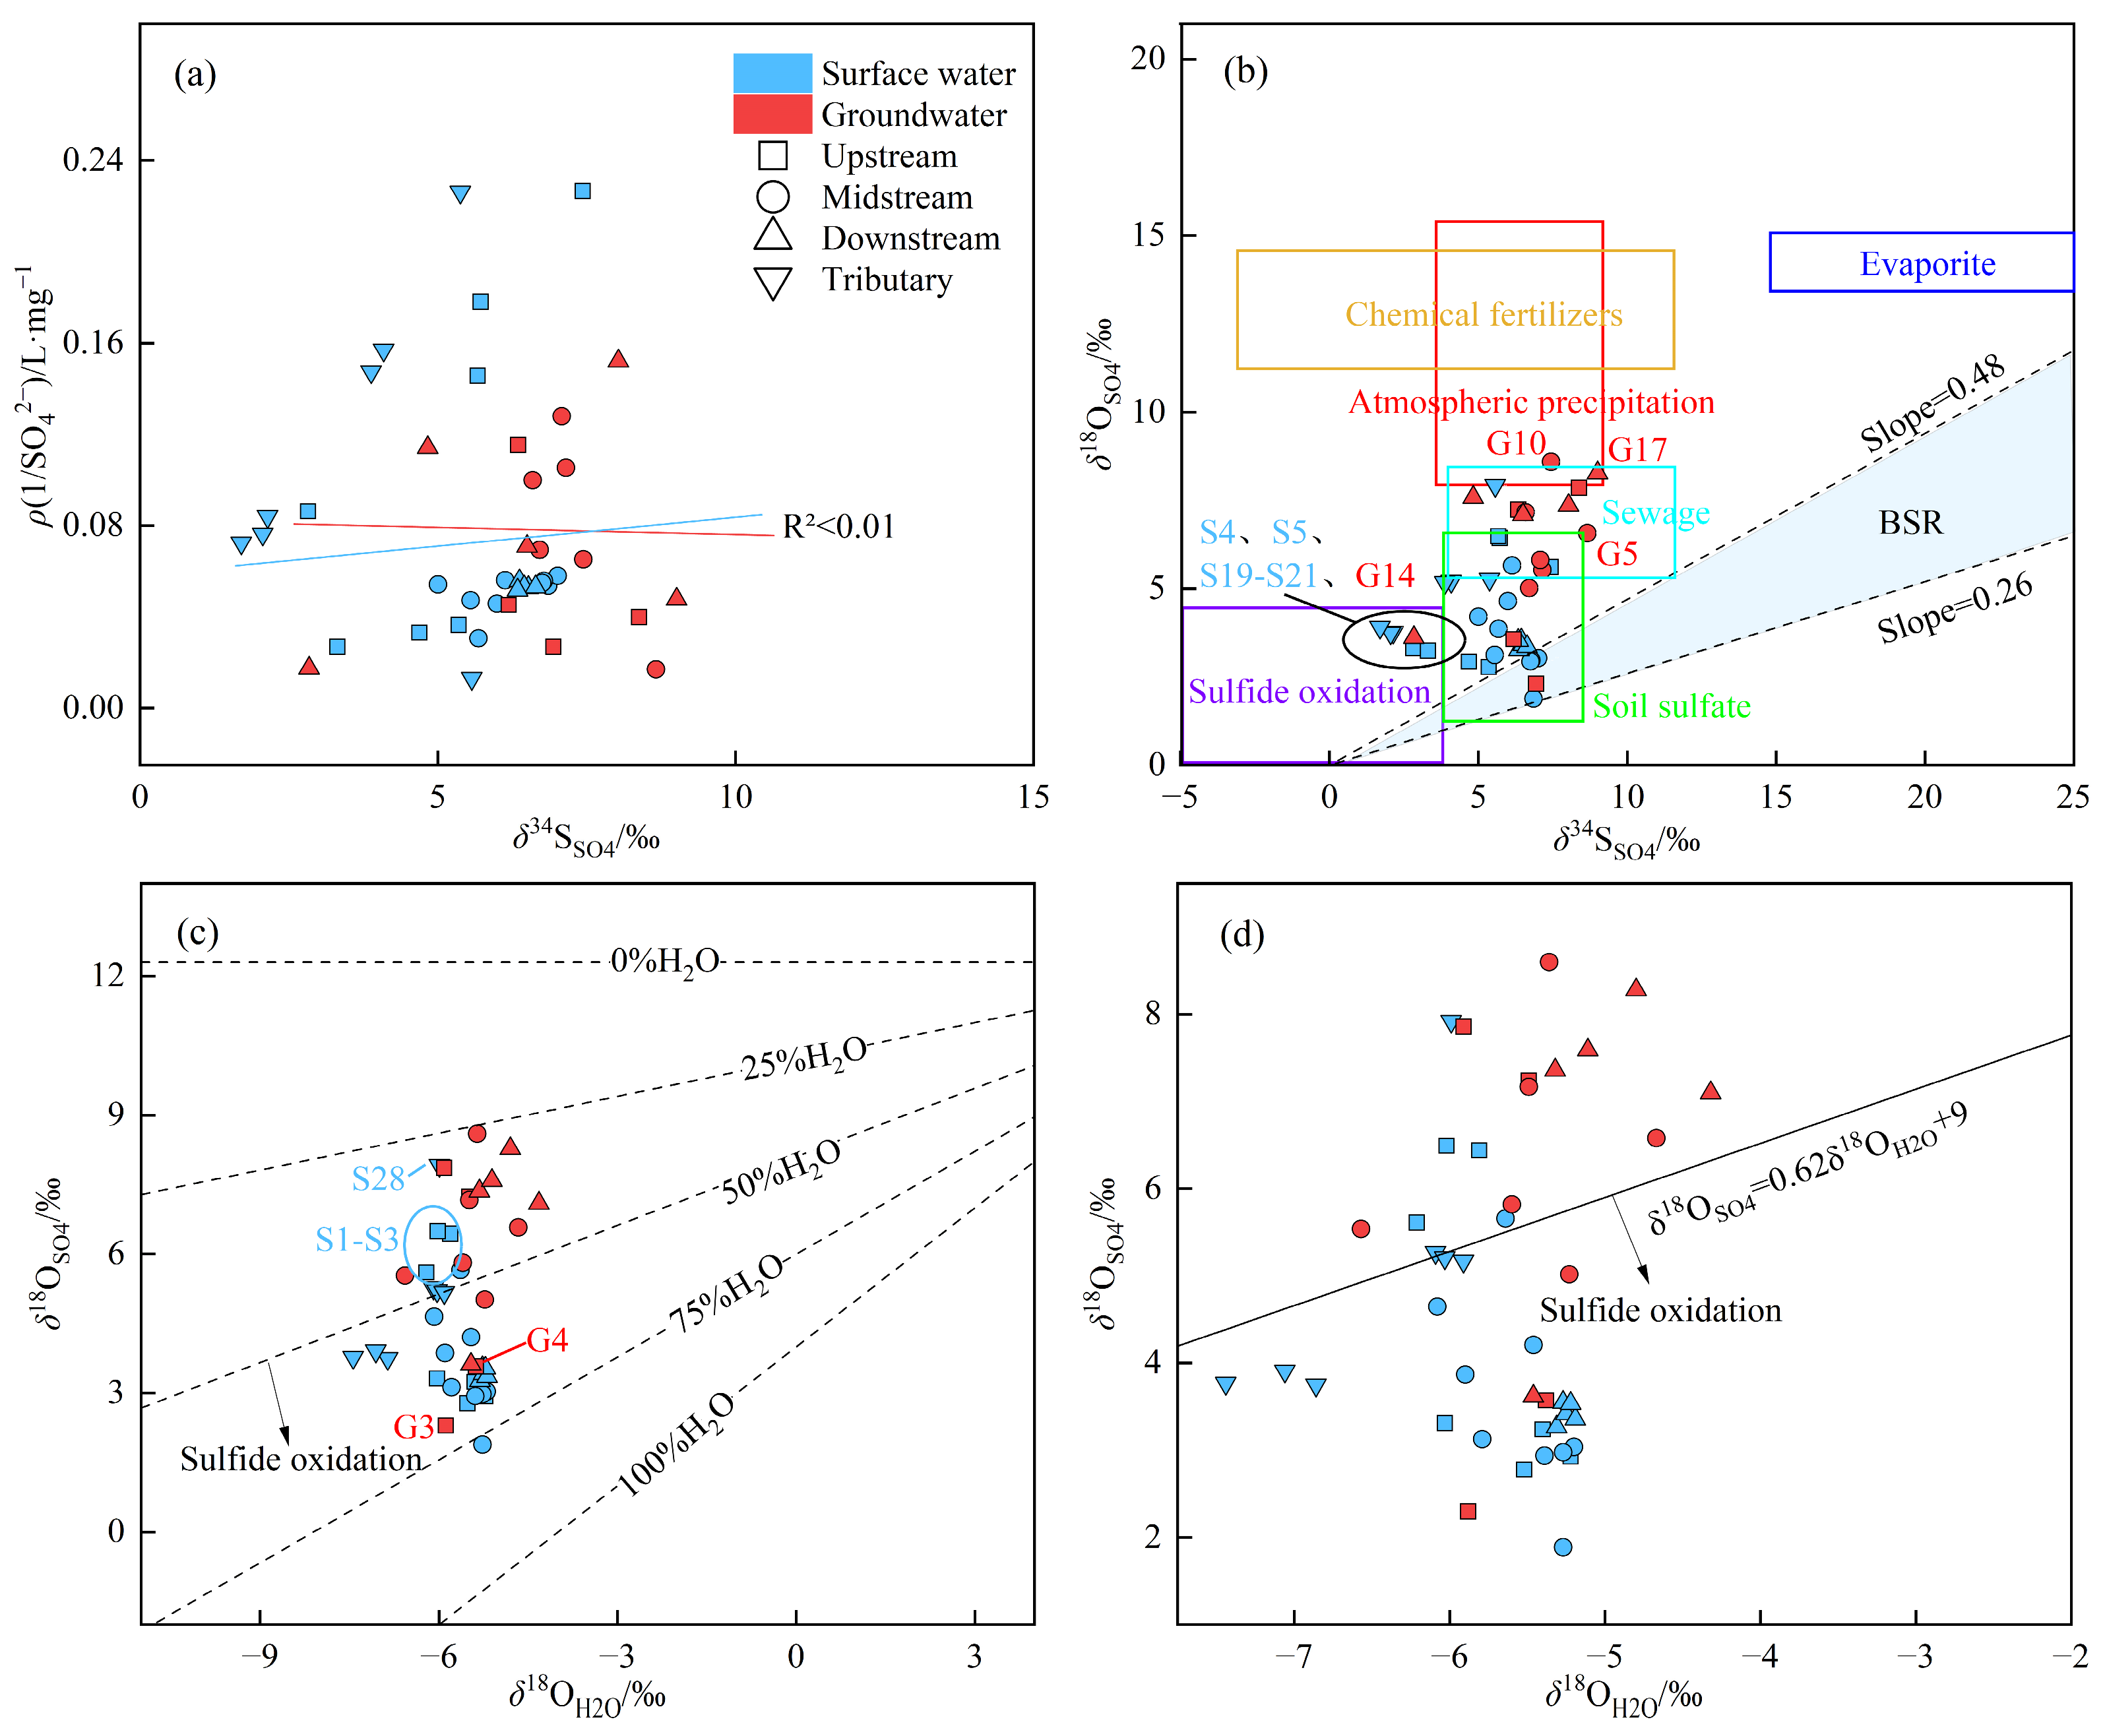
3.3.2. Sulfur and Oxygen Isotopic Composition of Sulfate

The δ34SSO4 and δ18OSO4 values of surface water ranged from 1.70‰ to 7.43‰ and 1.89‰ to 7.92‰, with average values of 5.28‰ and 4.12‰, respectively. In the upper reaches, δ34SSO4 and δ18OSO4 values spanned 2.82–7.43‰ and 2.78–6.49‰, averaging 4.84‰ and 4.65‰. Midstream samples exhibited δ34SSO4 values of 1.70–7.01‰ (mean: 5.14‰) and δ18OSO4 values of 1.89–5.66‰ (mean: 3.65‰). Downstream water showed δ34SSO4 values of 5.57–6.52‰ and δ18OSO4 values of 3.27–7.92‰, with averages of 6.32‰ and 4.18‰. Spatially, δ34SSO4 exhibited an overall increasing trend during the runoff process, contrasting with the decreasing pattern observed for δ18OSO4.
Groundwater exhibited higher δ34SSO4 (2.84–9.01‰) and δ18OSO4 (2.30–8.60‰) values compared to surface water. Upstream samples showed δ34SSO4 values of 6.19–8.38‰ and δ18OSO4 values of 2.30–7.86‰, with averages of 6.97‰ and 5.24‰. In the middle reaches, δ34SSO4 and δ18OSO4 values spanned 6.59–8.66‰ and 5.02–8.60‰, averaging 7.27‰ and 6.45‰. The δ34SSO4 and δ18OSO4 values of downstream samples ranged from 2.84‰ to 9.01‰ and 3.62‰ to 8.28‰, with average values of 6.24‰ and 6.79‰, respectively. Spatially, δ34SSO4 displayed a gradual decrease contrasting with the increasing δ18OSO4 trend, demonstrating inverse variation pattern relative to surface water (Figure 9).

3.3.3. Analysis of Sulfur and Oxygen Isotopes

Sulfate undergoes significant isotopic fractionation predominantly during BSR process, which decreases sulfate concentrations while enriching δ34SSO4 and δ18OSO4 values [47]. Other biogeochemical pathways exhibit minimal fractionation effects. Consequently, sulfate from distinct sources demonstrates characteristic δ34SSO4 and δ18OSO4 signature ranges (Table 3).
Surface water and groundwater in the study area show no significant correlation between δ34SSO4 and 1/SO42−, with most samples outside the BSR-dominated field. This indicates minimal influence of BSR process on δ34SSO4 and δ18OSO4 values, and suggests multiple sources contributing to sulfate. Most samples predominantly fall within soil sulfate and sewage end members, with some falling into sulfide oxidation and atmospheric precipitation domains. This reveals soil sulfate and sewage as primary sulfate sources, alongside sulfide oxidation and atmospheric inputs. The absence of samples in the evaporite range shows that few sulfate inputs derive from evaporite dissolution. No water samples fall within the fertilizer end member, as is related to the predominant use of nitrogen fertilizers in the basin (Figure 10a,b).
Sulfate in surface water was primarily derived from multiple sources, including soil, sulfide oxidation, sewage, and atmospheric precipitation (Figure 10b). Upstream samples (S4, S5) and Jianjiang River samples (S19–S21) plot in the upper-right quadrant of the sulfide oxidation end member. This indicates that sulfide oxidation dominates sulfate contributions in these water samples, accompanied by soil sulfate or sewage inputs. Sample S28, located in an unnamed river, exhibited the highest sulfate concentration (76 mg·L−1) and δ18OSO4 value (7.92‰) among surface water. This suggests sewage as the primary sulfate source, with additional contributions from precipitation and soil. Samples in the downstream showed minimal variation in δ34SSO4 and δ18OSO4 values, with isotopic compositions closely matching soil sulfate, confirming soil as the predominant sulfate source in these samples.
Groundwater shared similar sulfate sources with surface water. Its higher δ34SSO4 and δ18OSO4 values relative to surface water indicate reduced sulfide oxidation and soil but increased sewage and precipitation inputs on sulfate concentrations (Figure 10b). Specifically, sample G5 exhibited high sulfate concentration, δ34SSO4 and δ18OSO4 values, attributable to municipal sewage inputs within Liuyang city. Samples G10 and G17 from open dug wells showed significantly enriched δ18OSO4, indicating inputs from direct atmospheric precipitation. Sample G14 displayed abrupt sulfate concentration increases with depleted δ34SSO4 and δ18OSO4 values relative to adjacent samples, suggesting anthropogenic sulfide inputs like coal combustion.
The relationship between δ18OH2O and δ18OSO4 provides further validation of sulfide oxidation impacts on sulfate in water bodies [51]. Existing studies demonstrated that >50% of oxygen in sulfate derived from sulfide oxidation originates from water [52,53]. Most surface water samples in the study area plot below the 50%H2O reference line, indicating >50% oxygen derivation from water and confirming sulfide oxidation as the dominant sulfate source (Figure 10c). Exceptions include samples S1–S3 and tributary sample S28, which plot above the 50%H2O line, showing limited sulfide oxidation contributions due to absence of a mine drainage recharge. Groundwater samples predominantly plot above the 50%H2O line, suggesting limited sulfide oxidation influence (Figure 10c). Affected by mine drainage, there were obvious contributions from sulfide oxidation in samples G3 and G4.
Balci et al. obtained the upper (δ18OSO4 = 0.62δ18OH2O + 9) and lower (δ18OSO4 = δ18OH2O) limit equations of sulfide oxidation through experiments [54]. Figure 10d shows that most surface water samples fall inside the sulfide oxidation domain, whereas most groundwater resided outside this range. This result is consistent with the analysis of Figure 10c. Furthermore, Δδ18O (δ18OSO4 − δ18OH2O) > 8‰ typically indicates active sulfide oxidation [55]. Surface water and groundwater in the study area exhibited average Δδ18O values of 9.90‰ and 11.62‰, respectively, reaffirming sulfide oxidation as a major sulfate source in water bodies.

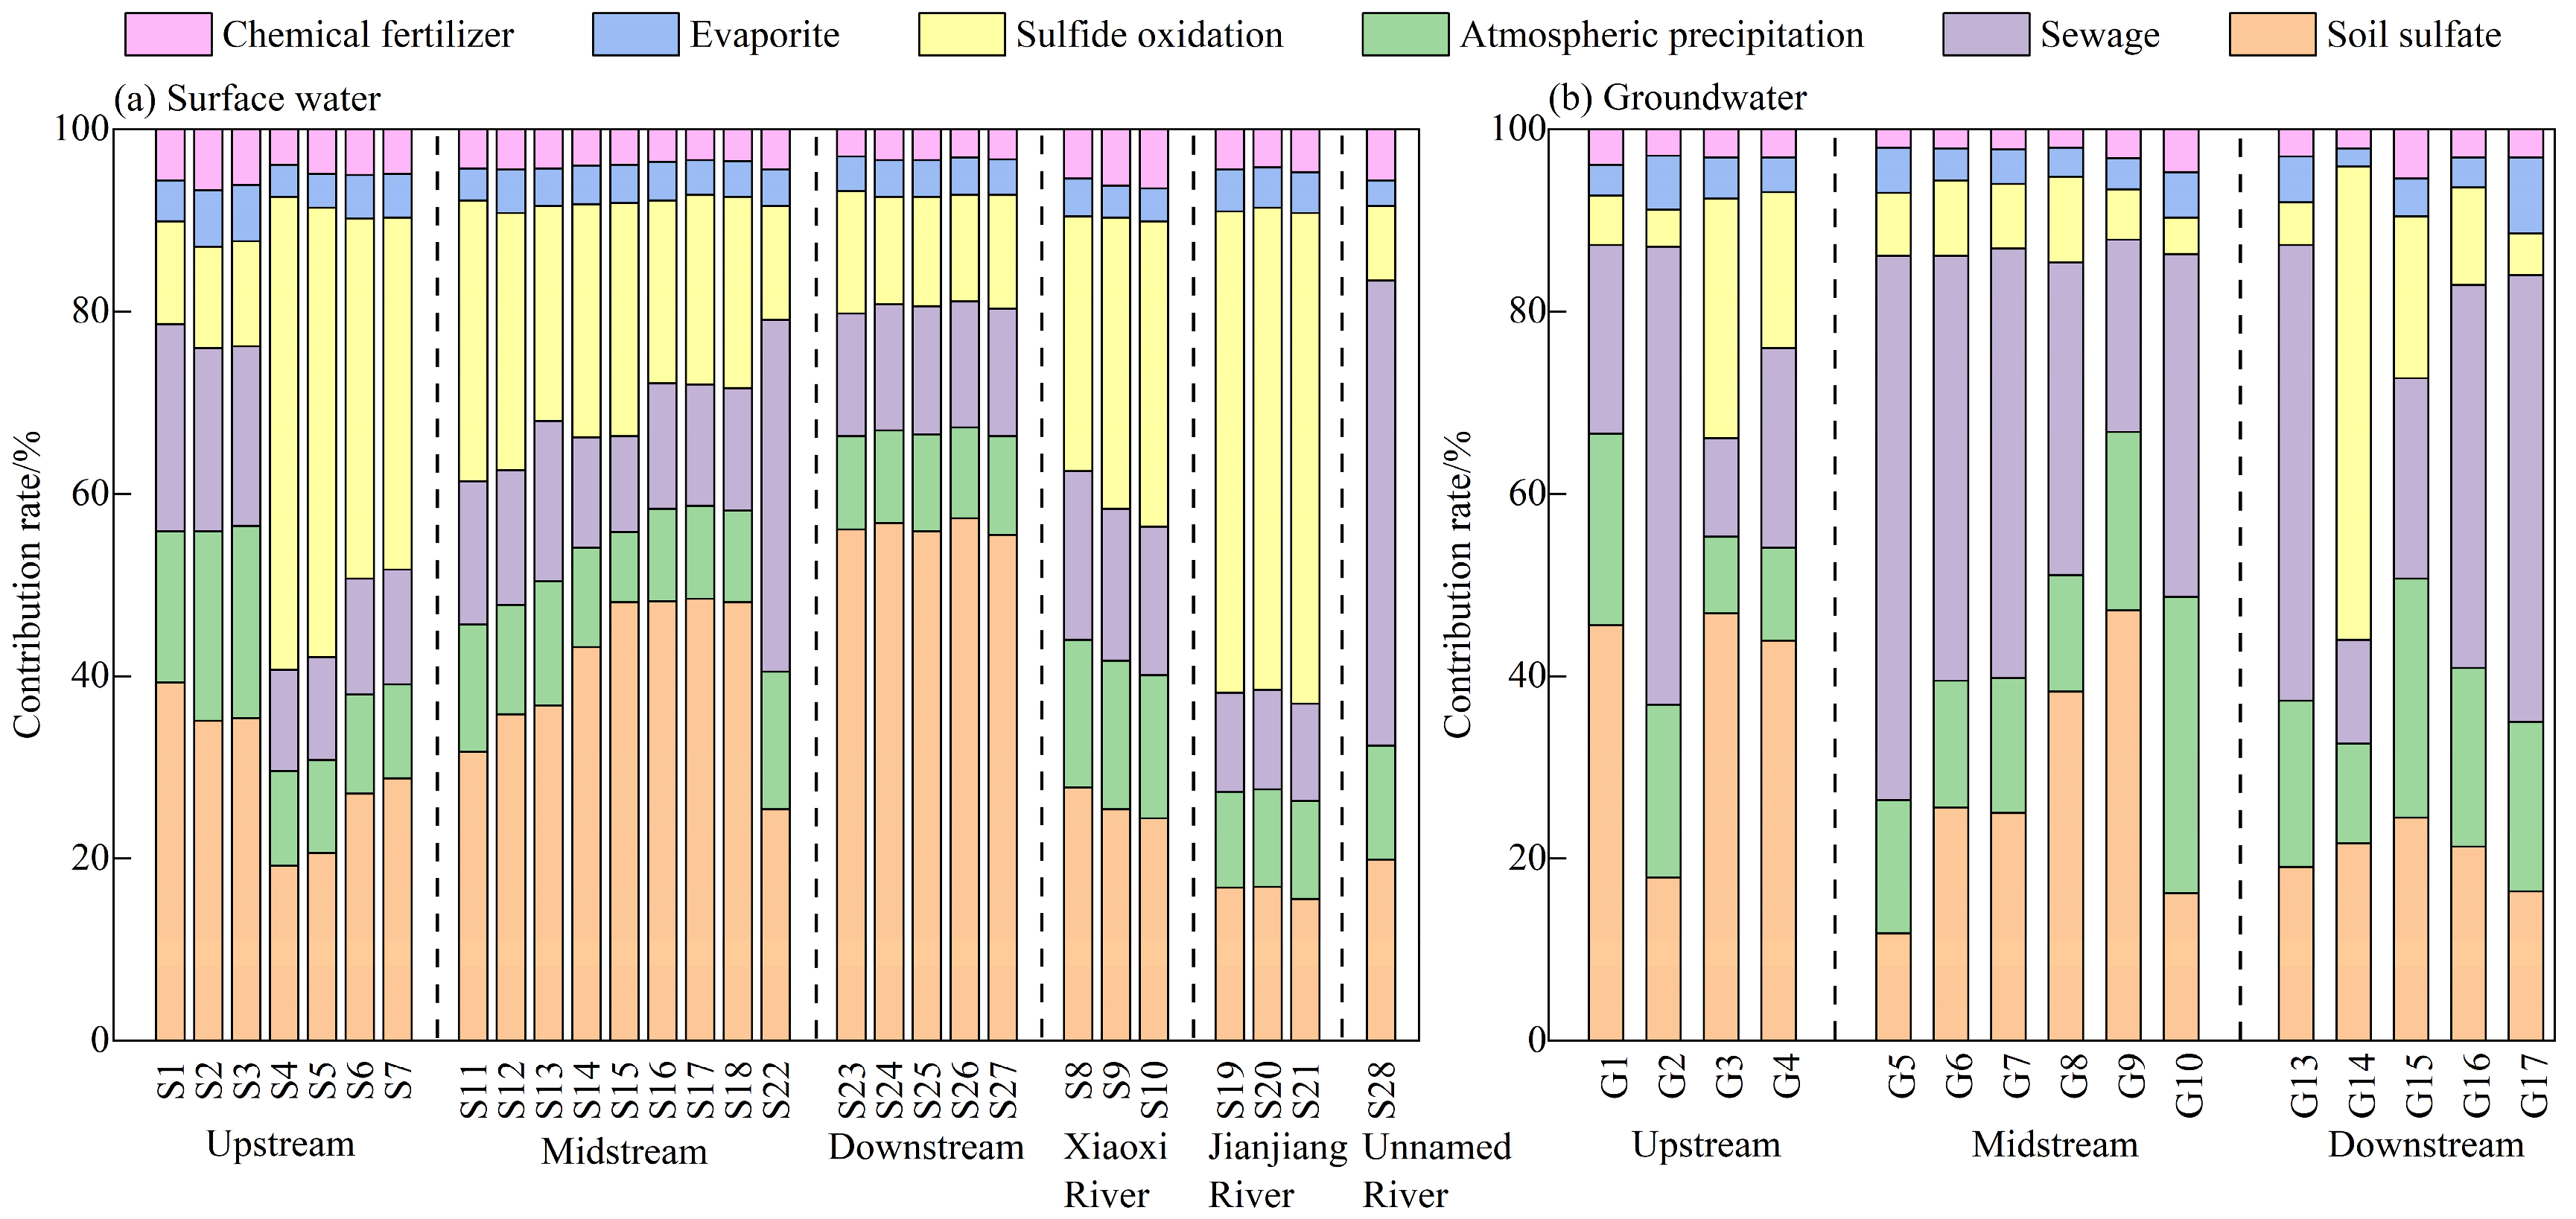
3.3.4. Sulfate Contributions from Different Sources

The preceding analysis of sulfate sources and biogeochemical processes showed that sulfate in the study area was derived from multiple sources. Soil sulfate, sewage discharge, sulfide oxidation, and atmospheric precipitation were the main sources, and minimal contributions originated from evaporites and fertilizers. Given the absence of pronounced BSR effects and negligible isotopic fractionation, the Simmr was employed to quantify different source contributions of sulfate in surface water and groundwater [56].
Quantitative analysis revealed marked spatial heterogeneity in sulfate contributions from different sources of surface water and groundwater (Figure 11). In surface water, sulfate was derived primarily from soil sulfate (35.70%), sulfide oxidation (26.56%), sewage (16.58%), and atmospheric precipitation (12.45%), with negligible contributions from evaporite dissolution (4.21%) and chemical fertilizers (4.50%). Groundwater sulfate originated predominantly from sewage (34.96%) and soil sulfate (28.09%), complemented by atmospheric precipitation (17.35%) and sulfide oxidation (12.25%), while evaporite (4.29%) and chemical fertilizers (3.06%) remain minor sources. Spatially, contributions from soil sulfate in surface water were manifested as downstream > midstream > upstream > tributaries, while sulfide oxidation showed an opposite law. Contributions from sewage and precipitation showed limited fluctuations, with only individual samples displaying significantly elevated contributions. In groundwater, contributions from sewage intensified in midstream and downstream regions, while contributions from soil sulfate diminished along the flow path. Sulfide oxidation and atmospheric precipitation displayed lower contributions except for individual samples.

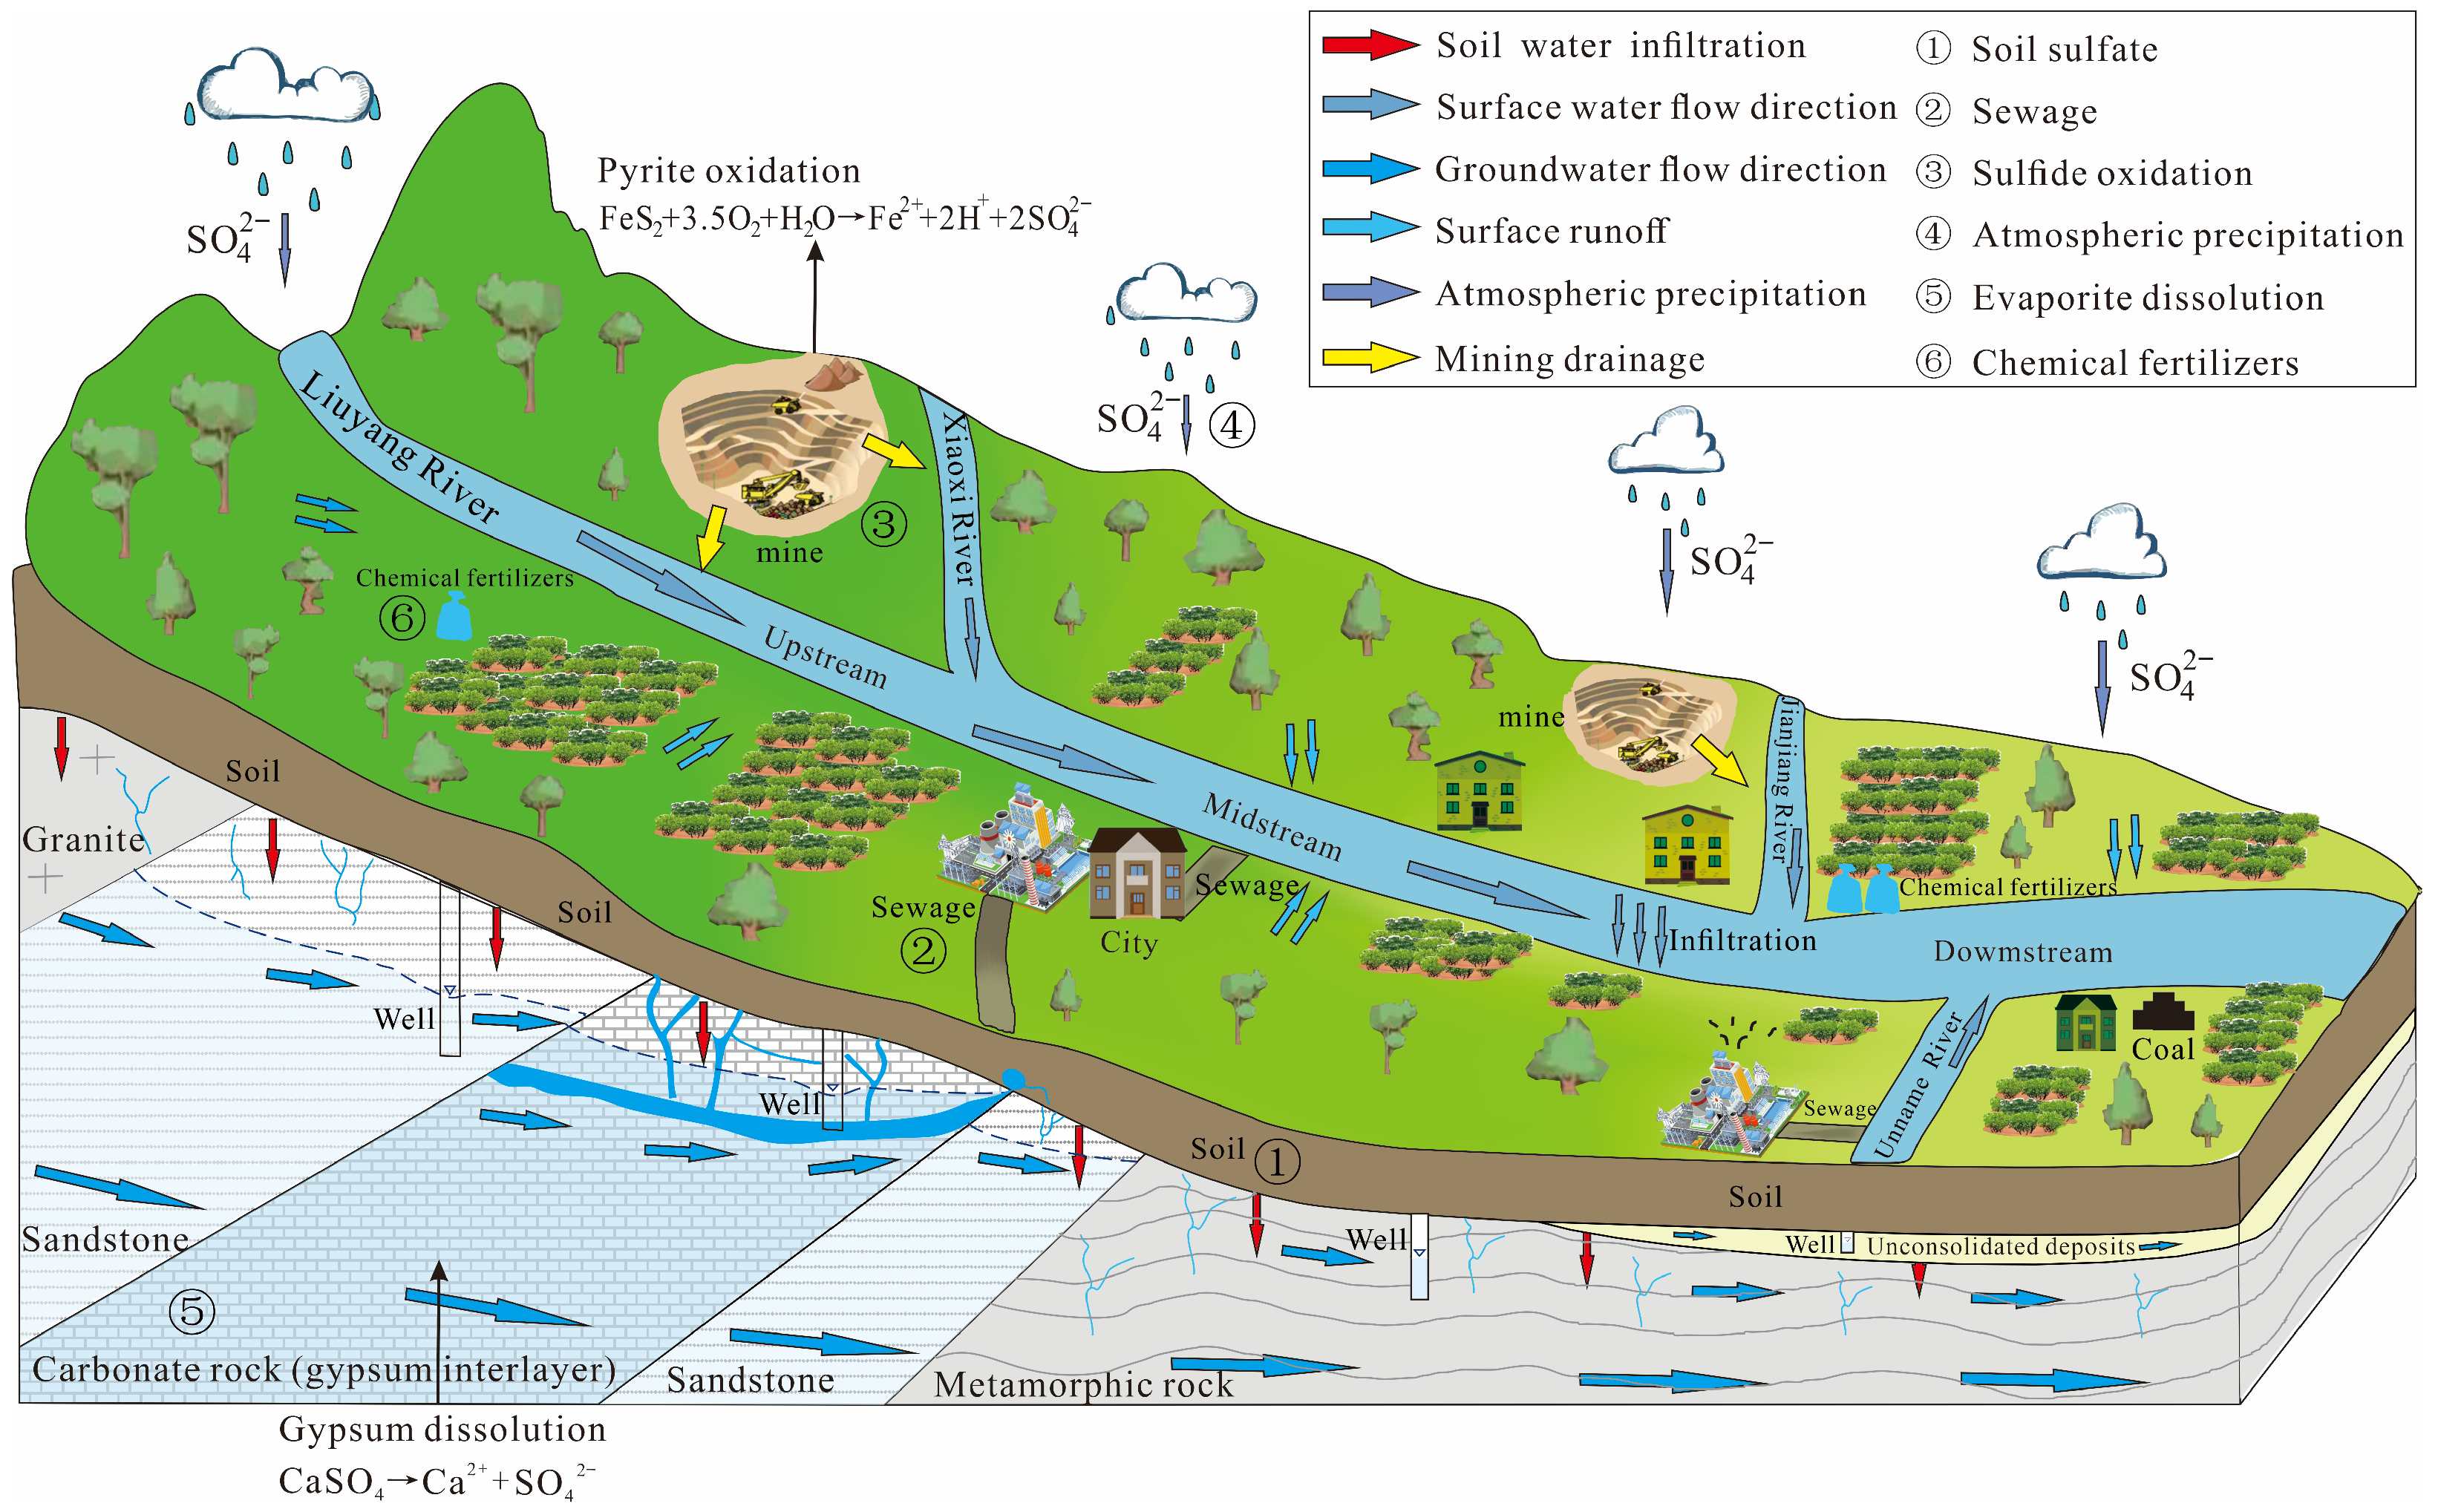
3.4. Sulfate Migration and Transformation

The mid-upper reaches of the study area are surrounded by mountains on three sides with steep slopes. This topography facilitates soil sulfate transport to river through surface runoff (Figure 12a). Upstream areas expose extensive carbonate rocks, characterized by well-developed karst fissures and thin soil cover (Figure 1). These conditions enhance soil sulfate infiltration into groundwater. Downstream regions contain extensive farmland (Figure 12b). Intensive agricultural activities and high precipitation accelerate soil erosion [48]. However, the flat terrain and extensive impermeable surfaces restrict soil sulfate leaching into groundwater [57]. Thus, soil sulfate critically influences sulfate migration in both surface water and groundwater. The contribution of soil sulfate was significantly higher in surface water (35.70%) than groundwater (28.09%), and it was close to 60% when surface water flows to the downstream.
The study area possesses abundant mineral resources. Sulfide oxidation during mining operations constitutes a critical biogeochemical process governing sulfate migration in surface water. Its contribution (26.52%) significantly exceeded that in groundwater (12.25%). This disparity arises because surface water directly receives mining drainage inputs, whereas transport of groundwater sulfate is constrained by limited flow systems and restricted runoff range. Specifically, after flowing through S4 and G3, sulfide-derived contributions increased significantly under the influence of the Qibaoshan mining area, while along the flow path, contributions from sulfide oxidation progressively decreased. Sulfate in Jianjiang River also primarily originated from sulfide oxidation influenced by Guanzhuang mining area. Additionally, sample G14 exhibited anomalously elevated sulfate concentrations and sulfide oxidation contribution. However, no sulfide deposits occur nearby, the contribution from sulfide oxidation may be linked to rural sulfur-rich coal combustion.
Sewage in the study area primarily comprises industrial discharges from chemical industry, paper plants and domestic sewage from rural settlements. It significantly influences sulfate in both surface water and groundwater. Surface water exhibited relatively low contributions from sewage (16.58%), attributable to dominant sulfate inputs from soil and sulfide oxidation. In contrast, sulfate in groundwater was significantly contributed by sewage (34.96%). This correlates with widespread rural wells featuring low water tables that enable sewage infiltration into aquifers via fractures [58]. For example, samples S22, G2 and G5–G7 were collected from the vicinity of towns and urban areas with a large number of industrial sewage discharge sources (Table 4). Sample S28 was collected from the vicinity of a factory. They received substantial industrial and domestic sewage, resulting in higher contributions from sewage (>40%).
The study area receives abundant atmospheric precipitation, serving as the primary recharge source for different water bodies. Precipitation exhibited low and stable sulfate concentrations, contributing moderately to surface water (12.45%) and groundwater (17.26%). Precipitation contributions showed limited spatial variability, primarily controlled by recharge conditions and hydrogeological conditions [26]. For example, aquifer media in G1–G4 and G9–G17 predominantly consist of carbonate and clastic rocks with high permeability coefficient, and part of the wells were exposed to the air during sampling. They can receive more atmospheric precipitation recharge. Conversely, samples G5 and G8 (weathered fissure water in metamorphic rocks) exhibit limited precipitation recharge, resulting in comparatively minor atmospheric contributions to sulfate.
Evaporite and chemical fertilizers showed negligible contributions to sulfate without notable variation in the water bodies of the study area.
In summary, the migration and transformation of sulfate in surface water and groundwater within the study area results from the dual control of natural processes and anthropogenic activities. Soil, sulfide oxidation, sewage, atmospheric precipitation, evaporite, and chemical fertilizers govern sulfate migration and transformation through distinct geochemical processes and physical mixing processes (Figure 13).

4. Conclusions

Surface water and groundwater in the Liuyang River Basin exhibited hydrochemical types dominated by the HCO3-Ca type. Anthropogenic impacts had significantly elevated SO42− proportions in some samples, resulting in the emergence of HCO3·SO4-Ca·Mg and HCO3·SO4-Ca types of water. Sulfate in the water bodies was unevenly distributed in space, and the high value areas were distributed in areas with strong human activities such as mining areas and towns.
The analyses of hydrochemistry and isotopes showed that surface water and groundwater primarily underwent carbonate and silicate rock dissolution, with concurrent sulfide oxidation process. Evaporite dissolution (like gypsum) contributed minimally to sulfate. Both water bodies received atmospheric precipitation recharge and existed hydraulic connectivity, indicating precipitation as a major sulfate source. Mining and agricultural activities significantly influenced sulfate concentrations, where sulfide oxidation, soil sulfate and sewage constituted dominant contributors, while fertilizers inputs showed negligible impacts.
There were distinct variations in the contributions of different sulfate sources. Soil sulfate dominated sulfate inputs in surface water, while sewage constituted the primary contributor in groundwater. The calculation results of the Simmr model revealed that surface water sulfate was derived from soil sulfate (35.70%), sewage (16.58%), sulfide oxidation (26.56%), and atmospheric precipitation (12.45%), whereas groundwater sulfate originated from sewage (34.96%), soil sulfate (28.09%), atmospheric precipitation (17.35%), and sulfide oxidation (12.25%).
The migration and transformation of sulfate in surface water and groundwater were jointly influenced by natural processes and anthropogenic activities. Key controlling factors included geochemical processes (sulfide oxidation and evaporite dissolution) and physical mixing (soil, sewage, atmospheric precipitation, and fertilizers). In the absence of human influence, sulfate primarily originated from soil leaching and precipitation inputs. However, when water flowed through anthropogenically impacted zones like mining areas and towns, sulfide oxidation and sewage emerged as dominant factors for the sulfate migration and transformation.
However, this study only conducted sampling and analysis of surface water and groundwater in the Liuyang River Basin during the dry season, and it lacked comparative analysis between wet and dry seasons. Future research should strengthen investigations in the wet season to reveal temporal variations in sulfate distribution and sources in the basin. Additionally, future studies should perform direct measurements of isotope signatures from potential sulfate sources in the study area to enhance source identification accuracy.

Author Contributions

Conceptualization, L.W. and Y.Z.; methodology, L.W. and Y.L.; validation, L.W. and W.L.; formal analysis, L.W.; investigation, Y.L. and H.Z.; resources, Y.Z. and H.Z.; data curation, L.W.; writing—original draft preparation, L.W.; writing—review and editing, L.W. and Y.L.; visualization, Y.Z.; supervision, W.L.; project administration, Y.L.; funding acquisition, Y.Z. All authors have read and agreed to the published version of the manuscript.

Funding

This research was funded by the Natural Science Foundation of Hubei Province of China (No.2023AFD216) and Geological survey project of China Geological Survey (No.DD20230076).

Data Availability Statement

The data presented in this study are available on request from the corresponding author. The data are not publicly available due to privacy or ethical restrictions.

Conflicts of Interest

The authors declare no conflicts of interest.

References

  1. Goldscheider, N.; Chen, Z.; Auler, A.S.; Bakalowicz, M.; Broda, S.; Drew, D.; Hartmann, J.; Jiang, J.; Moosdorf, N.; Stevanovic, Z.; et al. Global distribution of carbonate rocks and karst water resources. Hydrogeol. J. 2020, 28, 1661–1677. [Google Scholar] [CrossRef]
  2. Li, X.; Pu, X.; Wang, W.; Dong, X.; Zhang, Y.; Wang, J.; Wang, Y.; Meng, M. Surface water environmental carrying capacity and surface water quality based on economy-society-environment nexus-Evidence from China. Water-Energy Nexus 2023, 6, 231–243. [Google Scholar] [CrossRef]
  3. Wang, L.; Liu, S.; Ma, S.; Yang, Z.; Chen, Y.; Gao, W.; Liu, Q.; Zhang, Y. Quantile regression illuminates the heterogeneous effect of water quality on phytoplankton in Lake Taihu, China. Water 2024, 16, 2570. [Google Scholar] [CrossRef]
  4. Man, K.; Ma, M.; Xu, J. Research on the mechanism of sulfate pollution of groundwater in Jiaozuo area. Appl. Mech. Mater. 2014, 3517, 436–439. [Google Scholar] [CrossRef]
  5. Gani, A.; Hussain, A.; Pathak, S.; Ahmed, S.; Omar, P.J. Impact of pollutants on groundwater quality and health risk assessment of Quaternary aquifers in Northern India. J. Hazard. Toxic Radioact. Waste 2025, 29, 4024039. [Google Scholar] [CrossRef]
  6. Filipović, M.; Terzić, J.; Reberski, J.L.; Vlahović, I. Utilizing a multi-tracer method to investigate sulphate contamination: Novel insights on hydrogeochemical characteristics of groundwater in intricate karst systems. Groundw. Sustain. Dev. 2024, 27, 101350. [Google Scholar] [CrossRef]
  7. Chen, X.; Zheng, L.; Dong, X.; Jiang, C.; Wei, X. Sources and mixing of sulfate contamination in the water environment of a typical coal mining city, China: Evidence from stable isotope characteristics. Environ. Geochem. Health 2020, 42, 2865–2879. [Google Scholar] [CrossRef]
  8. Kinnunen, P.; Kyllönen, H.; Kaartinen, T.; Mäkinen, J.; Heikkinen, J.; Miettinen, V. Sulphate removal from mine water with chemical, biological and membrane technologies. Water Sci. Technol. 2018, 2017, 194–205. [Google Scholar] [CrossRef]
  9. Mao, H.; Wang, C.; Qu, S.; Liao, F.; Wang, G.; Shi, Z. Source and evolution of sulfate in the multi-layer groundwater system in an abandoned mine—Insight from stable isotopes and Bayesian isotope mixing model. Sci. Total Environ. 2023, 859, 160368. [Google Scholar] [CrossRef]
  10. Klipsch, S.; Herwartz, D.; Voigt, C.; Münker, C.; Chong, G.; Böttcher, M.E.; Staubwasser, M. Sulfate sources, biologic cycling, and mobility in Atacama Desert soils revealed by isotope signatures. Glob. Planet. Change 2023, 230, 104290. [Google Scholar] [CrossRef]
  11. Guan, H.; Xiao, H.; Xiao, H.; Xu, Y. The oxygen and sulfur isotopic compositions of soluble sulfate in the needles of Pinus massoniana Lamb.: Source discrimination and contribution estimation. J. Geochem. Explor. 2020, 208, 106402. [Google Scholar] [CrossRef]
  12. Zhang, Q.; Wang, H.; Lu, C. Tracing sulfate origin and transformation in an area with multiple sources of pollution in northern China by using environmental isotopes and Bayesian isotope mixing model. Environ. Pollut. 2020, 265, 115105. [Google Scholar] [CrossRef]
  13. Tostevin, R.; Turchyn, A.V.; Farquhar, J.; Johnston, D.T.; Eldridge, D.L.; Bishop, J.K.B.; McIlvin, M. Multiple sulfur isotope constraints on the modern sulfur cycle. Earth Planet. Sci. Lett. 2014, 396, 14–21. [Google Scholar] [CrossRef]
  14. Hao, Y.; Pang, Z.; Gong, Q.; Li, N.; Liao, D.; Luo, Z. Oxygen and sulfur isotope systematics of dissolved sulfate in a nonvolcanic geothermal system: Sulfate source, evolution and impact on geothermometers. Water 2025, 17, 788. [Google Scholar] [CrossRef]
  15. Mizutani, Y.; Rafter, T.A. Isotopic behaviour of sulphate oxygen in the bacterial reduction of sulphate. Geochem. J. 1973, 6, 183–191. [Google Scholar] [CrossRef]
  16. Jiang, C.; Cheng, L.; Li, C.; Zheng, L. A hydrochemical and multi-isotopic study of groundwater sulfate origin and contribution in the coal mining area. Ecotoxicol. Environ. Saf. 2022, 248, 114286. [Google Scholar] [CrossRef] [PubMed]
  17. Zheng, L.; Chen, X.; Dong, X.; Wei, X.; Jiang, C.; Tang, Q. Using δ34S-SO4 and δ18O-SO4 to trace the sources of sulfate in different types of surface water from the Linhuan coal-mining subsidence area of Huaibei, China. Ecotoxicol. Environ. Saf. 2019, 181, 231–240. [Google Scholar] [CrossRef]
  18. Pu, J.; Wang, S.; Zhang, L. Combining hydrochemistry and isotopes to unravel sulfate sources in karst groundwater: A case study from southwest China. Sci. Total Environ. 2021, 786, 147312. [Google Scholar]
  19. Han, D.; Song, X.; Currell, J.M. Identification of anthropogenic and natural inputs of sulfate into a karstic coastal groundwater system in northeast China: Evidence from major ions, δ13CDIC and δ34SSO4. Hydrol. Earth Syst. Sci. 2016, 20, 1983–1999. [Google Scholar] [CrossRef]
  20. Wang, H.; Zhang, Q. Research advances in identifying sulfate contamination sources of water environment by using stable isotopes. Int. J. Environ. Res. Public Health 2019, 16, 1914. [Google Scholar] [CrossRef]
  21. Zhang, D.; Yang, J.; Huang, X.; Liu, S.; Zhang, Z. Sources of dissolved heavy metals in river water of the Yiluo River Basin based on sulfur isotope of sulfate. China Environ. Sci. 2019, 39, 2549–2559. [Google Scholar] [CrossRef]
  22. Zhang, D.; Xue, T.; Xiao, J.; Chai, N.; Gong, S. Significant influence of water diversion and anthropogenic input on riverine sulfate based on sulfur and oxygen isotopes. J. Hazard. Mater. 2024, 461, 132622. [Google Scholar] [CrossRef]
  23. Sun, J.; Takahashi, Y.; Strosnider, W.H.J.; Kogure, T.; Wu, P.; Cao, X. Tracing and quantifying contributions of end members to karst water at a coalfield in southwest China. Chemosphere 2019, 234, 777–788. [Google Scholar] [CrossRef]
  24. Dogramaci, S.; McLean, L.; Skrzypek, G. Hydrochemical and stable isotope indicators of pyrite oxidation in carbonate-rich environment; the Hamersley Basin, Western Australia. J. Hydrol. 2017, 545, 288–298. [Google Scholar] [CrossRef]
  25. Zak, D.; Hupfer, M.; Cabezas, A.; Jurasinski, G.; Audet, J.; Kleeberg, A.; McInnes, R.; Kristiansen, S.M.; Petersen, R.J.; Liu, H.; et al. Sulphate in freshwater ecosystems: A review of sources, biogeochemical cycles, ecotoxicological effects and bioremediation. Earth-Sci. Rev. 2021, 212, 103446. [Google Scholar] [CrossRef]
  26. Cheng, L.; Jiang, C.; Li, C.; Zheng, L. Tracing sulfate source and transformation in the groundwater of the linhuan coal mining area, huaibei coalfield, China. Int. J. Environ. Res. Public Health 2022, 19, 14434. [Google Scholar] [CrossRef]
  27. Bao, Y.; Pang, Z.; Huang, T.; Li, Y.; Tian, J.; Luo, J.; Qian, T. Chemical and isotopic evidences on evaporite dissolution as the origin of high sulfate water in a karst geothermal reservoir. Appl. Geochem. 2022, 145, 105419. [Google Scholar] [CrossRef]
  28. Otero, N.; Canals, À.; Soler, A. Using dual-isotope data to trace the origin and processes of dissolved sulphate: A case study in Calders stream (Llobregat basin, Spain). Aquat. Geochem. 2007, 13, 109–126. [Google Scholar] [CrossRef]
  29. Parnell, A.C.; Inger, R.; Bearhop, S.; Jackson, A.L. Source partitioning using stable isotopes: Coping with too much variation. PLoS ONE 2010, 5, e9672. [Google Scholar] [CrossRef] [PubMed]
  30. Peng, Y.; Zou, L.; Tang, Y.; Chen, H.; Tang, Y.; Yu, L.; Li, H.; Liu, F. Assessment and temporospatial characteristics of water quality in Liuyang River based on homogeneity. Hunan Agric. Sci. 2021, 10, 50–57. [Google Scholar] [CrossRef]
  31. Lin, Y.; Wang, Y.; Wu, Y.; Xu, B. Analyzing the source of sulfate in karst groundwater based on a Bayesian stable isotope mixing model: A case study of Xujiagou Spring Area, Northern China. Water 2025, 17, 794. [Google Scholar] [CrossRef]
  32. Hu, J.; Chen, J.; Xu, D.; Wu, C.; Zhang, K.; Liu, J.; Liu, A.; Liu, C. Age and sources of the ore-forming material for the Qibaoshan Cu-polymetallic deposit in Hu’nan Province: Evidence from quartz vein Rb-Sr isotopic dating and S-Pb isotopes. Geol. Bull. China 2017, 36, 857–866. [Google Scholar] [CrossRef]
  33. Zhang, D.; Liu, C. A preliminary study on sulfate reduction bacteria behaviors in groundwater by sulfur and carbon isotopes: A case study in Jiaozuo City, China. Ecotoxicology 2014, 23, 2014–2024. [Google Scholar] [CrossRef]
  34. Gibbs, R.J. Mechanisms controlling world water chemistry. Science 1970, 170, 1088. [Google Scholar] [CrossRef]
  35. Gaillardet, J.; Dupre, B.; Louvat, P.; Allègre, C.J. Global silicate weathering and CO2 consumption rates deduced from the chemistry of large rivers. Chem. Geol. 1999, 159, 3–30. [Google Scholar] [CrossRef]
  36. Olea-Olea, S.; Silva-Aguilera, R.A.; Alcocer, J.; Escolero, O.; Morales-Casique, E.; Florez-Peñaloza, J.R.; Almora-Fonseca, K.A.; Oseguera, L.A. Water–rock interaction processes in groundwater and flows in a maar lake in Central Mexico. Water 2024, 16, 715. [Google Scholar] [CrossRef]
  37. Yang, Y.; Meng, Z.; Jiao, W. Hydrological and pollution processes in mining area of Fenhe river basin in China. Environ. Pollut. 2018, 234, 743–750. [Google Scholar] [CrossRef]
  38. Spence, J.; Telmer, K. The role of sulfur in chemical weathering and atmospheric CO2 fluxes: Evidence from major ions, δ13C-DIC, and δ34S-SO4 in rivers of the Canadian Cordillera. Geochim. Cosmochim. Acta 2005, 69, 5441–5458. [Google Scholar] [CrossRef]
  39. Ren, K.; Zeng, J.; Liang, J.; Yuan, D.; Jiao, Y.; Peng, C.; Pan, X. Impacts of acid mine drainage on karst aquifers: Evidence from hydrogeochemistry, stable sulfur and oxygen isotopes. Sci. Total Environ. 2021, 761, 143223. [Google Scholar] [CrossRef]
  40. Tang, L.; Yao, R.; Zhang, Y.; Ding, W.; Wang, J.; Kang, J.; Liu, G.; Zhang, W.; Li, X. Hydrochemical analysis and groundwater suitability for drinking and irrigation in an arid agricultural area of the northwest China. J. Contam. Hydrol. 2023, 259, 104256. [Google Scholar] [CrossRef]
  41. Lu, T.; Li, R.; Ferrer, A.S.N.; Xiong, S.; Zou, P.; Peng, H. Hydrochemical characteristics and quality assessment of shallow groundwater in Yangtze River Delta of eastern China. Environ. Sci. Pollut. Res. 2022, 29, 57215–57231. [Google Scholar] [CrossRef]
  42. Liu, C.; Lang, Y.; Satake, H.; Wu, J.; Li, S. Identification of anthropogenic and natural inputs of sulfate and chloride into the karstic groundwater of Guiyang, SW China: Combined δ37Cl and δ34S approach. Environ. Sci. Technol. 2008, 42, 5421–5427. [Google Scholar] [CrossRef] [PubMed]
  43. Liu, Y.; Zhang, C.; Jiang, J.; Zhang, Y.; Wang, G.; Xu, L.; Qu, Z. Interaction between groundwater and surface water in the Qujiang River Basin in China: Evidence from chemical isotope measurements. Water 2023, 15, 3932. [Google Scholar] [CrossRef]
  44. Zhang, C.; Li, X.; Wang, Z.; Hou, X.; Ma, J.; Gao, M.; Bai, Z.; Fu, C.; Gui, C.; Zuo, X. Combining stable isotope (2H, 18O, and 87Sr/86Sr) and hydrochemistry to understand hydrogeochemical processes in karst groundwater system, Xin’an, northern China. Environ. Earth Sci. 2023, 82, 224. [Google Scholar] [CrossRef]
  45. Xie, Y.; Zhang, X.; Yao, T.; Huang, H. Monitoring and analysis of stable isotopes of the near surface water vapor in Changsha. Environ. Sci. 2016, 37, 475–481. [Google Scholar] [CrossRef]
  46. Sharma, M.K.; Kumar, P.; Prajapati, P.; Bhanot, K.; Wadhwa, U.; Tomar, G.; Goyal, R.; Prasad, B.; Sharma, B. Study of hydrochemical and geochemical characteristics and solute fluxes in Upper Ganga Basin, India. J. Asian Earth Sci. X 2022, 8, 100108. [Google Scholar] [CrossRef]
  47. Torres-Martínez, J.A.; Mora, A.; Mahlknecht, J.; Kaown, D.; Barceló, D. Determining nitrate and sulfate pollution sources and transformations in a coastal aquifer impacted by seawater intrusion—A multi-isotopic approach combined with self-organizing maps and a Bayesian mixing model. J. Hazard. Mater. 2021, 417, 126103. [Google Scholar] [CrossRef]
  48. Zhang, D.; Li, X.; Zhao, Z.; Liu, C. Using dual isotopic data to track the sources and behaviors of dissolved sulfate in the western North China plain. Appl. Geochem. 2015, 52, 43–56. [Google Scholar] [CrossRef]
  49. Li, X.; Zhou, A.; Gan, Y.; Yu, T.; Wang, D.; Liu, Y. Controls on the δ34S and δ18O of dissolved sulfate in the Quaternary aquifers of the North China Plain. J. Hydrol. 2011, 400, 312–322. [Google Scholar] [CrossRef]
  50. Hosono, T.; Tokunaga, T.; Tsushima, A.; Shimada, J. Combined use of δ13C, δ15N, and δ34S tracers to study anaerobic bacterial processes in groundwater flow systems. Water Res. 2014, 54, 284–296. [Google Scholar] [CrossRef]
  51. Saka, D.; Antwi, E.O.; Skrzypek, G.; Adu-Gyamfi, J.; Heng, L.; Attiogbe, F. Tracing sulfate sources in a tropical agricultural catchment with a stable isotope Bayesian mixing model. Sci. Total Environ. 2024, 951, 175502. [Google Scholar] [CrossRef]
  52. Zhang, K.; Shi, Z.; Ding, X.; Ge, L.; Xiong, M.; Zhang, Q.; Lai, W.; Ge, L. Identification of anthropogenic and natural inputs of sulfate into river system of carbonate Zn-Pb mining area in southwest China: Evidence from hydrochemical composition, δ34SSO4 and δ18OSO4. Water 2024, 16, 2311. [Google Scholar] [CrossRef]
  53. Cao, X.; Wu, P.; Zhou, S.; Sun, J.; Han, Z. Tracing the origin and geochemical processes of dissolved sulphate in a karst-dominated wetland catchment using stable isotope indicators. J. Hydrol. 2018, 562, 210–222. [Google Scholar] [CrossRef]
  54. Balci, N.; Shanks, W.C.; Mayer, B.; Mandernack, K.W. Oxygen and sulfur isotope systematics of sulfate produced by bacterial and abiotic oxidation of pyrite. Geochim. Cosmochim. Acta 2007, 71, 3796–3811. [Google Scholar] [CrossRef]
  55. Sun, J.; Kobayashi, T.; Strosnider, W.H.J.; Wu, P. Stable sulfur and oxygen isotopes as geochemical tracers of sulfate in karst waters. J. Hydrol. 2017, 551, 245–252. [Google Scholar] [CrossRef]
  56. Kong, J.; Zhou, Z.; Xie, R.; Cao, W. Tracing the source and behaviour of sulphate in karst reservoirs, using stable isotopes and Bayesian isotopic-mixing models. Sci. Total Environ. 2024, 958, 177994. [Google Scholar] [CrossRef]
  57. Zhang, J. Identification of Nitrate and Sulfate Sources and Their Increasing Mechanism in Karst Water System of Jinan Spring Catchment Based on Hydrochemistry and Multi-Isotopes. Doctor’s Thesis, China University of Geosciences, Wuhan, China, 2022. [Google Scholar]
  58. Torres-Martínez, J.A.; Mora, A.; Knappett, P.S.K.; Ornelas-Soto, N.; Mahlknecht, J. Tracking nitrate and sulfate sources in groundwater of an urbanized valley using a multi-tracer approach combined with a Bayesian isotope mixing model. Water Res. 2020, 182, 115962. [Google Scholar] [CrossRef]
  59. Chen, Y. Present Situation of Environmental Quality and Control Measures in Liuyang River Section. Master’s Thesis, Hunan Agricultural University, Changsha, China, 2017. [Google Scholar]
Figure 2. Piper triplex map in water bodies of the study area.
Water 17 02105 g002
Figure 3. Box diagram of SO42− concentration in water bodies of the study area.
Water 17 02105 g003
Figure 4. Spatial distribution of SO42− concentration in water bodies of the study area.
Water 17 02105 g004
Figure 5. (a,b) Gibbs diagrams in water bodies of the study area.
Water 17 02105 g005
Figure 6. The relationship between molar ratios of HCO3/Na+ and Ca2+/Na+ in water bodies of the study area.
Water 17 02105 g006
Figure 7. The ratio relationships of (a) Ca2+ and SO42−; (b) Ca2+ and HCO3; (c) [Ca2+] + [Mg2+] and [SO42−] + [HCO3]; (d) Na+ and SO42−; (e) TDS and SO42−; (f) TH and SO42−; (g) Mg2+/Ca2+ and SO42−; (h) NO3/Ca2+ and SO42−/Ca2+; (i) SO42−/Cl and Cl in water bodies of the study area.
Water 17 02105 g007
Figure 8. The relationships of (a) δ18O and δD and (b) δ18O and Cl in water bodies of the study area.
Water 17 02105 g008
Figure 9. Spatial distributions of (a) δ34SSO4 and (b) δ18OSO4 in water bodies of the study area.
Water 17 02105 g009
Figure 10. The relationships of (a) δ34SSO4 vs. 1/SO42−, (b) δ34SSO4 vs. δ18OSO4 and (c,d) δ18OH2O vs. δ18OSO4 in water bodies of the study area.
Water 17 02105 g010
Figure 11. Sulfate contributions from different sources in water bodies of the study area.
Water 17 02105 g011
Figure 12. Topography (a) and land use types (b) of the study area.
Water 17 02105 g012
Figure 13. Pattern of sulfate migration and transformation in the water bodies of the study area.
Water 17 02105 g013
Table 1. Statistics of the main hydrochemistry indexes in water bodies of the study area.
StatisticTDSECK+Na+Ca2+Mg2+HCO3SO42−ClNO3
mg·L−1μS·cm−1mg·L−1
Surface waterMax262518.207.0122.3055.908.8311176.703621.80
Min48.70751.853.015.301.75344.421.871.58
Mean134.45281.474.3411.9922.995.1376.2319.0617.158.70
GroundwaterMax413759.907.3422.6010324.8031258.5028.5089.20
Min52.9086.800.744.732.741.9019.600.813.920.66
Mean186.07351.792.4010.8634.479.79114.7018.7514.0726.45
Table 2. Isotopic compositions of δD and δ18O in water bodies of the study area.
StatisticSurface WaterGroundwater
UpstreamMidstreamDownstreamTributariesUpstreamMidstreamDownstream
δD
(%)
Max−32.05−31.60−33.28−35.85−29.55−28.09−29.39
Min−37.02−38.55−34.07−47.86−33.13−38.02−34.52
Mean−34.63−34.88−33.59−41.99−31.39−32.41−32.31
δ18O
(%)
Max−5.20−5.16−5.19−5.91−5.38−4.67−4.32
Min−6.27−6.08−5.35−7.44−5.91−6.57−6.50
Mean−5.74−5.51−5.26−6.47−5.59−5.49−5.47
Table 3. Characteristics of δ34SSO4 and δ18OSO4 from different potential sources.
Sourcesδ34SSO4 (‰)δ18OSO4 (‰)Reference
AverageStandard DeviationAverageStandard Deviation
Atmospheric precipitation5.901.809.401.64[48]
Soil sulfate5.481.993.662.78[48]
Sulfide oxidation−0.104.90−0.503.03[32]
Sewage8.702.406.861.60[47]
Evaporite22.507.5014.001.00[49]
Chemical fertilizers2.307.7016.104.00[50]
Table 4. The quantity of industrial sewage discharge sources in the towns of the study area [59].
TownsQuantityTownsQuantityTownsQuantity
Daweishan17Gaoping28Zhentou35
Dahu23Gugang33Puji18
Yonghe20Liuyang199Guanqiao13
Guandu14Chengchong44Baijia7
Disclaimer/Publisher’s Note: The statements, opinions and data contained in all publications are solely those of the individual author(s) and contributor(s) and not of MDPI and/or the editor(s). MDPI and/or the editor(s) disclaim responsibility for any injury to people or property resulting from any ideas, methods, instructions or products referred to in the content.

