Article

Study on the Evolution and Predictive for Coordinated Development of Regional Water Resources, Economic Society, and Ecological Environment

1
Key Laboratory of Water Safety for Beijing-Tianjin-Hebei Region of Ministry of Water Resources, Beijing 100038, China
2
School of Water Resources, North China University of Water Resources and Electric Power, Zhengzhou 450046, China
3
Henan Provincial Key Laboratory of Water Resources Conservation and Intensive Utilization in the Yellow River Basin, Zhengzhou 450046, China
*
Author to whom correspondence should be addressed.
Water 2025, 17(14), 2093; https://doi.org/10.3390/w17142093
Submission received: 21 May 2025 / Revised: 8 July 2025 / Accepted: 12 July 2025 / Published: 14 July 2025
(This article belongs to the Section Water Resources Management, Policy and Governance)

Abstract

Water resources are strategic resources that support regional economic social development and maintain the health and stability of ecosystems. This study revealed the evolution of the coordinated development of China’s water resources–economic society–ecological environment system based on the coordination degree mode. The research was conducted by integrating machine learning with traditional mathematical methods; by setting up the status quo development scenario, water resources priority scenario, economic society priority scenario, ecological environment priority scenario and balanced development scenario; and by using the Holt exponential smoothing–feedforward neural network prediction model, the coordinated development trends under different scenarios were predicted. The results showed that, analyzed from the perspective of the coordinated evolution type of the dual systems, the dominant development system during the study period gradually transformed from water resources–economic society to water resources–ecological environment. For the coordinated development of the complex system, the coordination degree showed “stepped leap—resilient fluctuation (from 0.7242 to 0.8238)”, and “better in the southeast than in the northwest, with significant advantages in the coast”. The most significant increase in the coordination degrees were observed in the balanced development scenario and economic society priority scenarios, where it increased by an average of around 5%, confirming the effective contribution of stable economic and social development to the level of coordination. This study provides theoretical support and practical guidance for regional water resources management.

1. Introduction

Water is a fundamental resource for living systems [1], providing strategic resources for the development of human society and a material basis for the stability of the ecosystem. However, with the exploitation and utilization of water resources, the resilience of water resources has been reduced, and water shortage crises have emerged in many regions, hindering the healthy development of the economy and society and the sound evolution of the ecological environment [2]. As far as China is concerned, the water resources problem is mainly manifested in two aspects: the first is the shortage of total water resources, with 6% of the world’s water resources and less than 10% of the arable land carrying nearly 20% of the population and the economic development of an average annual growth rate of GDP of about 5%; the second is the uneven distribution of water resources, as the distribution of water resources in China presents a spatial pattern of more in the south and less in the north, as well as a temporal imbalance characterized by more in summer and autumn and less in winter and spring. Meanwhile, extreme water resource events triggered by climate change have had a significant impact on the orderly development of the economy, society and ecosystem, severely restricting the evolution of the coordinated development of water resources, economic society and ecological environment [3]. Moreover, the inadequate sustainable utilization of water resources similarly constrains the level of regional coordinated development [4]. How to enhance China’s sustainable development from the perspective of coordinated development is a focal point of research.
Coordinated development is a process in which two or more interrelated systems or elements of a system collaborate with each other, work together appropriately, promote each other, and continuously evolve towards an ideal state on the basis of objective laws [5]. As a foundational resource, research on the coordinated development of water-related systems has focused on systems such as water–energy–food [6,7,8], water–energy–food–carbon [9], water–land–food [10], water–economy [11,12], and water–environment–ecology [13]. The main research methods for the evolution and prediction of coordinated development are the coupling coordination degree model [14], the data envelope analysis [15], distributed social economy–water–ecological model [16], linear regression [17], system dynamics [18], and random forest model [19]. Despite the rich results of recent research on the coordinated development of complex systems, there are fewer studies on water resources, economic society and ecology in terms of research content. Meanwhile, as far as the research scale is concerned, existing studies predominantly focus on the provincial area. Zhou et al. (2023) evaluated the coordinated development degree of Anhui province from 2011 to 2020. Wang et al. (2019) analyzed the spatial and temporal distribution characteristics of coordinated development in Hunan province [20,21]. The coordinated relationship of water resources, economic society and ecological environment in China as a whole is seldom considered. Especially as China’s economy has shifted from a stage of rapid growth to a stage of high-quality development, further study on the evolution and prediction of coordinated development of water resources, economic society and ecological environment in China is crucial for high-quality development.
Building upon existing research foundations, this study introduces innovations in research methodologies and frameworks, providing practical guidance for research on regional coordinated development. (1) It constructs an evaluation index system for the comprehensive development of the water resources–economic society–ecological environment system, incorporates machine learning methods, and employs the Random Forest model to assess the comprehensive development status of China’s water resources–economic society–ecological environment system. (2) Utilizing an improved coupling coordination degree model based on synergy theory, it reveals the spatiotemporal evolution patterns of coordinated development in China’s water resources–economic society–ecological environment system and explores the spatial correlations of regional coordinated development. (3) It identifies the main driving factors of coordinated development using the Geodetector model and predicts the coordinated development status of China’s water resources–economic society–ecological environment system under different scenarios from 2024 to 2030 using the Holt exponential smoothing–feedforward neural network coupling model. Figure 1 is a schematic diagram illustrating the structure of the article.

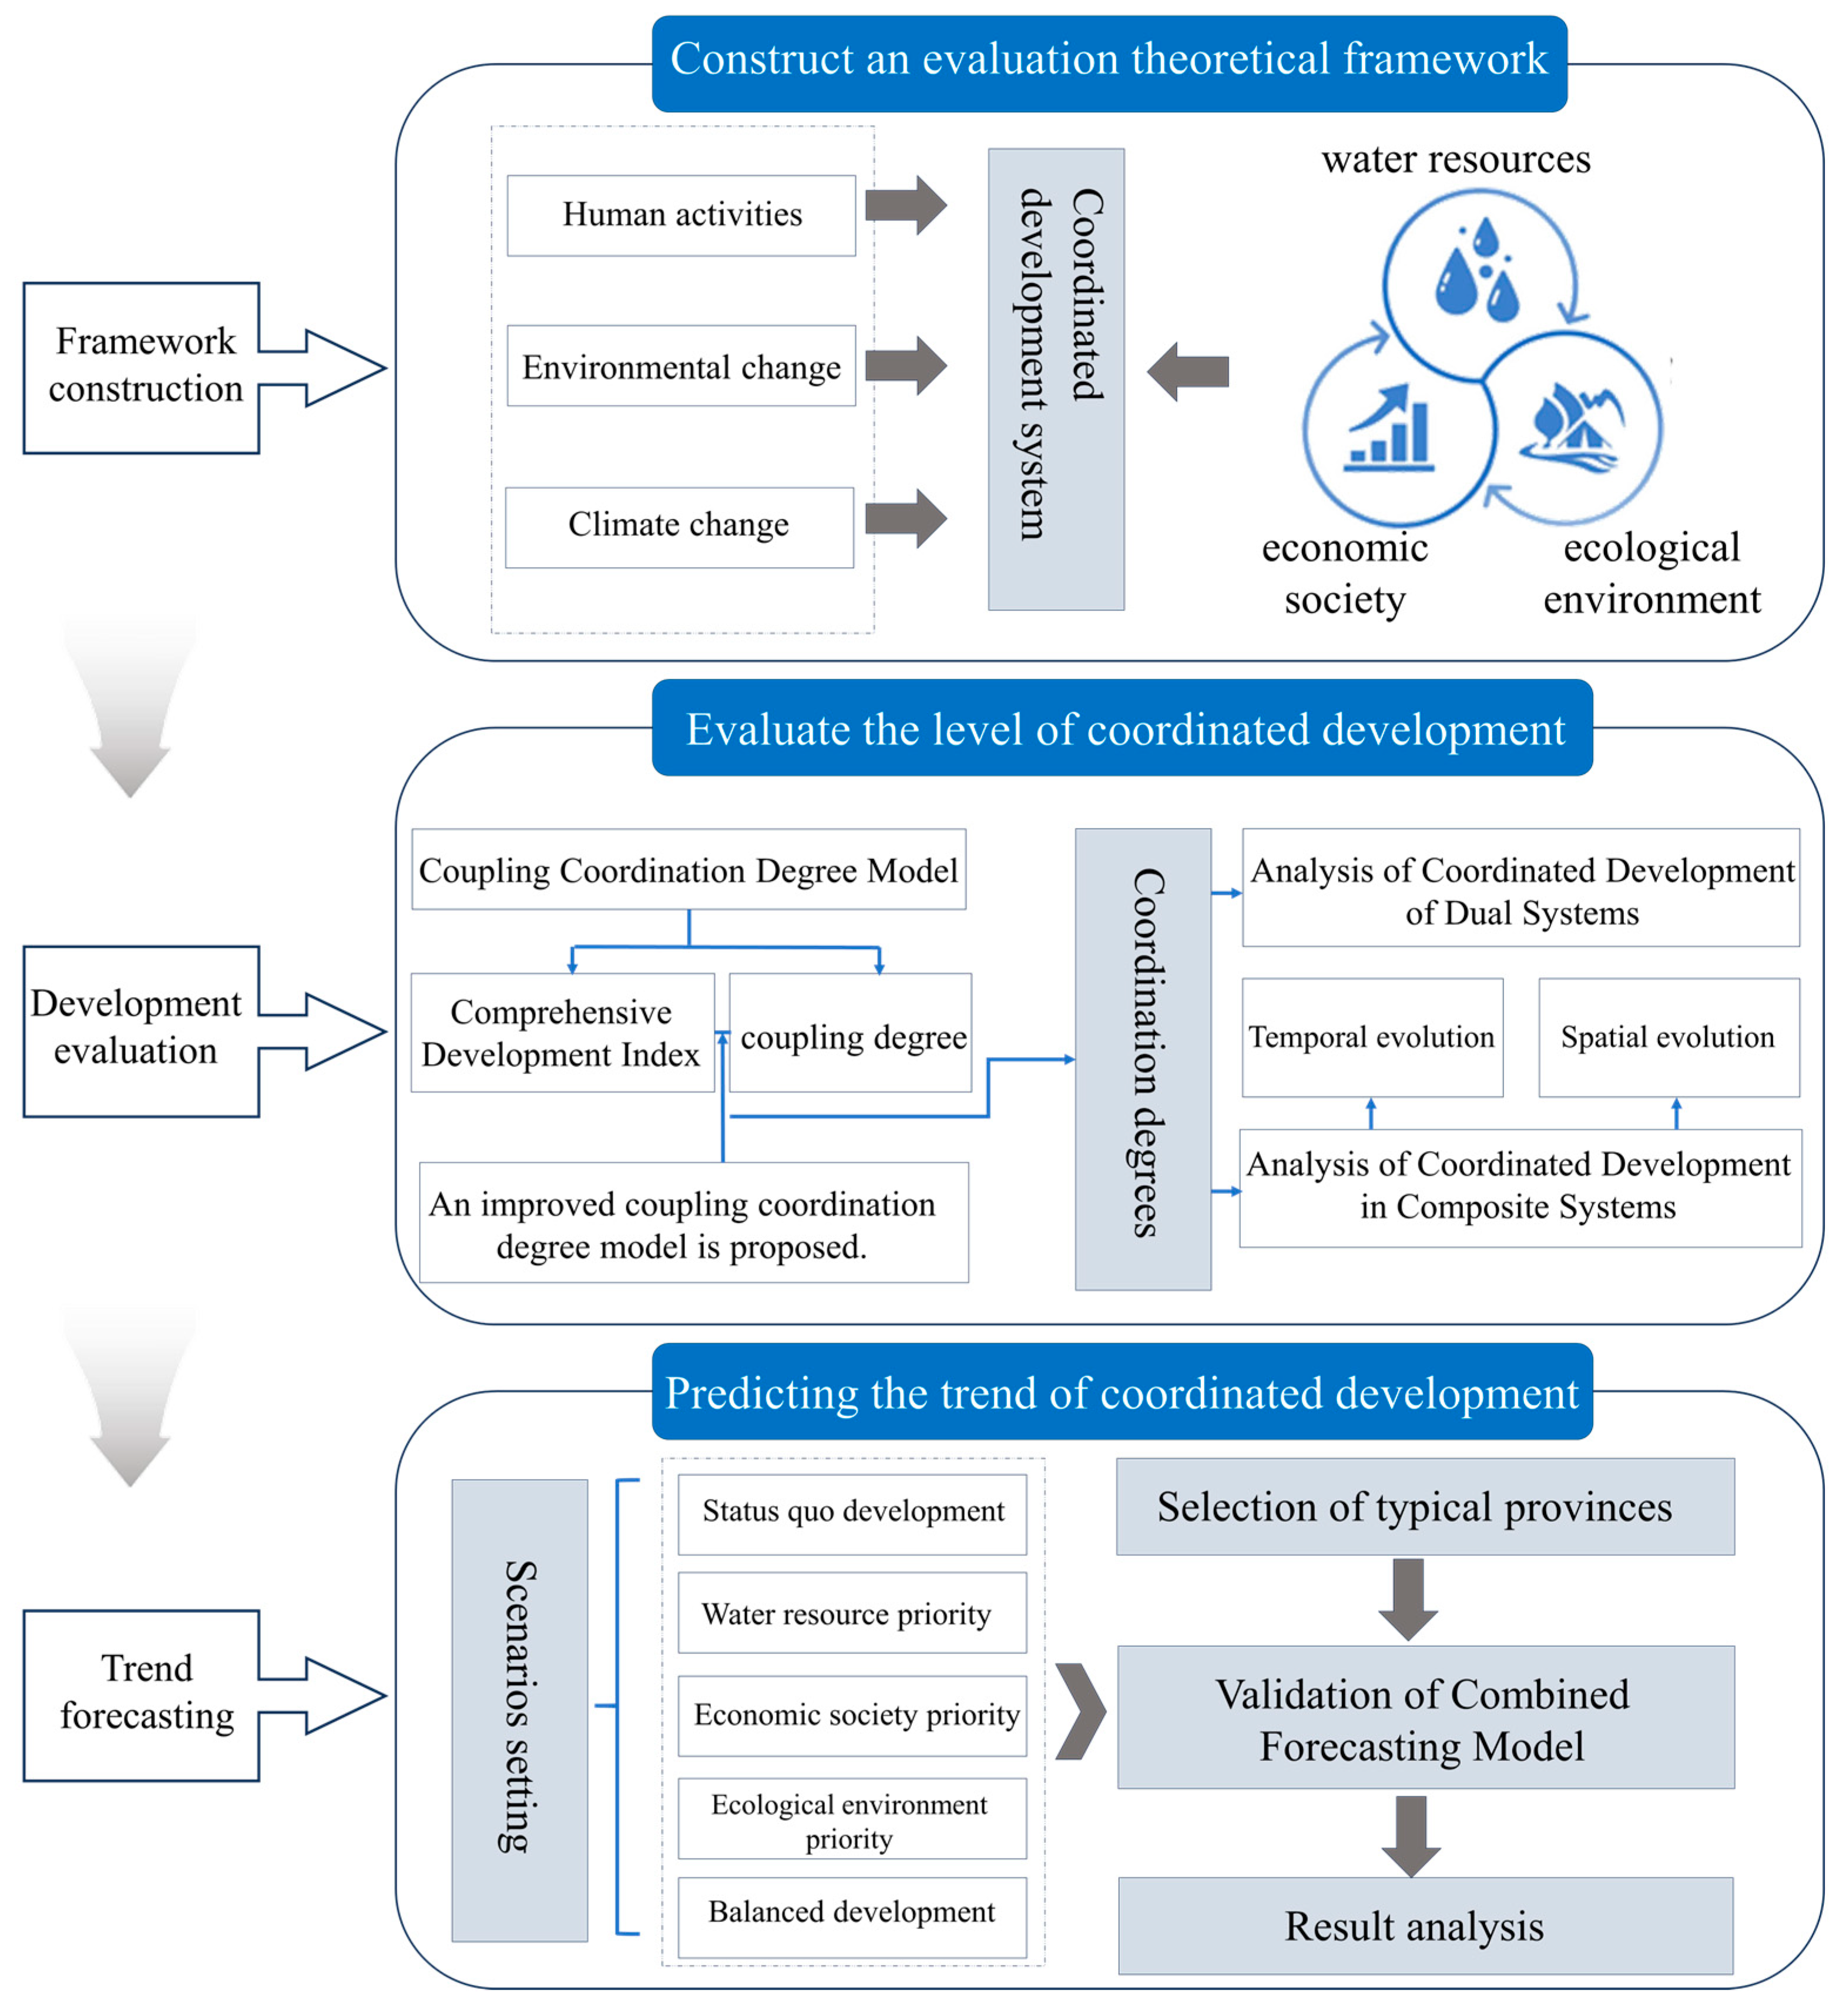
2. Materials and Methods

2.1. Study Area

China is rich in water resources, accounting for about 6% to 7% of the global total water resources and ranking 6th in the world; however, due to the large population base and vast territory, the per capita water resources level is only 1/4 of the world average. China’s economic structure has been continuously optimized and its economy has maintained high-quality growth, with per capita GDP rising from CNY 36,300 to CNY 89,400 from 2011 to 2023.
China has 34 provincial-level administrative regions. Considering the availability of data, Taiwan Province of China, Hong Kong Special Administrative Region and Macao Special Administrative Region were not included in this study. The data used in this study mainly come from relevant bulletins and yearbooks issued by government departments, including the China Statistical Yearbook for 2012–2024 issued by the National Bureau of Statistics; China Water Resources Bulletin, China Soil and Water Conservation Bulletin, China Flood and Drought Disaster Prevention Bulletin, and National Water Resources Development Statistical Bulletin issued by the Ministry of Water Resources of the People’s Republic of China, for the period 2011–2023; and China’s Ecological and Environmental Status Bulletin and Ecological and Environmental Statistics Annual Report issued by the Ministry of Ecology and Environment of the People’s Republic of China. In addition, the bulletins and yearbooks issued by relevant departments of provinces, autonomous regions and municipalities directly under the central government were employed. In the process of data collection, due to the lack of a small amount of year data in some indicators, this study adopted the interpolation method to fill in the blanks, so as to ensure the authenticity and reliability of the data to the greatest extent. At the same time, in order to ensure the comparability of indicators and avoid the influence of regional baseline data (such as area and population), the indicators adopted in this study were expressed in per capita terms, so as to ensure the unity of the evaluation scales.

2.2. Methods

2.2.1. Coordination Degree Model

Coupling degree is used to describe the degree of influence produced by the interaction between two or more systems, with a high coupling degree indicating a strong influence between the systems. Coordination degree reflects the degree of interconnection, mutual adaptation and coordinated operation of each subsystem in the system, which is a quantitative indicator that fully reflects good development and coordination between systems or elements. The equation is as follows.
C = i = 1 n U i 1 n i = 1 n U i n 1 n
where C is the coupling degree; n is the number of subsystems; Ui is the integrated development index for the i-th system (the calculation process of integrated development index can be found in the study by Lü et al. [22]).
D = C · i = 1 n w i · U i
w i = i = 1 n U i U j ( n 1 ) i = 1 n U I
where D is the coordination degree, and wi is the weight for the i-th subsystem.

2.2.2. Holt Exponential Smoothing–Feedforward Neural Network Prediction Model

Holt Exponential Smoothing Method
Holt exponential smoothing is a forecasting method for time series data, which has good forecasting performance for time series with linear trends but without seasonality. The basic principle is to add the data trend estimation on the basis of the traditional exponential smoothing method, and to improve the prediction effect for the trending data by introducing the trend parameter [23]. The formula is as follows.
F t + m = S t + b t m
S t = α X t + 1 α S t 1 + b t 1
b t = γ S t S t 1 + 1 γ b t 1
where Ft+m is the predicted value; St is the smoothing value; Xt is the actual value; bt is the trend value; m is the number of prediction overruns; and α and γ are exponential smoothing-related parameters with values in the range [0, 1].
Feedforward Neural Network
Feedforward neural network is a machine learning method for analyzing and predicting complex nonlinear relationships, which is commonly used in problems involving water resources [24]. The core feature of this method is the one-way flow of information in the network, and there is no feedback connection between the input layer, the hidden layer and the output layer.
The feedforward neural network model works by weighting and summing the data from the input layer to the output layer with neurons at each layer and introducing nonlinearities through the activation function. The model error is then calculated by comparing the output value of the model with the actual value. Finally, back propagation of the error is performed to return the error from the output layer to the input layer, and the network weights are updated by the gradient descent method so as to minimize the error. The calculation formula is as follows.
z l = W l f l 1 z l 1 + b l
a l = f l W l a l 1 + b l
where z is the input of the neuron; l is the number of layers of the feedforward neural network; W is the weight matrix; f is the activation function; b is the bias parameter; and a is the output of the neuron.
Holt Exponential Smoothing–Feedforward Neural Network Prediction Model
The output of the Holt exponential smoothing–feedforward neural network prediction model constructed in this study is obtained by weighting the prediction results of the two models, which makes up for the deficiency in prediction accuracy for linear or nonlinear data. The weights of the two prediction models are determined based on the respective fitting errors of the models; that is, a smaller weight is given to the model with a larger error, and a larger weight is given to the model with a smaller error. The formulas for model weights and prediction calculation are as follows.
θ i = 1 μ i i = 1 2 μ i
δ = i = 1 2 δ i θ i
where θi is the weight of the i-th prediction model; μi is the average error of the i-th prediction model; and δi is the prediction result of the i-th prediction model.

3. Results and Discussion

3.1. Index System of the Coordinated Development of Water Resources–Economic Society–Ecological Environment

Under the interactive influence of the natural environment, human activities and social development, the coordination system of water resources–economic society–ecological environment is a relatively open, closely linked and dynamically changing complex system. Following the development laws of each subsystem and considering the validity, comparability and measurability of the indicators, an evaluation index system for coordinated development of water resources, economy, economic society and ecological environment was constructed, covering nine elements and 35 specific indicators, as shown in Table 1.

3.2. Coordinated Development Evolution

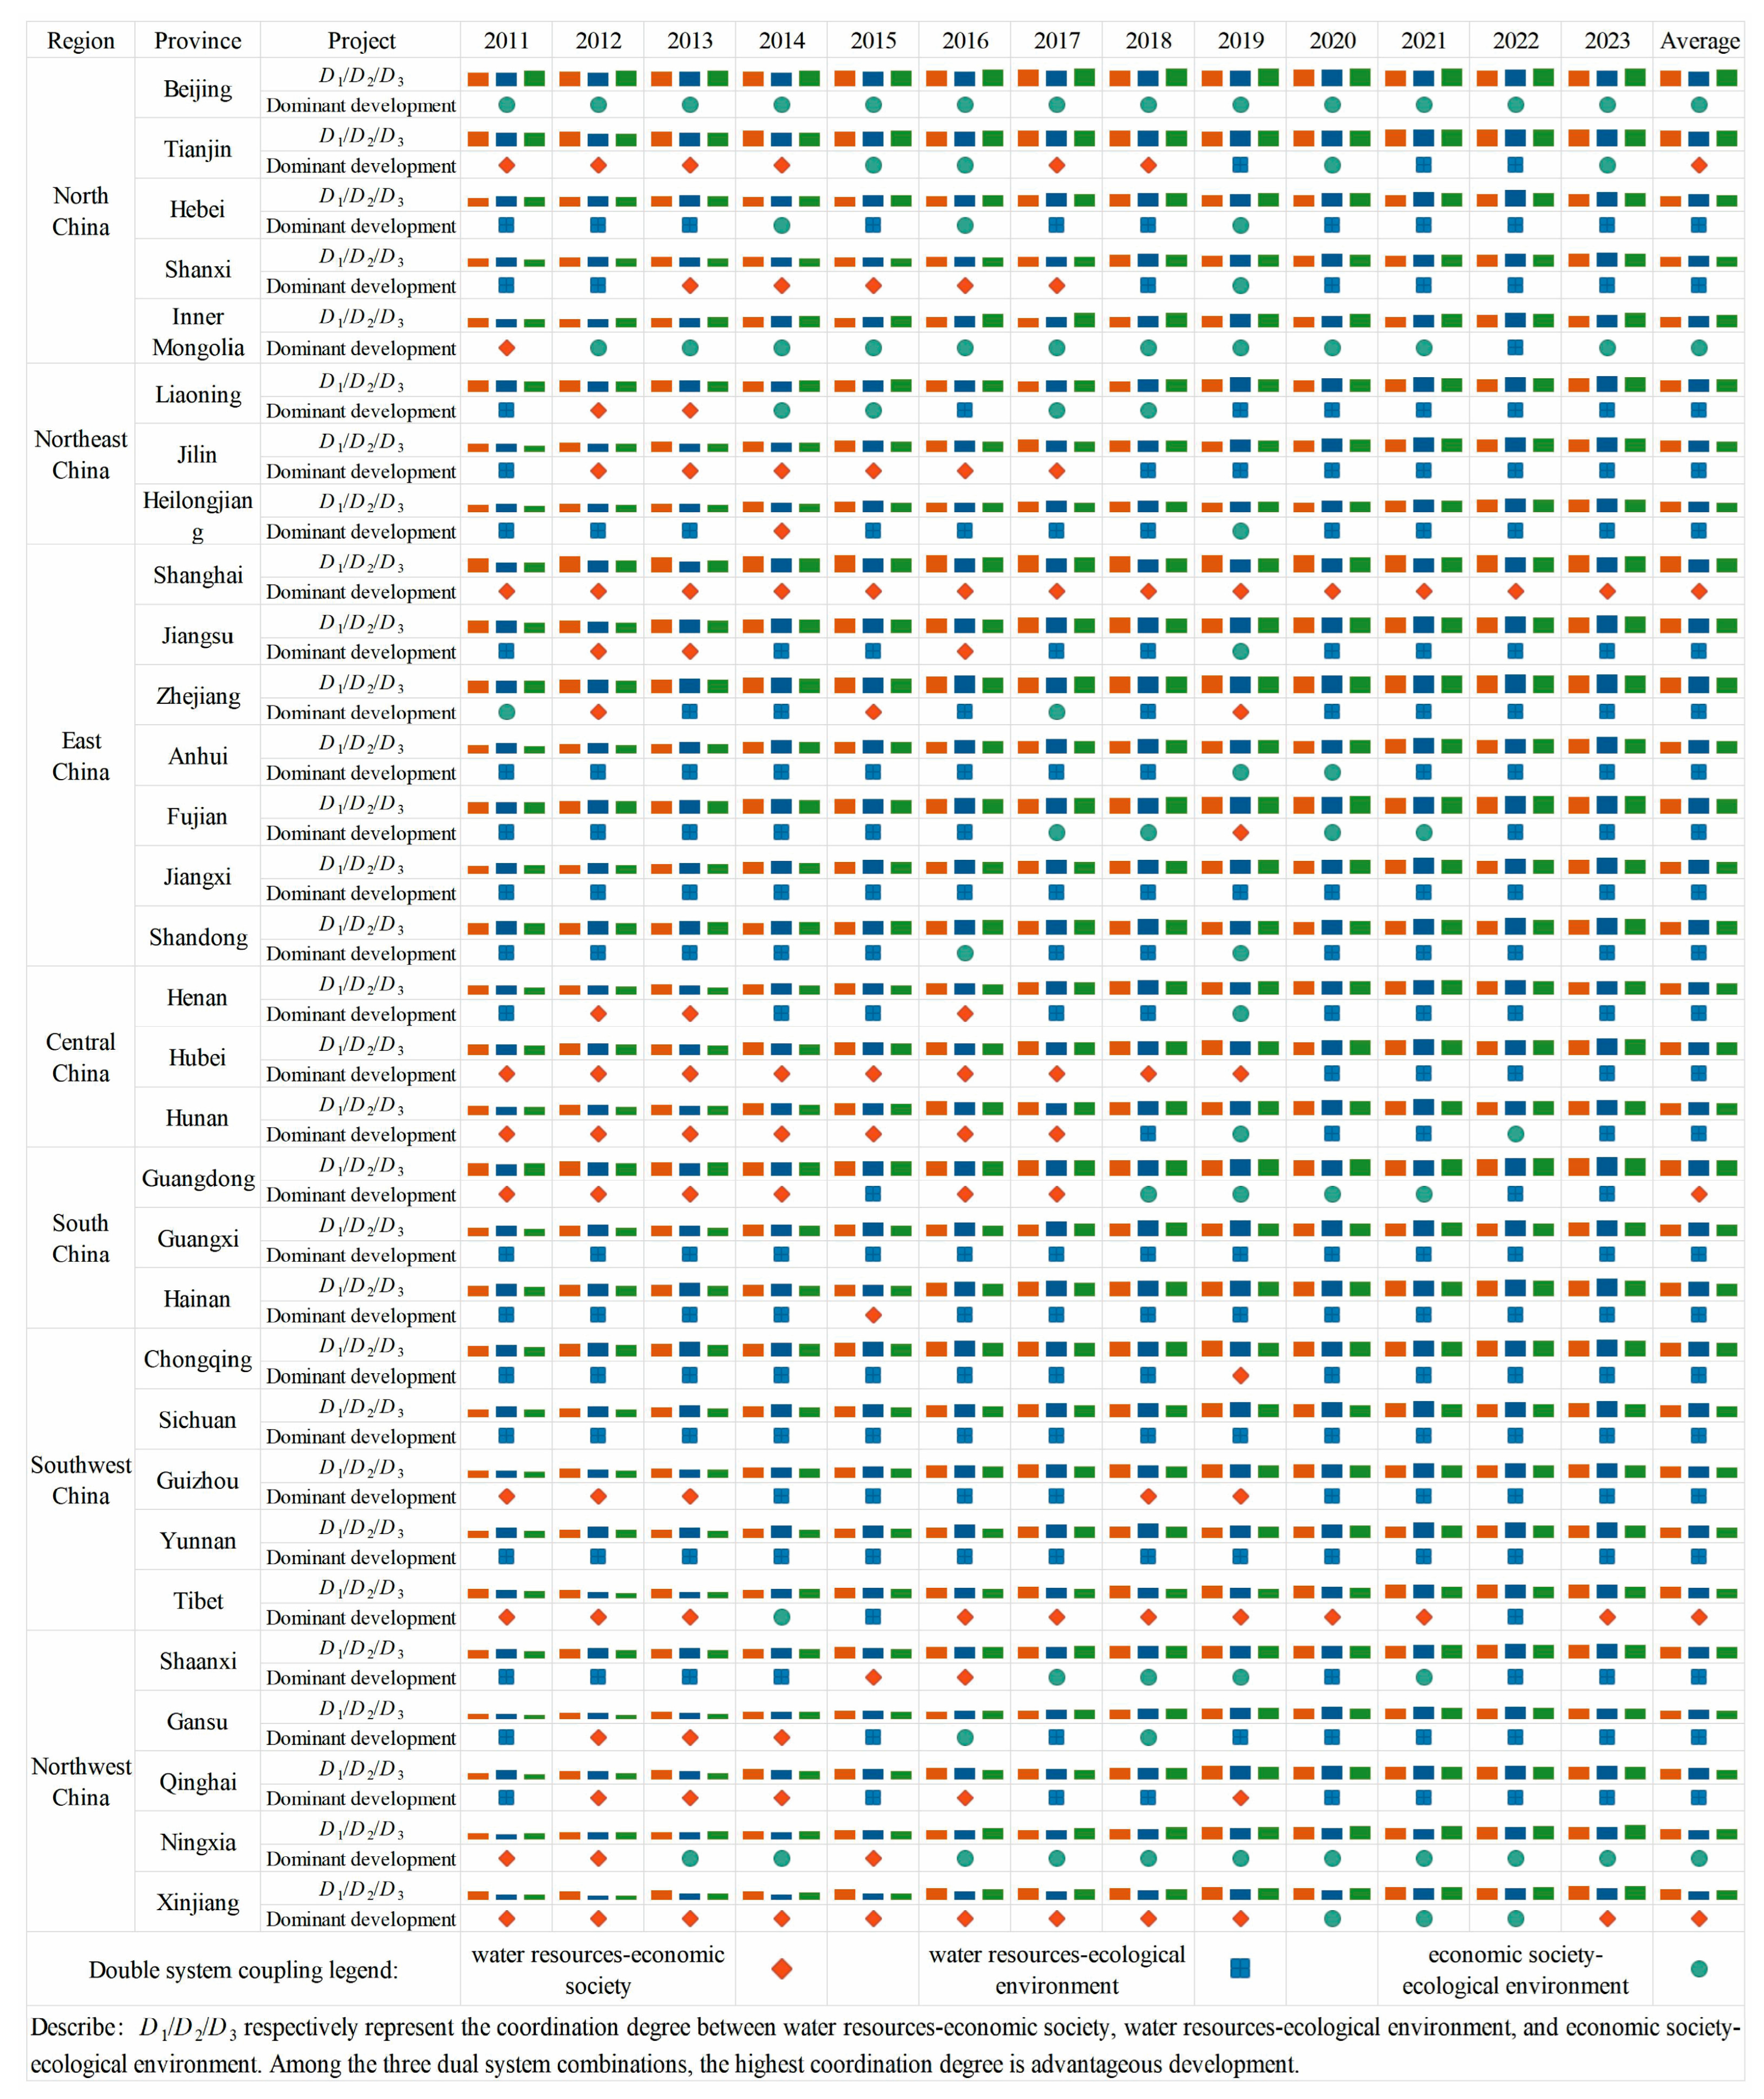
3.2.1. Coordinated Development of Dual Systems

By calculating and comparing the coordination degree of dual systems of water resources–economic society, water resources–ecological environment, and economic society–ecological environment in China from 2011 to 2023, the type of coordination with the greatest degree of coordination was defined as “dominant development”. The evolution trend of the coordinated development of the dual systems is shown in Figure 2.
Among the 403 data points of dominant development from 2011 to 2023, the water resources–economic society system appeared 106 times, accounting for 26.30%; the water resources–ecological environment system occurred 222 times, with the highest frequency, accounting for 55.09%; and economic society–ecological environment system appeared 75 times, with the lowest frequency of 18.61%. From the perspective of the temporal variation of the dominant development type, the highest frequency of water resources–economic society system was in 2012, reaching 51.61%, and the lowest frequency appeared in 2022, only 3.23%. The highest frequency of water resources–ecological environment system was in 2022, amounting to 83.87%, and the lowest value was 29.03% in 2019. The economic society–ecological environment system had the highest frequency of 41.94% in 2019 and the lowest value of 6.45% in 2011.
The dynamic differentiation of dual systems of water resources–economic society–ecological environment system in provinces of China explains the interaction between policy focuses and resource constraints at different development stages. In terms of the dominant development types, the increasing proportion of water resources–ecological environment system indicated that China’s ecological governance has gradually shifted from the economic adaptation stage of “water-based production” to the systemic restoration stage of “water-based ecology”.

3.2.2. Coordinated Development of Water Resources–Economic Society–Ecological Environment System
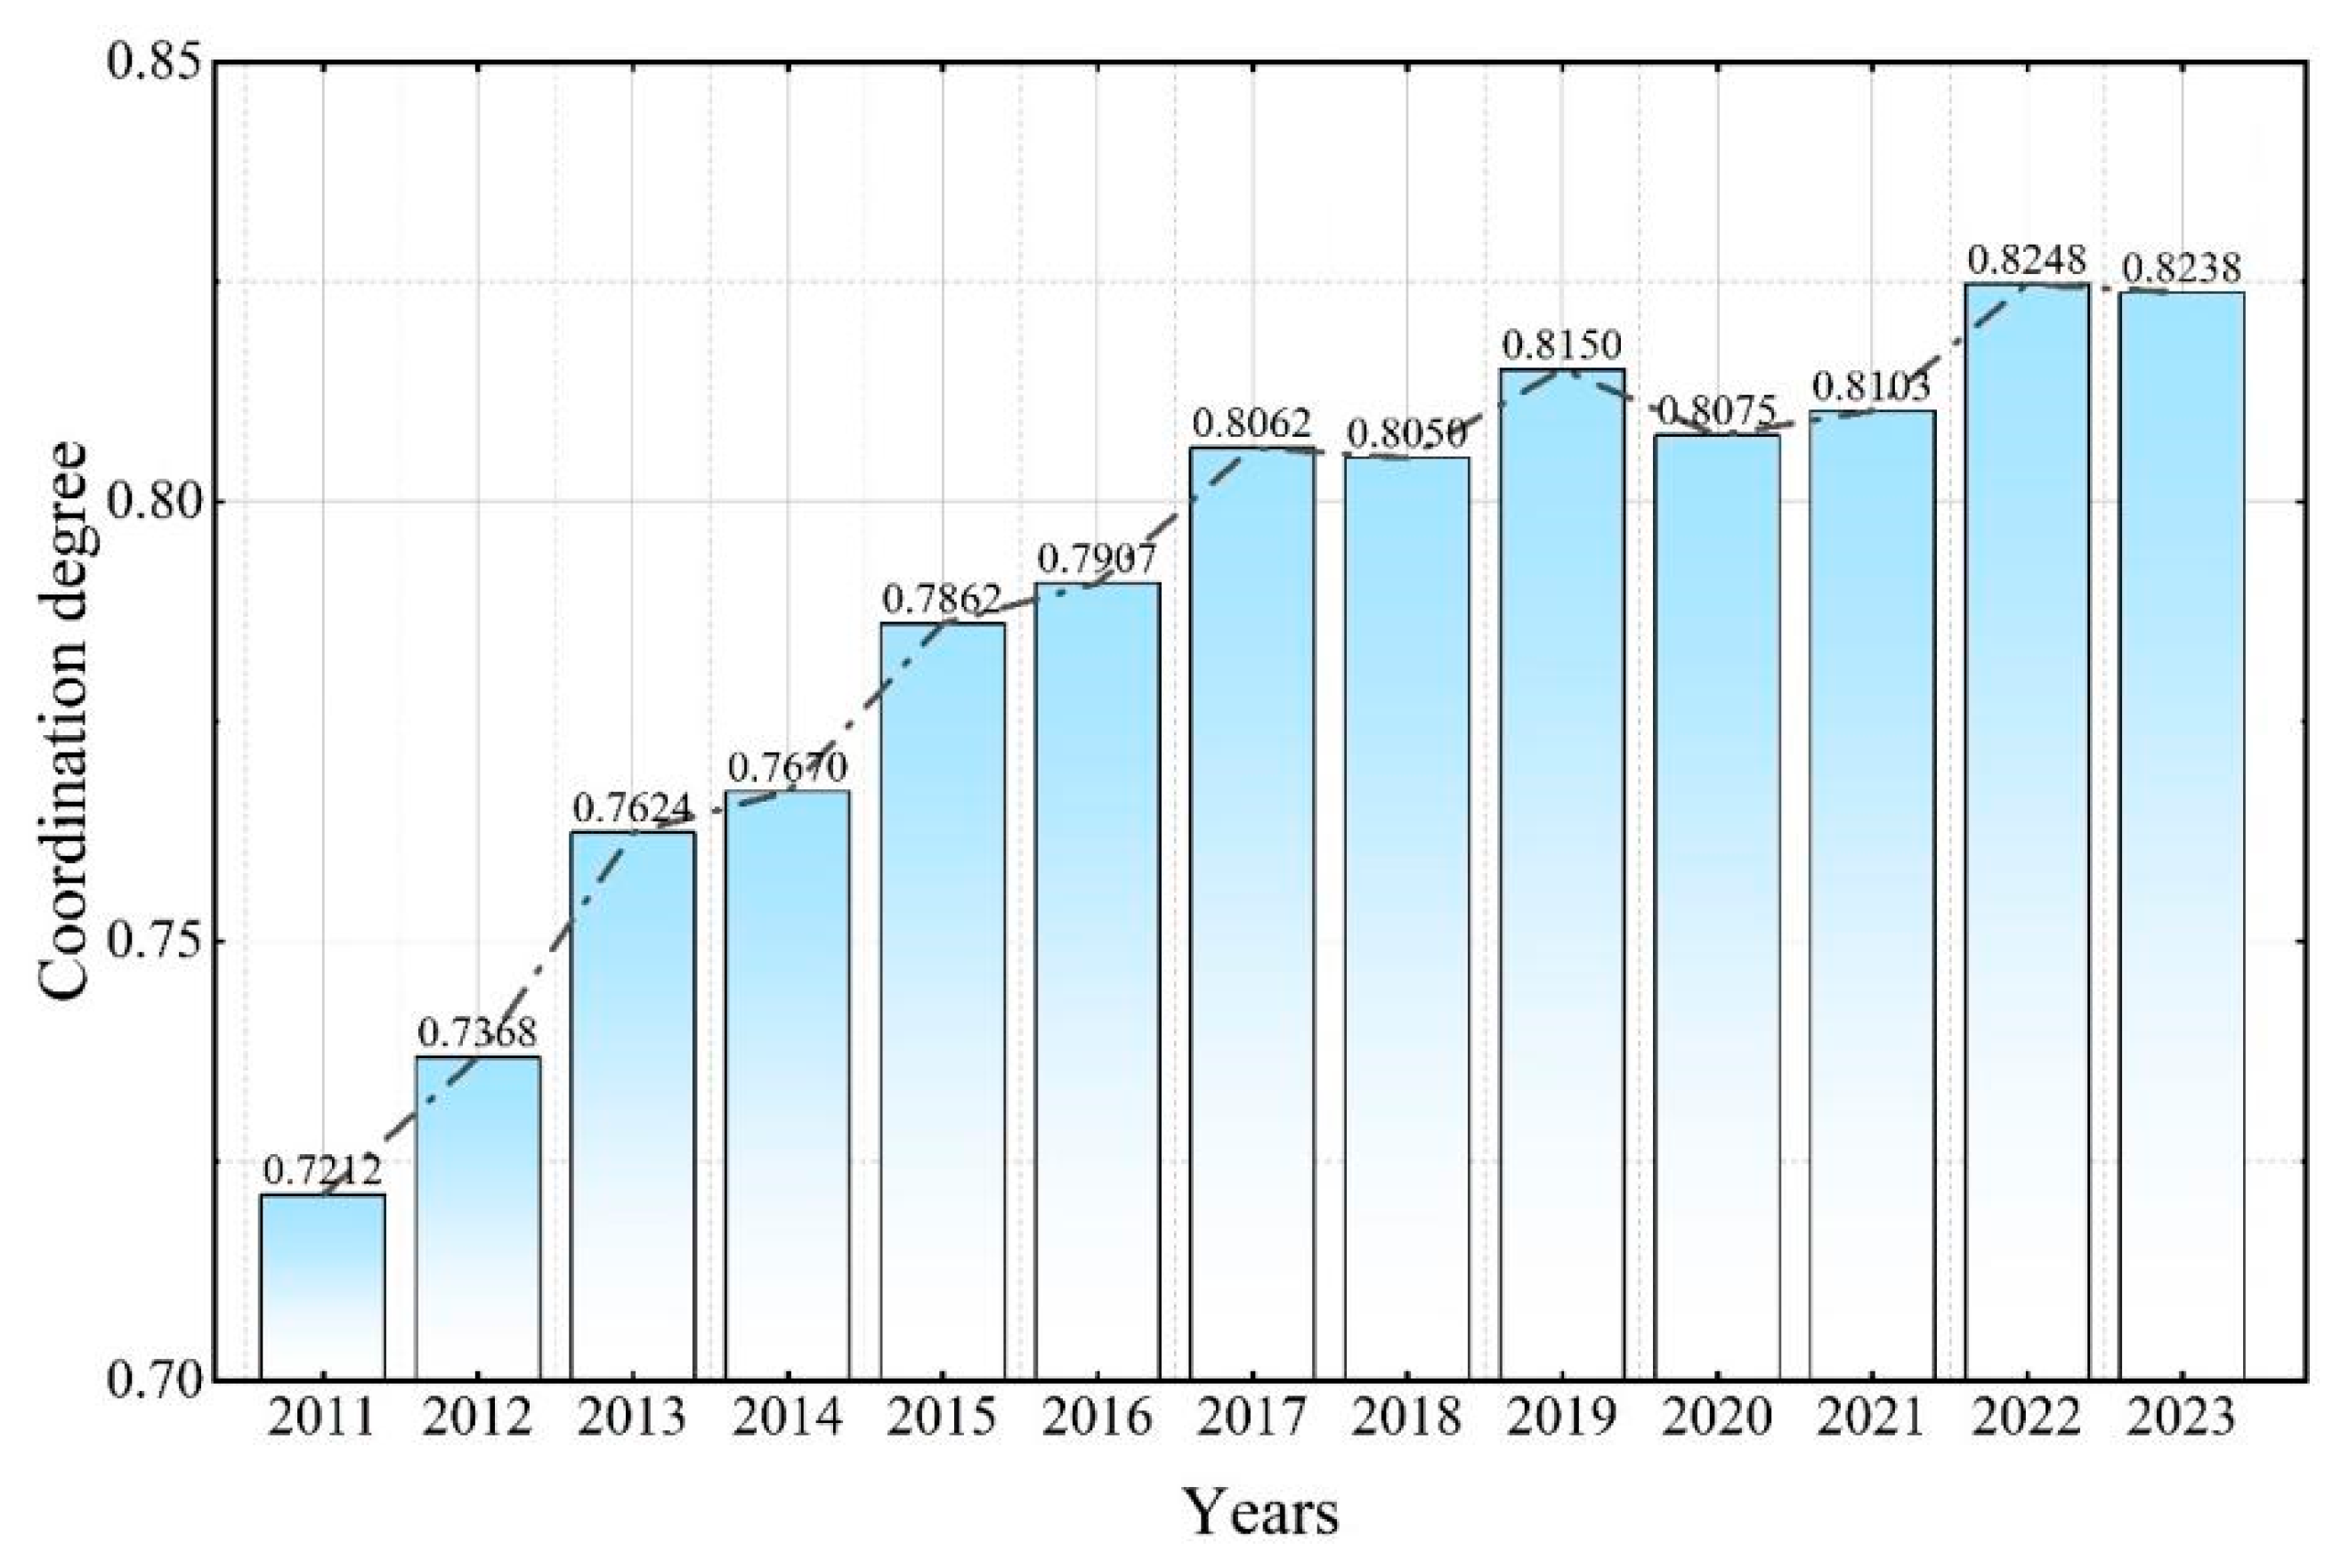
Temporal Evolution
As can be seen from Figure 3, the coordinated development of the water resources–economic society–ecological environment system experienced a high-speed development period from 2011 to 2017 (the coordination degree rose from 0.7212 to 0.8062) and a high-level fluctuation and slow increase period from 2018 to 2023 (the coordination degree rose from 0.8050 to 0.8238). It shows the evolutionary characteristics of “stepped leap–resilient fluctuation”.
The implementation and release of relevant policies was the reason for the significant increase of the coordination degree from 2011 to 2017. On the one hand, the stricter water resources management system implemented since 2012 has forced the national water consumption per CNY 10,000 of GDP to drop by about 30% through the “three red lines” (total water consumption, water use efficiency and pollution control). On the other hand, the release of the “Water Pollution Prevention and Control Action Plan” has promoted the in-depth implementation of sewage treatment, and the percentage of water-quality sections of key watersheds with water quality of more than Grade III has increased by approximately 20%, thus realizing synergistic effects of water quality improvement and pollution treatment.
During the high-level fluctuation from 2018 to 2023, the marginal diminishing effect of governance was exposed. Firstly, the space of easy-to-govern areas tended to be empty, such as the proportion of industrial point source pollution which fell from 45% in 2017 to 28% in 2023, but the decentralized characteristics of agricultural surface pollution made it difficult to effectively improve in the short term; secondly, external shocks have exacerbated the vulnerability of the system, such as the outbreak of the public health event in 2020, when some regions, in order to protect the economy, restarted high water-consuming projects, resulting in a rebound in the national industrial water withdrawal volume; thirdly, the conflict between the long cycle of ecological restoration and short-term benefits, such as the management of groundwater overexploitation, usually requires a cycle of about ten years, and the positive results in the short term were not significant.
Spatial Evolution
Benefiting from the economic advantages, well-established industrial structure, and high level of openness in China’s coastal regions, during the study period, the coordinated development of China’s water resources–economic society–ecological environment system presented a spatial distribution pattern of “better in the southeast than in the northwest, with significant advantages in the coast”. The coordinated development on both sides of the Hu Huanyong line ( first proposed by geographer Hu Huanyong in 1935, it revealed the marked imbalance in China’s population distribution and reflected the constraining effects of natural geographical conditions and resources on population and the economy) showed significant spatial differences. As can be seen from Figure 4, the provinces with better-coordinated development were Zhejiang, Beijing and Shanghai, with an average coordination degree of 0.8532, 0.8501 and 0.8374, respectively; those with worse-coordinated development were Gansu, Xinjiang and Heilongjiang, with a coordination degree of 0.6889, 0.7064 and 0.7189, respectively. In terms of the change in the coordination degree, Ningxia, Guizhou, and Xinjiang had the greatest improvement, increasing by 27.61%, 22.95% and 22.61%, respectively, from 2011 to 2023; Beijing, Tianjin, and Shandong had the smallest increase, rising by 6.16%, 7.50% and 10.41%, respectively.
To alleviate the disparities in the coordinated development of water resources–economic society–ecological environment in China, first of all, in the southeastern coastal provinces, the development model should be transformed from efficiency prioritization to resilience enhancement; secondly, the northwestern and northeastern regions should promote reforms in industrial transformation as well as efficiency improvement to achieve harmony among resources, development and ecology; finally, the provinces in the transitional zone of the Hu Huanyong Line should further establish a collaborative governance framework to balance the issues of resources and development.

3.3. Coordinated Development Prediction

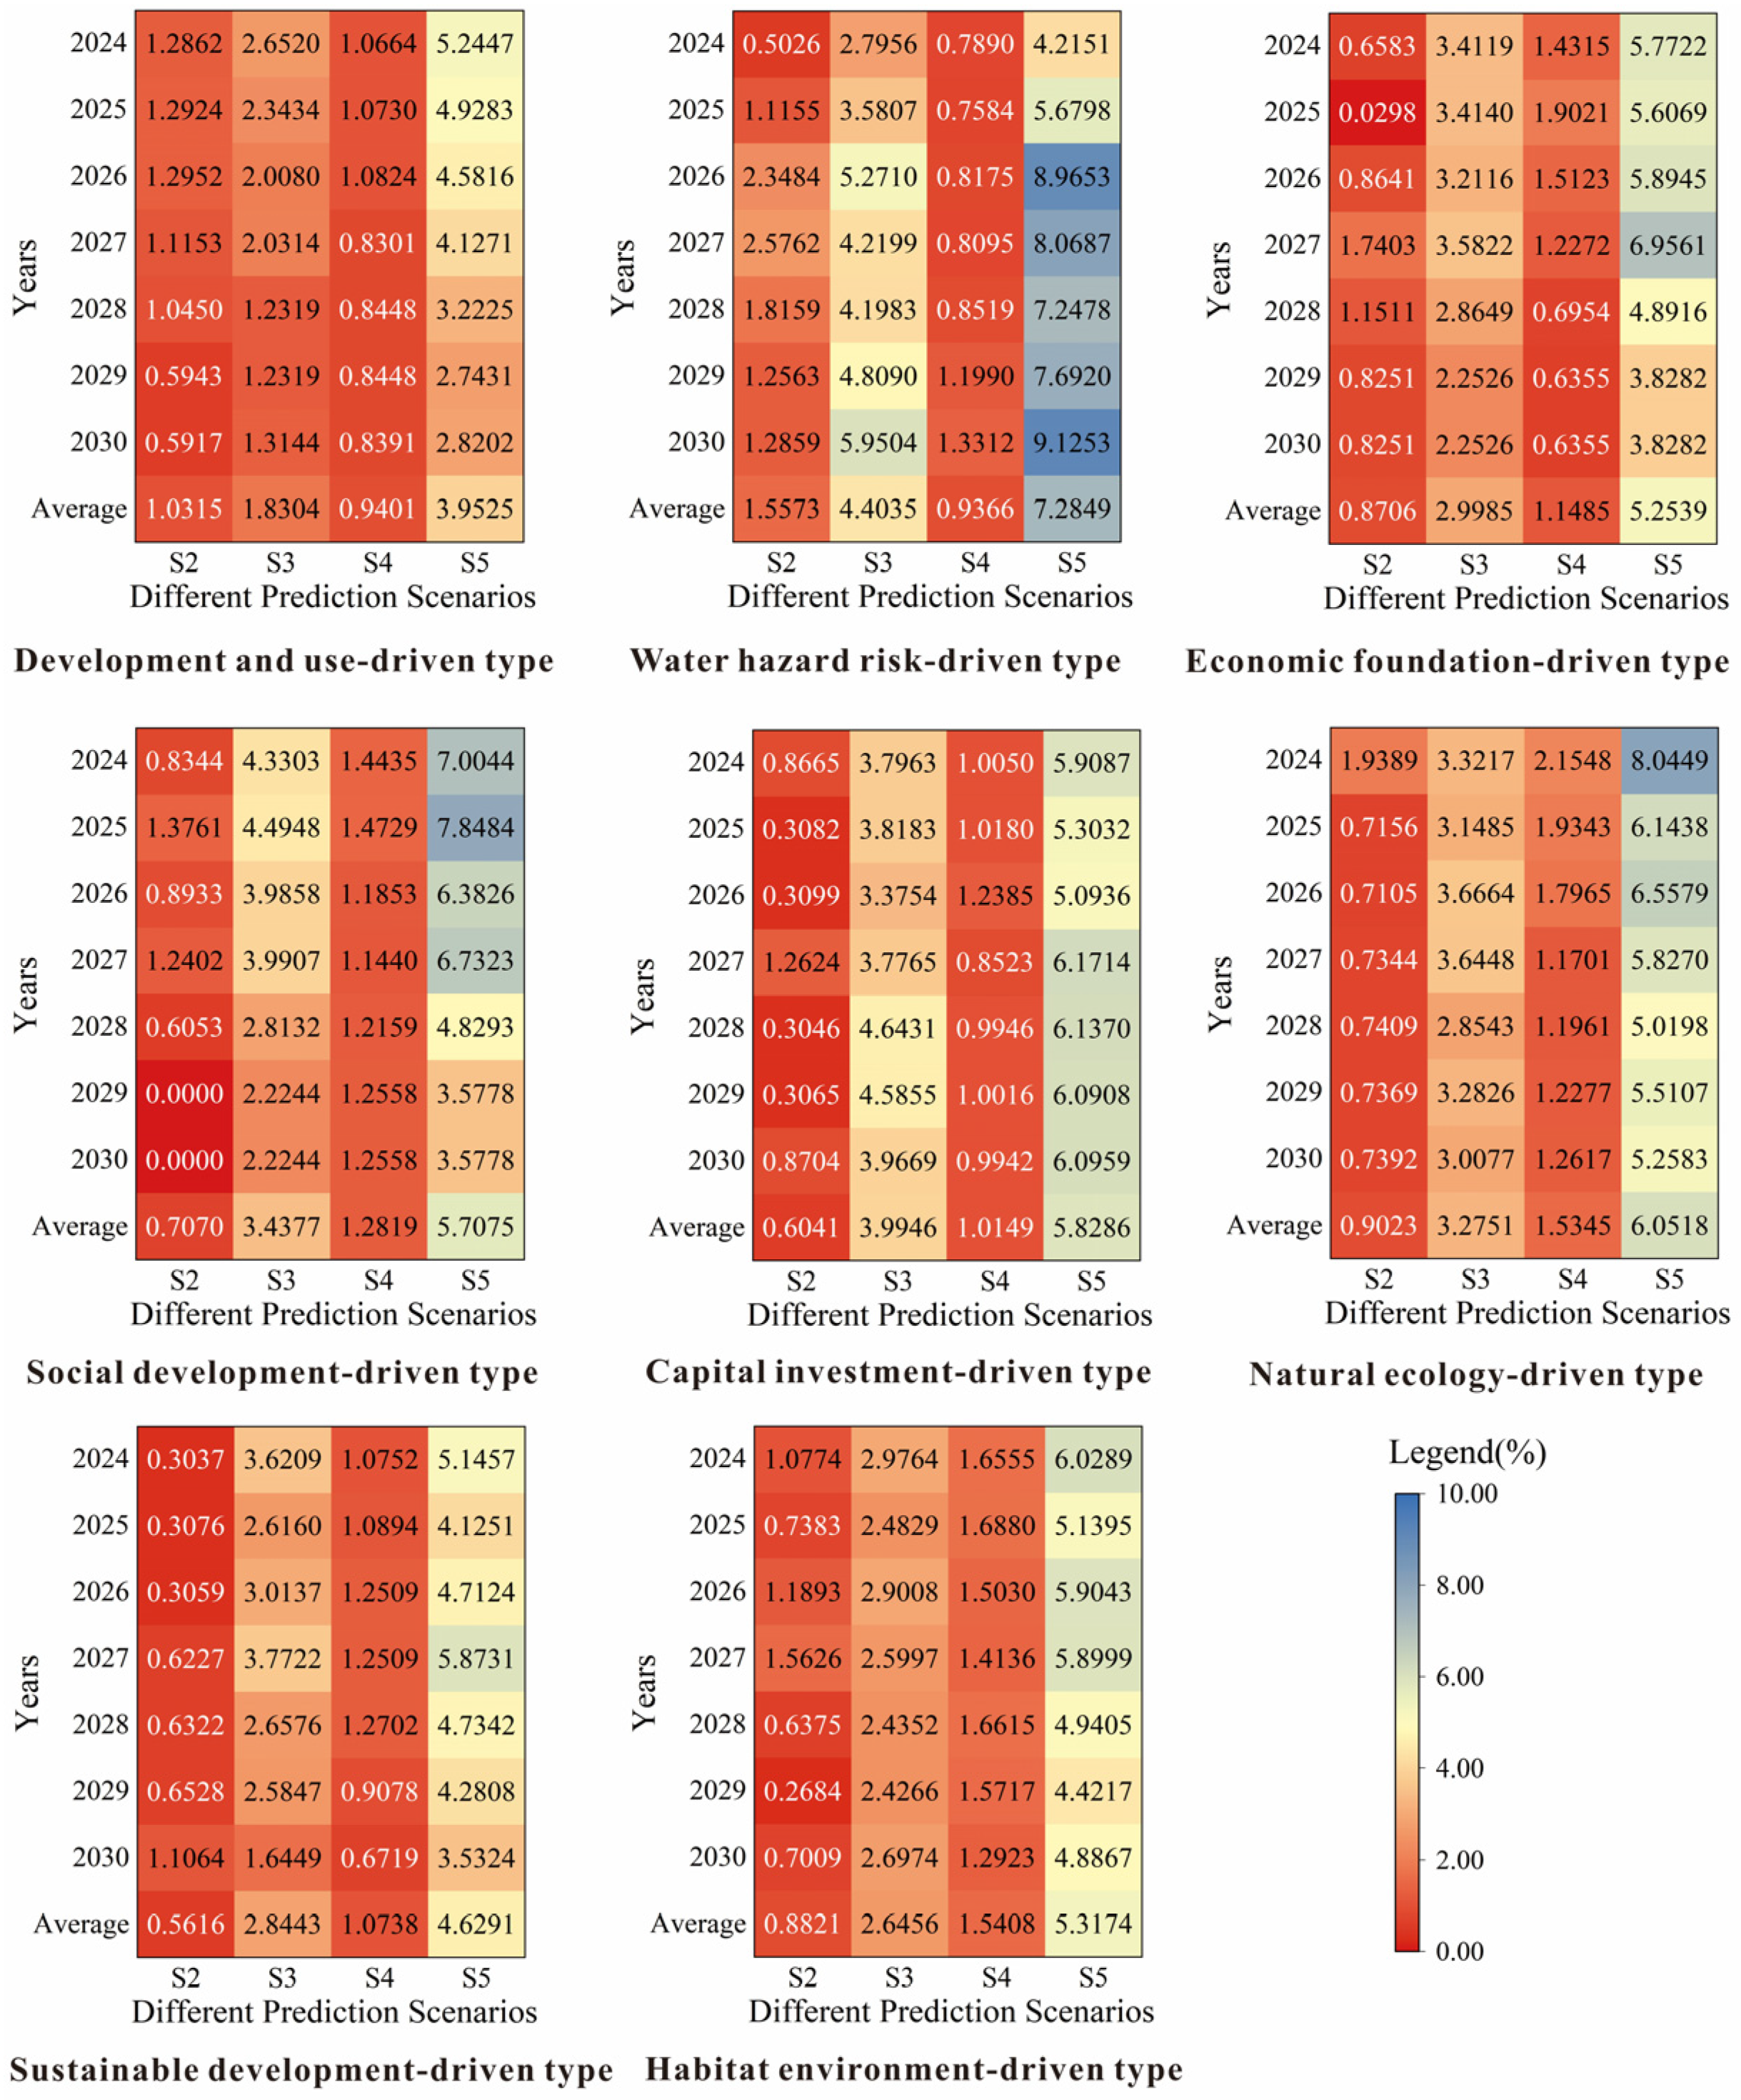
3.3.1. Scenario Setting

Scenario setting is an important part of studying the development of future trends. Considering the actual situation of the development of each subsystem and China’s development plan, this study set up five different development scenarios: status quo development type, water resource priority type, economic society priority type, ecological environment priority type, and balanced development type. Among them, the indicator data for the “status quo development type” are derived from the results of a combined forecasting model, while the indicator data for the remaining four scenarios are obtained by increasing the values by approximately 5% based on this foundation.
(1)
Scenario 1 (S1): Status quo development. Maintaining the current development trend without taking any additional measures to promote the coordinated development of China’s water resources–economic society–ecological environment system, with the coordination degree under this scenario as the baseline value.
(2)
Scenario 2 (S2): Water resource priority. Full consideration will be given to the enhancement of China’s ability to defend against water and drought disasters as well as the advancement of soil erosion control, the strengthening of water resources system protection, and the improvement of the efficiency of water resources utilization.
(3)
Scenario 3 (S3): Economic society priority. Strengthening the benign development of the economic society system, increasing the rate of development of economic indicators on the existing basis and responding to the development of China’s urbanization process.
(4)
Scenario 4 (S4): Ecological environment priority. Enhancement of the degree of ecological civilization by increasing NDVI, etc., and enhancement of the urban ecological environment through the improvement of green coverage rate of built-up areas, etc.
(5)
Scenario 5 (S5): Balanced development. Improvement measures based on Scenarios 2~4 to promote synergistic management of water resources, economic and society, and ecological environment.

3.3.2. Typical Provinces

For each of the nine elements, a typical province was selected to predict its coordinated development trend. The reasons for selecting typical provinces were as follows:
(1)
Development and use-driven type: Fujian. This province has both coastal and inland mountainous features, and it is confronted with resource and ecological pressures during its development process.
(2)
Water hazard risk-driven type: Jilin. This province is located in northeastern China and has a slightly weaker ability to resist flood disasters.
(3)
Economic foundation-driven type: Shandong. The province has a large economic scale and comprehensive coverage of industrial categories that can reflect resource constraints in the industrialization process.
(4)
Social development-driven type: Hebei. The contradiction between population and resources faced by this province is a typical problem in the process of social development.
(5)
Capital investment-driven type: Jiangxi. The province has a medium level of water financing and its development gradient is moderate.
(6)
Natural ecology-driven type: Henan. The province is located in central China and has a variety of landscapes, including mountains, hills, plains and basins. The province is representative of the ecological and resource pressures caused by its large population.
(7)
Sustainable development-driven type: Yunnan. This province is rich in ecological resources and has a sharp contradiction between population and land. Study of this province is of reference value for ecological advantage areas and provinces undergoing economic transformation and development.
(8)
Habitat environment-driven type: Hunan. The province is a transition zone connecting China’s eastern coastal areas with the central and western regions, and plays an important role in undertaking industrial transfer.
(9)
Water resource endowment-driven type: The role of water resources in coordinated regional development is multidimensional, and all provinces face conflicts between resource endowment and sustainable development. Consequently, there is no typical province for this driver type.

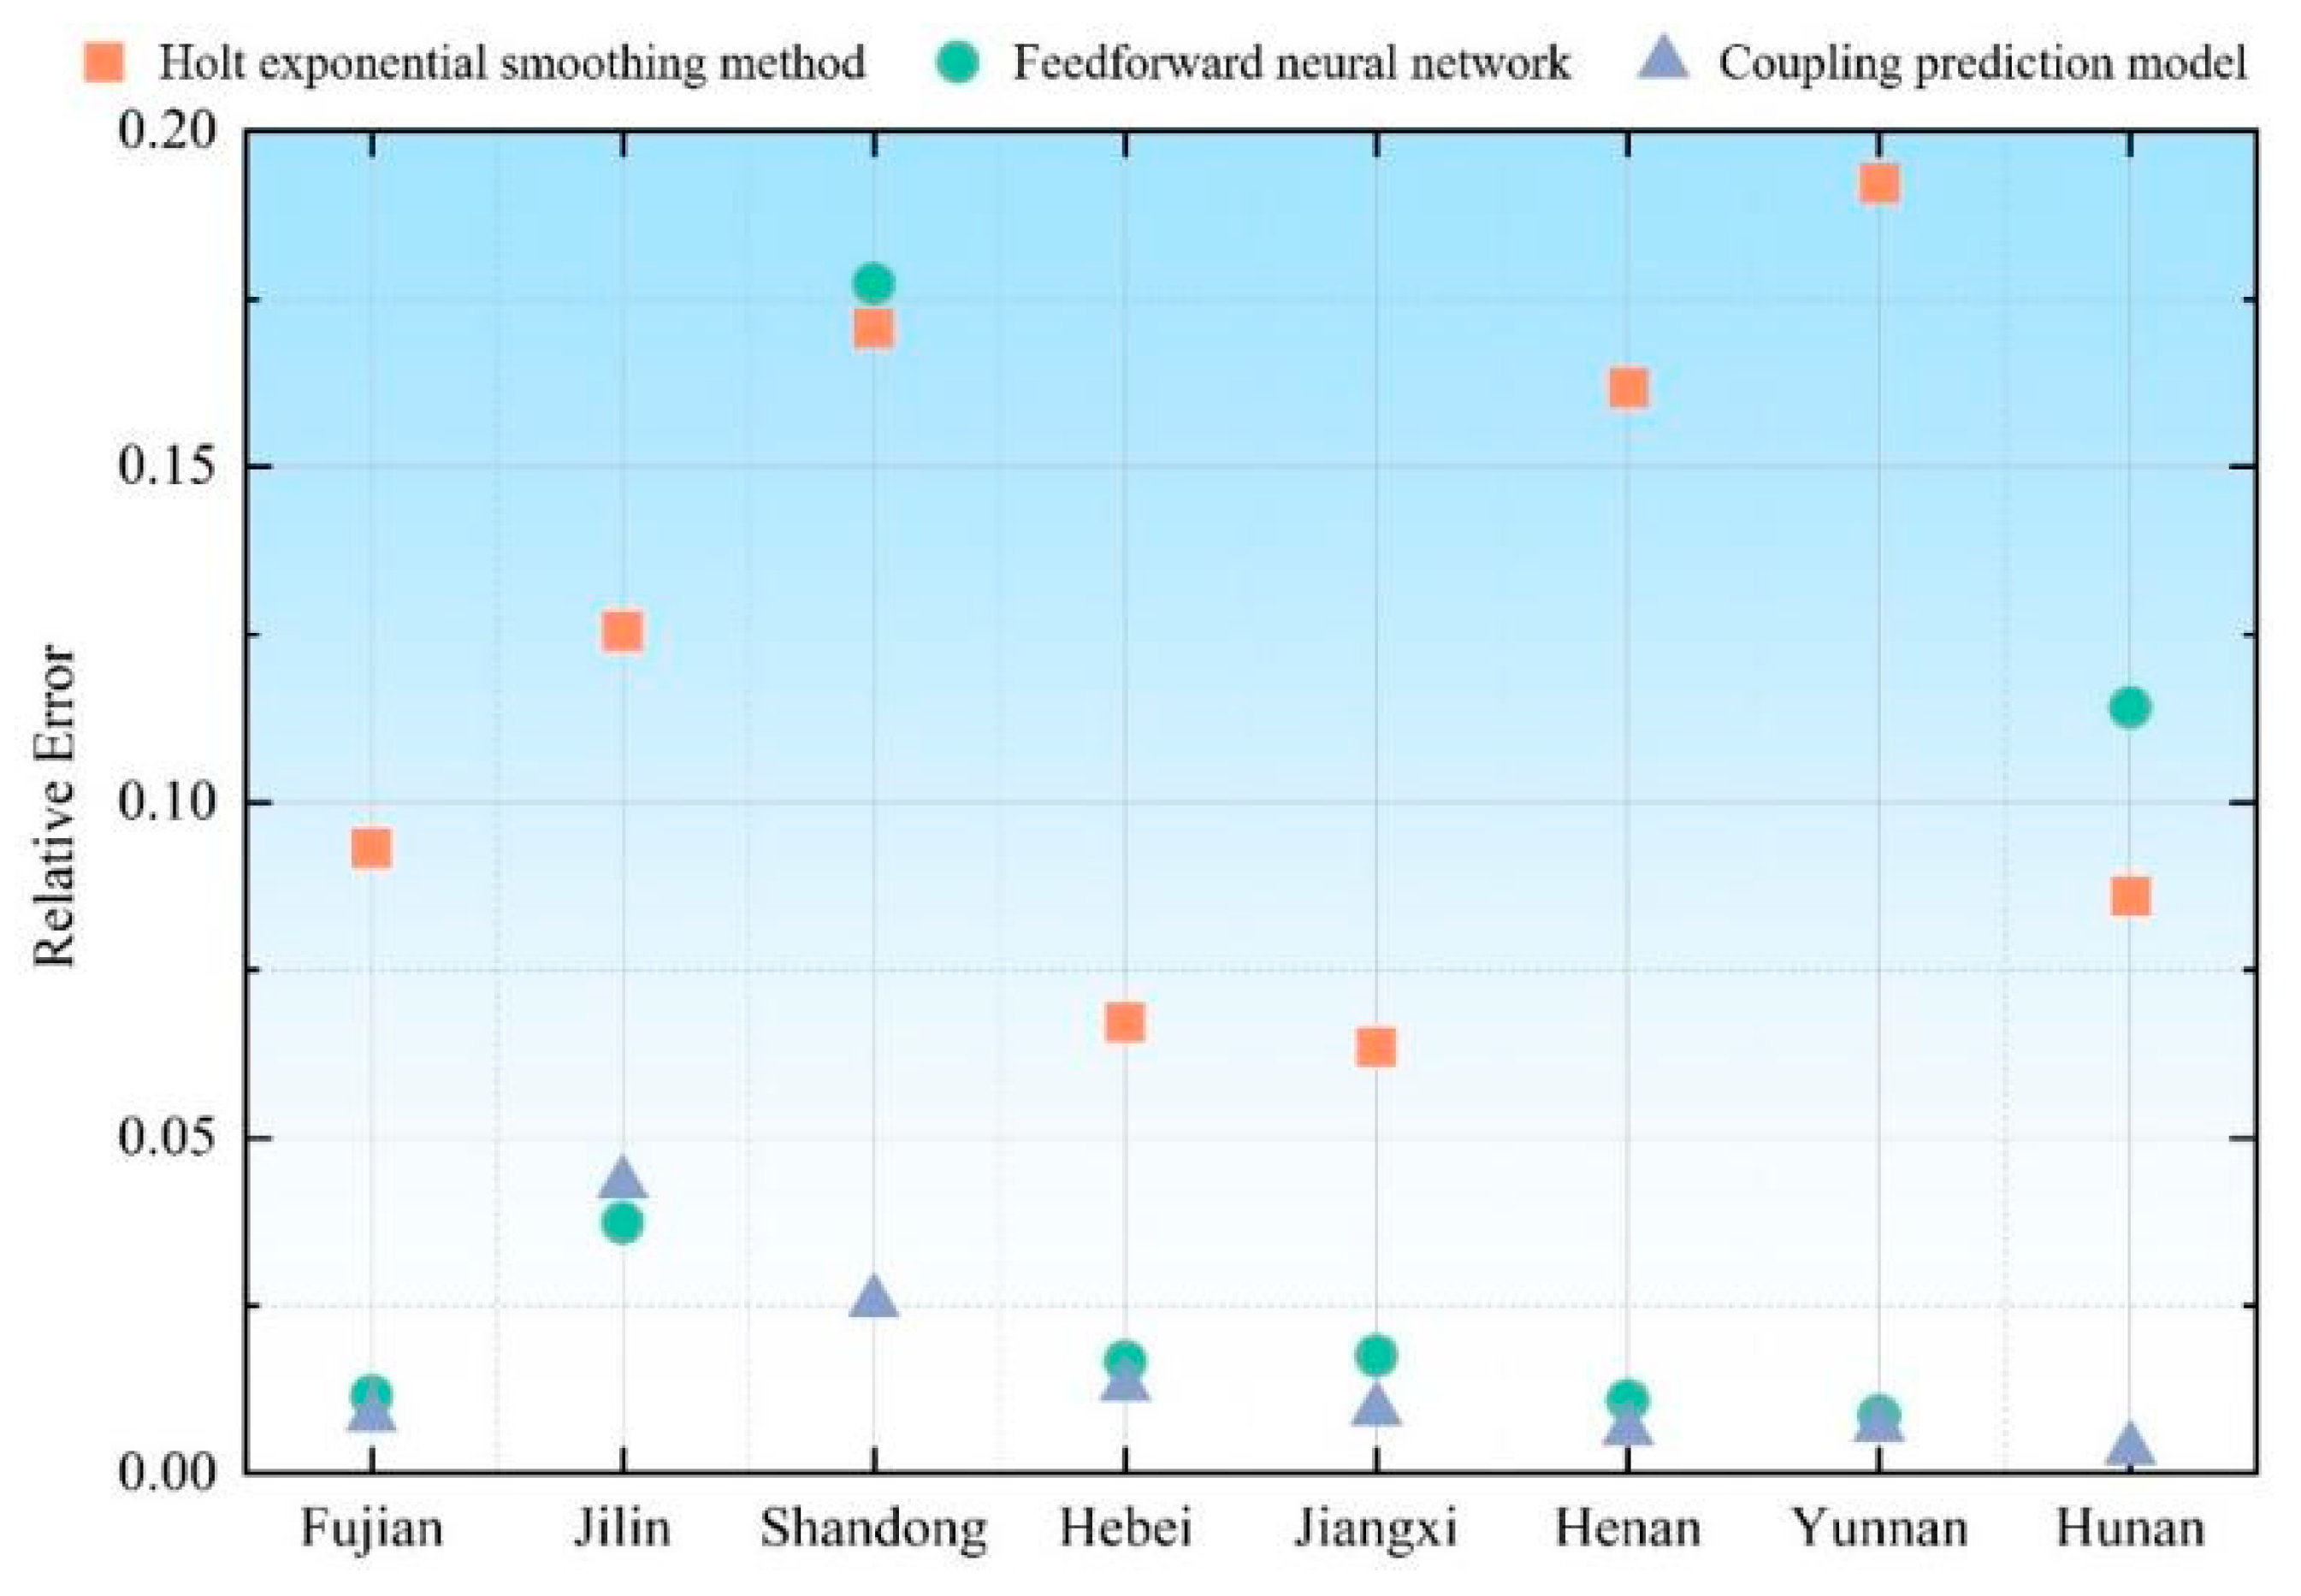
3.3.3. Validation of Holt Exponential Smoothing–Feedforward Neural Network Model

Verifying the prediction model can clarify its prediction performance and enhance the credibility of the results. The Holt exponential smoothing method, feedforward neural network and Holt exponential smoothing–feedforward neural network prediction model were all utilized to run the indicator data from 2015 to 2023 and then compared with the actual data; the relative errors are shown in Figure 5.
The error of the Holt exponential smoothing method was generally higher than that of the feedforward neural network model, and the error of the Holt exponential smoothing–feedforward neural network model was significantly smaller than that of the single models.
The main reason was that the feedforward neural network model, through repeated iterative calculations, fully fitted to the trend of the data series because the nonlinear relationship had a good degree of fit, but its predictive performance was not stable enough; the Holt exponential smoothing method for the nonlinear data was poorly fitted, but because of its ability to accurately grasp the trend of the data changes, it exhibited a certain degree of stability. Therefore, the two coupled prediction models can be used to identify the accuracy of the two models for different types of indicator prediction, dynamically adjusting the two model weights to maximize the combined model’s accuracy.

3.3.4. Prediction Results

The coordination degrees of different scenarios in typical provinces from 2024 to 2030 all showed an upward trend, but there were fluctuations within a small range. In order to uniformly measure the degree of improvement in the coordinated development status of typical provinces under different scenarios, S1 (status quo development) was set as the benchmark scenario, and the improvement amplitude of the coordination degrees in the remaining scenarios were calculated (Figure 6).
The coordination degree under each scenario from 2023 to 2040 improves compared with the benchmark scenario (S1). Among them, S5 (balanced development scenario) and S3 (economic society priority scenario) were the two scenarios with the most significant improvement. Under S5, the development status of all indicators in the index system comprehensively improved, which fundamentally improves the coordination of the system. Furthermore, China is in a period of stable economic development. Compared with the fluctuations in the water resources system and the slow increase in the ecological environment system, the development of the economic society system was relatively robust, which effectively promotes the coordinated evolution of the system.
On the contrary, the scenarios with the lowest coordination degree improvement were the development and use-driven type and water hazard risk-driven type under S4 (ecological environment priority scenario), and the remaining types had the lowest coordination improvement under S2 (water resource priority scenario). As the development and use-driven type and water hazard risk-driven type were all driven types in the water resources subsystem, they were more sensitive to the prioritization of the water resources system and were able to enhance the level of coordination through the enhancement of this system. The remaining types were less driven by the water resources subsystem and had stronger feedback on ecosystem improvement.
Therefore, for the water resources system-driven provinces represented by Fujian and Jilin, it is necessary to strengthen the construction of the water resources system, further highlight the optimal allocation and efficient use of water resources, and enhance the overall level of coordination by improving the resilience of the water resources system. Other provinces should focus on the feedback effect of ecological environment improvement, further increase the investment in ecological restoration, pollution control and industrial environmental protection, and enhance the level of coordinated development by improving the ecological environment while stabilizing economic development.

4. Conclusions and Limitations

4.1. Conclusions

Water resources are an important link between the economic society system and the ecological environment system. The three systems are organically integrated, influencing and restricting each other, and jointly form a complex giant system. Analyzing and predicting the coordinated development trend of the water resources–economic society–ecological environment system is conducive to achieving high-quality regional development. Considering the availability of data, this study took the regions of China other than Taiwan Province, Hong Kong Special Administrative Region and Macao Special Administrative Region as the target area to carry out a study on the evolution and prediction of the coordinated development of the regional water resources–economic society–ecological environment system, and the main conclusions were as follows:
(1)
An evaluation system for the coordinated development of water resources–economic society–ecological environment was established, and the degree of its coordinated development was calculated. From the perspective of the coordinated evolution of the dual systems, the dominant development combination from 2011 to 2023 gradually transformed from water resources–economic society to water resources–ecological environment. From the perspective of the complex system, the coordination degree showed “stepped leap—resilient fluctuation”, and ”better in the southeast than in the northwest, with significant advantages in the coast”; the coordinated development of the two sides of the Hu Huanyong Line showed significant spatial variability.
(2)
The Holt exponential smoothing–feedforward neural network prediction model was constructed, and the coupling of the two models made up for their prediction defects for linear and nonlinear data. Based on this prediction model, the indicator data from 2024 to 2030 were predicted, and five different scenarios were set up: status quo development, water resource priority, economic society priority, ecological environment priority, and balanced development.
(3)
The coordination degrees of different driving types based on different scenarios were predicted. The results showed that the coordination degrees were most significantly improved under the scenarios of balanced development and economic society priority, verifying the efficient promotion of coordination by stable economic and social development. Under the ecological environment priority scenario, the coordination degrees were lowest in the development and utilization-driven type and water hazard risk-driven type. This indicates that achieving regional coordinated development requires balancing ecological protection and economic efficiency: coastal regions can prioritize the balanced development model, while inland regions with limited resources need to explore low-cost technological pathways. Future research should further quantify the long-term ecological costs under different scenarios to provide a more comprehensive basis for policy-making.

4.2. Limitations

Although this study employed a relatively comprehensive research framework and achieved certain research outcomes, several limitations remain that could be addressed in future related research.
(1)
The construction of the indicator system was constrained by data availability. This study utilized provincial-level administrative regions across China as the smallest research units, with indicator data sourced from national and regional statistical yearbooks and bulletins. However, two key shortcomings emerged: first, indicator data for some regions—such as Taiwan Province, Hong Kong Special Administrative Region, and Macao Special Administrative Region—were not fully included in the statistical data released by the relevant authorities, thereby compromising the territorial completeness of the study. Second, certain indicators that could effectively reveal system development patterns and coordinated growth dynamics were unavailable in the statistical data and had to be replaced with proxies, potentially weakening the study’s persuasiveness. Subsequent research could incorporate data mining techniques and remote sensing-based data interpretation methods to further enhance the territorial and indicator system completeness.
(2)
This study has certain limitations in scope. It focused on three systems—water resources, socio-economy, and ecological environment—but as understanding of inter-system relationships deepens, coordinated development across additional dimensions (e.g., energy systems, food systems) should be considered. By constructing more diversified coupled systems and incorporating issues such as governance and social participation into comprehensive considerations, the patterns and characteristics of coordinated development can be revealed more comprehensively.
(3)
The depth of research methodologies could be further expanded. This study introduced machine learning approaches into coordinated development evaluation and prediction, improving upon traditional evaluation methods and enhancing result reliability. However, rapid advancements in computer technology in recent years have yielded numerous deep learning algorithms with more complex mechanisms and rigorous logic. Future research could explore the integration of deep learning-based evaluation models to uncover deeper inter-system connections, thereby providing more robust technical support for coordinated development.

Author Contributions

Conceptualization, S.L. and C.L.; methodology, S.L.; software, C.L.; validation, T.W., F.W. and W.S.; formal analysis, S.L.; investigation, W.S.; resources, F.W.; data curation, T.W.; writing—original draft preparation, S.L.; writing—review and editing, C.L.; visualization, C.L.; supervision, F.W.; project administration, W.S.; funding acquisition, S.L. All authors have read and agreed to the published version of the manuscript.

Funding

This study was supported by Open Research Fund of Key Laboratory of Water Safety for Beijing-Tianjin-Hebei Region of Ministry of Water Resources (IWHR-KLWS-202310), Natural Science Foundation of Henan Province (242300421252), National Natural Science Foundation of the People’s Republic of China (U2443203, 52279014), Major agricultural science and technology projects (NK202319020506).

Data Availability Statement

The data that support the findings of this study are available from the corresponding author upon reasonable request.

Conflicts of Interest

The authors declare no conflicts of interest.

References

  1. Chen, Q.; Zhu, M.; Zhang, C.; Zhou, Q. The driving effect of spatial-temporal difference of water resources carrying capacity in the Yellow River Basin. J. Clean. Prod. 2023, 388, 135709. [Google Scholar] [CrossRef]
  2. Li, M.; Yang, X.; Wang, K.; Di, C.; Xiang, W.; Zhang, J. Exploring China’s water scarcity incorporating surface water quality and multiple existing solutions. Environ. Res. 2024, 1, 118191. [Google Scholar] [CrossRef] [PubMed]
  3. Han, J.; Wang, C.; Deng, S.; Lichtfouse, E. China’s sponge cities alleviate urban flooding and water shortage: A review. Environ. Chem. Lett. 2023, 21, 1297–1314. [Google Scholar] [CrossRef]
  4. Bosco, C.; Seglem, N.K.; Sivertsen, E.; Jovanovié, O.; Helness, H. Developing a framework to assess water smartness and sustainability of circular economy solutions in the water sector. J. Clean. Prod. 2025, 517, 145874. [Google Scholar] [CrossRef]
  5. Yang, G.; Dong, Z.; Feng, S.; Li, B.; Sun, Y.; Chen, M. Early warning of water resource carrying status in Nanjing City based on coordinated development index. J. Clean. Prod. 2021, 284, 124696. [Google Scholar] [CrossRef]
  6. Zhang, C.; Chen, X.; Li, Y.; Ding, W.; Fu, G. Water-energy-food nexus: Concepts, questions and methodologies. J. Clean. Prod. 2018, 195, 525–639. [Google Scholar] [CrossRef]
  7. Zou, S.; Liao, Z.; Liu, Y.; Fan, X. Research on the Impact of Heterogeneous Environmental Regulation on the Coordinated Development of China’s Water–Energy–Food System from a Spatial Perspective. Sustainability 2024, 16, 818. [Google Scholar] [CrossRef]
  8. Wang, Y.; Li, N.; Song, J.; Li, Q. Solving the sustainable development dilemma in the Yellow River Basin of China: Water-energy-food linkages. J. Clean. Prod. 2025, 490, 144797. [Google Scholar] [CrossRef]
  9. Tong, L.; Luo, M. Spatiotemporal Evolution Characteristics and Driving Factors of Water-Energy-Food-Carbon System Vulnerability: A Case Study of the Yellow River Basin, China. Sustainability 2024, 16, 1002. [Google Scholar] [CrossRef]
  10. Li, Z.; Li, X.; Wang, Y. Does Decentralized Food Crop Cultivation Threaten Water-Land-Food Nexus? A Spatial Econometric Analysis. Water 2023, 15, 1096. [Google Scholar] [CrossRef]
  11. Enteshari, S.; Safavi, H.R.; van der Zaag, P. Simulating the interactions between the water and the socio-economic system in a stressed endorheic basin. Hydrol. Sci. J. 2020, 65, 2159–2174. [Google Scholar] [CrossRef]
  12. Haak, L.; Pagilla, K. The Water-Economy Nexus: A Composite Index Approach to Evaluate Urban Water Vulnerability. Water Resour. Manag. 2020, 34, 409–423. [Google Scholar] [CrossRef]
  13. Ren, B.; Sun, B.; Shi, X.; Zhao, S.; Wang, X. Analysis of the Cooperative Carrying Capacity of Ulan Suhai Lake Based on the Coupled Water Resources-Water Environment-Water Ecology System. Water 2022, 14, 3102. [Google Scholar] [CrossRef]
  14. Zhang, Z.; Qi, J.; Wang, Q.; Wang, S.; Hu, F. Analysis and forecast of the coupled development level of socioeconomy ecological environment and tourism in China’s Yellow River Basin. Sci. Rep. 2025, 15, 5446. [Google Scholar] [CrossRef]
  15. Khare, R.; Villuri, V.G.K.; Chaurasia, D. Urban sustainability assessment: The evaluation of coordinated relationship between BRTS and land use in transit-oriented development mode using DEA model. Ain Shams Eng. J. 2021, 12, 107–117. [Google Scholar] [CrossRef]
  16. Luo, Z.; Zuo, Q. Evaluating the coordinated development of social economy, water, and ecology in a heavily disturbed basin based on the distributed hydrology model and the harmony theory. J. Hydrol. 2019, 574, 226–241. [Google Scholar] [CrossRef]
  17. Lu, Z.; Feng, Q.; Xiao, S.; Xie, J.; Zou, S.; Yang, Q.; Si, J. The impacts of the ecological water diversion project on the ecology-hydrology-economy nexus in the lower reaches in an inland river basin. Resour. Conserv. Recycl. 2021, 164, 105154. [Google Scholar] [CrossRef]
  18. Wang, X.; Liu, L.; Zhang, S.; Gao, C. Dynamic simulation and comprehensive evaluation of the water resources carrying capacity in Guangzhou city, China. Ecol. Indic. 2022, 135, 108528. [Google Scholar] [CrossRef]
  19. Chen, W.; Chen, Y.; Feng, Y. Assessment and Prediction of Water Resources Vulnerability Based on a NRS-RF Model: A Case Study of the Song-Liao River Basin, China. Entropy 2021, 23, 882. [Google Scholar] [CrossRef]
  20. Zhou, R.; Jin, J.; Wu, C.; Zhou, L.; Zhang, L.; Cui, Y.; Zhang, Y.; Zhou, Y. Connection number based model for coordination development evaluation of regional water resources, social economy and ecological environment complex system. J. Environ. Manag. 2023, 339, 117913. [Google Scholar] [CrossRef]
  21. Wang, X.; Dong, Z.; Xu, W.; Luo, Y.; Zhou, T.; Wang, W. Study on Spatial and Temporal Distribution Characteristics of Coordinated Development Degree among Reginal Water Resources, Social Economy, and Ecological Environment Systems. Int. J. Environ. Res. Public Health 2019, 16, 4213. [Google Scholar] [CrossRef]
  22. Lü, S.; Lü, C.; Liu, P.; Zhao, H.; Wang, F. Regional water cycle health evaluation and obstacle factor analysis: A case study of the Yellow River basin in Henan Province, China. Ecol. Indic. 2024, 166, 112500. [Google Scholar] [CrossRef]
  23. Caiado, J. Performance of combined double seasonal univariate time series models for forecasting water demand. J. Hydrol. Eng. 2010, 15, 215–222. [Google Scholar] [CrossRef]
  24. Wang, X.; Tian, W.; Liao, Z. Framework for Hyperparameter Impact Analysis and Selection for Water Resources Feedforward Neural Network. Water Resour. Manag. 2022, 36, 4201–4217. [Google Scholar] [CrossRef]
Figure 1. Structural framework diagram.
Water 17 02093 g001
Figure 2. Diagram of coordinated evolution of dual systems in China.
Water 17 02093 g002
Figure 3. Coordinated degree of water resources–economic society–ecological environment system.
Water 17 02093 g003
Figure 4. Spatial evolution map of coordinated development of water resources–economic society–ecological environment.
Water 17 02093 g004
Figure 5. Error testing of prediction models.
Water 17 02093 g005
Figure 6. Increase in coordination degree under different scenarios.
Water 17 02093 g006
Table 1. The index system for coordinated development of regional water resources–economic society–ecological environment.
Criterion LayerElement LayerIndicator LayerUnitCharacteristic
Water resources subsystemWater resource endowmentPer capita water resourcesm3+
Water yield modulus10,000 m3/km2+
Development and usePercentage of groundwater supply%
Per capita domestic water consumptionm3+
Water consumption per CNY 10,000 of GDPm3
Water consumption for CNY 10,000 of industrial added value industrym3
Average acreage of water use for agricultural irrigationm3
Water hazard riskProportion of area affected by drought and water damage to crops%
Fluctuation range of precipitation%
Percentage of soil and water loss area%
Economic society subsystemEconomic foundationPer capita GDPCNY 10,000 +
Per capita gross product of industryCNY 10,000 +
Per capita disposable income of urban residentsCNY 10,000 +
Social developmentPopulation density+
Urbanization rate%+
Natural population growth rate+
Percentage of area under cash crops%+
Grain production per unit areat/hm2+
Percentage of tertiary GDP%+
Percentage of employees in the tertiary sector%+
Capital investmentPercentage of expenditure on science and technology%+
Percentage of expenditure on agriculture, forestry and water affairs%+
Percentage of investment in the water sector%+
Ecological environment
subsystem
Natural ecologyForest cover%+
Percentage of wetland area%+
Normalized difference vegetation index---+
Sustainable developmentPercentage of ecological water use%+
Sewage treatment rate%+
Drainage network densitykm/km2+
Percentage of recycled water supply%+
Percentage of cleaner electricity generation%+
Chemical oxygen demand emissions per 10,000 yuan of GDPkg-
Habitat environmentGreen coverage rate of built-up area%+
Harmless treatment rate of domestic waste%+
Per capita parkland aream2+
(“+” denotes a positive indicator, where a higher value indicates a better condition of the indicators, while “−” denotes a negative indicator, where a higher value indicates a worse condition; based on the exchange rate on 5 July 2025, CNY 10,000 is equivalent to USD 1395.63.)
Disclaimer/Publisher’s Note: The statements, opinions and data contained in all publications are solely those of the individual author(s) and contributor(s) and not of MDPI and/or the editor(s). MDPI and/or the editor(s) disclaim responsibility for any injury to people or property resulting from any ideas, methods, instructions or products referred to in the content.

