
Analysis of the Intermittent Characteristics of Streamflow in Taiwan


Abstract
1. Introduction
2. Materials and Methods
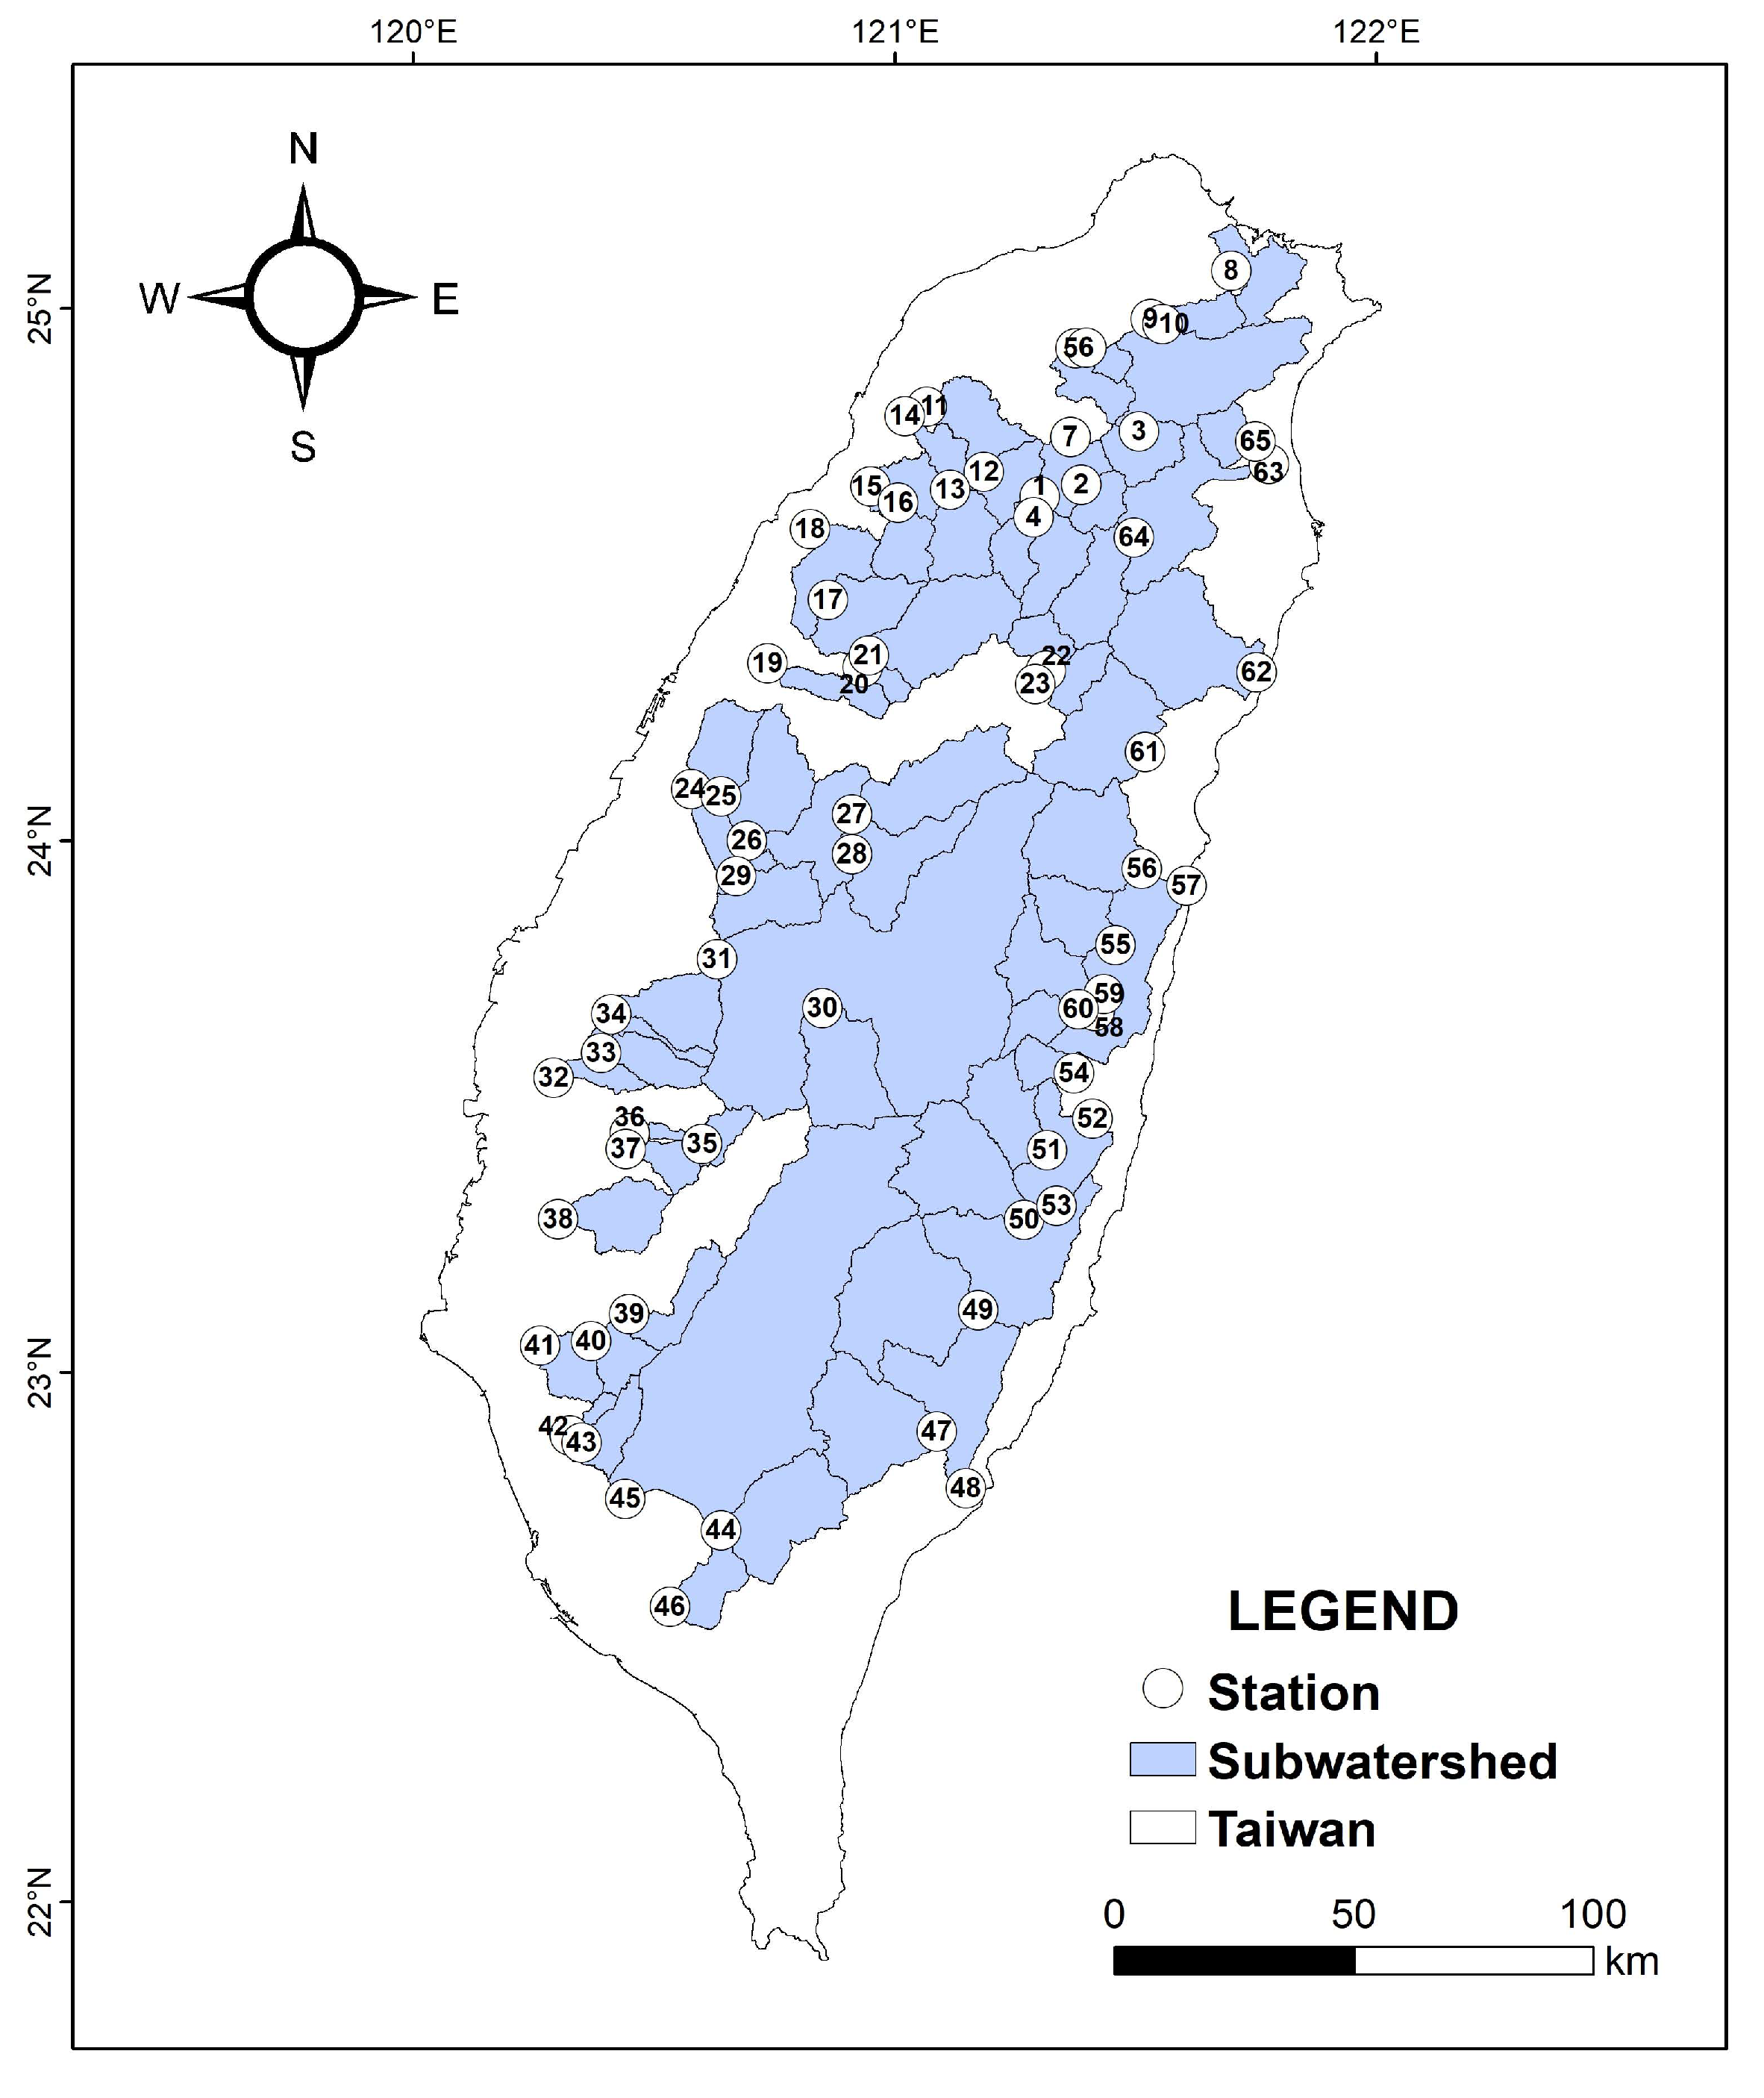
2.1. Study Area
2.2. Database
2.2.1. Hydrological Indicators
2.2.2. Catchment Attributes
2.2.3. Regional Climate Indicators
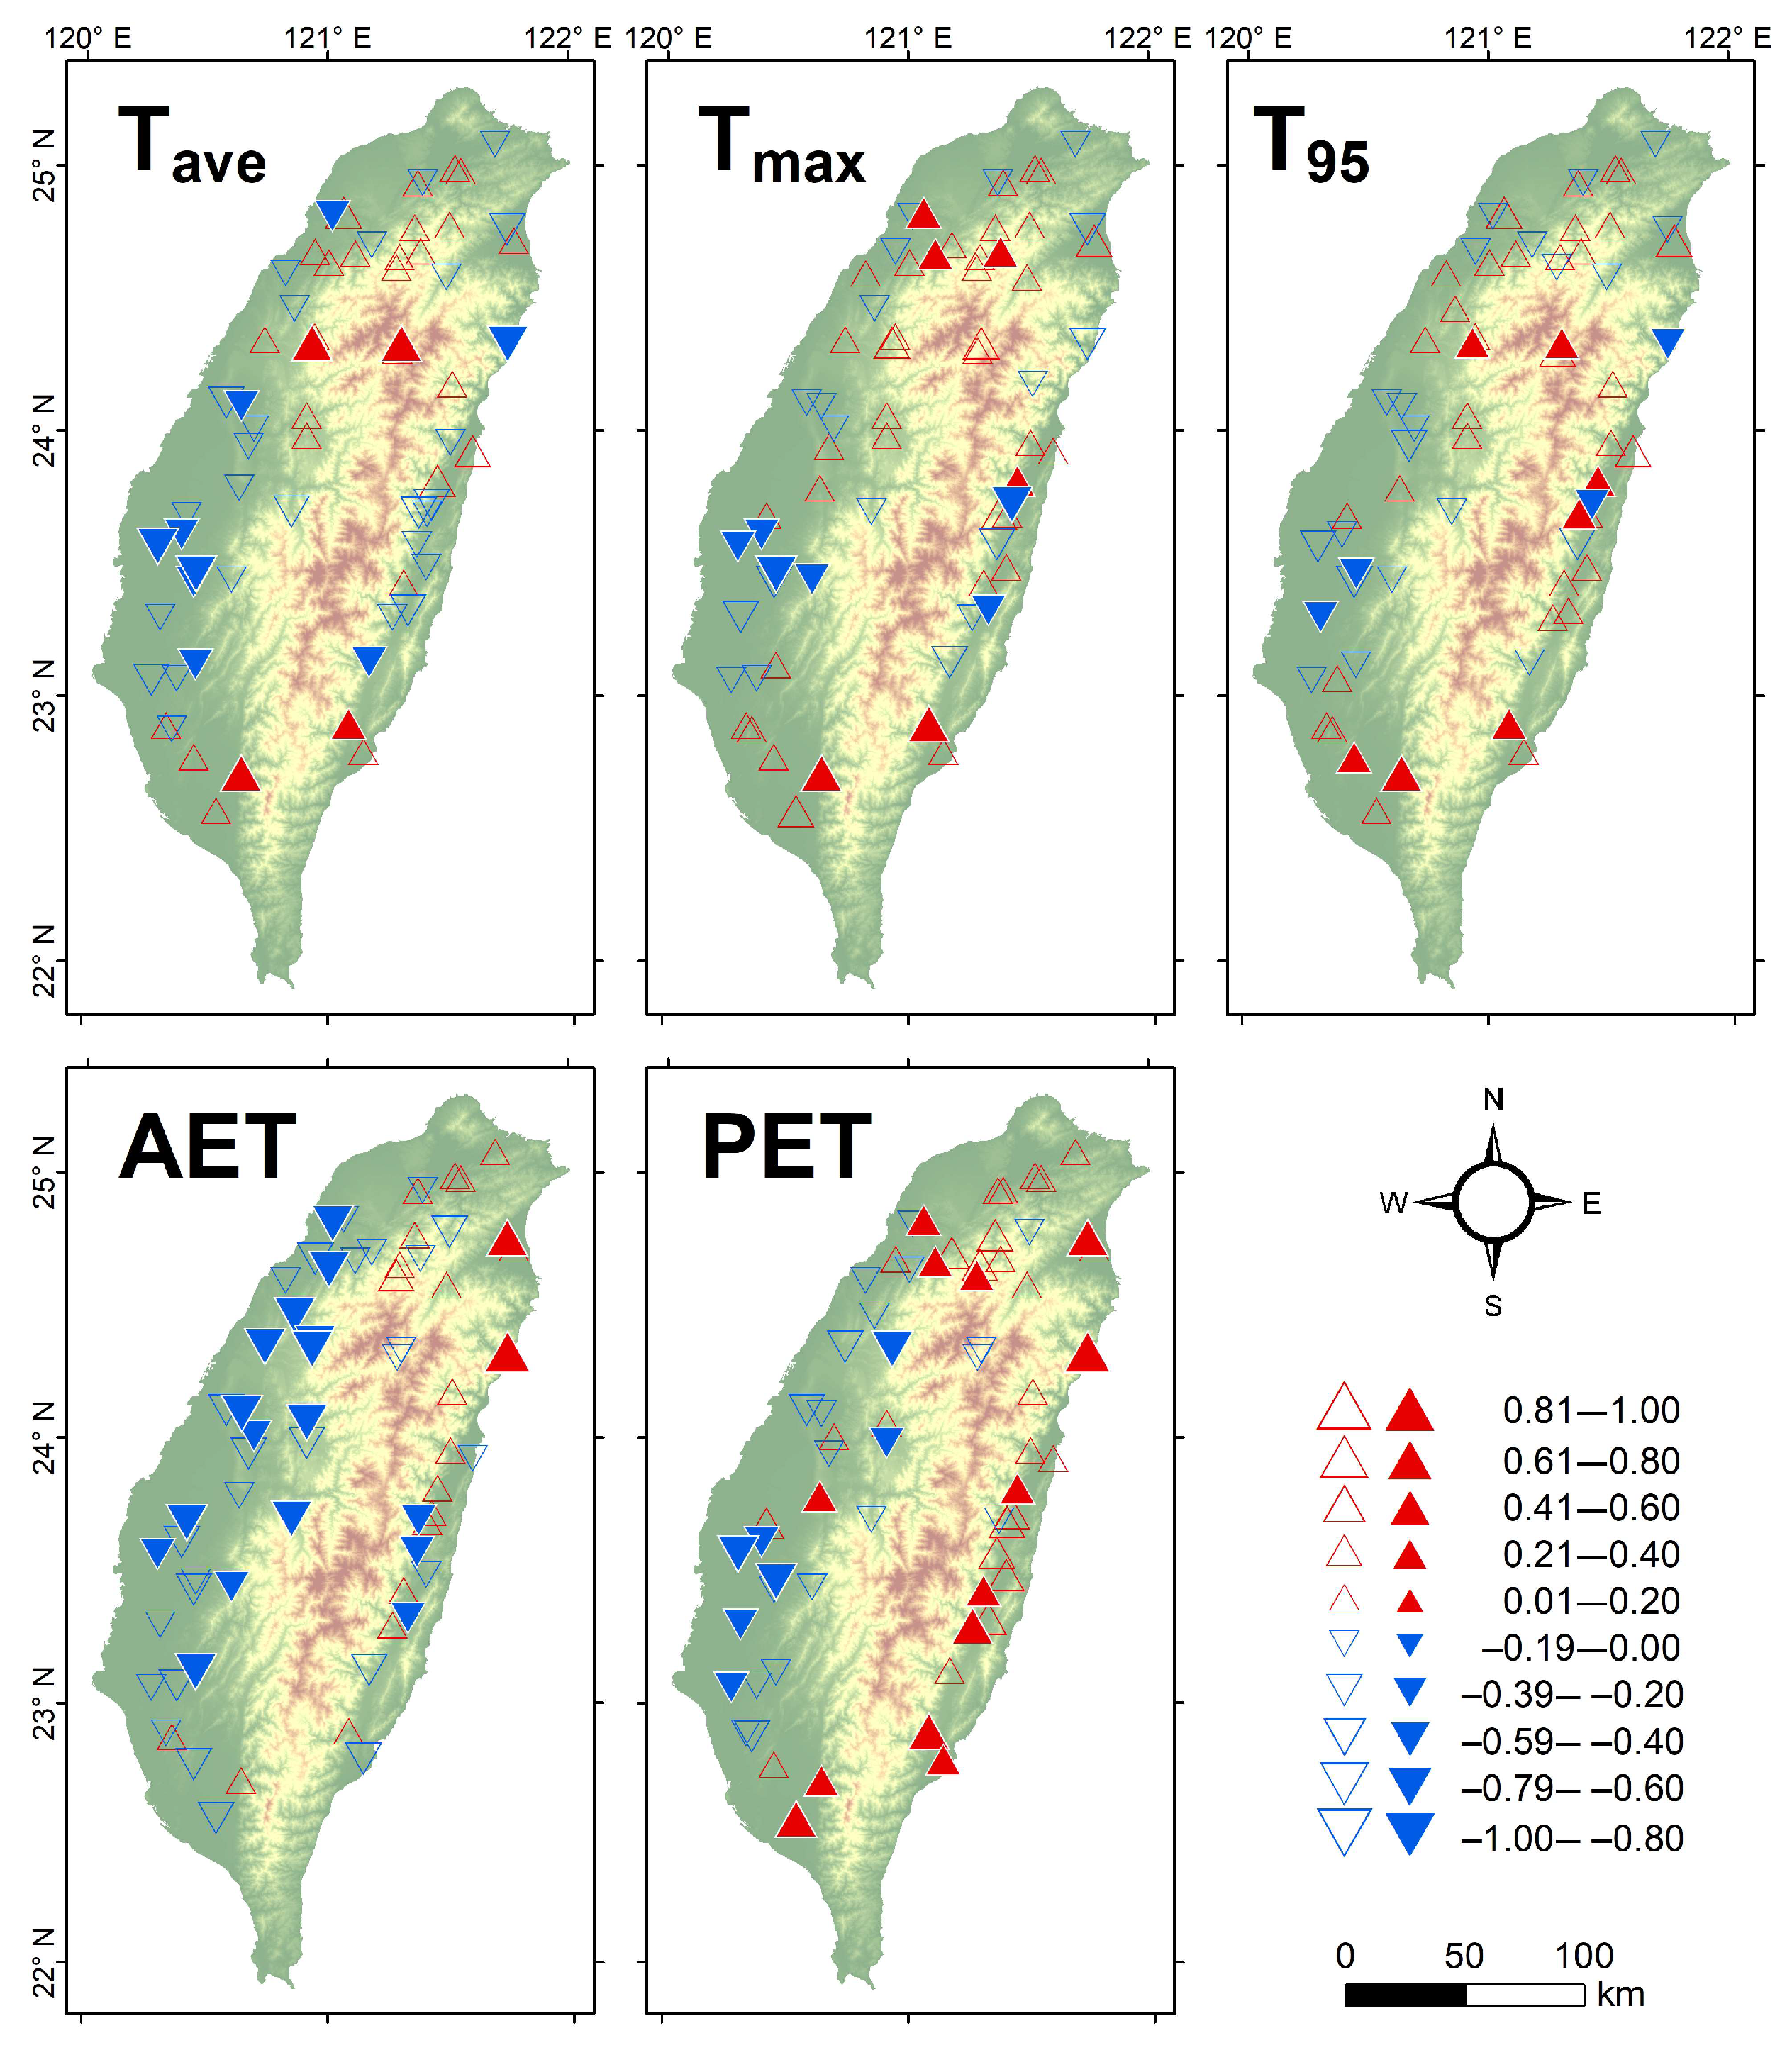
- Temperature indicators: (1) annual mean daily temperature (Tave); (2) annual maximum of daily maximum temperatures (Tmax); (3) 95th percentile of daily maximum temperatures (T95); (4) actual evapotranspiration (AET); and (5) potential evapotranspiration (PET).
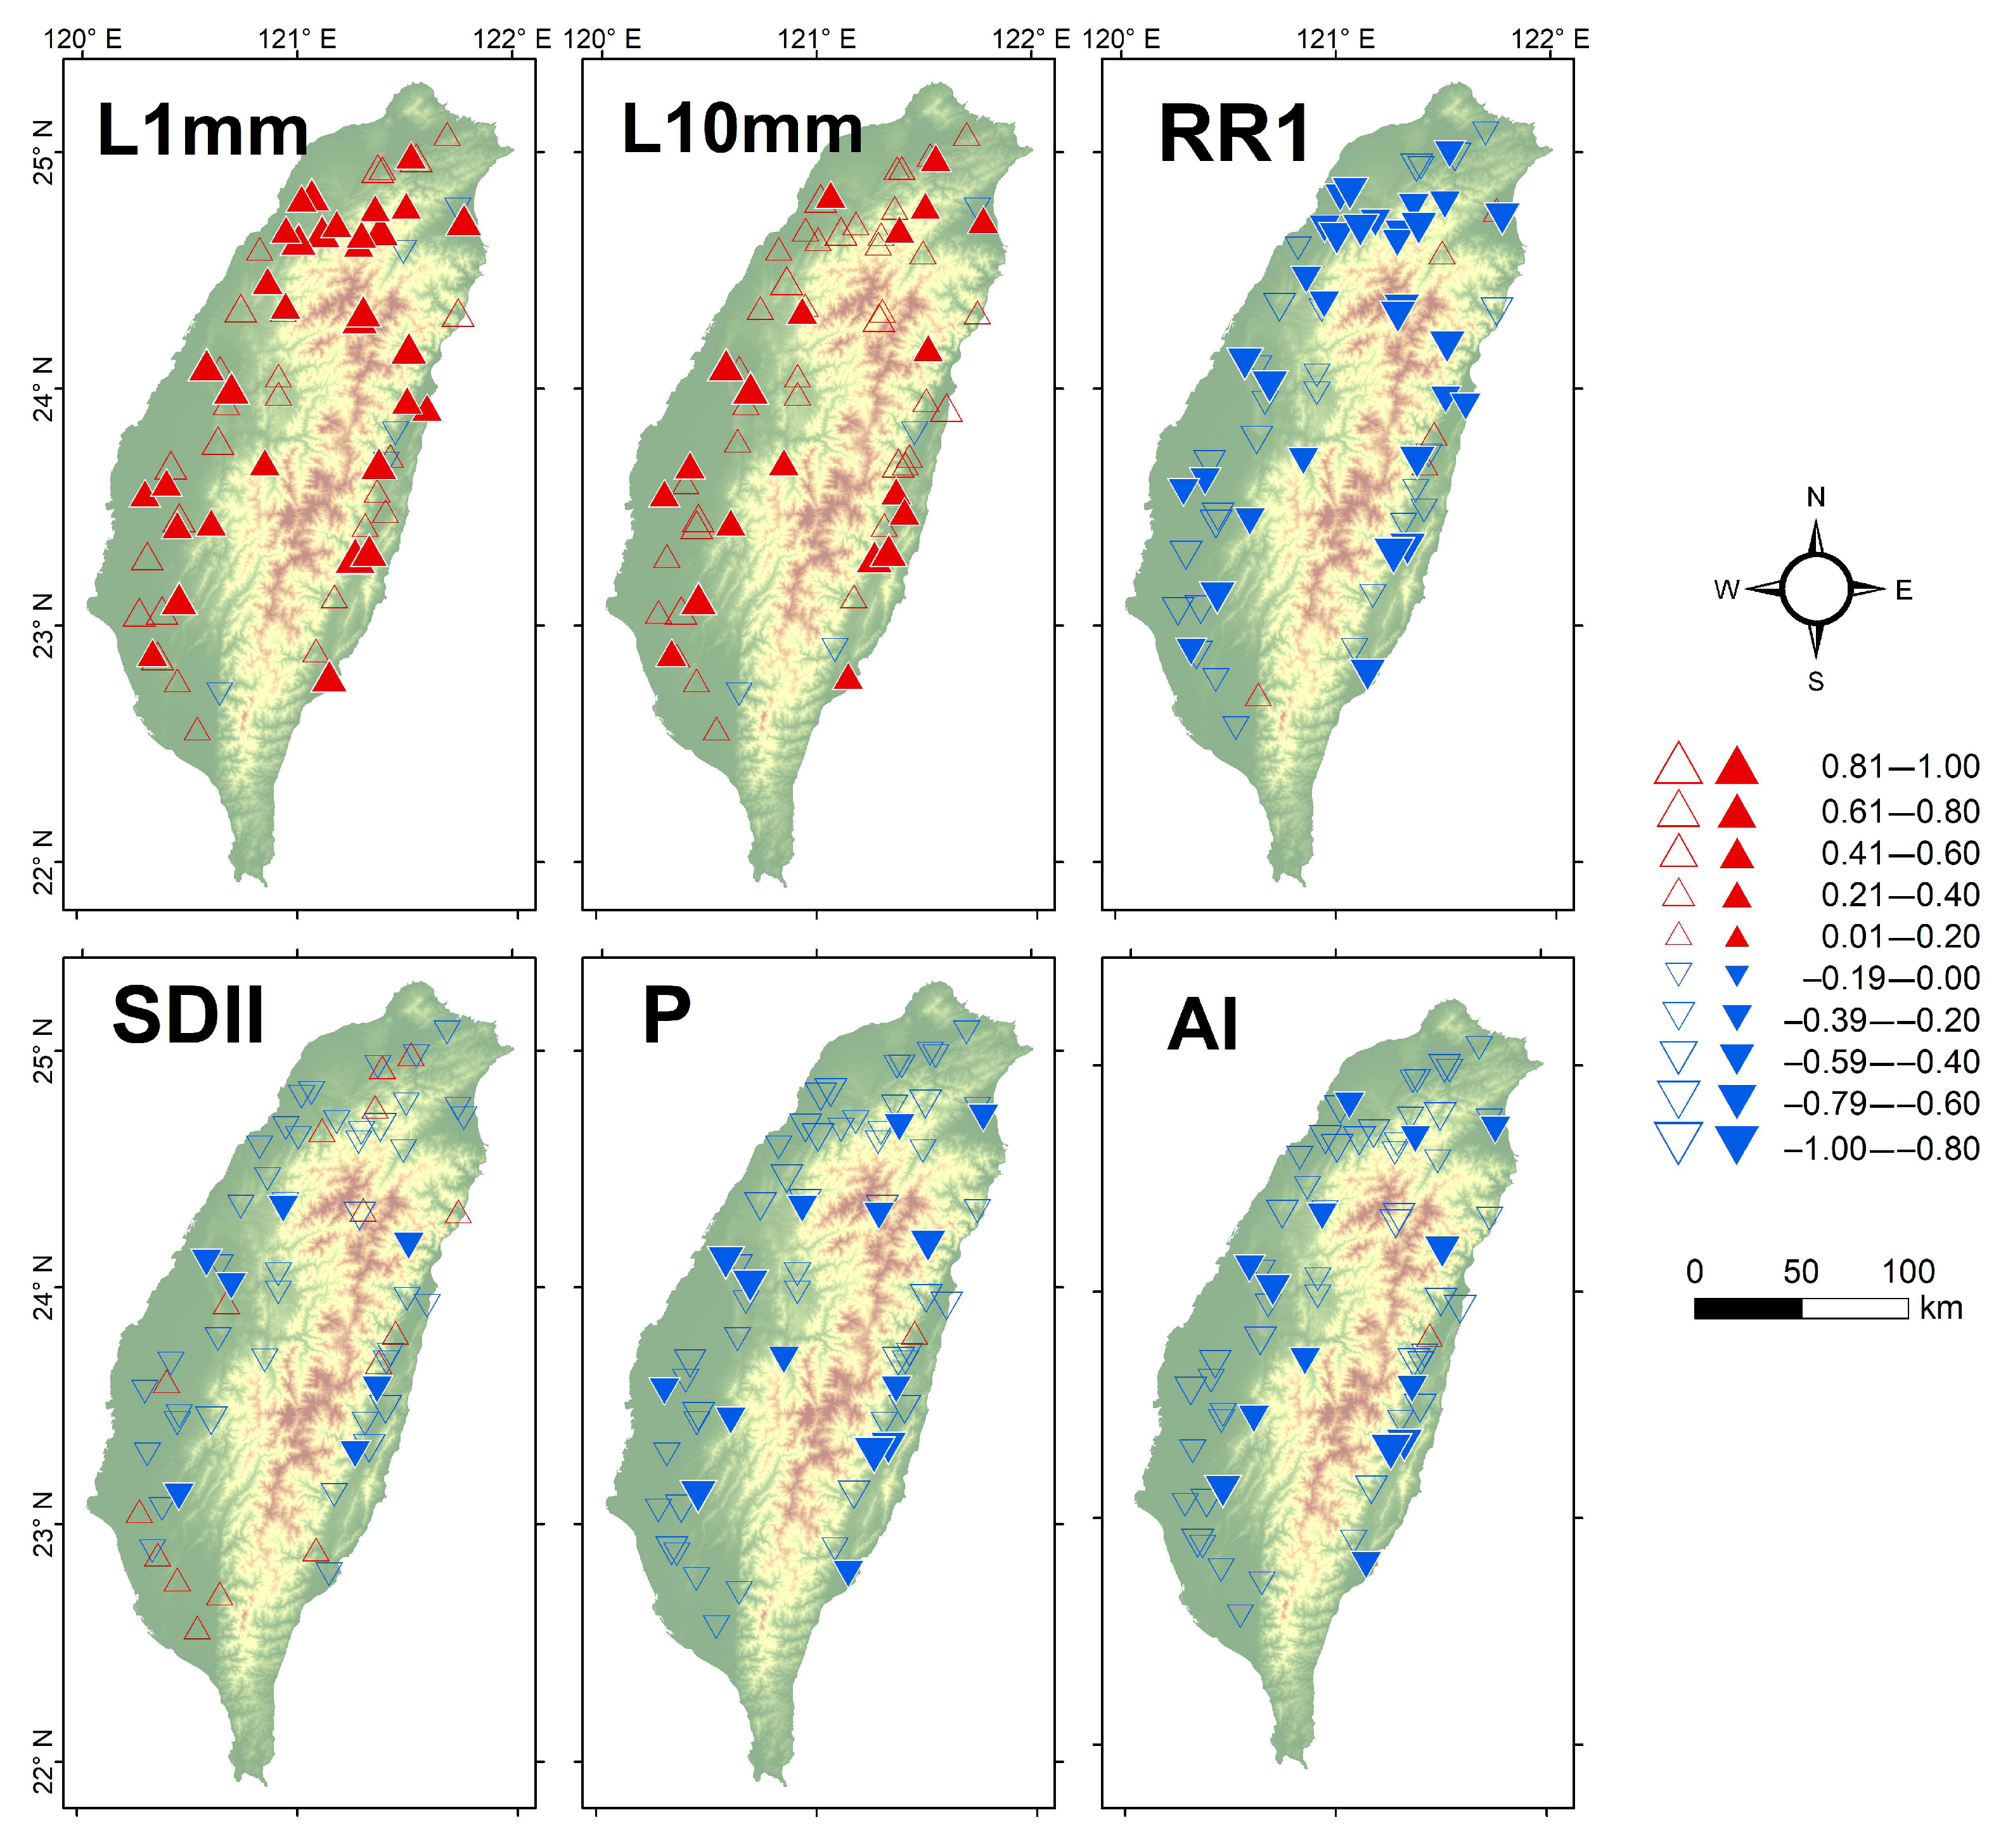
- Precipitation indicators: (6) proportion of days with precipitation less than 1 mm (L1mm); (7) proportion of days with precipitation less than 10 mm (L10mm); (8) number of rainfall days (RR1), defined as the total number of days with daily precipitation ≥ 1 mm, measured in days; (9) simple daily intensity index (SDII), defined as the total precipitation on wet days divided by the number of wet days (RR1), in mm/day; (10) annual total precipitation (P), in mm; and (11) annual aridity index (AI), calculated as the ratio of precipitation to potential evapotranspiration (P/PET), representing humidity or drought risk.
2.3. Methods
2.3.1. Flow Intermittency
2.3.2. Modified Simplified Calculation Formula for Seasonality of Low Flow
2.3.3. Trend Analysis
2.3.4. Principal Component Analysis
2.3.5. Correlation Analysis
3. Results
3.1. Analysis of Hydrology
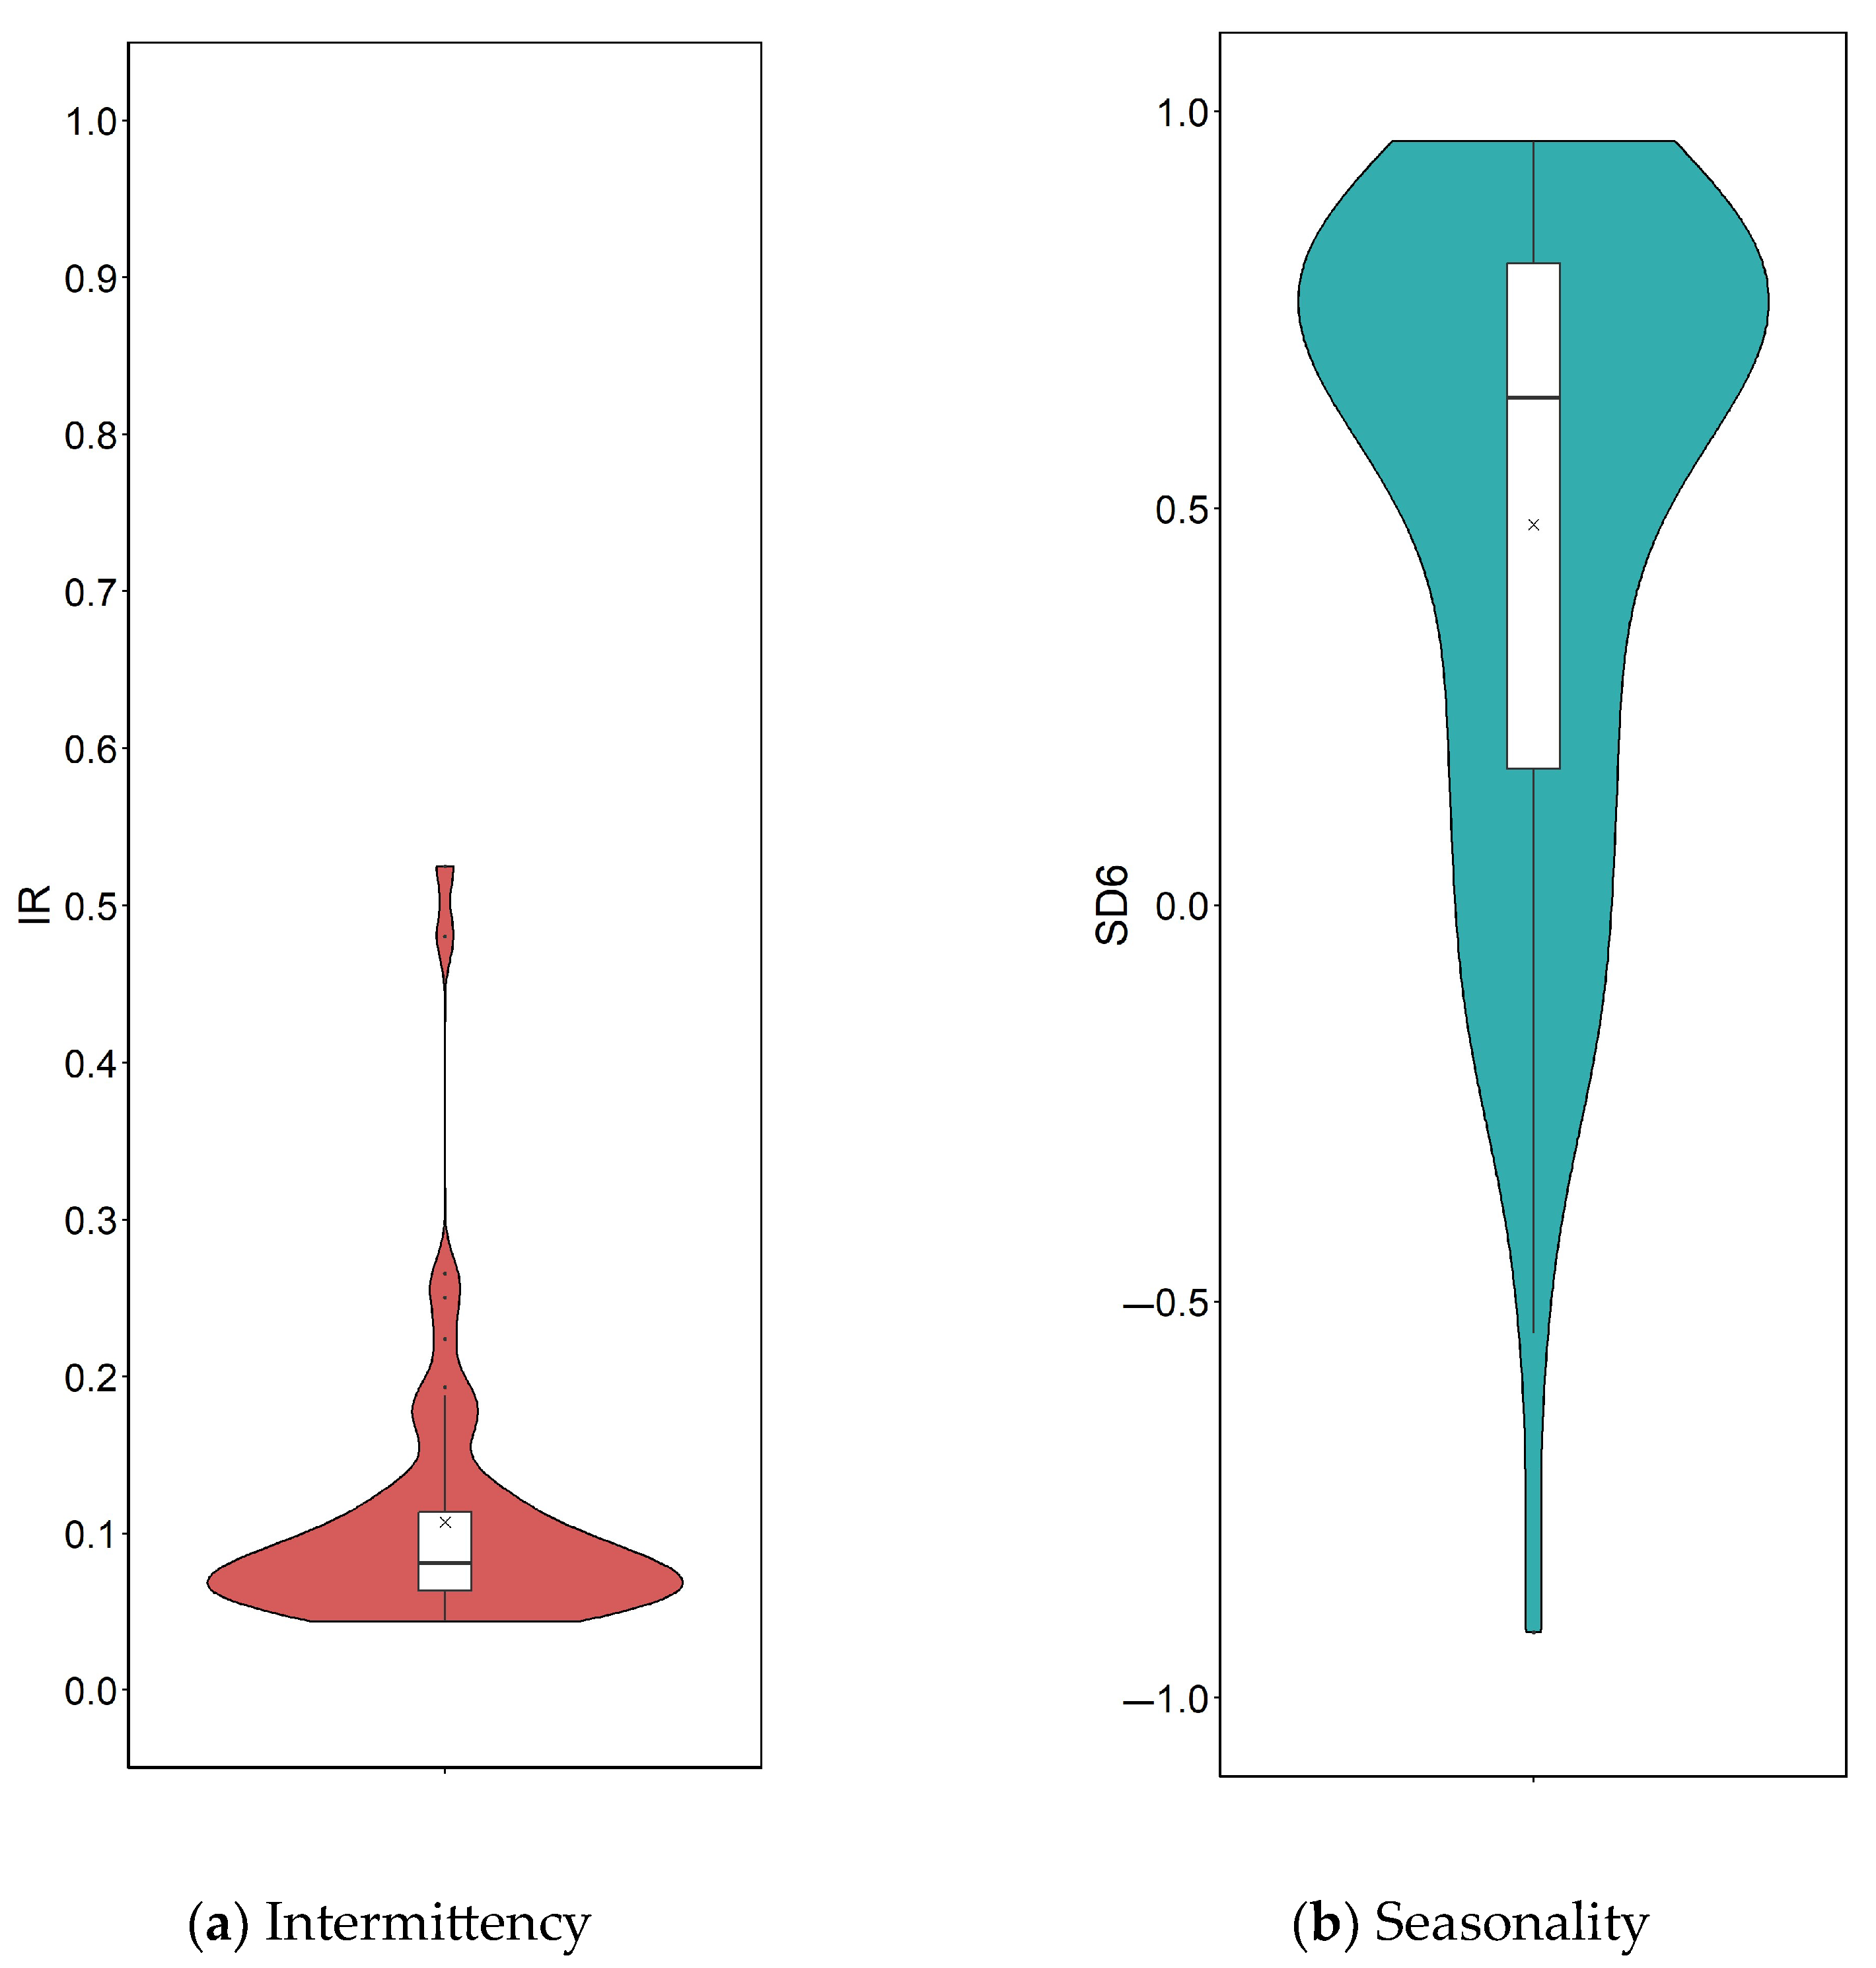
3.1.1. The Intermittency of Taiwan Rivers
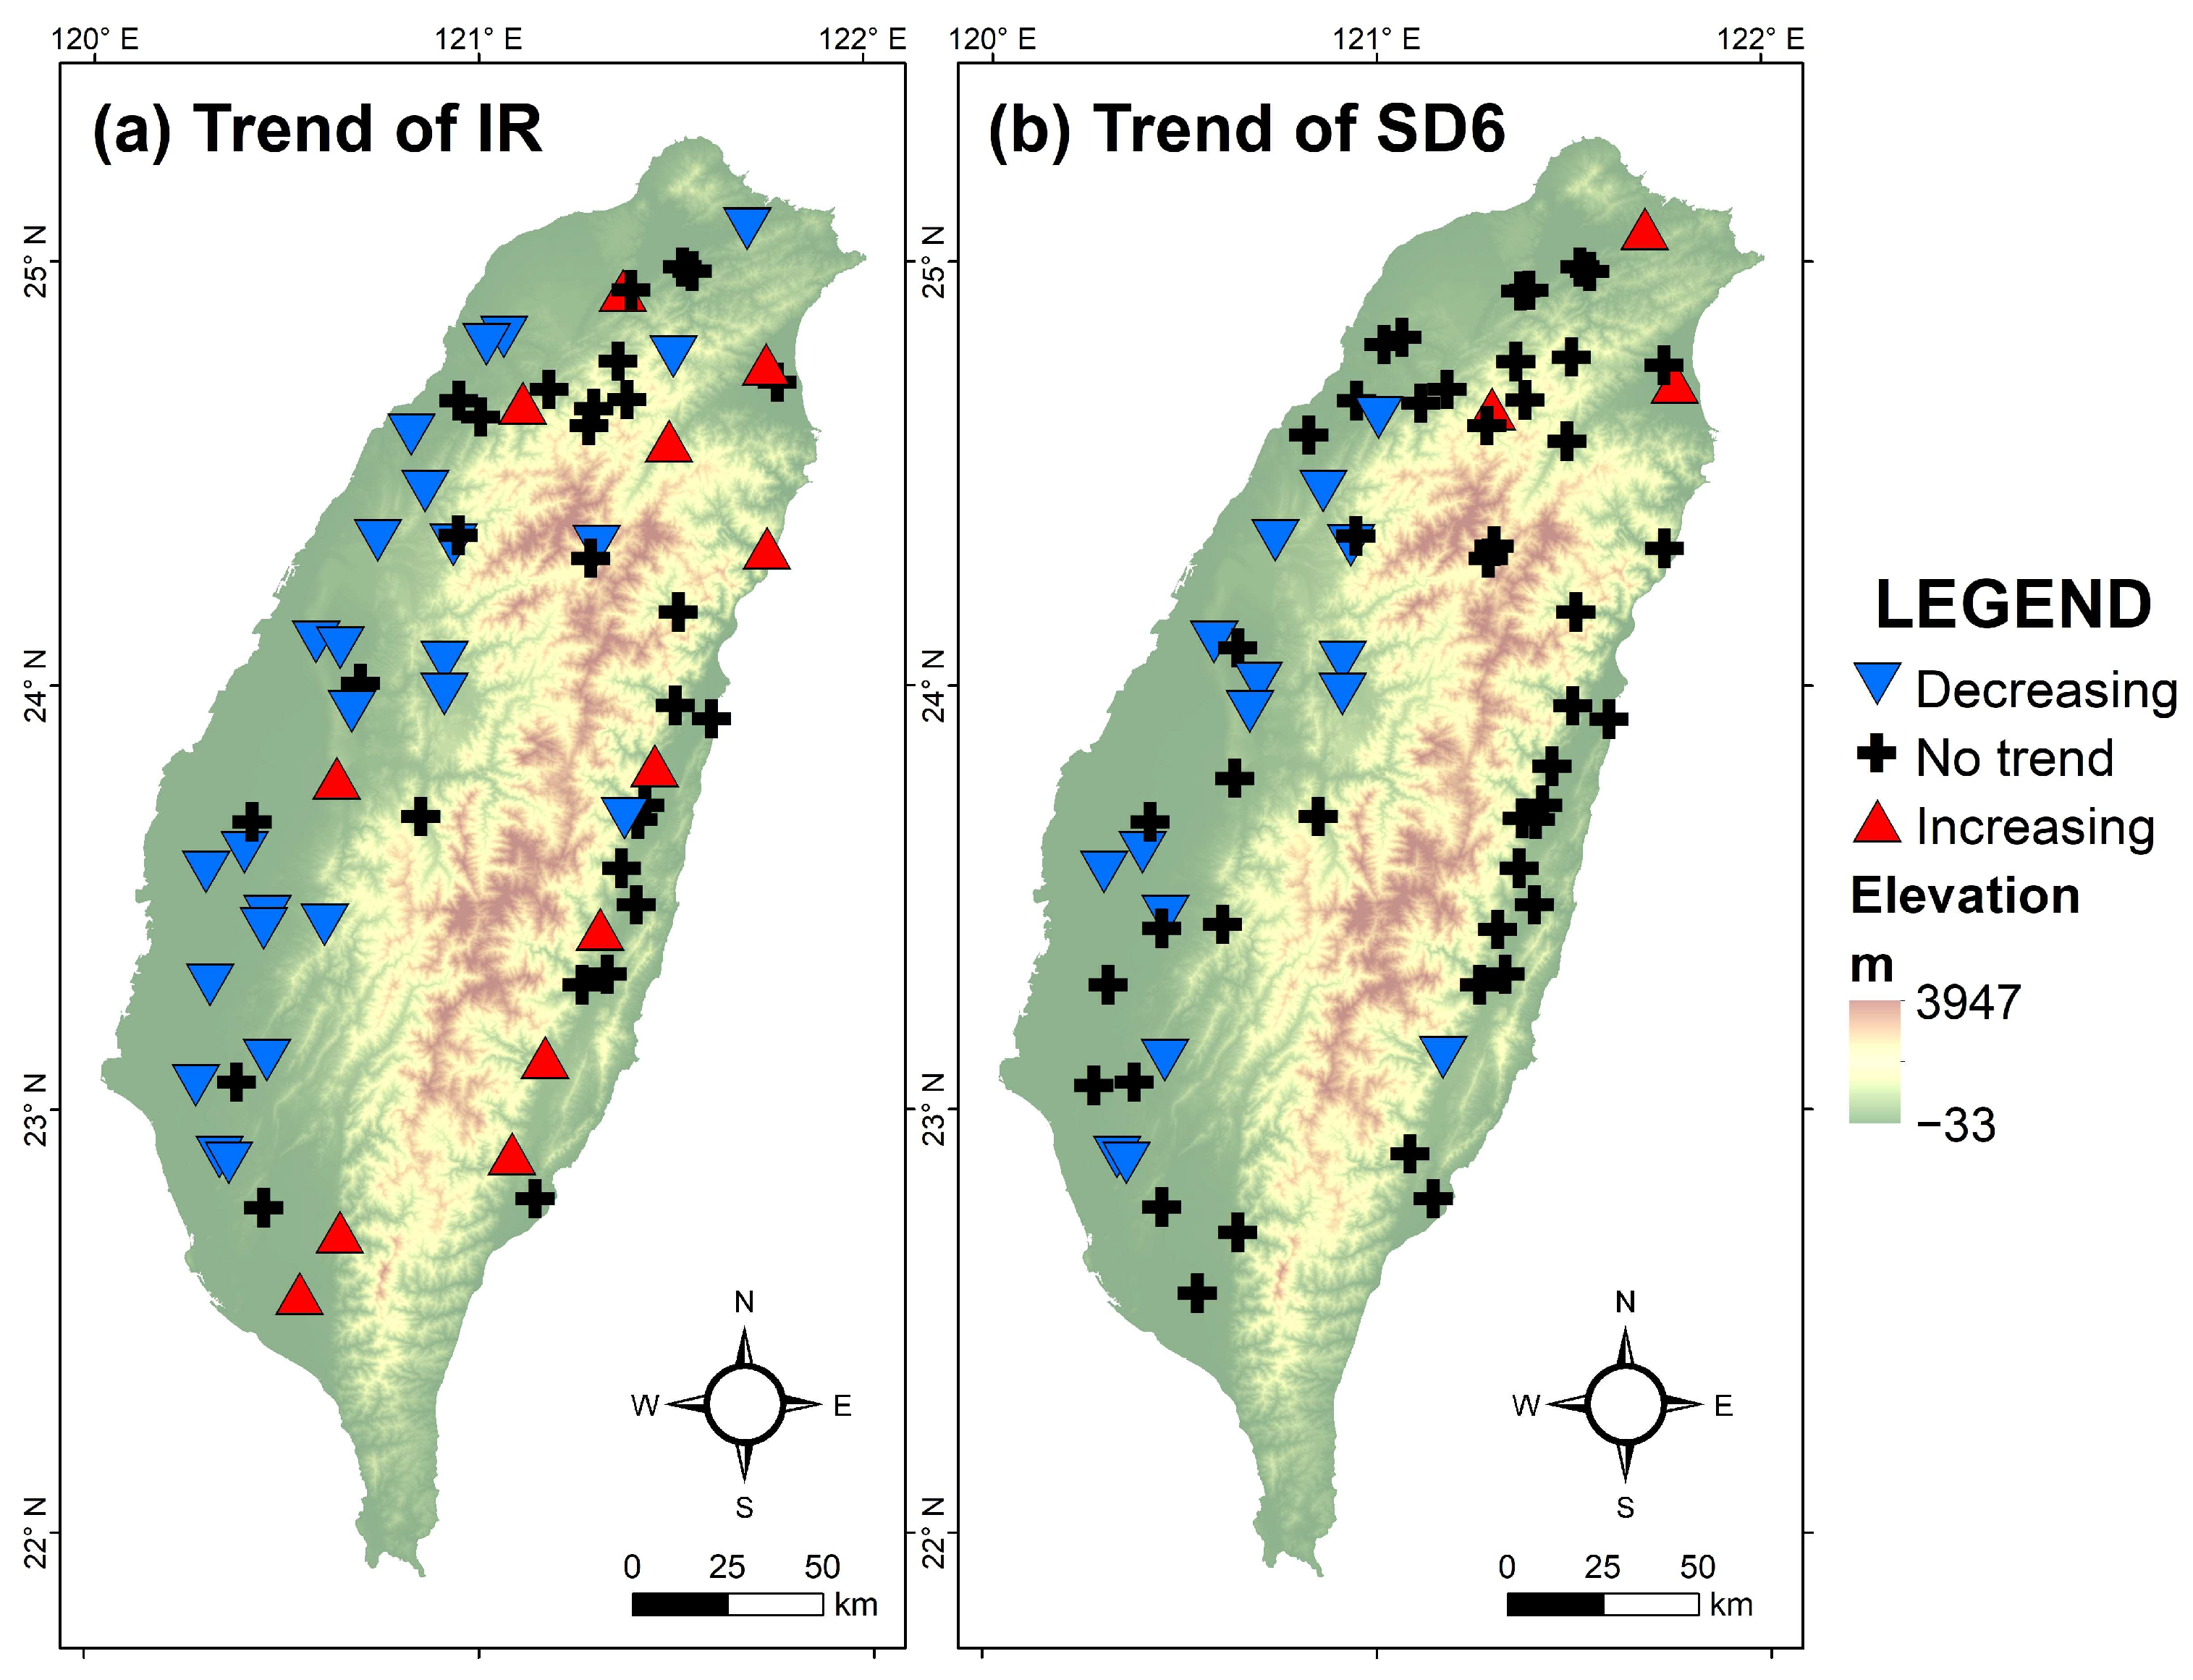
3.1.2. Trend of Hydrological Indices
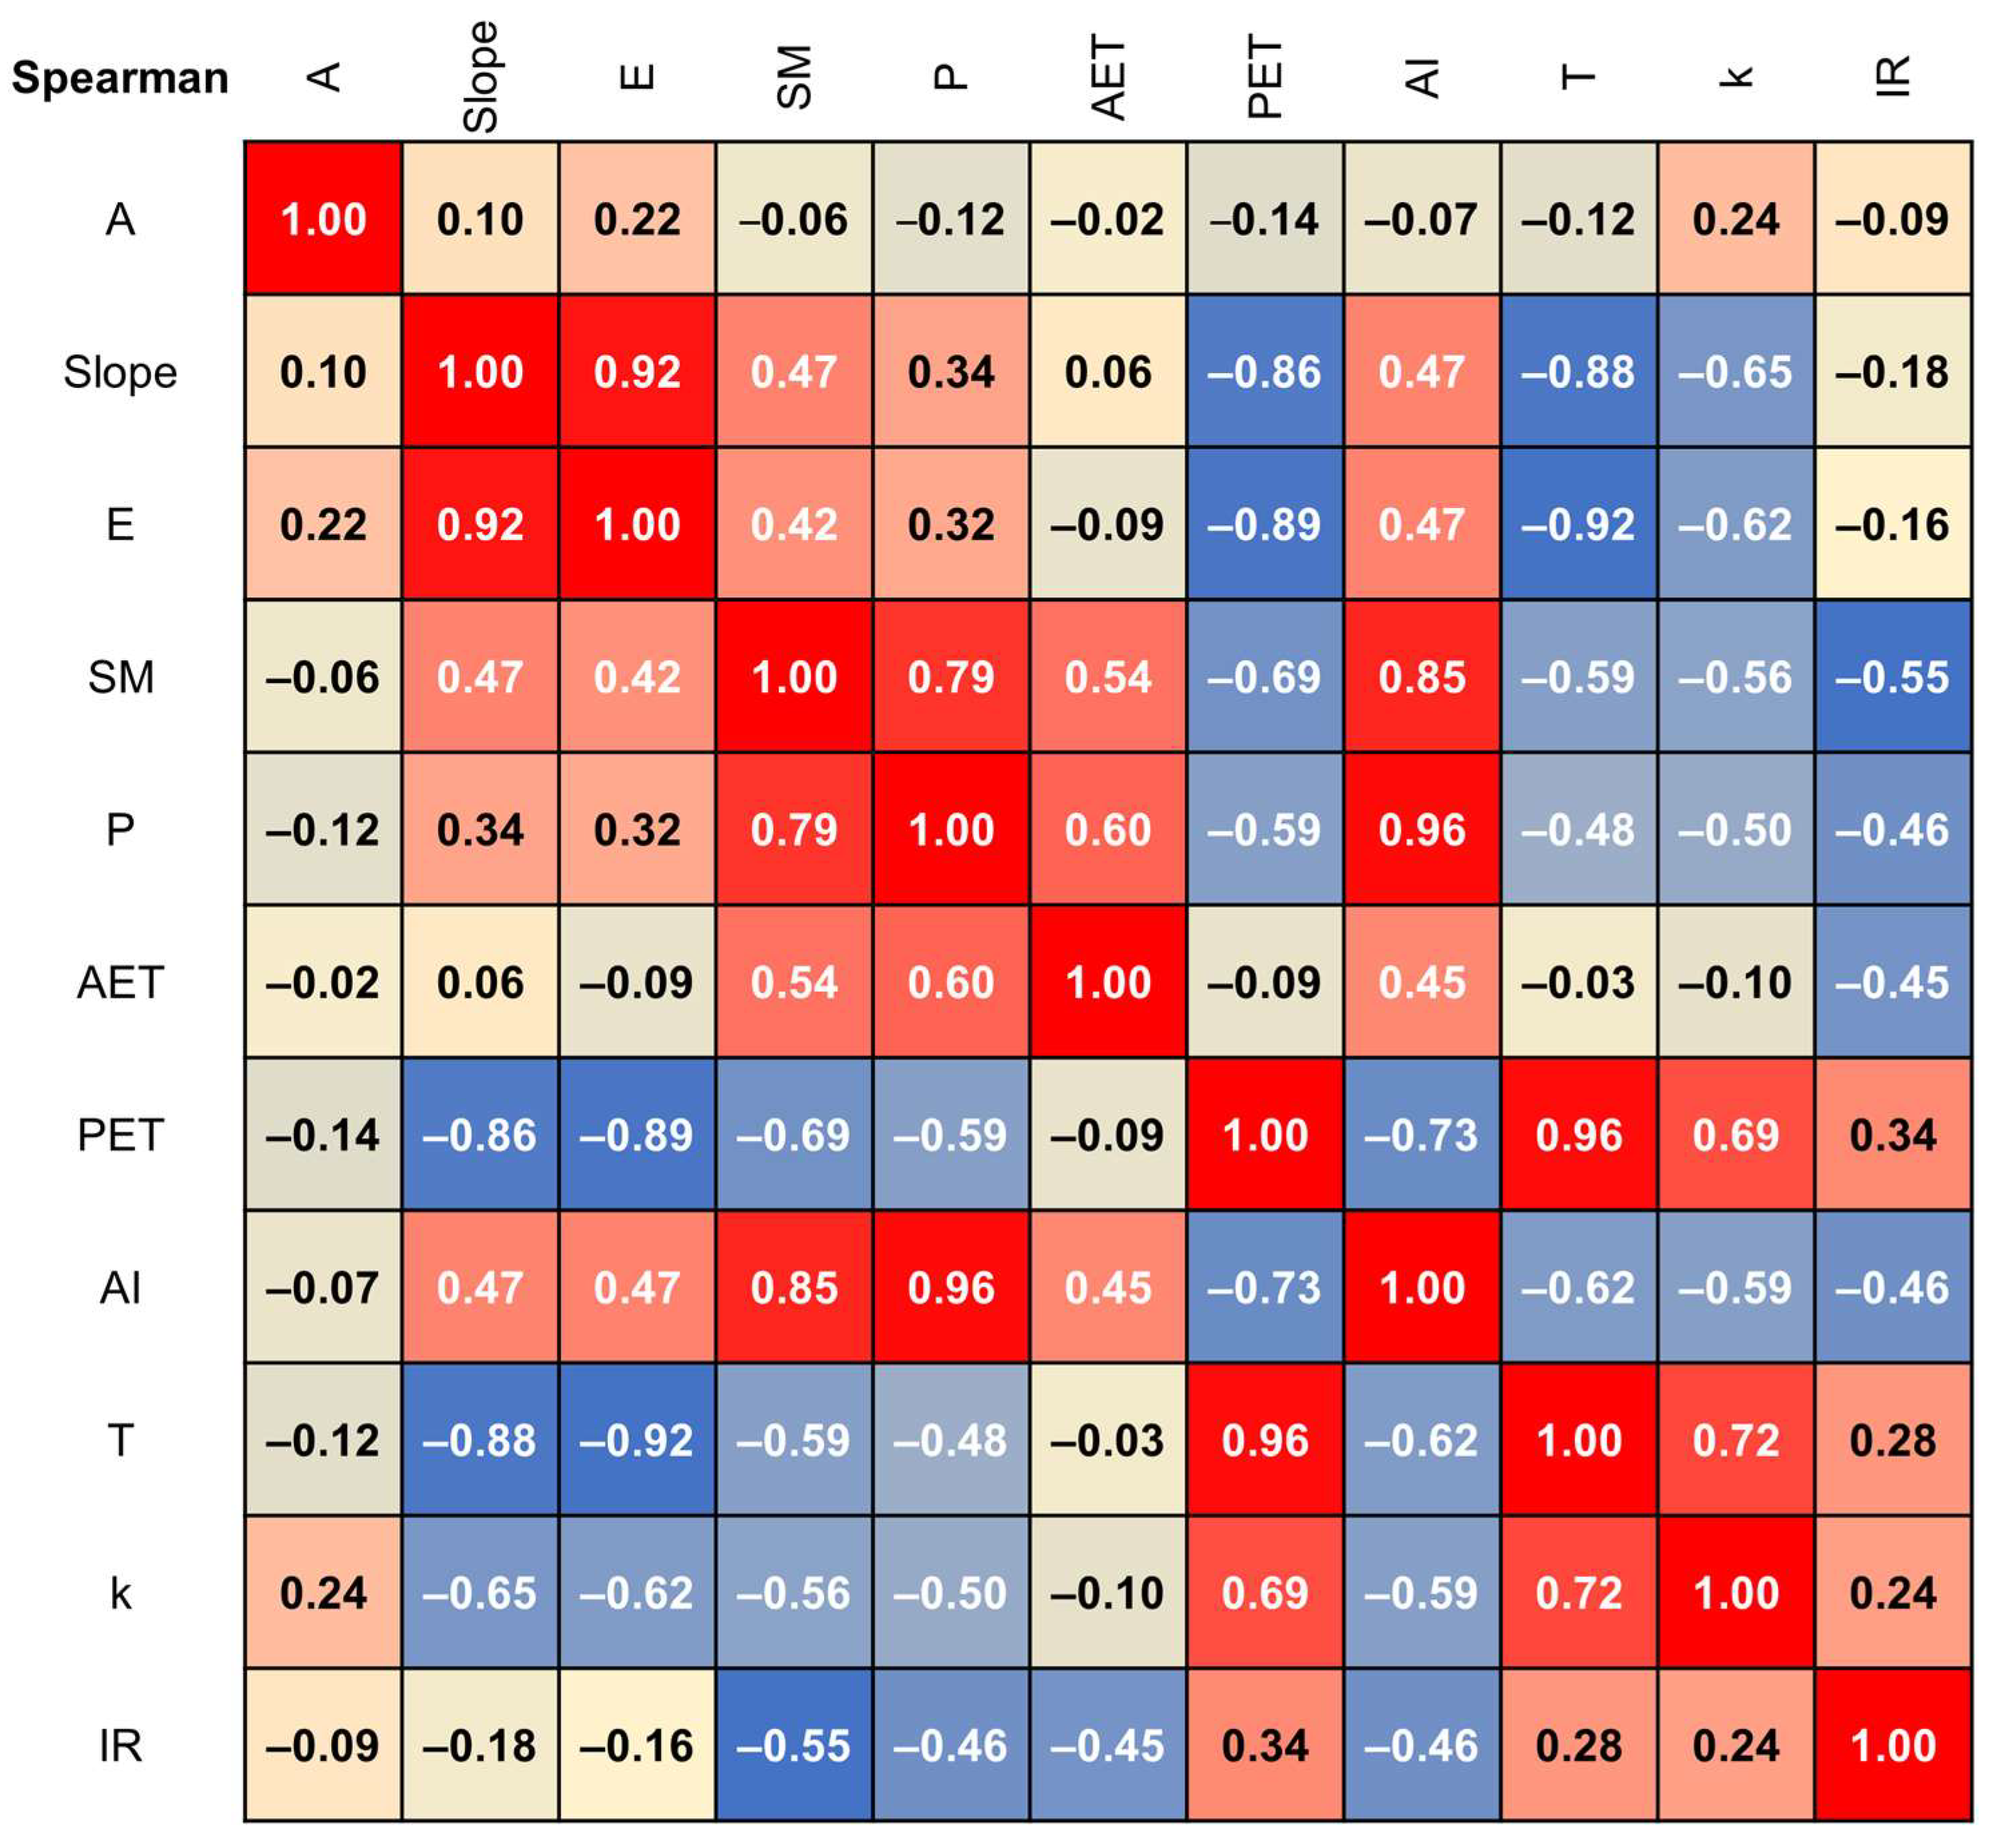
3.2. Spatial Correlation Between Catchment Attributes and Intermittency
3.2.1. Relationship Between Principal Components and Catchment Attributes
3.2.2. Correlation Between Principal Components and Intermittency
3.3. Temporal Correlation Between Climatic Indices and Intermittency
3.3.1. Temperature-Related Climatic Indices
3.3.2. Precipitation-Related Climatic Indices
4. Discussion
5. Conclusions
- The results of hydrological indicators showed that most rivers in Taiwan maintain flow throughout the year, indicating low intermittency, with an average of approximately 44 low-flow days per year. These rivers can be classified as perennial. Low-flow events primarily occurred during the dry season and were concentrated in winter, exhibiting strong seasonal patterns influenced by the monsoon climate. Over time, river intermittency decreased in the western regions and increased in the eastern regions, while flow variability tended to decline. Although the seasonal concentration (SD6) remained stable in most locations (71%), about 25% of the western sites showed signs of decreasing concentration.
- The analysis of catchment attributes during the 6-month winter period revealed that variations among Taiwan’s catchments were mainly driven by soil moisture and catchment area. Among them, intermittency showed a significant negative correlation with PC1, which represents soil moisture (ρ = −0.57, p-value < 0.05), but it had little association with catchment area. This suggests that catchments with lower soil moisture, higher potential evapotranspiration, or higher permeability tend to exhibit greater intermittency in streamflow.
- The analysis of correlations between intermittency and climate indices indicated that, compared to temperature or total precipitation, the frequency of non-rainy days (L1mm, defined as the proportion of days with rainfall less than 1 mm) had the strongest association with stream intermittency. In particular, the number of rainy days (RR1) was strongly and negatively correlated with low-flow occurrence, showing that rainfall frequency plays a dominant role in controlling low-flow conditions in Taiwan. This also implies a limited capacity for streamflow retention.
Author Contributions
Funding
Data Availability Statement
Conflicts of Interest
References
- Busch, M.H.; Costigan, K.H.; Fritz, K.M.; Datry, T.; Krabbenhoft, C.A.; Hammond, J.C.; Zimmer, M.; Olden, J.D.; Burrows, R.M.; Dodds, W.K.; et al. What’s in a Name? Patterns, Trends, and Suggestions for Defining Non-Perennial Rivers and Streams. Water 2020, 12, 1980. [Google Scholar] [CrossRef]
- Gómez-Gener, L.; Siebers, A.R.; Arce, M.I.; Arnon, S.; Bernal, S.; Bolpagni, R.; Datry, T.; Gionchetta, G.; Grossart, H.-P.; Mendoza-Lera, C.; et al. Towards an improved understanding of biogeochemical processes across surface-groundwater interactions in intermittent rivers and ephemeral streams. Earth-Sci. Rev. 2021, 220, 103724. [Google Scholar] [CrossRef]
- Sauquet, E.; Shanafield, M.; Hammond, J.C.; Sefton, C.; Leigh, C.; Datry, T. Classification and trends in intermittent river flow regimes in Australia, northwestern Europe and USA: A global perspective. J. Hydrol. 2021, 597, 126170. [Google Scholar] [CrossRef]
- Messager, M.L.; Lehner, B.; Cockburn, C.; Lamouroux, N.; Pella, H.; Snelder, T.; Tockner, K.; Trautmann, T.; Watt, C.; Datry, T. Global prevalence of non-perennial rivers and streams. Nature 2021, 594, 391–397. [Google Scholar] [CrossRef] [PubMed]
- Poff, N.L.; Ward, J. Implications of Streamflow Variability and Predictability for Lotic Community Structure: A Regional Analysis of Streamflow Patterns. Can. J. Fish. Aquat. Sci. 1989, 46, 1805–1818. [Google Scholar] [CrossRef]
- Uys, M.C.; O’keeffe, J.H. Simple words and fuzzy zones: Early directions for temporary river research in South Africa. Environ. Manag. 1997, 21, 517–531. [Google Scholar] [CrossRef]
- Reynolds, L.V.; Shafroth, P.B.; LeRoy Poff, N. Modeled intermittency risk for small streams in the Upper Colorado River Basin under climate change. J. Hydrol. 2015, 523, 768–780. [Google Scholar] [CrossRef]
- D’Ambrosio, E.; De Girolamo, A.M.; Barca, E.; Ielpo, P.; Rulli, M.C. Characterising the hydrological regime of an ungauged temporary river system: A case study. Environ. Sci. Pollut. Res. 2017, 24, 13950–13966. [Google Scholar] [CrossRef]
- Yu, S.; Bond, N.R.; Bunn, S.E.; Xu, Z.; Kennard, M.J. Quantifying spatial and temporal patterns of flow intermittency using spatially contiguous runoff data. J. Hydrol. 2018, 559, 861–872. [Google Scholar] [CrossRef]
- Belemtougri, A.P.; Ducharne, A.; Tazen, F.; Oudin, L.; Karambiri, H. Understanding key factors controlling the duration of river flow intermittency: Case of Burkina Faso in West Africa. J. Hydrol.-Reg. Stud. 2021, 37, 100908. [Google Scholar] [CrossRef]
- Yildirim, I.; Aksoy, H. Intermittency as an indicator of drought in streamflow and groundwater. Hydrol. Process. 2022, 36, e14615. [Google Scholar] [CrossRef]
- Jehn, F.U.; Bestian, K.; Breuer, L.; Kraft, P.; Houska, T. Using hydrological and climatic catchment clusters to explore drivers of catchment behavior. Hydrol. Earth Syst. Sci. 2020, 24, 1081–1100. [Google Scholar] [CrossRef]
- Oueslati, O.; De Girolamo, A.M.; Abouabdillah, A.; Kjeldsen, T.R.; Lo Porto, A. Classifying the flow regimes of Mediterranean streams using multivariate analysis. Hydrol. Process. 2015, 29, 4666–4682. [Google Scholar] [CrossRef]
- Tramblay, Y.; Rutkowska, A.; Sauquet, E.; Sefton, C.; Laaha, G.; Osuch, M.; Albuquerque, T.; Alves, M.H.; Banasik, K.; Beaufort, A.; et al. Trends in flow intermittence for European rivers. Hydrol. Sci. J. 2020, 66, 37–49. [Google Scholar] [CrossRef]
- Šarauskienė, D.; Akstinas, V.; Nazarenko, S.; Kriaučiūnienė, J.; Jurgelėnaitė, A. Impact of physico-geographical factors and climate variability on flow intermittency in the rivers of water surplus zone. Hydrol. Process. 2020, 34, 4727–4739. [Google Scholar] [CrossRef]
- Mimeau, L.; Künne, A.; Devers, A.; Branger, F.; Kralisch, S.; Lauvernet, C.; Vidal, J.-P.; Bonada, N.; Csabai, Z.; Mykrä, H.; et al. Projections of streamflow intermittence under climate change in European drying river networks. Hydrol. Earth Syst. Sci. 2025, 29, 1615–1636. [Google Scholar] [CrossRef]
- Zipper, S.C.; Hammond, J.C.; Shanafield, M.; Zimmer, M.; Datry, T.; Jones, C.N.; E Kaiser, K.; E Godsey, S.; Burrows, R.M.; Blaszczak, J.R.; et al. Pervasive changes in stream intermittency across the United States. Environ. Res. Lett. 2021, 16, 084033. [Google Scholar] [CrossRef]
- Datry, T.; Larned, S.T.; Tockner, K. Intermittent Rivers: A Challenge for Freshwater Ecology. Bioscience 2014, 64, 229–235. [Google Scholar] [CrossRef]
- Sabater, S.; Barcelo, D.; De Castro-Catala, N.; Ginebreda, A.; Kuzmanovic, M.; Petrovic, M.; Pico, Y.; Ponsati, L.; Tornes, E.; Munoz, I. Shared effects of organic microcontaminants and environmental stressors on biofilms and invertebrates in impaired rivers. Environ. Pollut. 2016, 210, 303–314. [Google Scholar] [CrossRef]
- Rodrigues, S.; Xavier, B.; Nogueira, S.; Antunes, S.C. Intermittent Rivers as a Challenge for Freshwater Ecosystems Quality Evaluation: A Study Case in the Ribeira de Silveirinhos, Portugal. Water 2022, 15, 17. [Google Scholar] [CrossRef]
- Döll, P.; Schmied, H.M. How is the impact of climate change on river flow regimes related to the impact on mean annual runoff? A global-scale analysis. Environ. Res. Lett. 2012, 7, 014037. [Google Scholar] [CrossRef]
- Water Resources Agency. Hydrological Year Book 2022; Water Resource Agency, Ministry of Economic Affairs: Taichung, Taiwan, 2022. [Google Scholar]
- Yeh, H.-F.; Chen, H.-Y. Assessing the long-term hydrologic responses of river catchments in Taiwan using a multiple-component hydrograph approach. J. Hydrol. 2022, 610, 127916. [Google Scholar] [CrossRef]
- Chen, H.-Y.; Fang, X.; Yeh, H.-F. Trends in Flow Intermittency, Variability, and Seasonality for Taiwan Rivers. Water 2025, 17, 271. [Google Scholar] [CrossRef]
- Peel, M.C.; Finlayson, B.L.; McMahon, T.A. Updated world map of the Köppen-Geiger climate classification. Hydrol. Earth Syst. Sci. 2007, 11, 1633–1644. [Google Scholar] [CrossRef]
- Beck, H.E.; McVicar, T.R.; Vergopolan, N.; Berg, A.; Lutsko, N.J.; Dufour, A.; Zeng, Z.; Jiang, X.; van Dijk, A.; Miralles, D.G. High-resolution (1 km) Koppen-Geiger maps for 1901–2099 based on constrained CMIP6 projections. Sci. Data 2023, 10, 724. [Google Scholar] [CrossRef]
- Ministry of Digital Affairs. Government Information Open Platform. Available online: https://data.gov.tw/ (accessed on 23 August 2023).
- Abatzoglou, J.T.; Dobrowski, S.Z.; Parks, S.A.; Hegewisch, K.C. TerraClimate, a high-resolution global dataset of monthly climate and climatic water balance from 1958–2015. Sci. Data 2018, 5, 170191. [Google Scholar] [CrossRef]
- TCCIP. Gridded Historical Daily Date, Taiwan Climate Change Projection Information and Adaptation Knowledge Platform. Available online: https://tccip.ncdr.nat.gov.tw/index_eng.aspx (accessed on 19 August 2024).
- Gleeson, T.; Smith, L.; Moosdorf, N.; Hartmann, J.; Dürr, H.H.; Manning, A.H.; van Beek, L.P.H.; Jellinek, A.M. Mapping permeability over the surface of the Earth. Geophys. Res. Lett. 2011, 38, L02401. [Google Scholar] [CrossRef]
- Tayer, T.C.; Beesley, L.S.; Douglas, M.M.; Bourke, S.A.; Callow, J.N.; Meredith, K.; McFarlane, D. Ecohydrological metrics derived from multispectral images to characterize surface water in an intermittent river. J. Hydrol. 2023, 617, 129087. [Google Scholar] [CrossRef]
- Yu, S.; Shanafield, M.; Kennard, M.J. Assessing the Influence of Zero-Flow Threshold Choice for Characterising Intermittent Stream Hydrology. Hydrol. Process. 2024, 38, e15300. [Google Scholar] [CrossRef]
- Gallart, F.; Prat, N.; García-Roger, E.M.; Latron, J.; Rieradevall, M.; Llorens, P.; Barberá, G.G.; Brito, D.; De Girolamo, A.M.; Lo Porto, A.; et al. A novel approach to analysing the regimes of temporary streams in relation to their controls on the composition and structure of aquatic biota. Hydrol. Earth Syst. Sci. 2012, 16, 3165–3182. [Google Scholar] [CrossRef]
- Kendall, M.G. Rank Correlation Methods; Nafner: New York, NY, USA, 1975. [Google Scholar]
- Mann, H.B. Nonparametric tests against trend. Econometrica 1945, 13, 245–259. [Google Scholar] [CrossRef]
- Pearson, K., LIII. On lines and planes of closest fit to systems of points in space. Lond. Edinb. Dublin Philos. Mag. J. Sci. 1901, 2, 559–572. [Google Scholar] [CrossRef]
- Jolliffe, I.T.; Cadima, J. Principal component analysis: A review and recent developments. Philos. Trans. R. Soc. A-Math. Phys. Eng. Sci. 2016, 374, 20150202. [Google Scholar] [CrossRef]
- Kinnard, C.; Bzeouich, G.; Assani, A. Impacts of summer and winter conditions on summer river low flows in low elevation, snow-affected catchments. J. Hydrol. 2022, 605, 127393. [Google Scholar] [CrossRef]
- Kaiser, H.F. The Application of Electronic Computers to Factor Analysis. Educ. Psychol. Meas. 1960, 20, 141–151. [Google Scholar] [CrossRef]
- Liang, C.P.; Lin, T.C.; Suk, H.; Wang, C.H.; Liu, C.W.; Chang, T.W.; Chen, J.S. Comprehensive assessment of the impact of land use and hydrogeological properties on the groundwater quality in Taiwan using factor and cluster analyses. Sci. Total Environ. 2022, 851, 158135. [Google Scholar] [CrossRef]
- Spearman, C. The Proof and Measurement of Association between Two Things. Am. J. Psychol. 1904, 15, 72–101. [Google Scholar] [CrossRef]
- Chou, C.-B.; Weng, M.-C.; Huang, H.-P.; Chang, Y.-C.; Chang, H.-C.; Yeh, T.-Y. Monitoring the Spring 2021 Drought Event in Taiwan Using Multiple Satellite-Based Vegetation and Water Indices. Atmosphere 2022, 13, 1374. [Google Scholar] [CrossRef]
- Chen, S.-T.; Kuo, C.-C.; Yu, P.-S. Historical trends and variability of meteorological droughts in Taiwan / Tendances historiques et variabilité des sécheresses météorologiques à Taiwan. Hydrol. Sci. J. 2009, 54, 430–441. [Google Scholar] [CrossRef]
- Shiau, J.-T.; Lin, J.-W. Clustering Quantile Regression-Based Drought Trends in Taiwan. Water Resour. Manag. 2016, 30, 1053–1069. [Google Scholar] [CrossRef]
- Yeh, H.-F.; Lin, X.-Y.; Huang, C.-C.; Chen, H.-Y. A Meteorological Drought Migration Model for Assessing the Spatiotemporal Paths of Drought in the Choushui River Alluvial Fan, Taiwan. Geosciences 2024, 14, 106. [Google Scholar] [CrossRef]


| Category | Catchment Attribute | Description | Units | Data Source |
|---|---|---|---|---|
| Topography | A | Catchment area | (km2) | DTM [27] |
| Slope | Catchment average slope | (°) | DTM [27] | |
| E | Catchment average elevation | (m) | DTM [27] | |
| Soil | SM | Catchment average annual soil moisture | (mm) | TerraClimate (1960–2022) at the resolution of 4 km × 4 km [28] |
| Climate | P | Catchment average annual precipitation | (mm) | TCCIP (1960–2022) at the resolution of 5 km × 5 km [29] |
| AET | Catchment average annual actual evapotranspiration | (mm) | TerraClimate (1960–2022) at the resolution of 4 km × 4 km [28] | |
| PET | Catchment average annual potential evapotranspiration | (mm) | TerraClimate (1960–2022) at the resolution of 4 km × 4 km [28] | |
| AI | Catchment average of aridity index (P/PET) | (-) | - | |
| T | Catchment average annual temperature | (°C) | TCCIP (1960–2022) at the resolution of 5 km × 5 km [29] | |
| Lithology | k | Catchment average permeability | (m2) | Gleeson et al. [30] |
| Trend Direction | Significance Level | IR | SD6 | ||
|---|---|---|---|---|---|
| Number of Stations | Percent of Total | Number of Stations | Percent of Total | ||
| Increasing | p-value ≤ 0.05 * | 12 | 18.46% | 3 | 4.62% |
| No trend | p-value > 0.05 | 28 | 43.08% | 46 | 70.77% |
| Decreasing | p-value ≤ 0.05 * | 25 | 38.46% | 16 | 24.62% |
| Loading | PC1 | PC2 |
|---|---|---|
| A | 0.013 | 0.983 |
| k | 0.491 | −0.021 |
| AET | −0.335 | −0.096 |
| PET | 0.535 | −0.140 |
| SM | −0.600 | −0.068 |
| Eigenvalues | 2.414 | 1.010 |
| Variability (%) | 48.29% | 20.21% |
| Total variance explained (%) | 48.29% | 68.49% |
| PCs | Spearman ρ | p-Value |
|---|---|---|
| PC1 | 0.57 | <0.05 |
| PC2 | 0.03 | 0.813 |
| Climatic Indicator | Significance Stations (%) | Ρ AVG [Max, Min] | Nonsignificant Stations (%) | Ρ AVG [Max, Min] | |
|---|---|---|---|---|---|
| Temperature | Tave | 20.00% | −0.14 [0.49, −0.50] | 80.00% | −0.02 [0.23, −0.28] |
| Tmax | 18.46% | 0.01 [0.53, −0.46] | 81.54% | 0.03 [0.25, −0.27] | |
| T95 | 16.92% | 0.12 [0.42, −0.35] | 83.08% | 0.02 [0.24, −0.25] | |
| AET | 29.23% | −0.32 [0.66, −0.54] | 70.77% | −0.05 [0.24, −0.28] | |
| PET | 30.77% | 0.10 [0.68, −0.53] | 69.23% | 0.04 [0.27, −0.23] | |
| Precipitation | L1mm | 50.77% | 0.40 [0.64, 0.26] | 49.23% | 0.15 [0.32, −0.11] |
| L10mm | 30.77% | 0.35 [0.51, 0.26] | 69.23% | 0.14 [0.31, −0.06] | |
| RR1 | 49.23% | −0.40 [−0.26, −0.64] | 50.77% | −0.15 [0.11, −0.32] | |
| SDII | 10.77% | −0.34 [−0.29, −0.39] | 89.23% | −0.05 [0.19, −0.27] | |
| AI | 21.54% | −0.39 [−0.28, −0.65] | 78.46% | −0.16 [0.01, −0.28] | |
Disclaimer/Publisher’s Note: The statements, opinions and data contained in all publications are solely those of the individual author(s) and contributor(s) and not of MDPI and/or the editor(s). MDPI and/or the editor(s) disclaim responsibility for any injury to people or property resulting from any ideas, methods, instructions or products referred to in the content. |
© 2025 by the authors. Licensee MDPI, Basel, Switzerland. This article is an open access article distributed under the terms and conditions of the Creative Commons Attribution (CC BY) license (https://creativecommons.org/licenses/by/4.0/).
Share and Cite
Fang, X.; Chen, H.-Y.; Yeh, H.-F. Analysis of the Intermittent Characteristics of Streamflow in Taiwan. Water 2025, 17, 2090. https://doi.org/10.3390/w17142090
Fang X, Chen H-Y, Yeh H-F. Analysis of the Intermittent Characteristics of Streamflow in Taiwan. Water. 2025; 17(14):2090. https://doi.org/10.3390/w17142090
Chicago/Turabian StyleFang, Xi, Hsin-Yu Chen, and Hsin-Fu Yeh. 2025. "Analysis of the Intermittent Characteristics of Streamflow in Taiwan" Water 17, no. 14: 2090. https://doi.org/10.3390/w17142090
APA StyleFang, X., Chen, H.-Y., & Yeh, H.-F. (2025). Analysis of the Intermittent Characteristics of Streamflow in Taiwan. Water, 17(14), 2090. https://doi.org/10.3390/w17142090