
Study on Lateral Erosion Failure Behavior of Reinforced Fine-Grained Tailings Dam Due to Overtopping Breach

 ,
,
Abstract
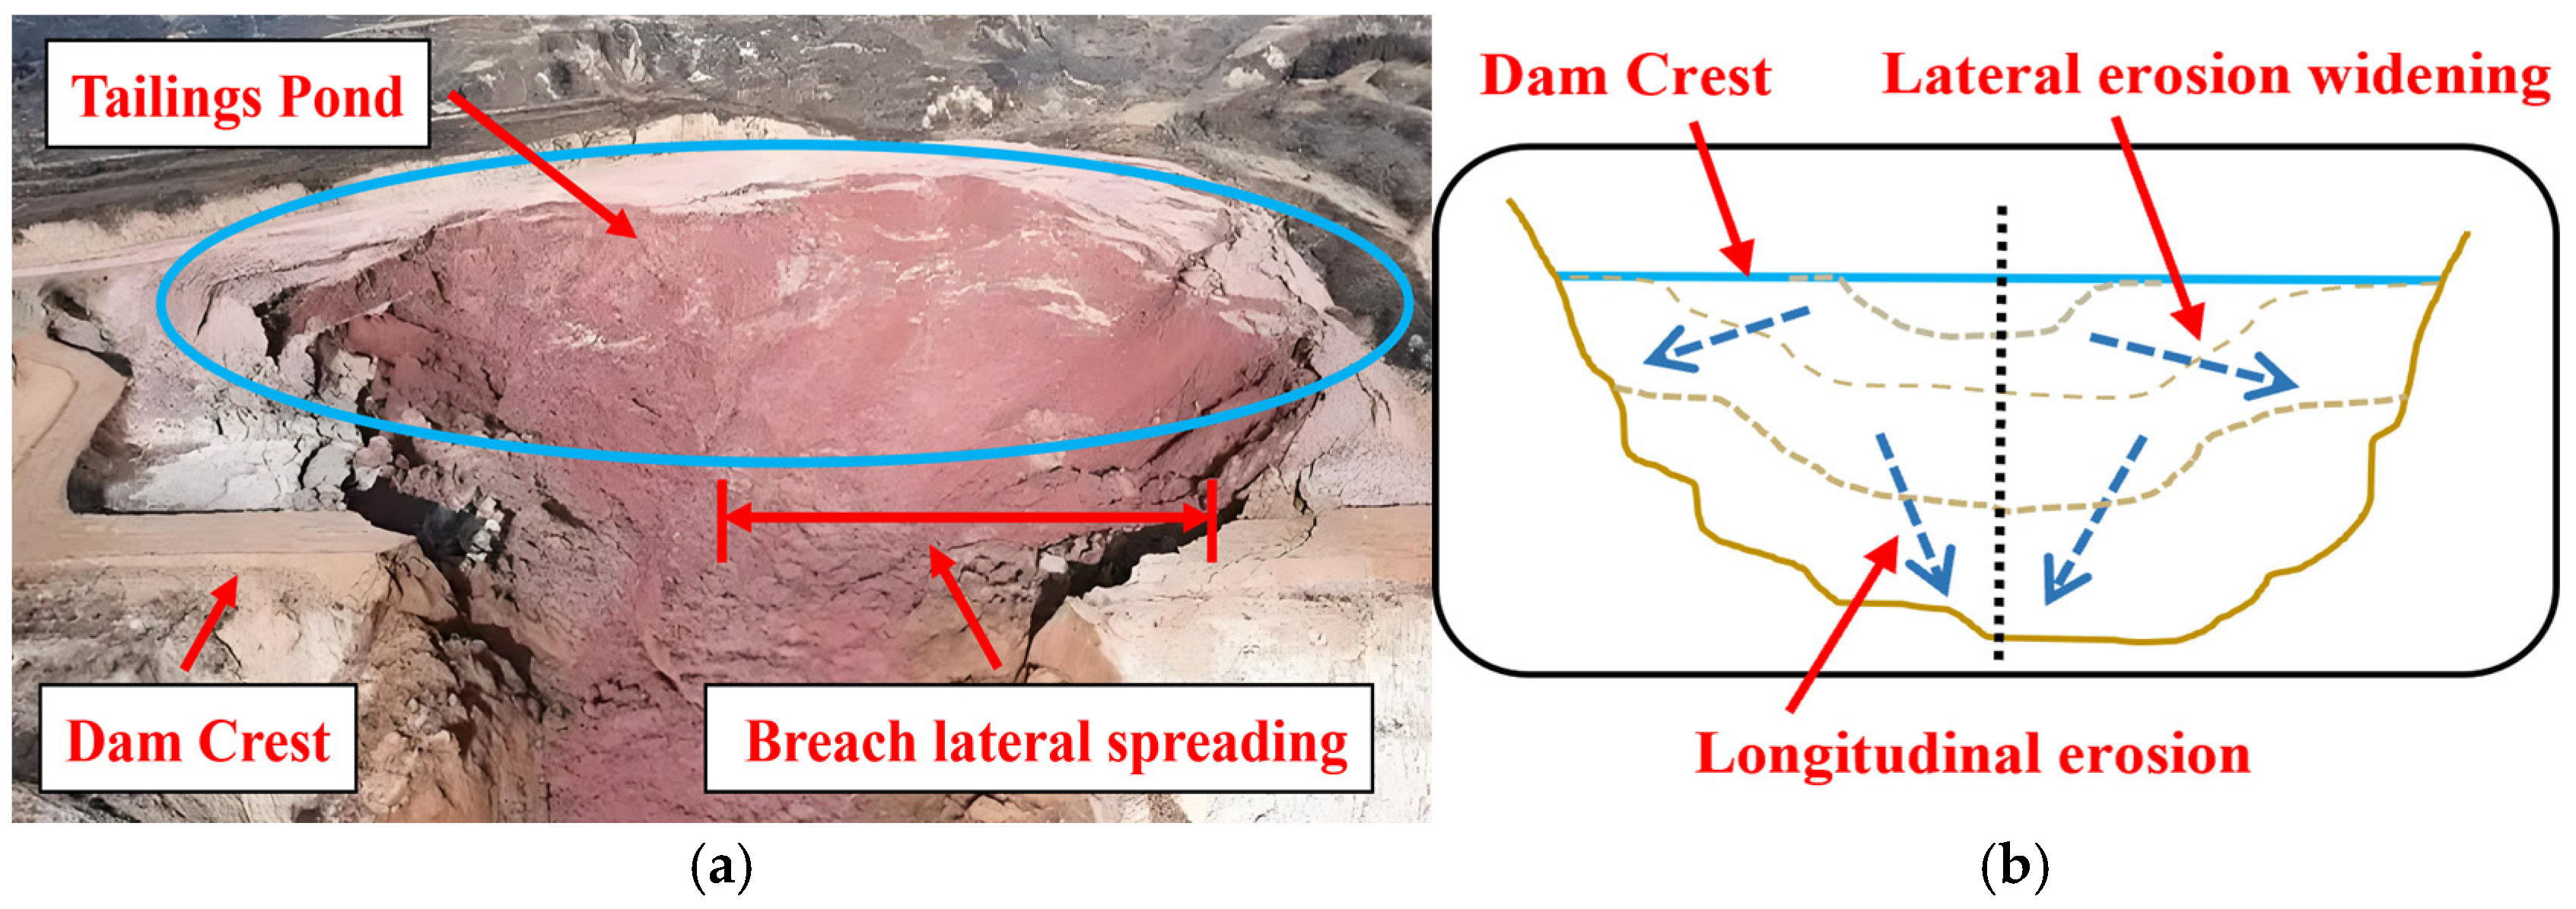
1. Introduction
2. Materials and Methods
2.1. Test Facilities
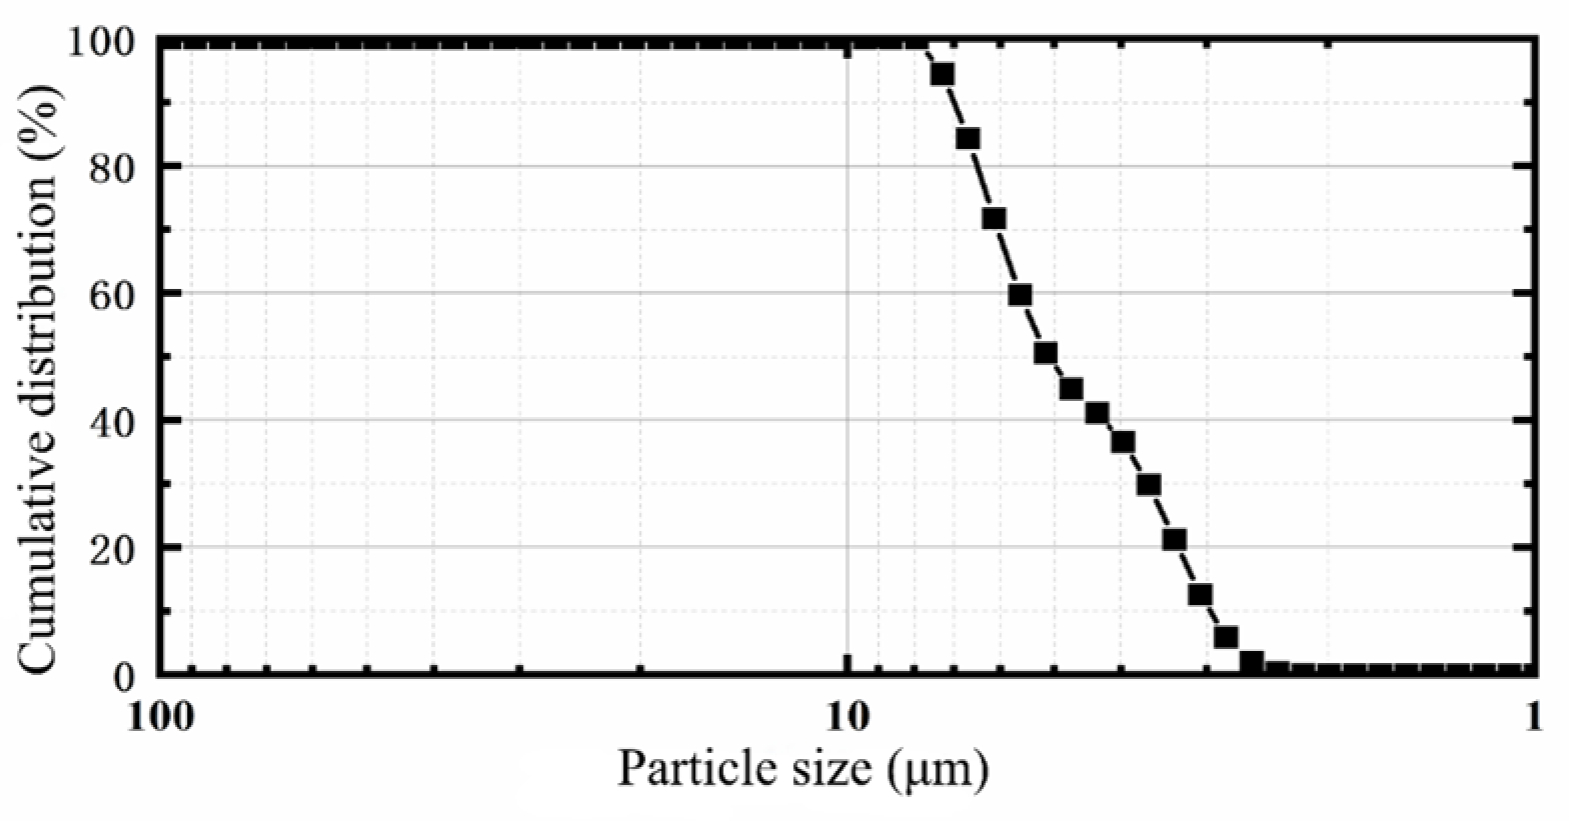
2.2. Test Materials
2.3. Test Scheme
2.4. Specimen Preparation
- The tailings sample with 20% moisture content was divided equally into two portions. One portion was transferred into the mold and compacted with a compaction hammer to achieve ≥ 98% compactness. The tailings were compacted to half the mold height, as shown in Figure 5.
- The surface of the underlying tailings was roughened with a spatula to ensure strong bonding with the second portion. After adding the second portion, the tailings were compacted to the full mold height using the compaction hammer. This completed fabrication of the unreinforced specimen.
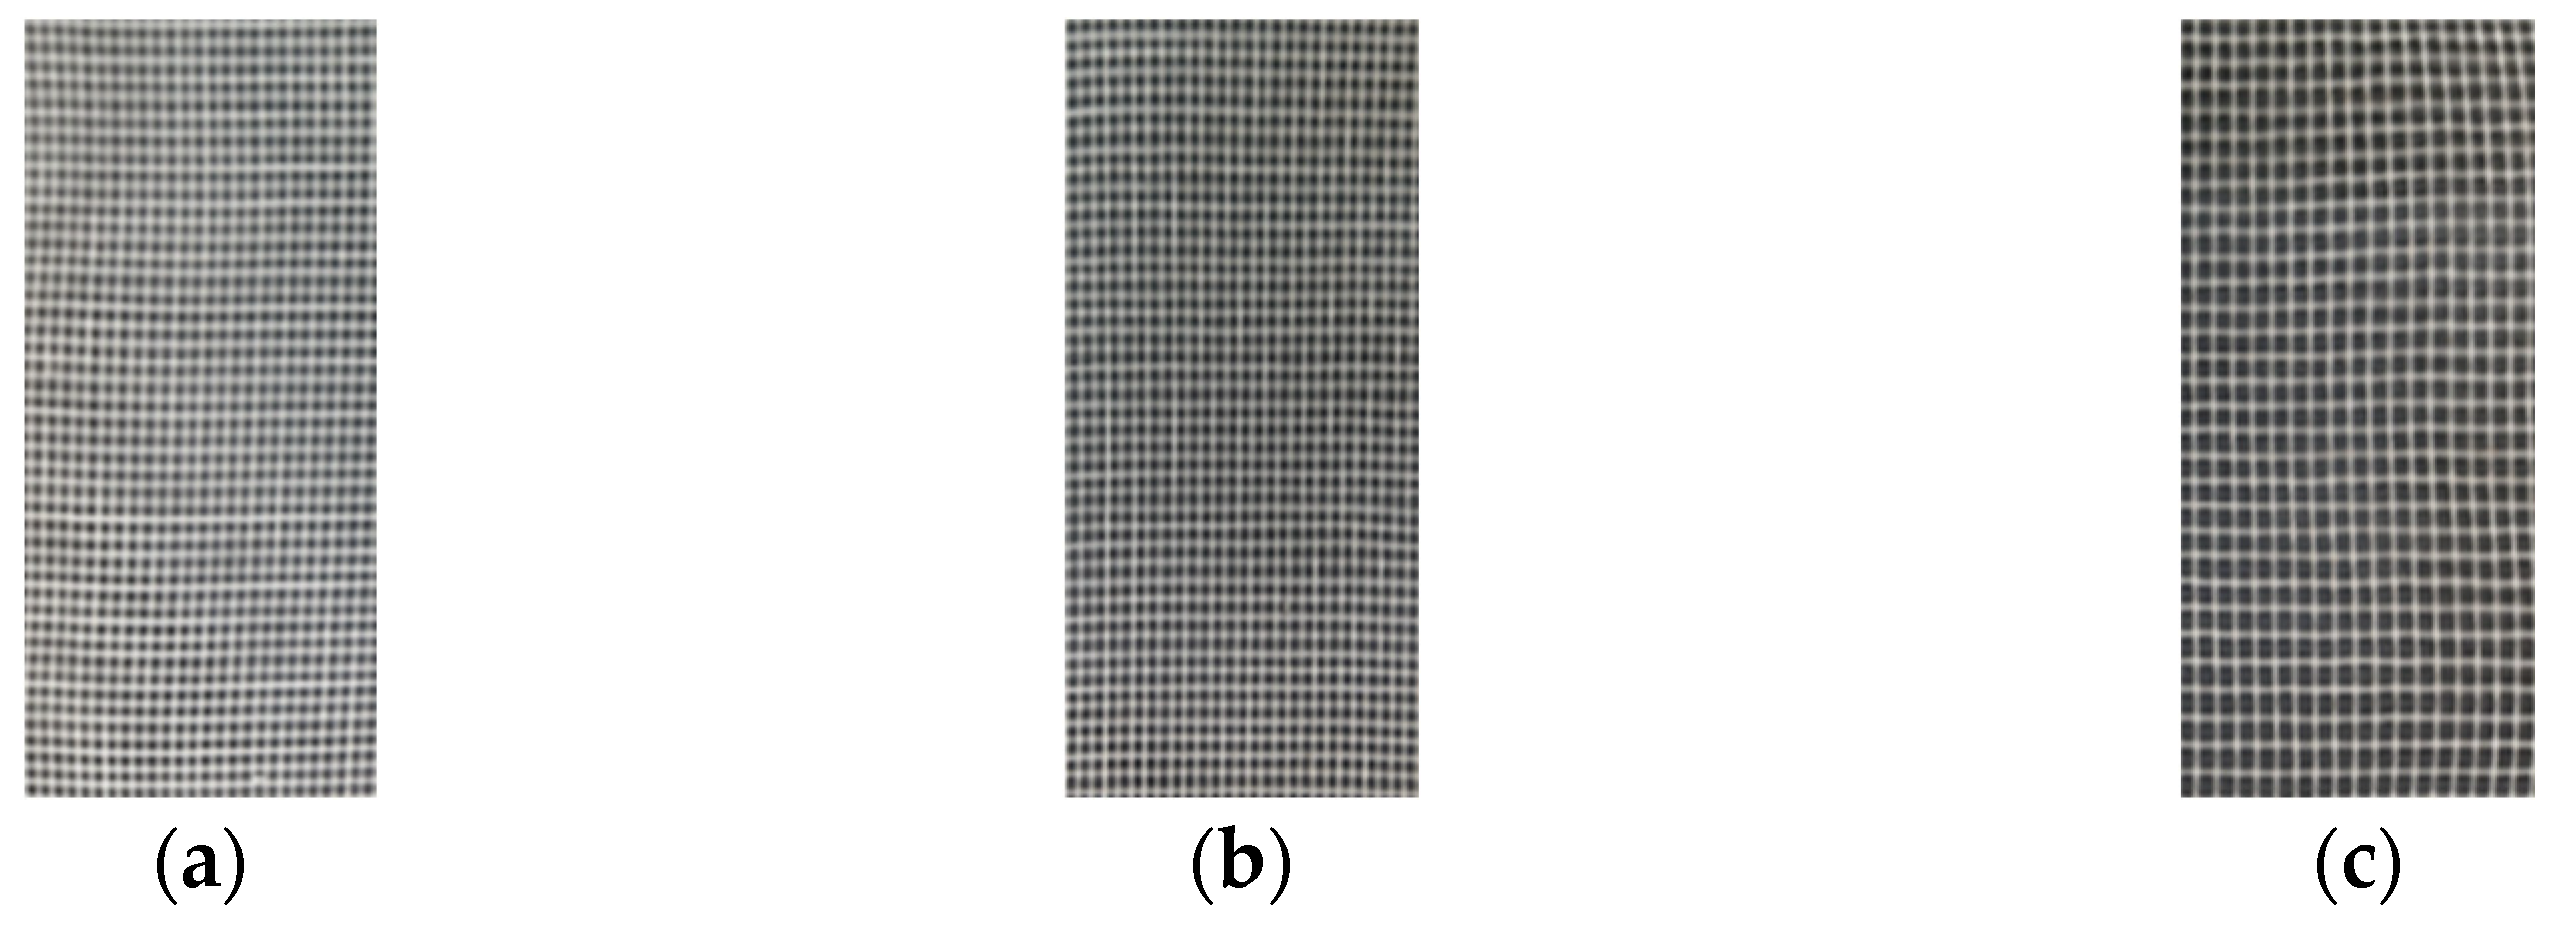
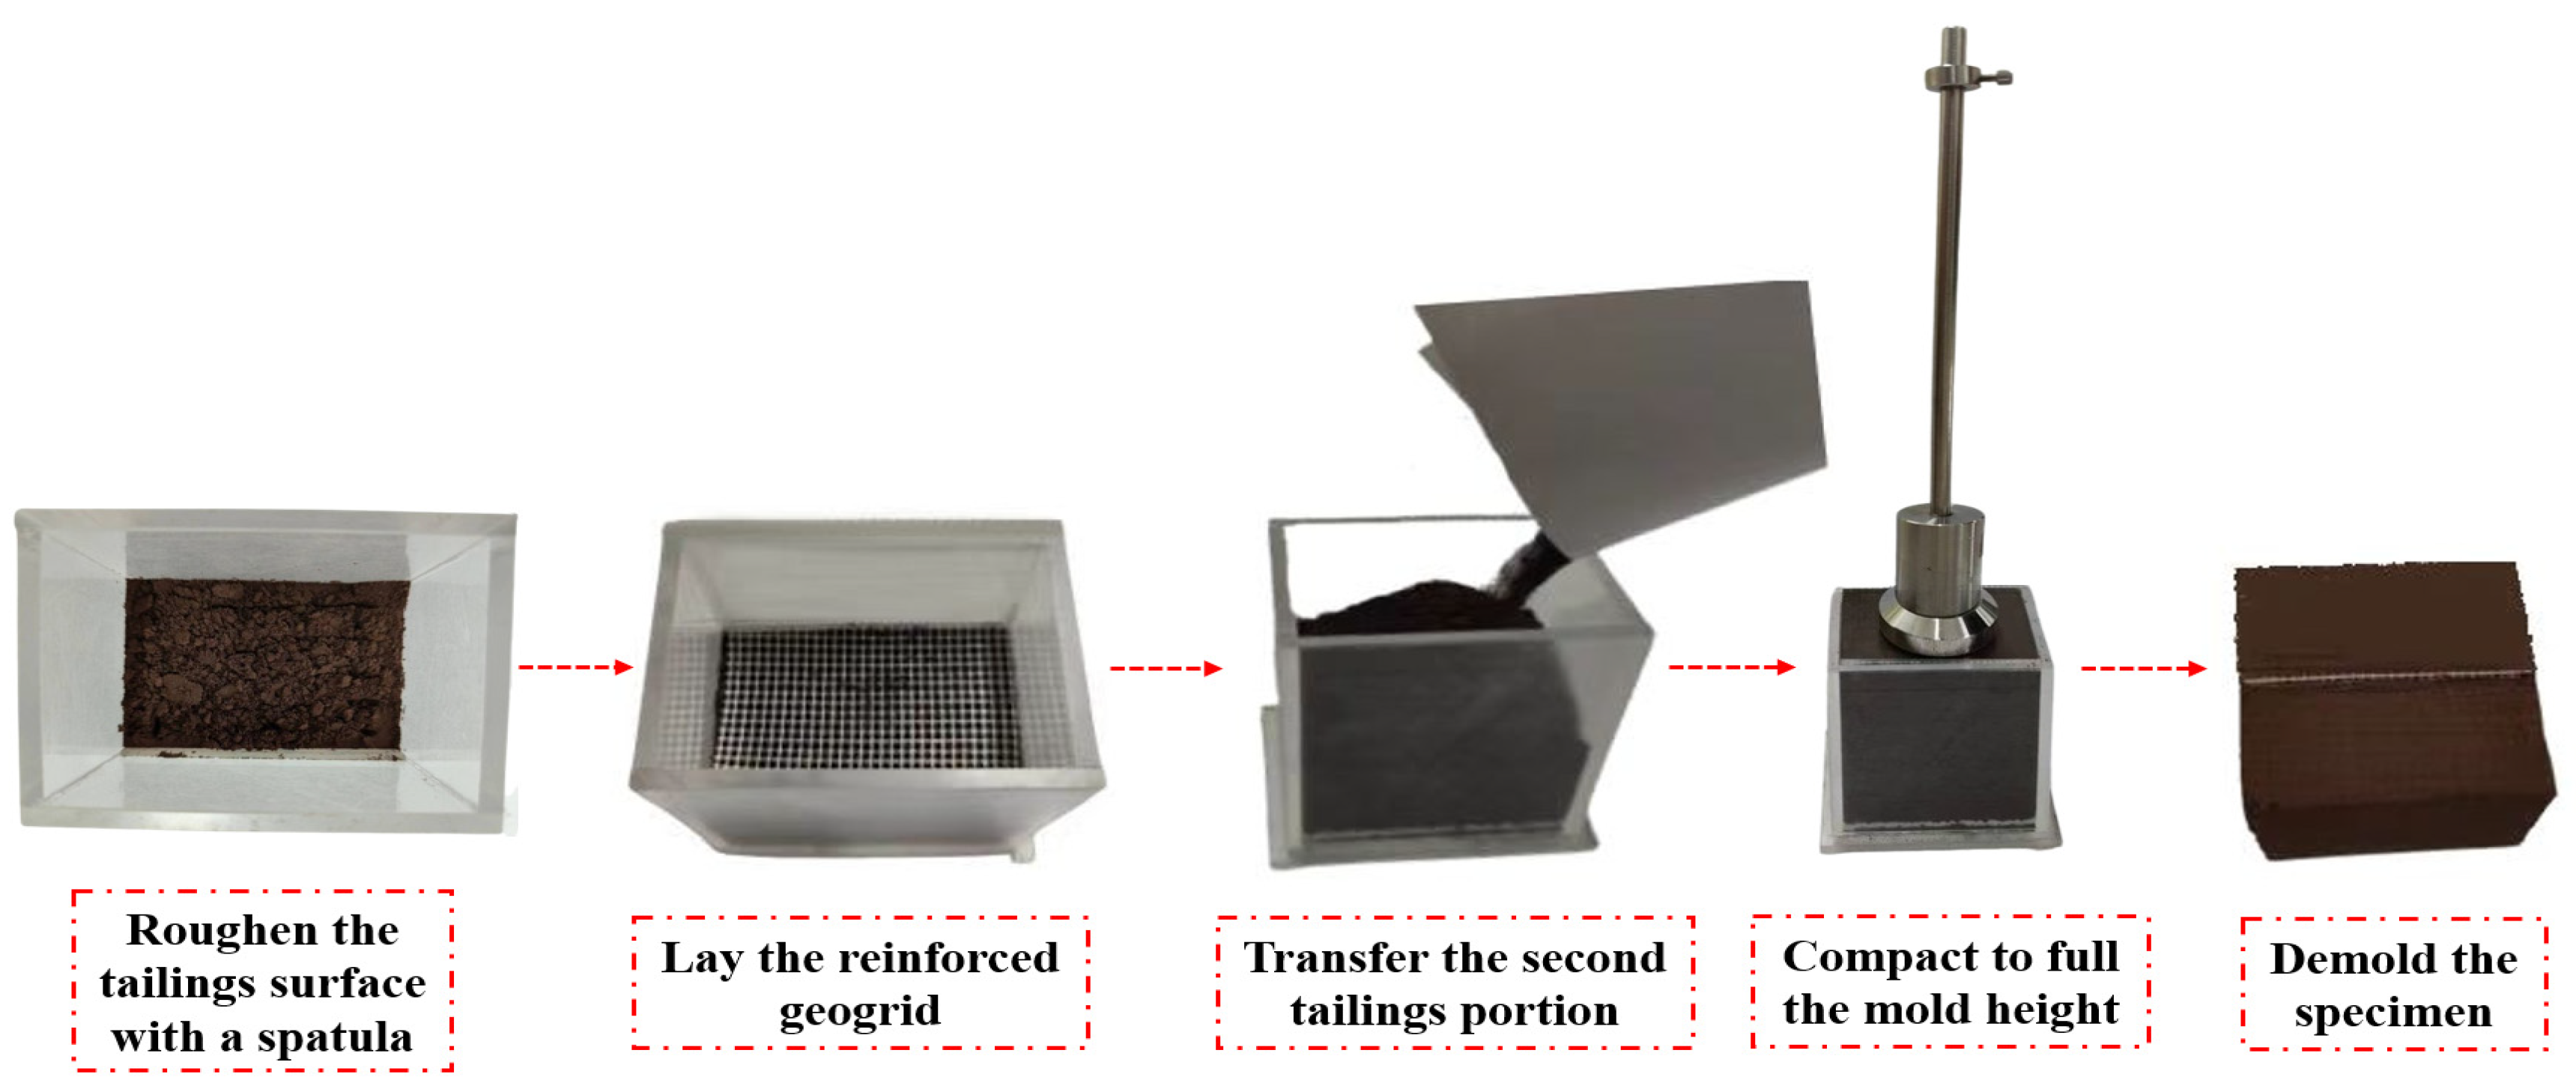
- The underlying tailings surface was roughened with a spatula. A layer of reinforced geogrid was placed on the tailings surface, positioned at the mid-height of the specimen. The second portion of tailings was then added and compacted to the full mold height with the compaction hammer, completing fabrication of the reinforced specimen, as shown in Figure 6.
- After demolding, specimens were wrapped in plastic film to maintain moisture content, labeled, and stored for subsequent testing.
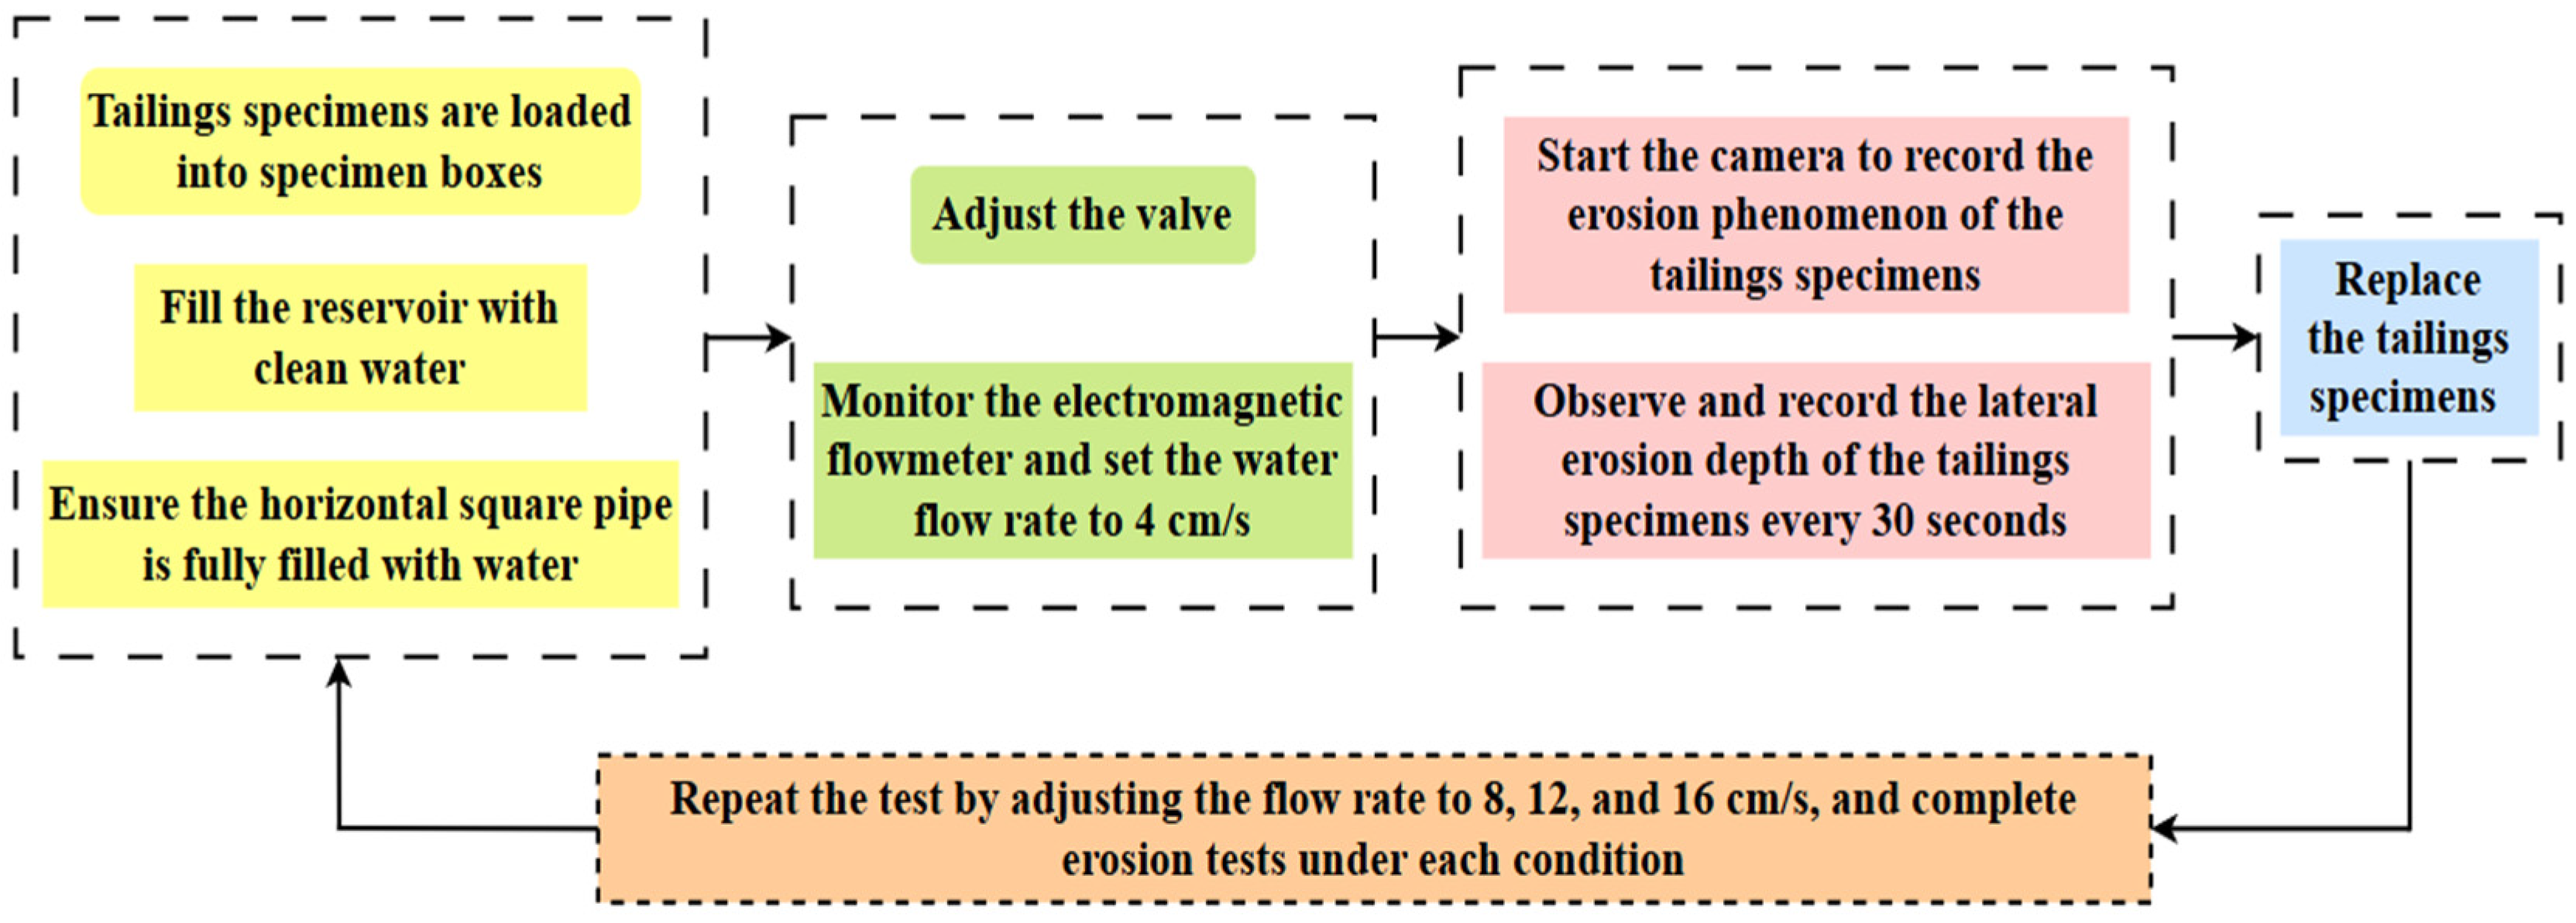
2.5. Test Procedures
3. Test Results and Analysis
3.1. Test Study on Lateral Erosion of Reinforced Fine-Grained Tailings
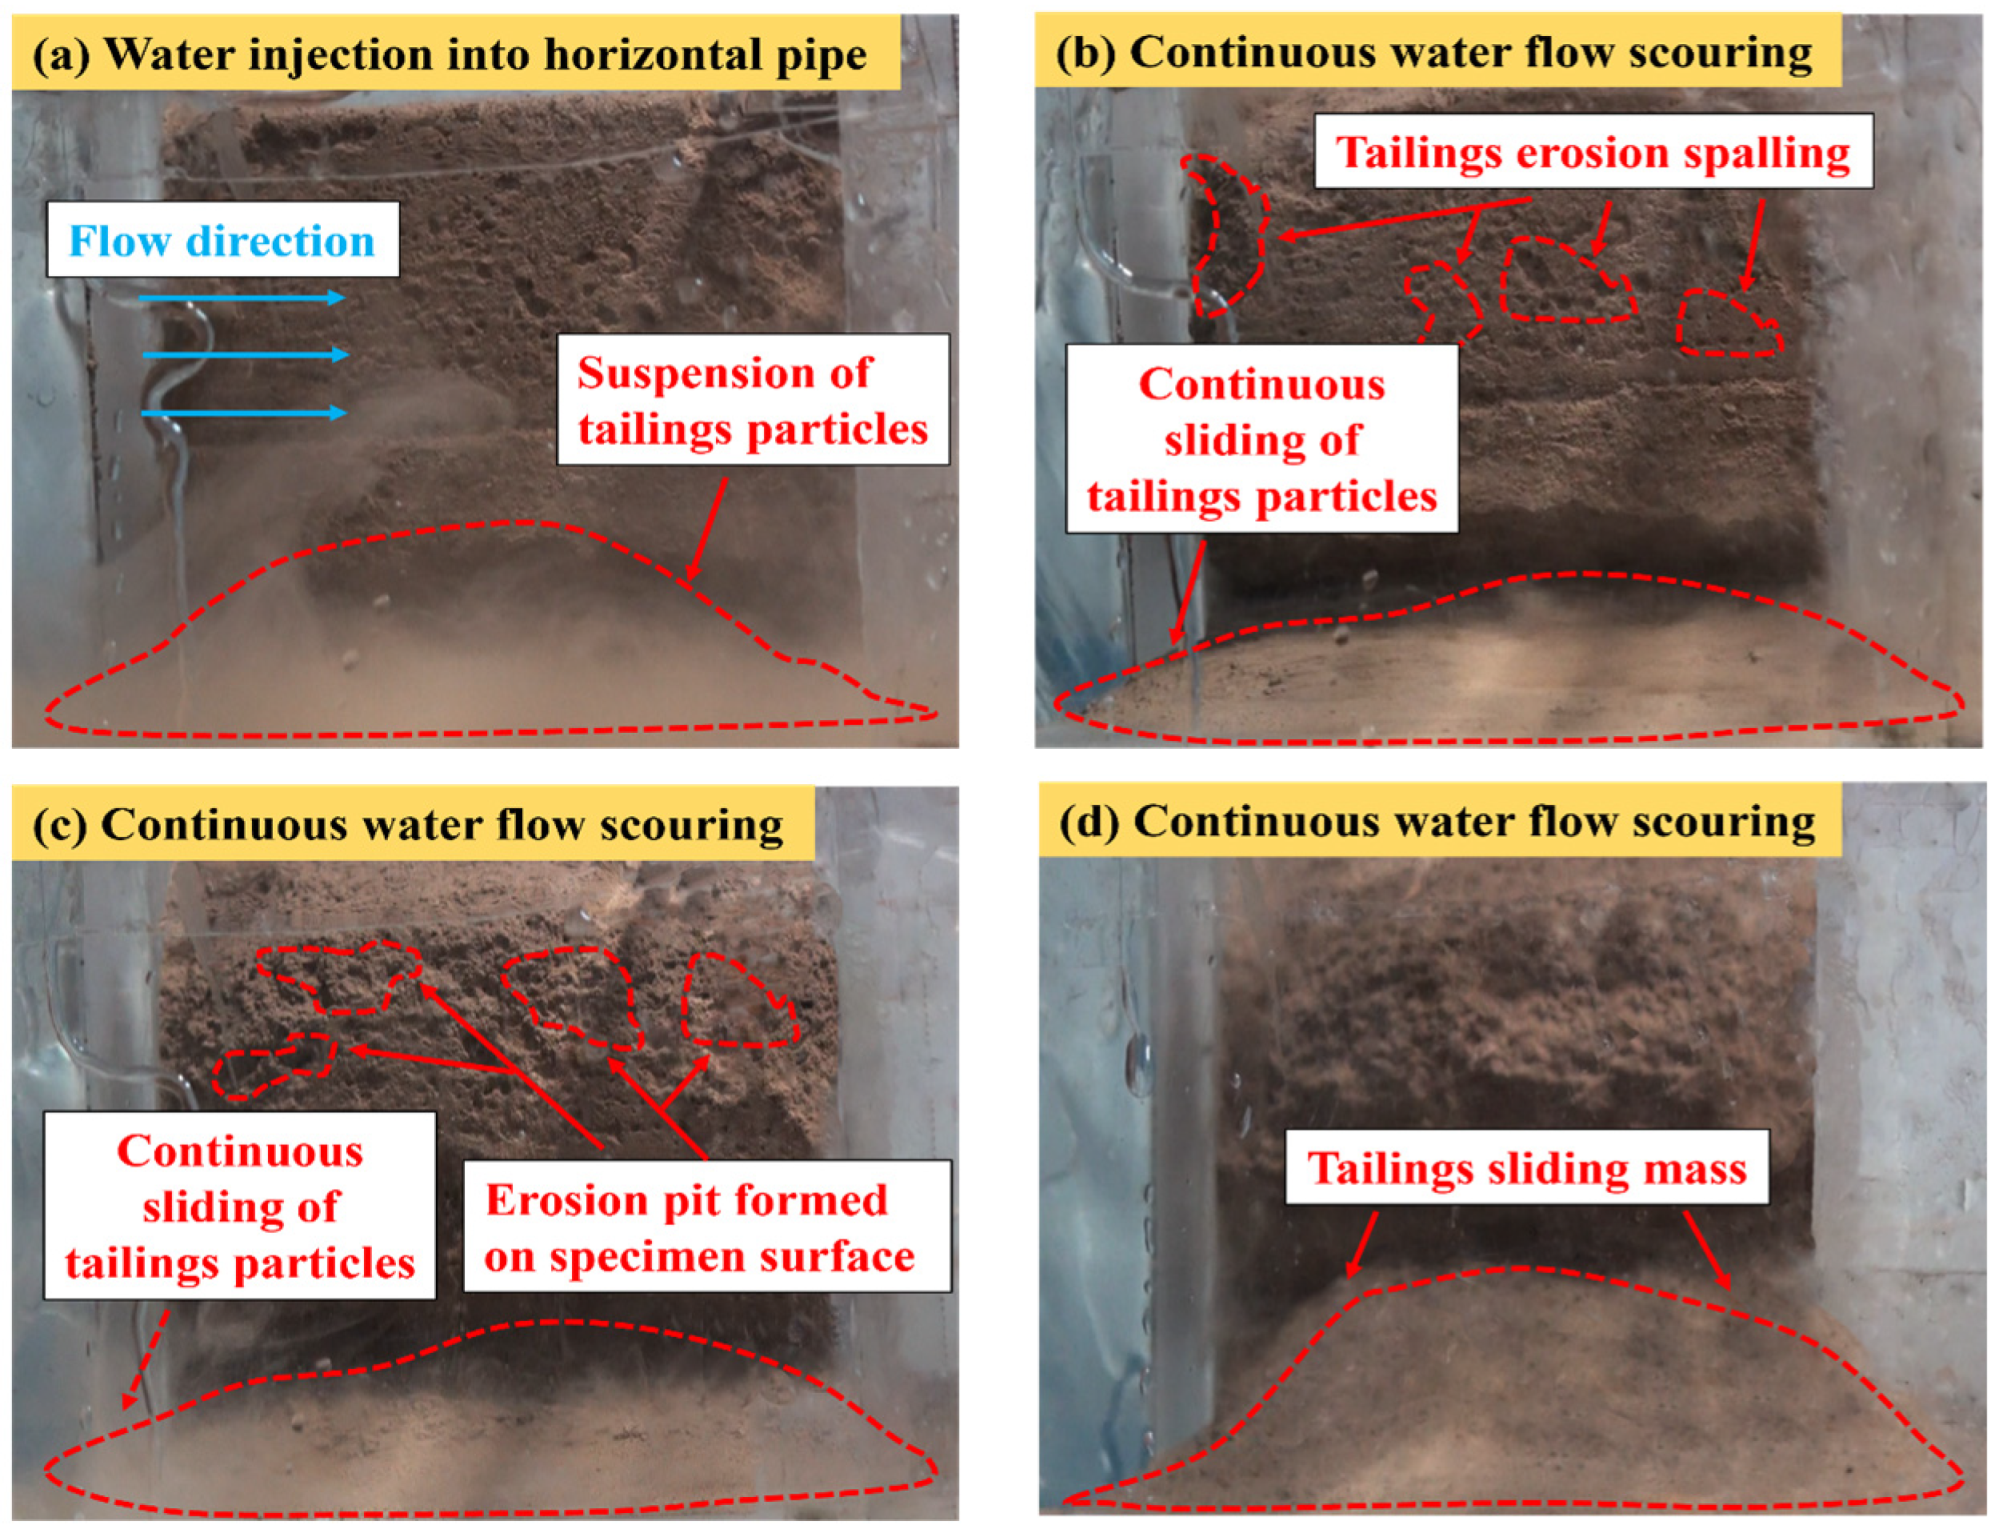
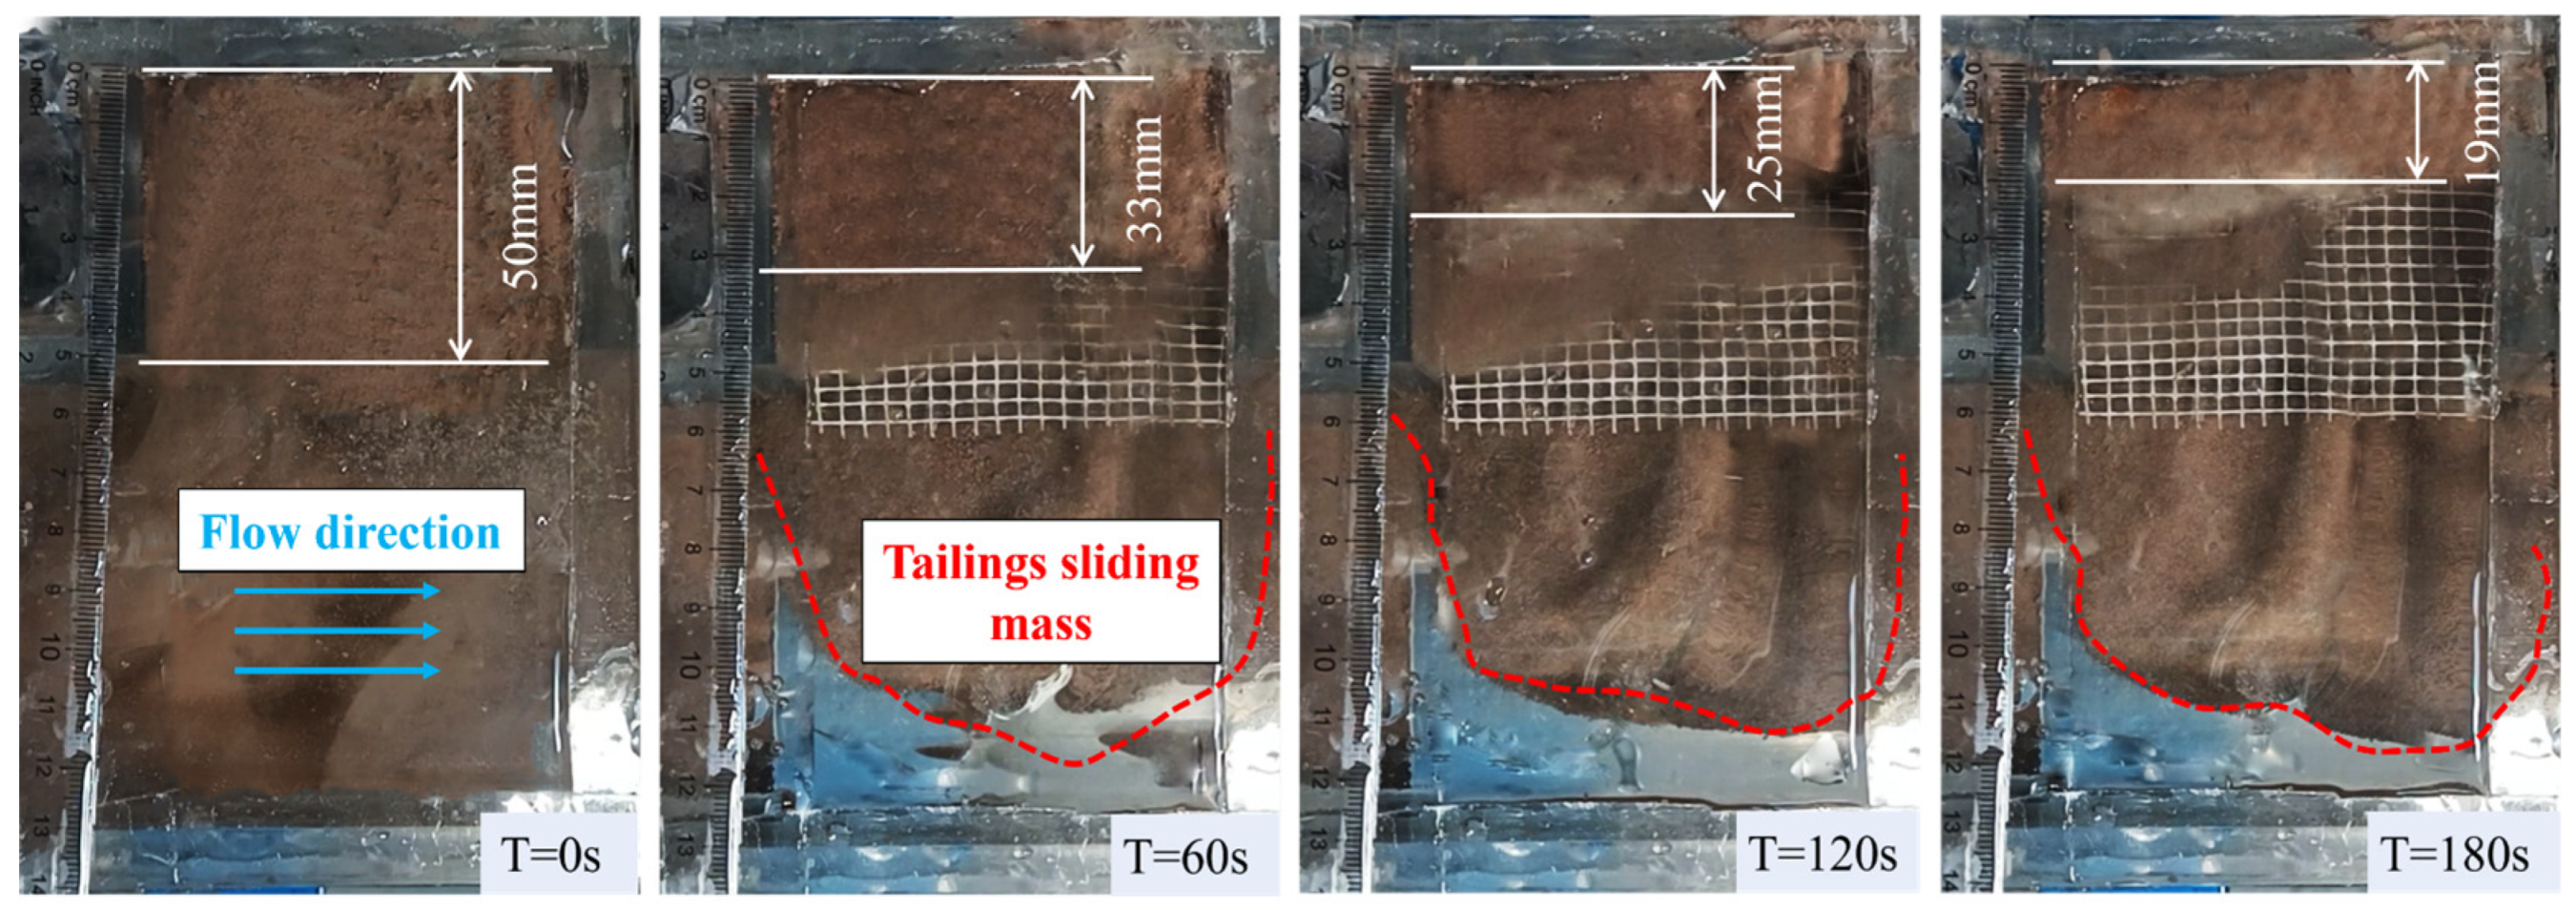
3.1.1. Test Analysis of Erosion Phenomena
- Unreinforced fine-grained tailings specimen
- 2.
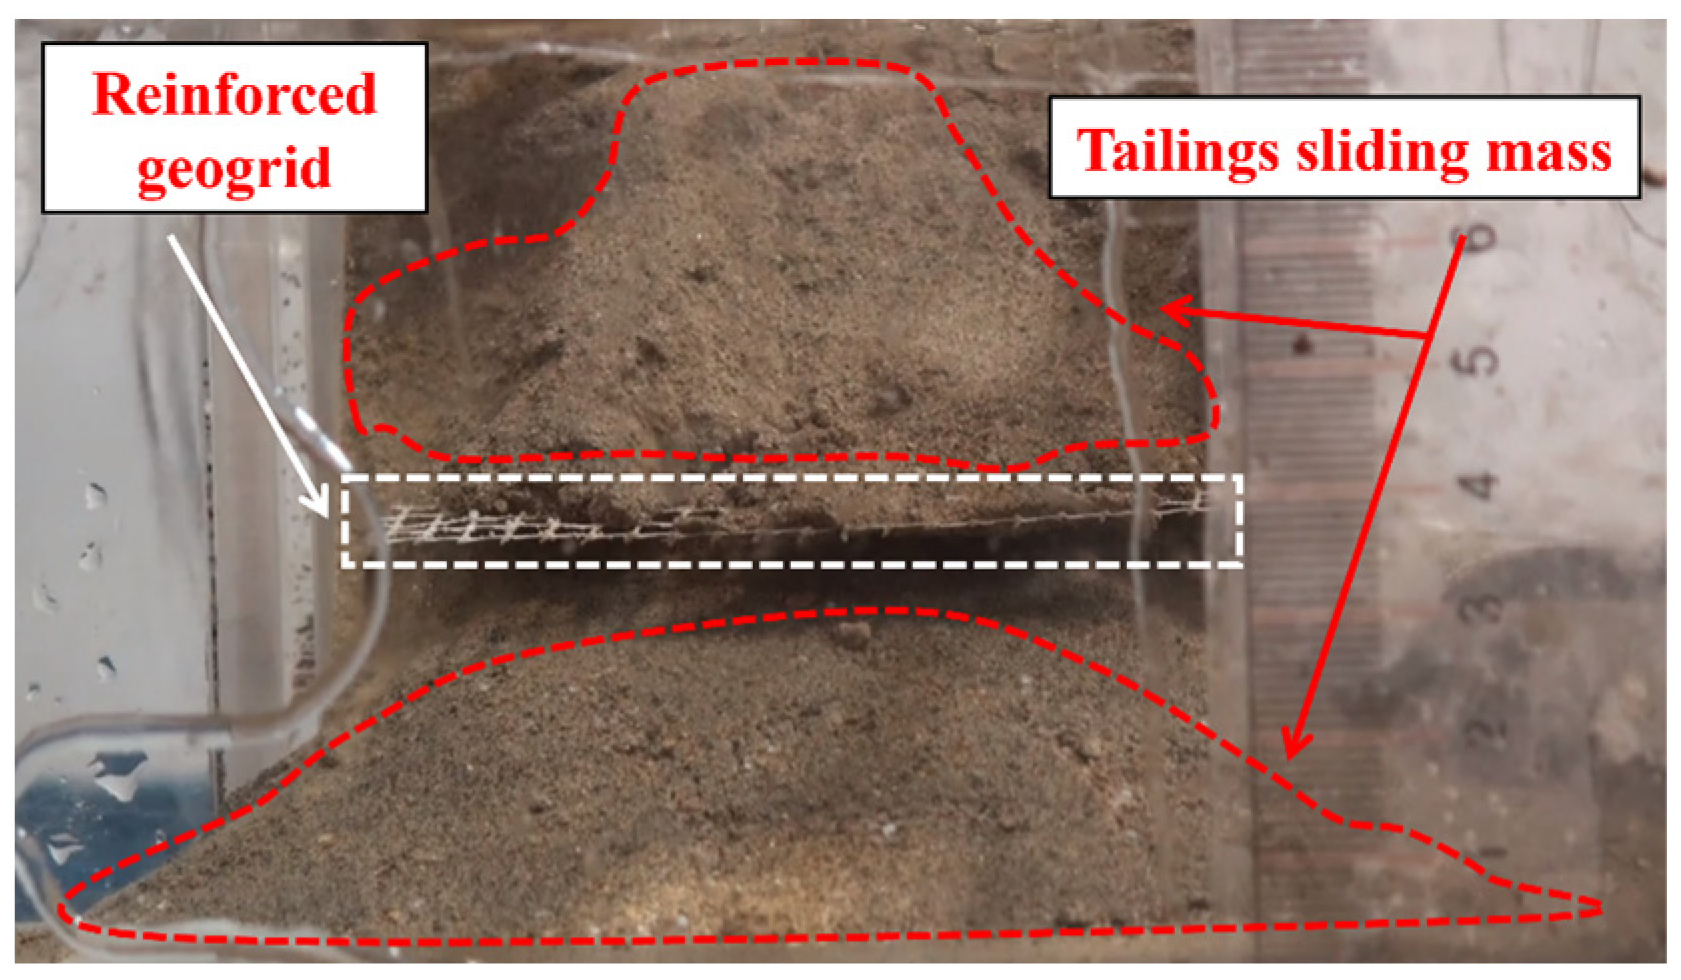
- Reinforced fine-grained tailings specimen
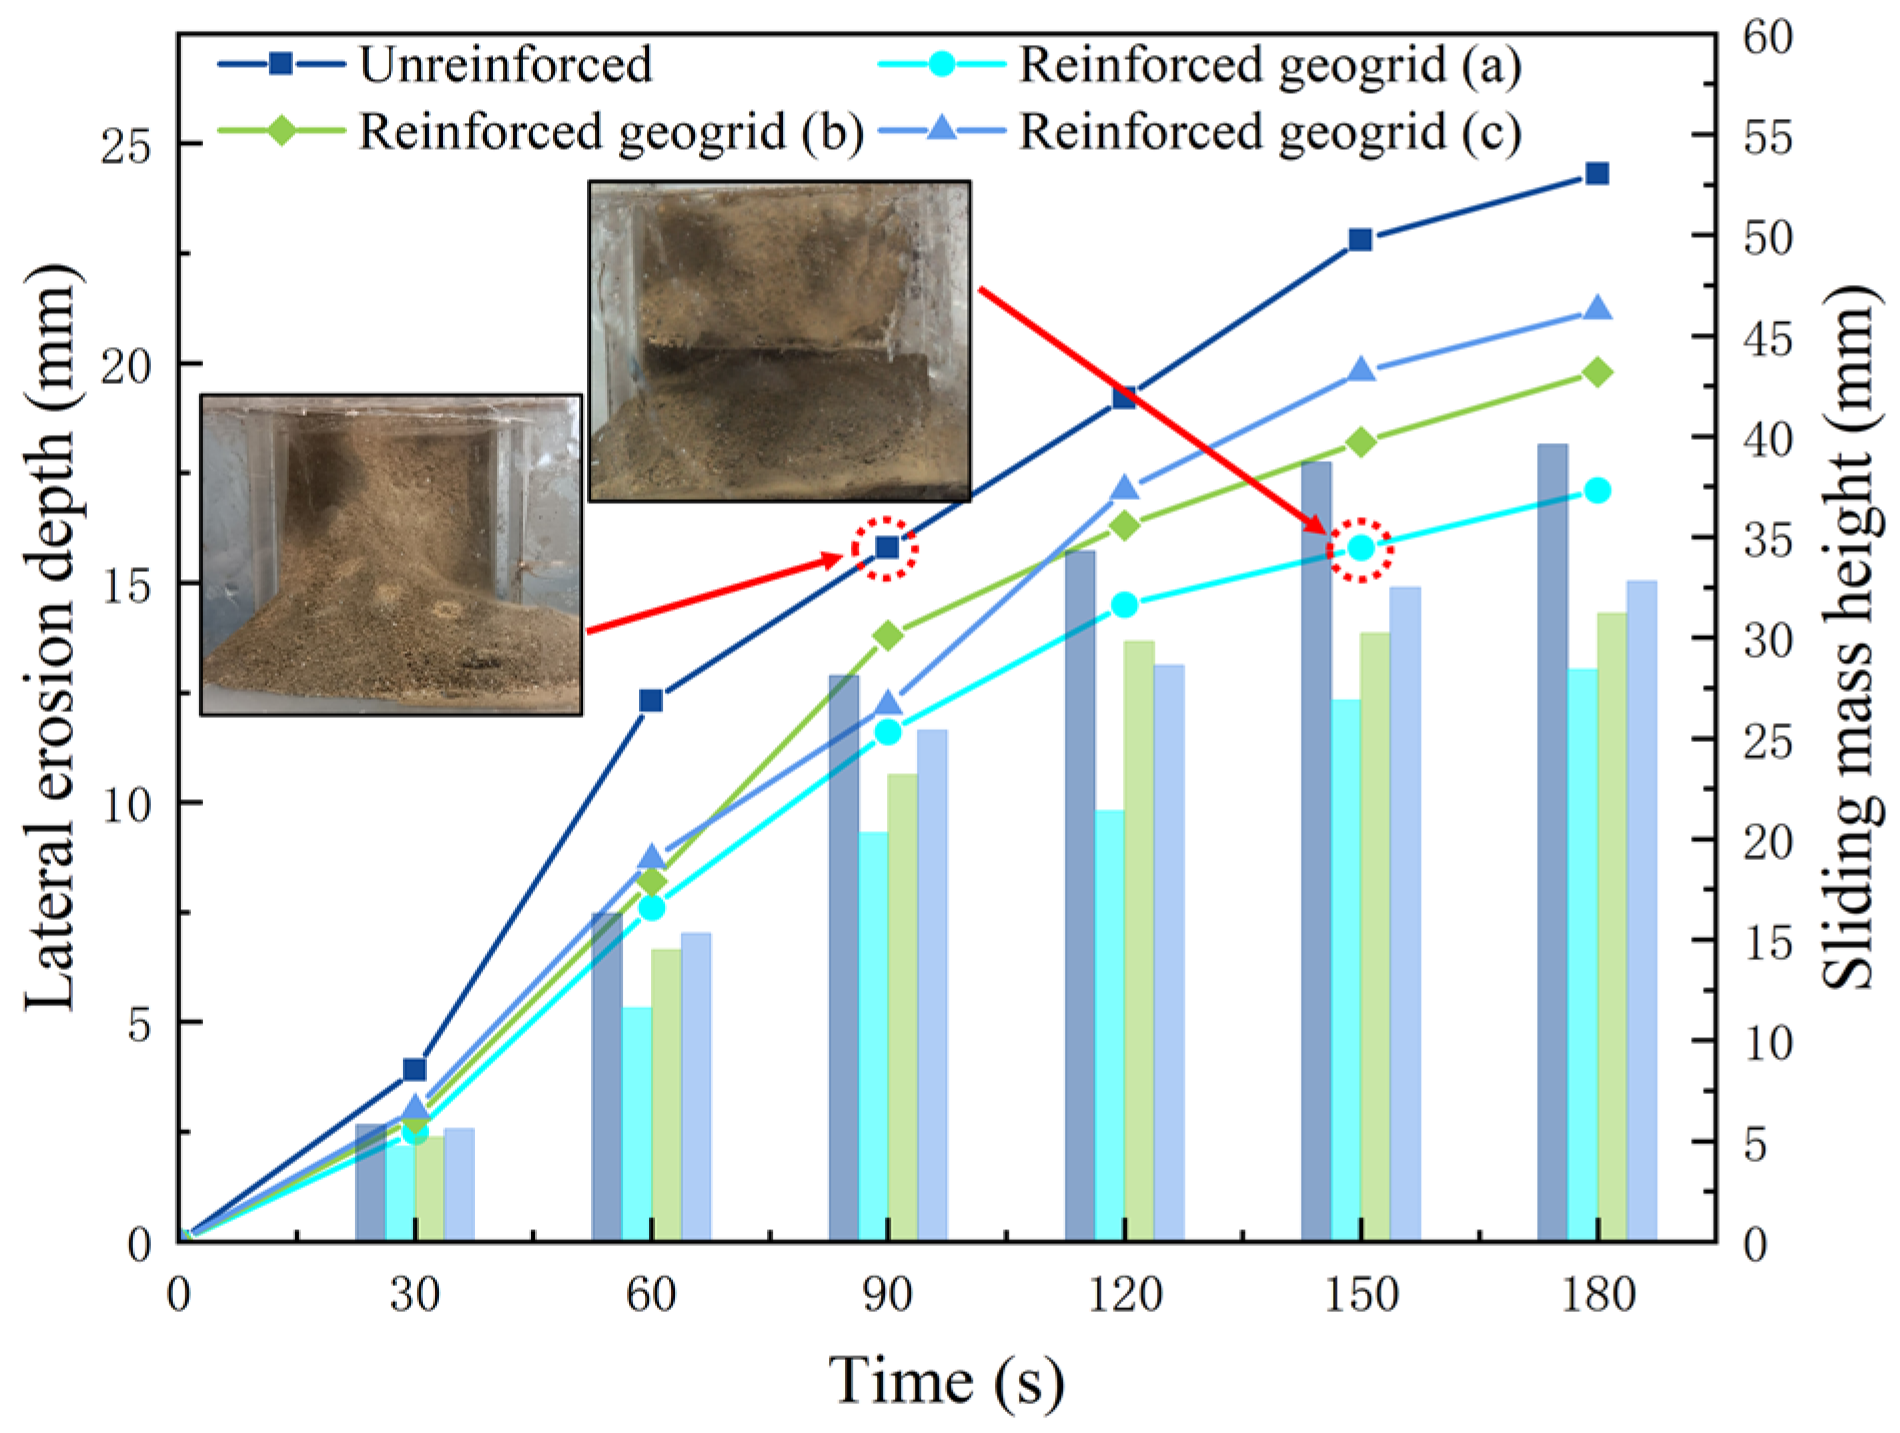
3.1.2. Analysis of Lateral Erosion Depth Variation Patterns
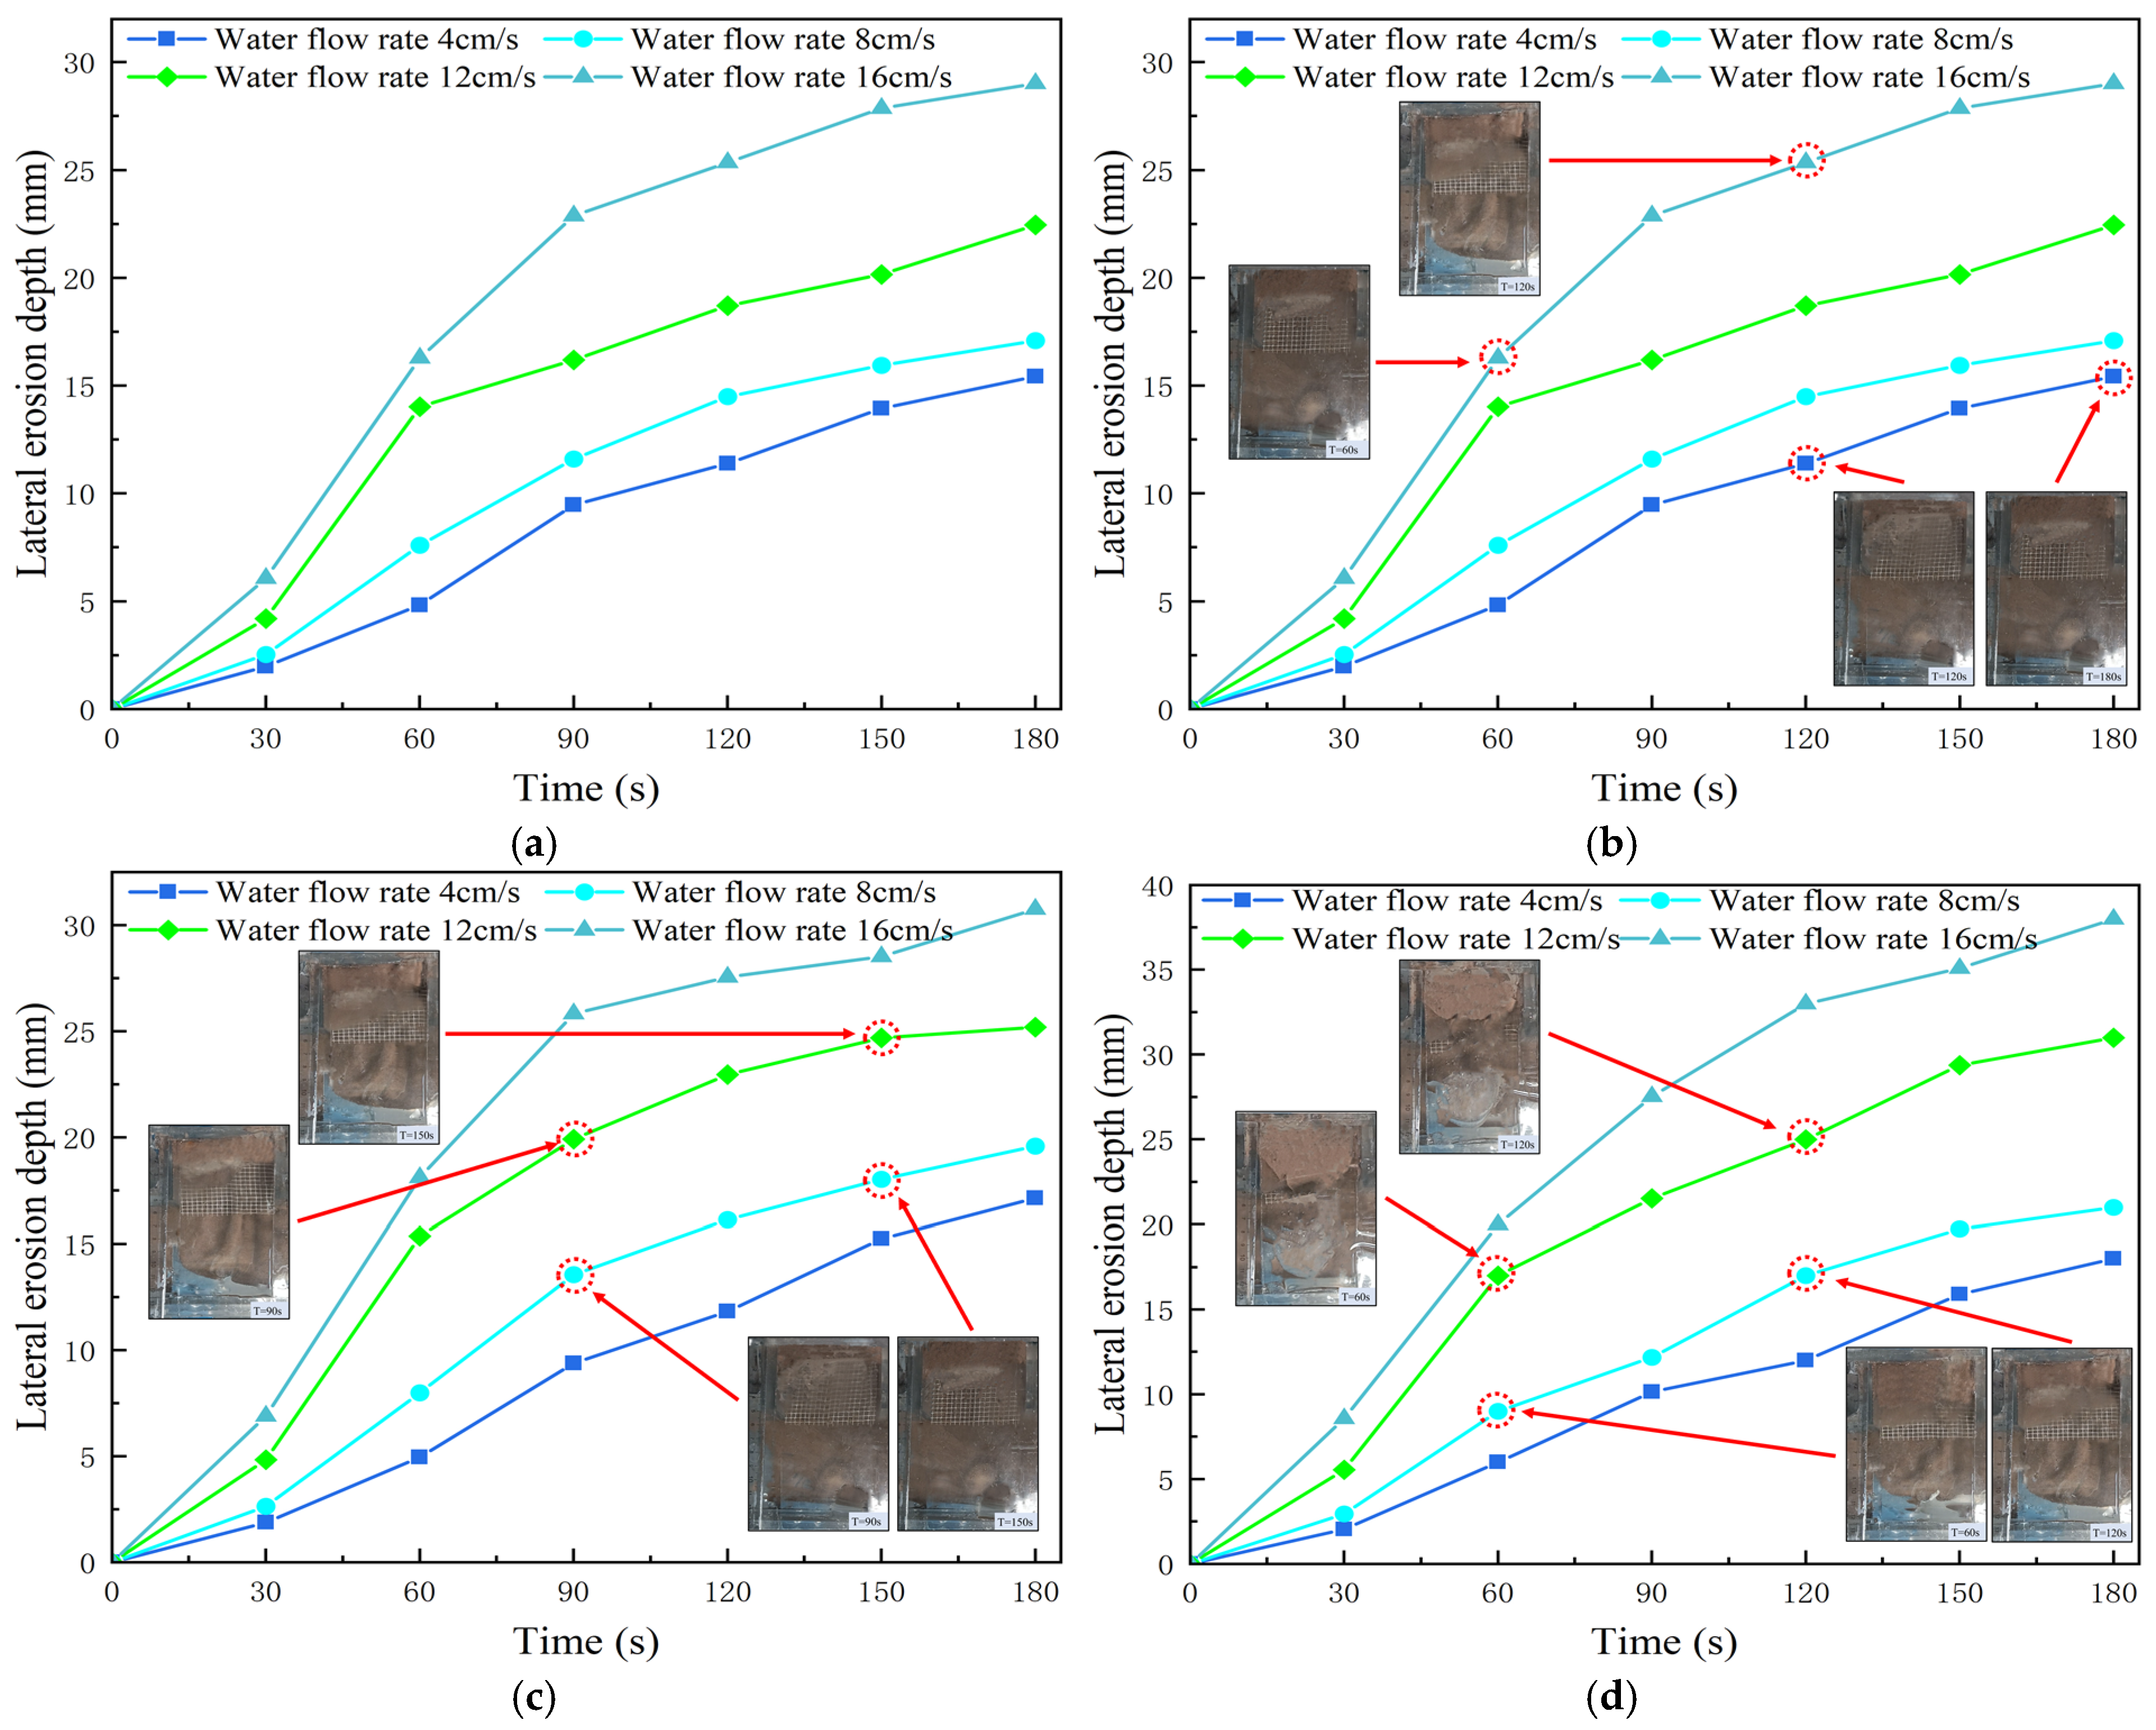
3.2. Test Study on the Effect of Flow Rate on Lateral Erosion of Fine-Grained Tailings
3.2.1. Test Analysis of Erosion Phenomena
3.2.2. Analysis of Lateral Erosion Depth Variation Patterns
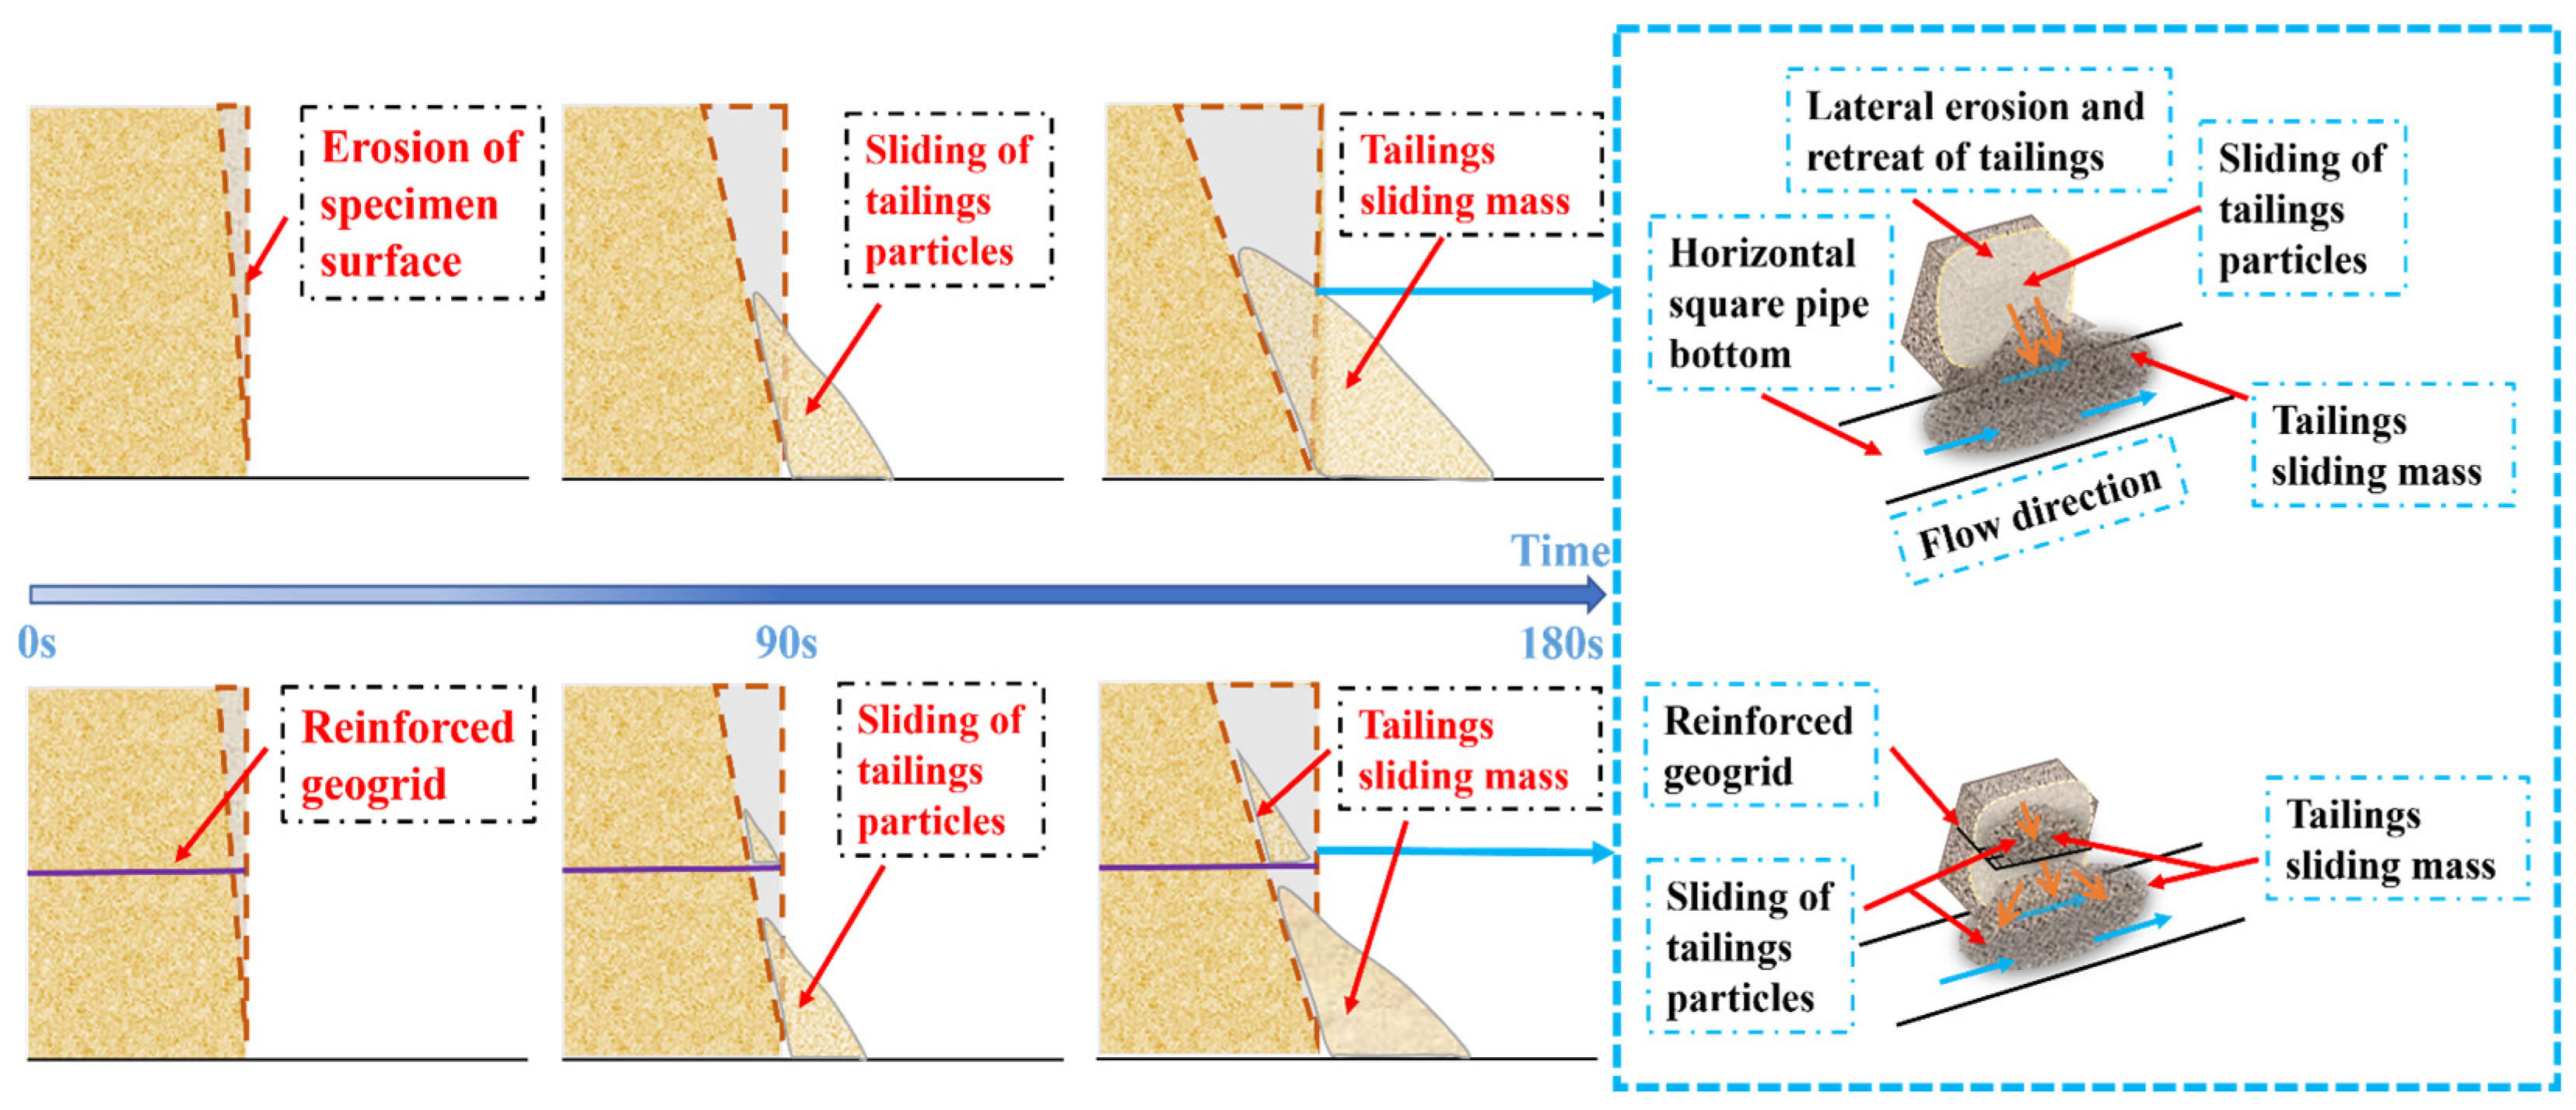
4. Analysis of Lateral Erosion Mechanisms in Reinforced Fine-Grained Tailings
5. Numerical Simulation
5.1. Simulation Process
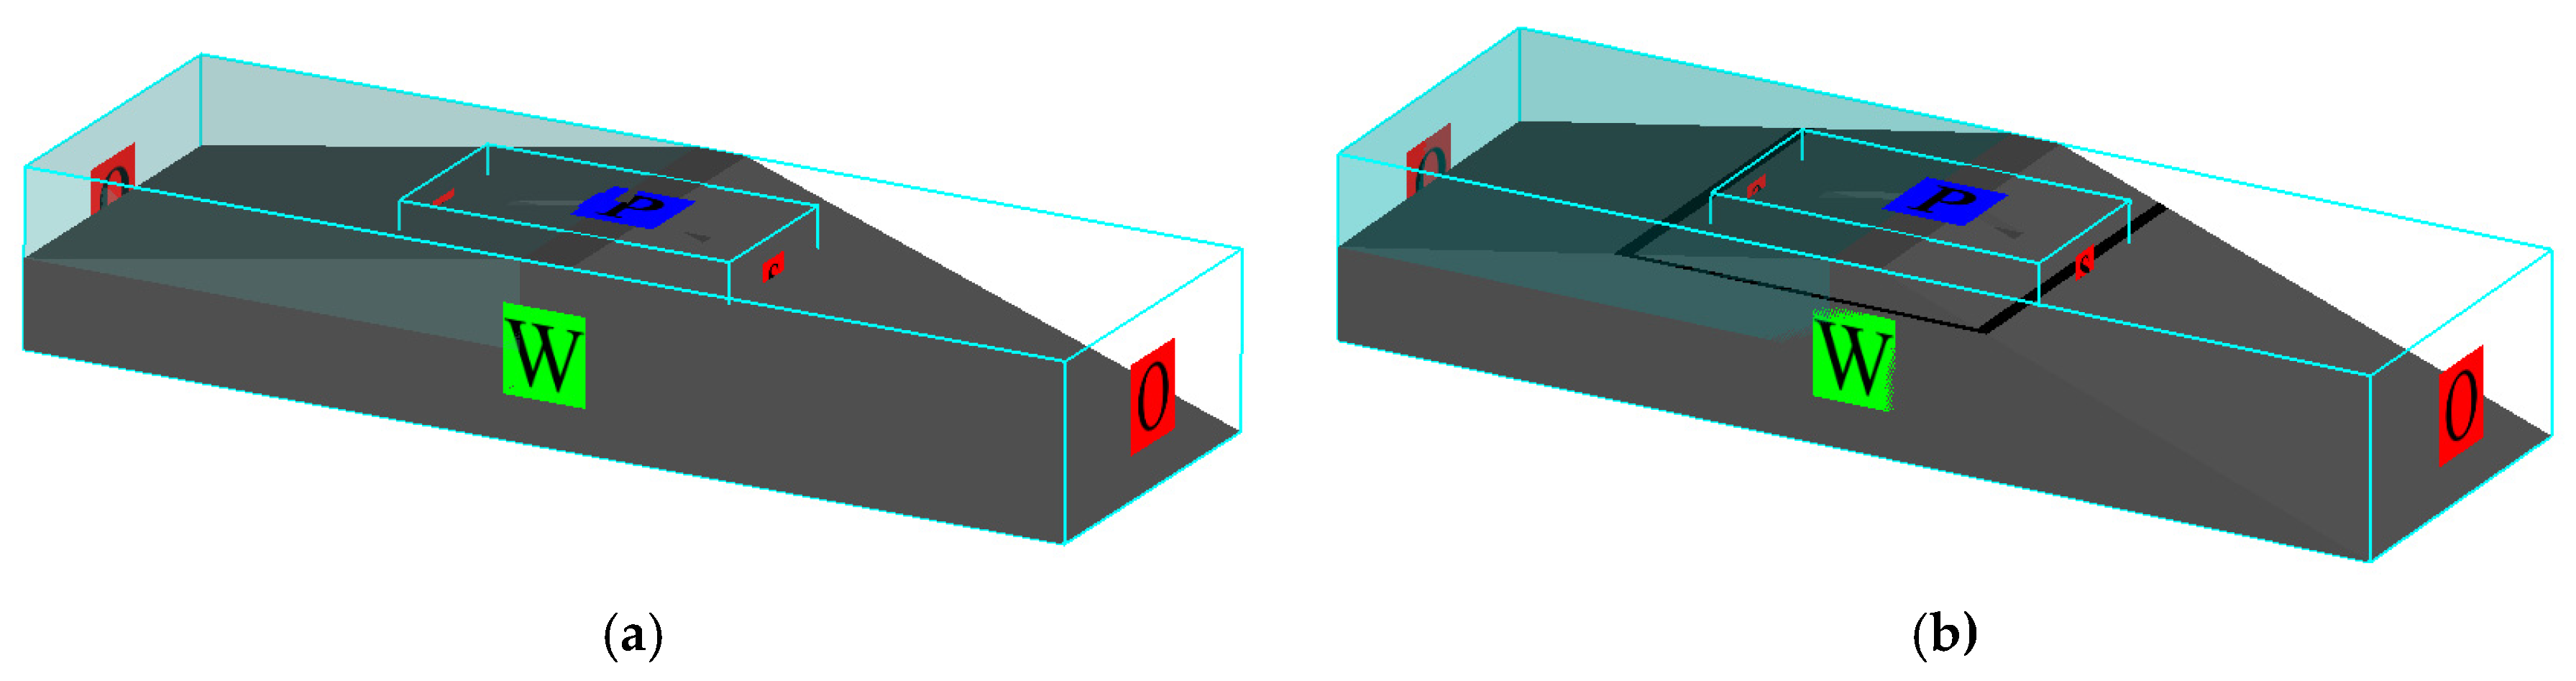
5.1.1. Model Development
5.1.2. Model Parameter Setting
5.2. Simulation Results and Analysis
5.2.1. Unreinforced Tailing Dam
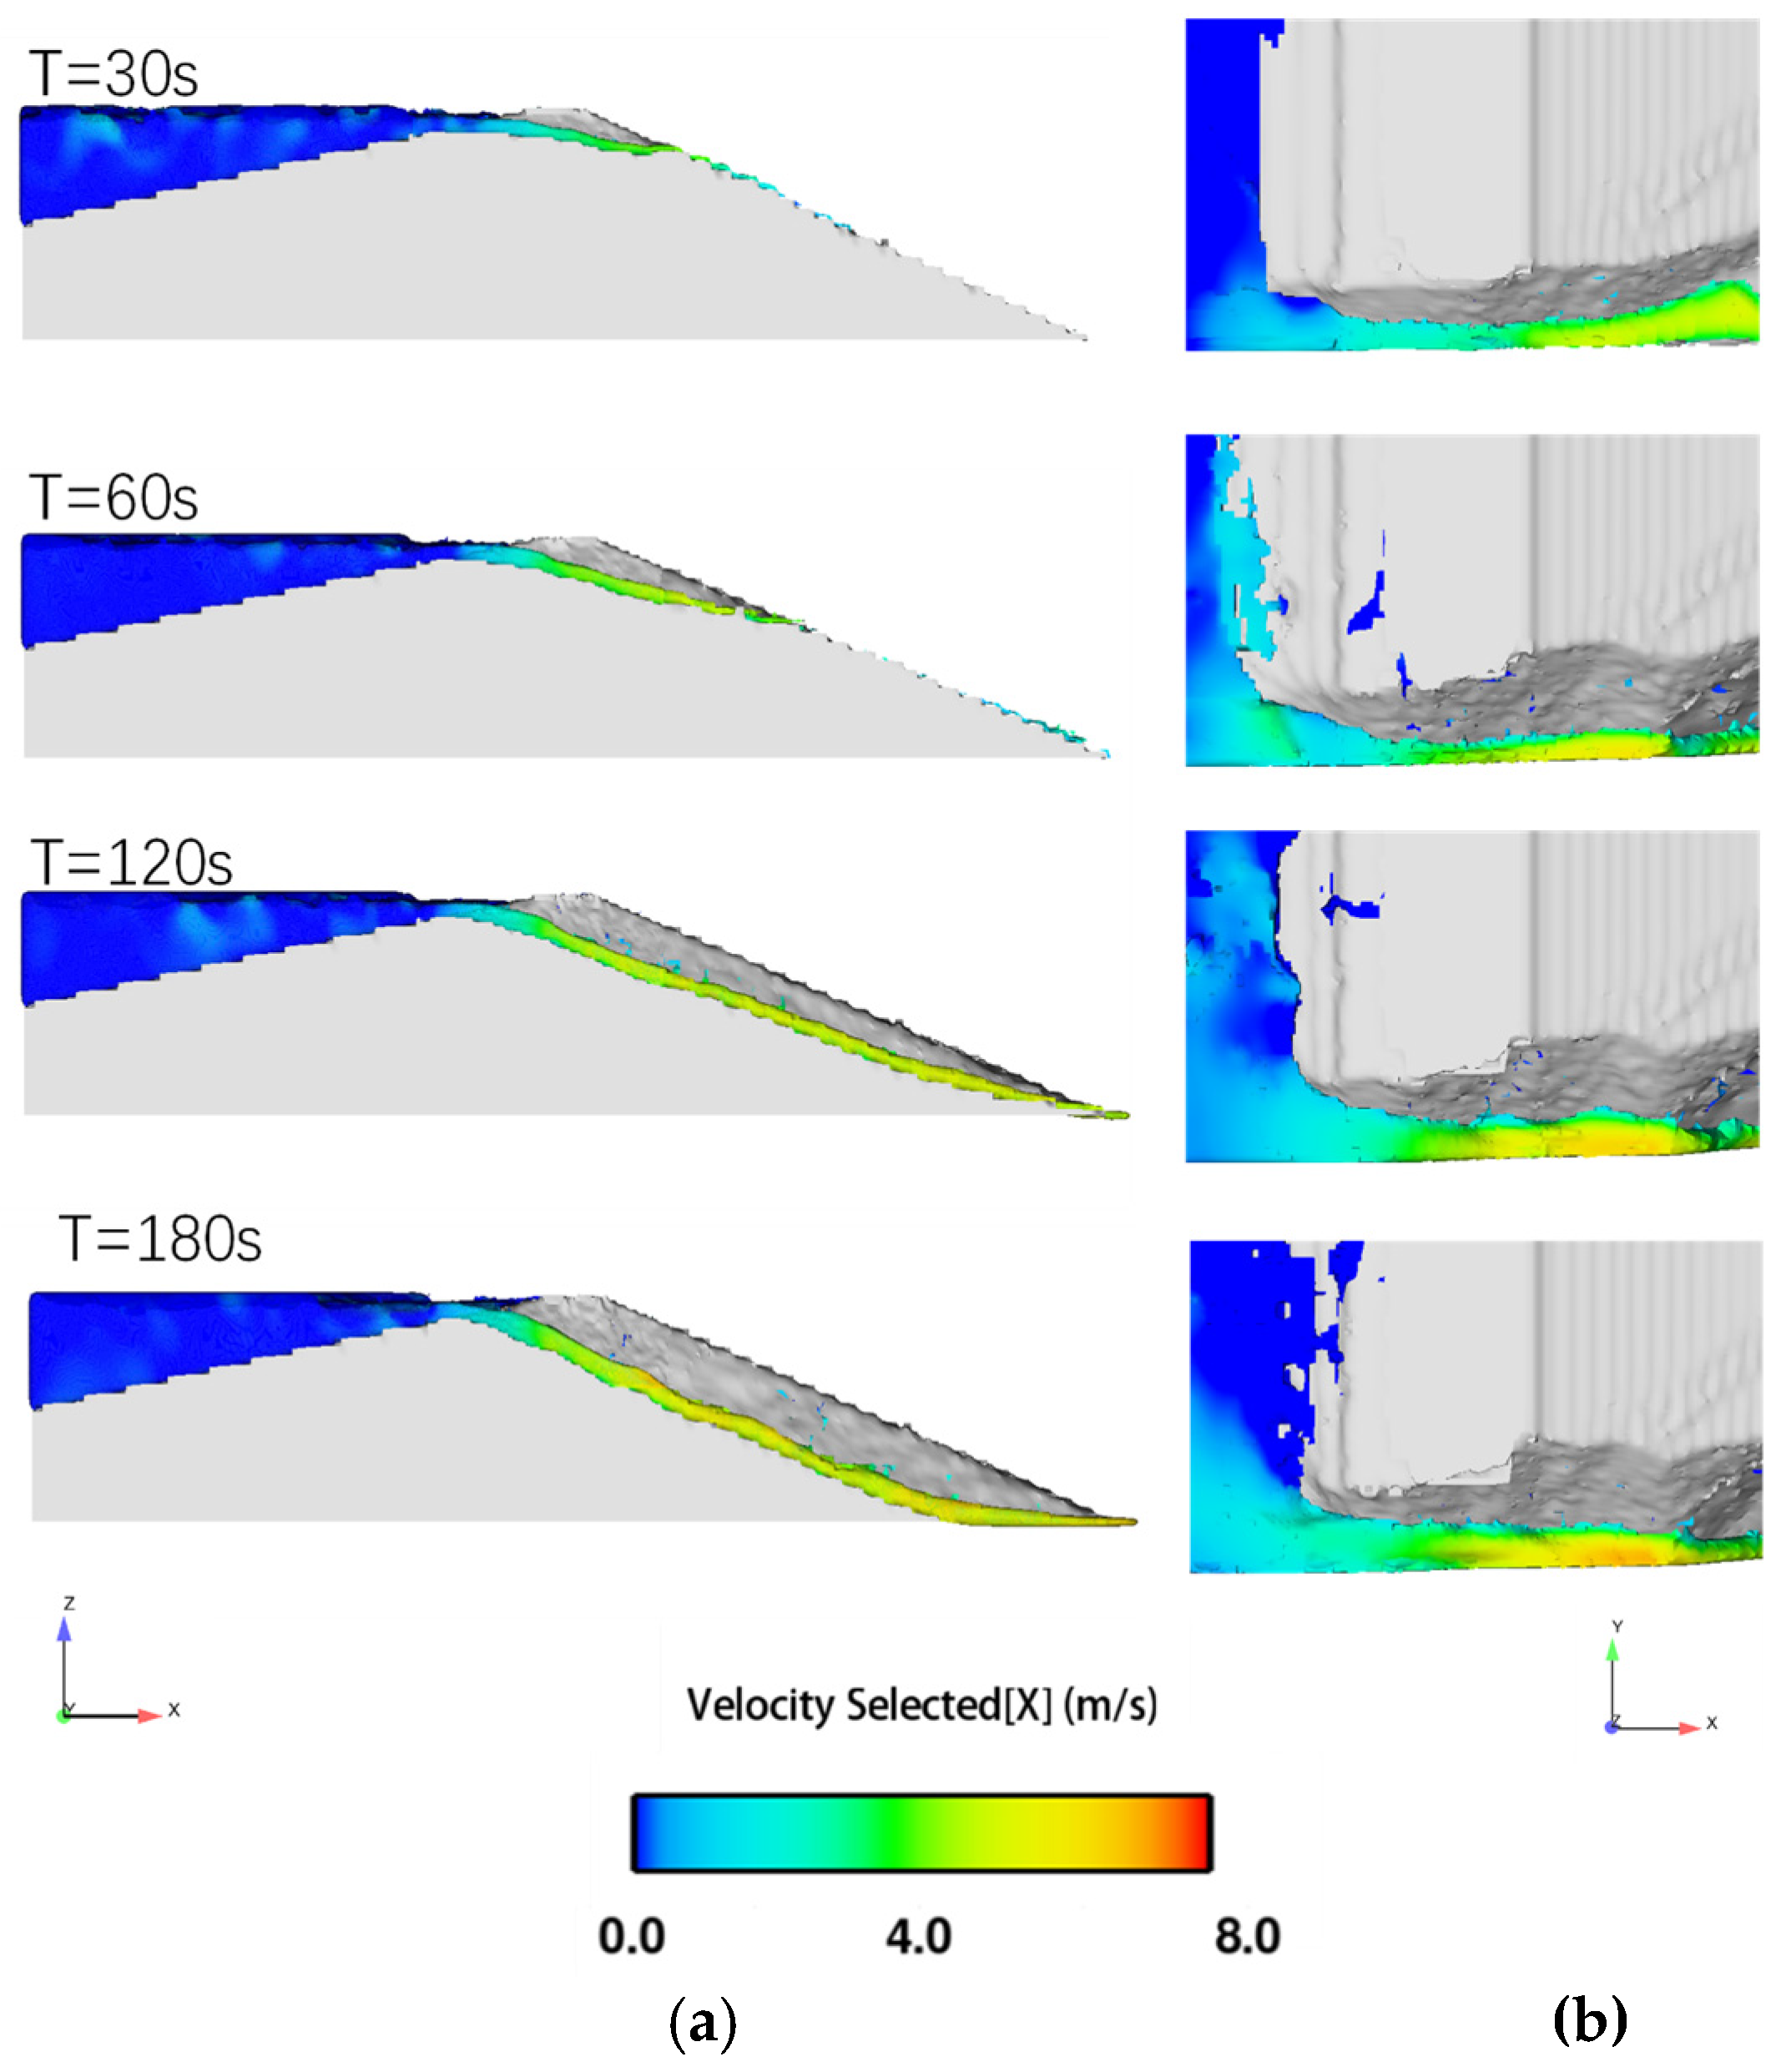
5.2.2. Reinforced Tailing Dam
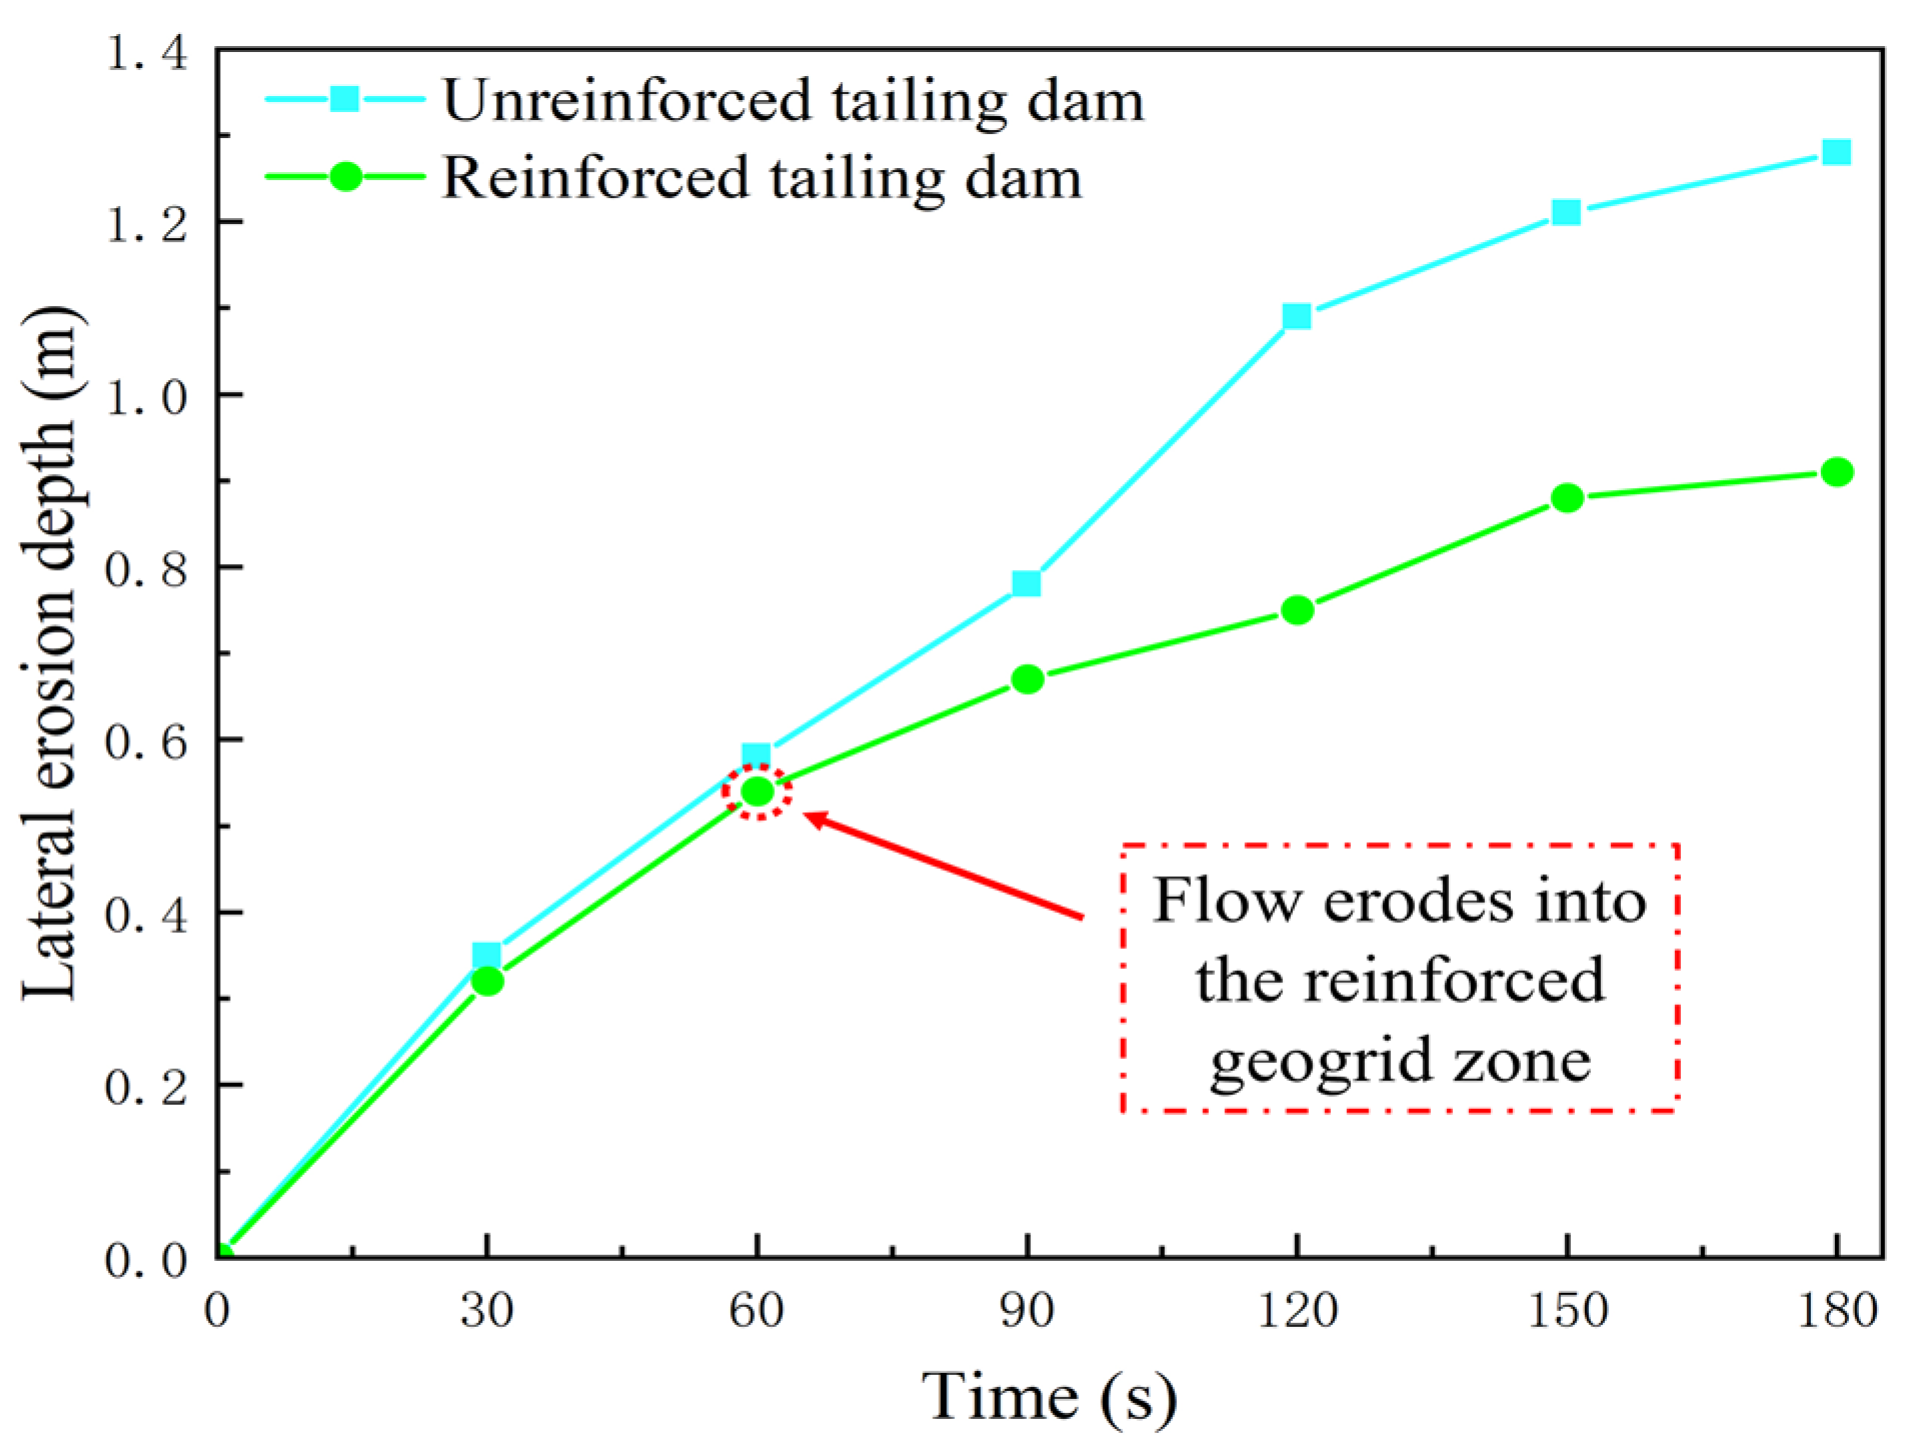
5.2.3. Lateral Erosion Depth Progression at Breach
6. Conclusions and Analysis
- Specimens reinforced with varying aperture sizes (2–3 mm) show systematic reductions in final lateral erosion depths compared to unreinforced specimens across flow rates (4–16 cm/s): 3.3–5.8 mm (15.6–27.4% reduction), 3.1–7.2 mm (12.8–29.6% reduction), 2.3–11 mm (6.9–32.8% reduction), and 2.5–11.4 mm (6.2–28.2% reduction). Smaller-aperture geogrids (2 mm × 2 mm) notably enhance anti-erosion performance through superior particle migration inhibition. As aperture size increases (2.5 mm × 2.5 mm and 3 mm × 3 mm), the constraint effect on fine-grained tailings particles diminishes, resulting in significantly greater erosion depths.
- Numerical simulation results show substantial agreement with model tests. The reinforced geogrid demonstrates a significant mitigating effect during the lateral erosion process, particularly after erosion enters the reinforced zone where the erosion rate markedly decreases. Simulations indicate final lateral erosion depths of 1.28 m for the unreinforced tailings dam and 0.91 m for the reinforced tailings dam. Due to the presence of the reinforced geogrid, the final lateral erosion depth of the reinforced tailings dam is systematically reduced by 0.37 m (28.9% reduction). Tests confirm that the lateral erosion depth of reinforced fine-grained tailings specimens is significantly lower than that of unreinforced specimens. The reinforced geogrid provides structural reinforcement and disperses pressure, objectively enhancing the structural stability of tailings specimens and thereby effectively slowing erosion progression.
- Tests confirm a pronounced positive correlation between flow rate and lateral erosion depth. Elevated flow rates substantially increase hydraulic shear stress and kinetic energy, thereby weakening particle erosion resistance and intensifying particle migration and erosion damage. Particularly under high-flow-rate conditions (12.0 cm/s and 16.0 cm/s), specimens exhibit the most substantial erosion depths.
Author Contributions
Funding
Data Availability Statement
Conflicts of Interest
References
- Zhang, J.F.; Song, Z.F.; Geng, W.Z. Statistical analysis and prevention of the tailings pond quantity accidents in China. Mod. Min. 2023, 39, 6–9. [Google Scholar] [CrossRef]
- Guo, T.T.; Zhao, Z.N. Mechanism analysis of disaster caused by failure of tailings pond and its precautions. Ind. Miner. Process. 2022, 51, 31–34. [Google Scholar] [CrossRef]
- Sun, E.; Zhang, X.; Li, Z.; Wang, Y. Tailings dam flood overtopping failure evolution pattern. Procedia Eng. 2012, 28, 356–362. [Google Scholar] [CrossRef]
- Jing, X.F.; Mao, J.X.; Li, X.S.; Xie, D.X.; Nie, W.; Wu, S.W. Study progress and prospect of overtopping erosion failure mechanism and process of tailings dam. Met. Mine 2023, 5, 86–96. [Google Scholar] [CrossRef]
- Du, Y.Q.; Wang, X.W.; Zhang, K.; Wang, X.Q.; Yang, C.H. Process and mechanism of fine grained tailings dam’s failure due to overtopping. China Saf. Sci. J. 2017, 27, 104–108. [Google Scholar] [CrossRef]
- Hu, Z.; Guo, J.; Liang, Z.; Wang, K.; Feng, Z.; Chen, Z. Effects of clay content on physical and mechanical properties of fine tailings. Chin. J. Geotech. Eng. 2020, 42, 16–21. [Google Scholar] [CrossRef]
- Li, D.Z.; Niu, B. Seepage stability analysis of reinforced tailing dam. Open Min. Tech. 2022, 37, 23–26. [Google Scholar] [CrossRef]
- Wang, Z.J.; Jacobs, F.; Ziegler, M. Visualization of load transfer behaviour between geogrid and sand using PFC 2D. Geotext. Geomembr. 2014, 42, 83–90. [Google Scholar] [CrossRef]
- Bai, J.P.; Ye, C.; Zhao, Y.S.; Jing, X.F.; Zhou, X. Study on influence laws of different reinforced materials on permeability characteristics of tailing dam. J. Saf. Sci. Technol. 2016, 12, 55–59. [Google Scholar] [CrossRef]
- Feng, S.J.; Wang, Y.Q. DEM simulation of geogrid–aggregate interface shear behavior: Optimization of the aperture ratio considering the initial interlocking states. Comput. Geotech. 2023, 154, 105182. [Google Scholar] [CrossRef]
- Wang, Q.S.; Wang, H.Y.; Su, R.L. Experimental study on overtopping breaching of geotextile-reinforced non-cohesive soil-rock dams. J. China Inst. Water Resour. Hydropower Res. 2017, 15, 263–271. [Google Scholar] [CrossRef]
- Zhai, W.K.; Yi, F.; Du, C.B.; Tao, H.; Lu, X.X. Longitudinal evolution of breach and erosion tests for tailings dam overtopping failure. Adv. Sci. Technol. Water Resour. 2023, 43, 45–52. [Google Scholar] [CrossRef]
- Yi, F.; Zhai, W.K.; Du, C.B.; Tao, H.; Liang, L.D. Dynamic evolution and breach spreading test for tailings pond overtopping failure. Adv. Sci. Technol. Water Resour. 2023, 43, 34–41. [Google Scholar] [CrossRef]
- Yi, F.; Tao, H.; Du, C.B.; Qi, X.P.; Zhai, W.K.; Xu, Z. Modelling of overtopping break of large scale tailings pond using composite model sang. J. Chang. River Sci. Res. Inst. 2024, 41, 83–89. [Google Scholar] [CrossRef]
- Li, G.; Zhang, H.; Yang, Z. Experimental and data analysis of flood over topping tailings pond. China Min. Mag. 2019, 18, 129–133. [Google Scholar] [CrossRef]
- Walsh, A.; McDougall, S.; Evans, S.G.; Take, W.A. Effect of upstream dam geometry on peak discharge during overtopping breach in noncohesive homogeneous embankment dams; implications for tailings dams. Water Resour. Res. 2021, 57, 2–23. [Google Scholar] [CrossRef]
- Alhasan, Z.; Jandora, J.; Riha, J. Comparison of specific sediment transport rates obtained from empirical formulae and dam breaching experiments. Environ. Fluid Mech. 2016, 16, 997–1019. [Google Scholar] [CrossRef]
- Wu, J.F.; Liu, X.W.; Ye, R.Q.; Chen, J.S.; Yang, Y.; Wang, J.W. Experimental study on the variation law of the collapse of the dam. Light Met. 2019, 8, 7–14. [Google Scholar] [CrossRef]
- Sun, Y.; Gu, X.W. Experimental study on hydraulic erosion characteristics of ecological slope of tailings reservoir under rainfall. KSCE J. Civ. Eng. 2021, 25, 2426–2436. [Google Scholar] [CrossRef]
- Hu, W.; Xin, C.L.; Li, Y.; Zheng, Y.S.; van Asch, T.W.J. McSaveney. Instrumented flume tests on the failure and fluidization of tailings dams induced by rainfall infiltration. Eng. Geol. 2021, 295, 106401. [Google Scholar] [CrossRef]
- Chen, X.; Jing, X.; Cai, H.; Wang, Y.; Ye, L. Hydraulic Erosion Rate of Reinforced Tailings: Laboratory Investigation and Prediction Model. Adv. Mater. Sci. Eng. 2021, 2021, 1–13. [Google Scholar] [CrossRef]
- Liu, K.H.; Cai, H.; Jing, X.F. Study on Hydraulic Incipient Motion Model of Reinforced Tailings. Water 2021, 13, 2033. [Google Scholar] [CrossRef]
- Souza, T.F., Jr. Simulation of tailings release in dam break scenarios using physical models. REM Int. Eng. J. 2019, 72, 385–393. [Google Scholar] [CrossRef]
- Yao, C.; Wu, L.; Yang, J.; Xiao, L.; Liu, X.; Jiang, Q. Influences of tailings particle size on overtopping tailings dam failures. Mine Water Environ. 2020, 40, 174–188. [Google Scholar] [CrossRef]
- Jing, X.F.; Cheng, Y.L.; David, J.W. Overtopping failure of a reinforced tailings dam: Laboratory investigation and forecasting model of dam failure. Water 2019, 11, 315. [Google Scholar] [CrossRef]
- Liu, J.X.; Yan, Z.K.; Zhong, Q.M.; Chen, L.; Shang, Y.B. Breach mechanism of tailings dam due to overtopping failure and numerical simulation of breach process. J. Cent. South Univ. 2022, 53, 2694–2708. [Google Scholar] [CrossRef]
- Sun, Y.H.; Yuan, L.W.; Gao, W. Numerical simulation study on the breakage of tailings dam in Yunnan based on FLUENT. Ind. Miner. Process. 2020, 49, 4–8. [Google Scholar] [CrossRef]
- Liu, X.F.; Liao, Z.W.; Xiao, L.X.; Liu, C. Numerical simulation of tailings flow discharge process of tailings dam break in real terrain. Metal Mine 2023, 9, 206–212. [Google Scholar] [CrossRef]
- Zhang, J.-Y.; Yang, X.-G.; Fan, G.; Li, H.-B.; Zhou, J.-W. Physical and numerical modeling of a landslide dam breach and flood routing process. J. Hydrol. 2024, 628, 130552. [Google Scholar] [CrossRef]
- DZ/T 0371-2021; Classification of Tailings for Solid Mineral Resources. Ministry of Natural Resources of the People’s Republic of China: Beijing, China, 2021.
- Huang, T.Y.; Wang, G.J.; Wang, M.L.; Lan, R.; Liu, M.S. Numerical simulation of overtopping ang collapse process in tailings ponds based on Flow-3D. Nonferrous Met. Eng. 2024, 14, 119–129. [Google Scholar] [CrossRef]
- Li, H.K.; Liang, X.; Liu, H.H.; Tang, X.; Wang, J.W. Three-dimensional numerical simulation of tailings dam failure based on FLOW-3D. J. Nanchang Univ. 2019, 41, 120–126. [Google Scholar] [CrossRef]
- Jing, X.F.; Mao, J.X.; Ou, J. Study on the Erosion Damage Law in Mountain Flood Disasters Regarding the Exposed Section of Oil Pipelines. Water 2025, 17, 448. [Google Scholar] [CrossRef]


| Tailings Type | Test Number | Reinforced Geogrid Aperture Size (mm × mm) | Erosion Flow Rate (cm/s) |
|---|---|---|---|
| Fine-grained tailings | TN1 | Unreinforced | 4 |
| TN2 | 8 | ||
| TN3 | 12 | ||
| TN4 | 16 | ||
| TA1 | Reinforced geogrid (a) 2 mm × 2 mm | 4 | |
| TA2 | 8 | ||
| TA3 | 12 | ||
| TA4 | 16 | ||
| TB1 | Reinforced geogrid (b) 2.5 mm × 2.5 mm | 4 | |
| TB2 | 8 | ||
| TB3 | 12 | ||
| TB4 | 16 | ||
| TC1 | Reinforced geogrid (c) 3 mm × 3 mm | 4 | |
| TC2 | 8 | ||
| TC3 | 12 | ||
| TC4 | 16 |
| Median Diameter d50 (mm) | Density (g/cm3) | Critical Shields Number | Underwater Repose Angle | Bed Load Coefficient | Carry Over Coefficient |
|---|---|---|---|---|---|
| 0.051 | 1.99 | 0.05 | 32° | 8 | 0.018 |
Disclaimer/Publisher’s Note: The statements, opinions and data contained in all publications are solely those of the individual author(s) and contributor(s) and not of MDPI and/or the editor(s). MDPI and/or the editor(s) disclaim responsibility for any injury to people or property resulting from any ideas, methods, instructions or products referred to in the content. |
© 2025 by the authors. Licensee MDPI, Basel, Switzerland. This article is an open access article distributed under the terms and conditions of the Creative Commons Attribution (CC BY) license (https://creativecommons.org/licenses/by/4.0/).
Share and Cite
Luo, Y.; Zhou, M.; Wang, M.; Feng, Y.; Luo, H.; Ou, J.; Wu, S.; Jing, X. Study on Lateral Erosion Failure Behavior of Reinforced Fine-Grained Tailings Dam Due to Overtopping Breach. Water 2025, 17, 2088. https://doi.org/10.3390/w17142088
Luo Y, Zhou M, Wang M, Feng Y, Luo H, Ou J, Wu S, Jing X. Study on Lateral Erosion Failure Behavior of Reinforced Fine-Grained Tailings Dam Due to Overtopping Breach. Water. 2025; 17(14):2088. https://doi.org/10.3390/w17142088
Chicago/Turabian StyleLuo, Yun, Mingjun Zhou, Menglai Wang, Yan Feng, Hongwei Luo, Jian Ou, Shangwei Wu, and Xiaofei Jing. 2025. "Study on Lateral Erosion Failure Behavior of Reinforced Fine-Grained Tailings Dam Due to Overtopping Breach" Water 17, no. 14: 2088. https://doi.org/10.3390/w17142088
APA StyleLuo, Y., Zhou, M., Wang, M., Feng, Y., Luo, H., Ou, J., Wu, S., & Jing, X. (2025). Study on Lateral Erosion Failure Behavior of Reinforced Fine-Grained Tailings Dam Due to Overtopping Breach. Water, 17(14), 2088. https://doi.org/10.3390/w17142088