Article

Enrichment Strategies for Enhanced Food Waste Hydrolysis in Acidogenic Leach Bed Reactors

1
School of Chemistry and Materials Engineering, Huizhou University, Huizhou 516007, China
2
Department of Resources and Environment, Hunan Agricultural University, Changsha 410128, China
*
Author to whom correspondence should be addressed.
Water 2025, 17(14), 2082; https://doi.org/10.3390/w17142082
Submission received: 18 May 2025 / Revised: 26 June 2025 / Accepted: 3 July 2025 / Published: 11 July 2025
(This article belongs to the Special Issue Anaerobic Digestion Process in Wastewater Treatment)

Abstract

This study evaluated the efficacy of acclimated cow manure as a seed microbiome to enhance food waste hydrolysis. Anaerobic hydrolysis was performed on simulated food waste in a hydrolytic–acidogenic leach bed reactor (LBR) operated in batch mode under mesophilic conditions (35 °C) for 16 days. The acclimation process involved three sequential runs: Run-1 utilized 20% (w/w) cow manure as seed, Run-2 employed the digestate from Run-1 (day 5), and Run-3 used the digestate from Run-1 (day 10). Run-3 achieved 70.4% removal of volatile solids (VSs), surpassing Run-1 (47.1%) and Run-2 (57.1%). Compared with the first run, the production of chemical oxygen demand (COD) and total soluble products (TSPs) increased by 48.7% and 75.9%, respectively, in Run-3. The hydrolysis rate of proteins was 48.4% in Run-1, while an increase of 16.9% was achieved in Run-3 with the acclimatized consortium. A molecular analysis of the microbial community existing in the reactors of Run-2 and Run-3 indicated that the improvement in process performance was closely related to the selection and enrichment of specific hydrolytic–acidogenic bacteria in the reactor. A functional analysis showed that the gene copy numbers for pyruvate synthesis and fatty acid synthesis and metabolism pathways were higher in all bacterial species in Run-3 compared to in those of the other two runs, indicating improved capacity through acclimation in Run-3. The experimental results demonstrate that the hydrolysis of food waste can be enhanced through the acclimation of seed microbes from cow manure.

1. Introduction

Food waste is the single largest component of the municipal solid waste stream by weight, representing 30–55% in different countries. More than 5 million tons of food waste is generated every year in Shanghai, one of the largest cities in China [1]. Food waste has mostly been disposed of in landfills in recent years, resulting in landfills having a reduced life span, and causing the emission of greenhouse gases and groundwater pollution through landfill leachate production [2]. Rising energy production and waste disposal costs, combined with environmental concerns, make food-waste-to-energy conversion increasingly economically attractive. Among biological treatments, anaerobic digestion (AD) is the most cost-effective due to its high energy recovery and limited environmental impact. Furthermore, the physical and chemical properties of food waste make it a suitable substrate for anaerobic digestion [3].
Two-phase AD has recently been gaining attention over traditional single-phase AD, especially for organic wastes with high solid (>20%) contents such as food waste. The advantages of two-phase AD systems include the possibility to optimize each reactor separately and increased digester stability and processing rate. However, total methane recovery is not significantly higher than that of the single-phase reactor [4]. Thus, any improvement in methane recovery would increase the applicability of two-phase systems. The anaerobic digestion of food waste starts with the depolymerization of polymers to monomers, followed by monomers’ degradation to reduced compounds, a process termed as hydrolysis, which is also considered a rate-limiting step in AD [5,6]. Researchers have proposed various strategies to improve the hydrolytic efficiency of organic solid waste. Measures to enhance hydrolysis during food waste AD can generally be divided into two categories, i.e., the selection of the reactor configuration [7,8,9,10,11] and process optimization [7,10,11,12,13,14,15]. The addition of hydrolytic enzymes can also accelerate the hydrolysis of organic solid waste [16]. Although these methods effectively enhance food waste hydrolysis, their high operational costs limit their economic viability. Since organic compound solubilization and degradation rely on microbial reactions, microorganisms serve as critical drivers for process optimization.
In most two-phase systems, a leach bed reactor (LBR) is employed as the hydrolytic–acidogenic phase to treat wastes with high solid contents. Dry process systems such as LBR can achieve high performance through optimization strategies such as using adapted inocula (e.g., manure, sewage sludge, and digestate) and recirculating the leachate. Cow manure contains abundant microbial populations that degrade particulate matter, including cellulose, through complex microbial interactions [17]. These rumen-derived microbes encompass 19 phyla and 180 genera, predominantly Firmicutes, Bacteroidetes, and Proteobacteria [17]. Such microbial diversity confers high metabolic adaptability under similar environmental conditions. The selection of an efficient hydrolytic microbial community can be achieved by obtaining a consortium at specific sampling points of existing LBRs treating the same type of organic waste.
The present study aims to investigate the effectiveness of inoculating a specific microbial consortium obtained from an LBR treating food wastes under conditions of high COD and VFA production. Thus, the acclimated consortium obtained may have higher hydrolysis and process rates than when directly inoculating the seed in batch experiments. Furthermore, the inoculation of this consortium is expected to change the bacterial diversity in the LBR, and understanding these dynamics in diversity will provide insights into the hydrolytic–acidogenic processes in the LBR. Therefore, this study aims to inoculate LBR with an inoculum containing a specific anaerobic consortium and analyze bacterial dynamics using molecular methods.

2. Materials and Methods

2.1. Substrates and Inocula

The simulated food waste consisted of 35% bread, 25% boiled rice, 25% cabbage, and 15% boiled pork (wet weight basis). The boiled rice and meat were ground twice using a meat grinder, resulting in a homogenous particle size small enough (4–6 mm) for anaerobic digestion. The bread and cabbage were evenly cut into small particles with a diameter of around 4–6 mm. Then, the four components were thoroughly mixed and stored in plastic bags at 4 °C before the experiment. Cow manure collected from a cattle farm in Boluo, Huizhou City, was used as the initial seed. The physicochemical characteristics of the food waste and cow manure used in this study are summarized in Table 1.

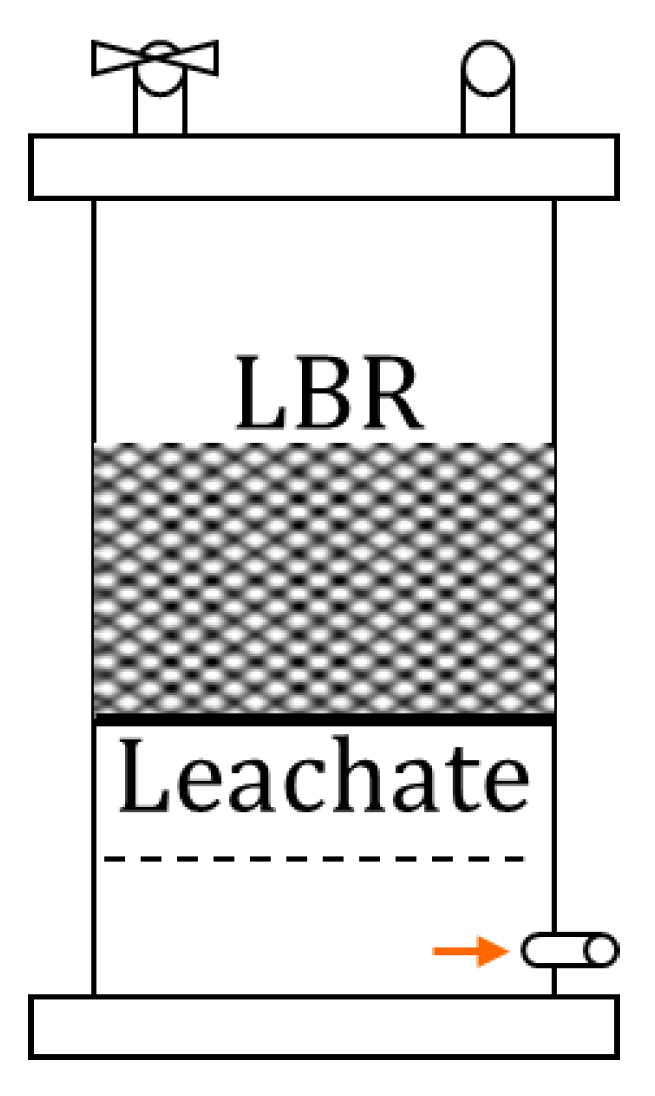
2.2. Experimental Set-Up

The leach bed reactors (3) were constructed using 150 mm diameter PVC pipes with end caps, providing a total working volume of 4.6 L and a leach bed volume of 1.8 L (Figure 1). To retain food waste, the reactors included a bottom-mounted stainless steel mesh, with additional filtration layers consisting of two nylon meshes with <1 mm pores and glass beads to prevent clogging. Percolation and filtration naturally occurred within the system. This design supports the primary function of the LBR, which is to produce a liquid phase rich in volatile fatty acids and other soluble products, intended for further processing in a secondary anaerobic digestion reactor for methane production.
Each LBR contained 1 kg of food waste mixed with 20% (inoculum/substrate ratio, wet basis) cow manure (or specific microbial consortia) as the inoculum and 100 g of wood chips as the bulking agent, following established protocols [10]. A liquid-to-solid ratio of 1.0 was maintained by adding 1.0 L of tap water to each reactor. Daily sampling was conducted to prevent acidification inhibition. During sampling, leachate was withdrawn and its volume was measured. Half of the collected leachate was pH-adjusted to 6.0 and recirculated to the LBR through the top port [10], while the remaining portion was subjected to physicochemical analysis. System performance was assessed through an analysis of the process indicators: COD, VFAs, alcohols, NH4+-N, TKN, and the microbial community structure.

2.3. Analytical Methods

TS and vs. were determined by oven drying (105 °C, 24 h) and ignition (550 °C, 2 h). TOCsolid was analyzed using the modified Walkley–Black method [18], while TNsolid was determined through digestion and spectrophotometric analysis [19].
LBR leachate was analyzed for pH, COD, and VFA concentrations. pH measurements were conducted using a pH electrode (Orion 920, Thermo Scientific, Waltham, MA, USA). COD concentrations were determined following standard method 5220D [19]. Leachate samples were filtered through 0.45 μm cellulose acetate membranes and analyzed for VFAs and alcohols using an HP 6890 Series gas chromatograph (Hewlett Packard) equipped with a flame ionization detector. Both the injector and detector temperatures were maintained at 250 °C. Nitrogen served as the carrier gas at a flow rate of 20 mL/min (25 psi). The oven temperature program consisted of an initial temperature of 120 °C held for 5 min, which was ramped to 180 °C at 5 °C/min and then maintained at 180 °C for an additional 10 min. Separation was achieved using an Econo-Cap EC1000 column (15 m × 0.53 mm × 1.20 μm) coated with 0.2 μm CP-Wax 57 CB. Quantification was performed using calibration curves generated from standard solutions containing alcohols (ethanol, propanol, and butanol) and VFAs (acetic, propionic, iso-butyric, butyric, iso-valeric, and valeric acids). The sum of these alcohols and VFA concentrations are reported as the total soluble products. An analysis was performed in triplicate to ensure data reliability and reproducibility.

2.4. Kinetics Study

To compare the effect of different seed consortia on the solubilization of particulate solids and the hydrolysis of proteins, first-order kinetics was applied. The effects of different processes on the hydrolysis rate have traditionally been simplified to the first-order kinetics for substrate biodegradation [20] as follows:
d S d t = k S
S is the volatile solids (VS) concentration of particular substrates; k is the first-order hydrolysis constant (d−1). After integration, the product concentration is expressed as
St = S0 × ekt
where S0 and St are the concentrations of substrates at the beginning and at t time (gCOD/kg·VS), t is the reaction time (d), and k represents the kinetic constant (d−1). A non-linear regression analysis was performed using SPSS Statistics (version 19) to estimate the values of constants k and its standard deviations (SDs) as well as the R2 value of the ANOVA.

2.5. DNA Extraction and High-Throughput 16S rRNA Gene Pyrosequencing

Genomic DNA was extracted from reactor solids at each sampling point. Sample suspensions (10 mL) were centrifuged (13,000 rpm, 5 min), and pellets were washed with Milli-Q water and re-centrifuged to remove residual medium. DNA was extracted from duplicate samples after two washing cycles, and the PowerSoil@ DNA Isolation Kit (MOBIO Laboratories, Carlsbad, CA USA) was used following the manufacturer’s recommendations. The extracted DNA samples were stored at −20 °C. The microbial community in the samples collected from the suspended biomass of each run reactor was analyzed using high-throughput pyrosequencing. Amplicon libraries were constructed using bacterial primers 515F (5′-GTG CCA GCM GCC GCG GTAA-3′) and 806R (5′-GGA CTA CHV GGG TWT CTA AT-3′) targeting the V4-V5 hypervariable region of the 16S rRNA gene for high-throughput sequencing.
The sequencing data obtained was used to perform BLAST on the NCBI database to identify the most closely related bacterial species. Subsequently, the corresponding protein sequences of the aligned bacteria from NCBI were downloaded, and KOBAS-i (http://bioinfo.org/kobas/, accessed on 26 June 2025) was used for KEGG annotation. Based on their functional presence in the reactor, the following 9 KEGG pathways were selected as priorities: “Microbial metabolism in diverse environments”, “Fructose and mannose metabolism”, “Fatty acid biosynthesis”, “Starch and sucrose metabolism”, “Amino sugar and nucleotide sugar metabolism”, “Pyruvate metabolism”, “Nitrogen metabolism”, “Carbon metabolism”, and “Fatty acid metabolism”. Then, the gene copy numbers of different bacterial species with abundances >1% on these pathways were compared, the R package (verison 1.0.13) "heatmap" (https://cran.r-project.org/web/packages/pheatmap, accessed on 26 June 2025) was applied to generate a heatmap, and the x-axis was scaled to compare the differences in gene copy numbers across different bacteria for the same metabolic pathway.

3. Results

3.1. Performances of the Anaerobic Digestion Process

3.1.1. COD Leaching

COD production exhibited substantial variation among the three experimental runs, differing in both daily generation rates and total cumulative yields (Figure 2). The cumulative yield improved from 416.7 g/kg VS added (Run 1) to 619.5 g/kg VS added (Run 3), corresponding to a 48.7% increase. The daily COD production trends of the three runs were different from each other. In the first two runs, both COD values showed a slowly increasing trend, and the peak values were observed on day 15 in Run 1, while they appeared on day 11 in Run 2. The shift in peak value of COD production indicated that the acclimation of microorganisms led to a shorter start-up time. The daily COD trend of Run 3 differed from the first two runs; however, it was similar to the normal COD profile of the batch study previously reported [11]. After acclimation, the start-up time of Run 3 was reduced to 5 days.
Compared with the first two runs (0.42 g COD/g VSadded for Run-1 and 0.43 g COD/g VSadded for Run-2), an obvious increase in cumulative COD was achieved in Run-3, i.e., 0.62 g COD/g VSadded. The cumulative COD leaching of the first two runs were almost the same, indicating that the microbial consortium collected on day 5 was not good enough for effective hydrolysis. Despite the abundance of microbes in cow manure, efficient hydrolytic–acidogenic microbes might be low in population and require a few days to achieve the specific proliferation of microbes. Furthermore, the storage of the cow manure could have caused partial inactivation of the microbes that require time for activation or to be physiologically competent. The distinct COD leaching profiles among the three runs indicate that enhanced hydrolysate concentrations were primarily attributed to microbial enrichment strategies.
Figure 2 shows the daily and cumulative COD leaching across the three runs. Run-3 achieved a cumulative COD yield of 619.5 g COD/kg VSadded, a 48.7% increase over Run-1. This improvement in COD leaching is consistent with the findings by Rocamora et al., who reported that acclimating microbial consortia in LBRs can reduce start-up times and increase hydrolytic efficiency [11]. The earlier peak COD production in Run-3 (day 5) compared to Run-1 (day 15) further indicates that microbial acclimation shortened the lag phase and accelerated hydrolysis.
The differences between Run-1 and Run-3 highlight the importance of microbial community adaptation. Initial inoculation with raw cow manure in Run-1 resulted in a slower hydrolysis rate, likely due to the need for microbial populations to adapt to the high organic loading of the food waste. In contrast, the acclimated community in Run-3 showed a faster response, consistent with the hypothesis that microbial acclimation enhances hydrolytic activity [18]. Also, the COD leaching rate in Run-3 was much higher than that in a previous report using fresh cow dung as an inoculum in a leach bed reactor [21].

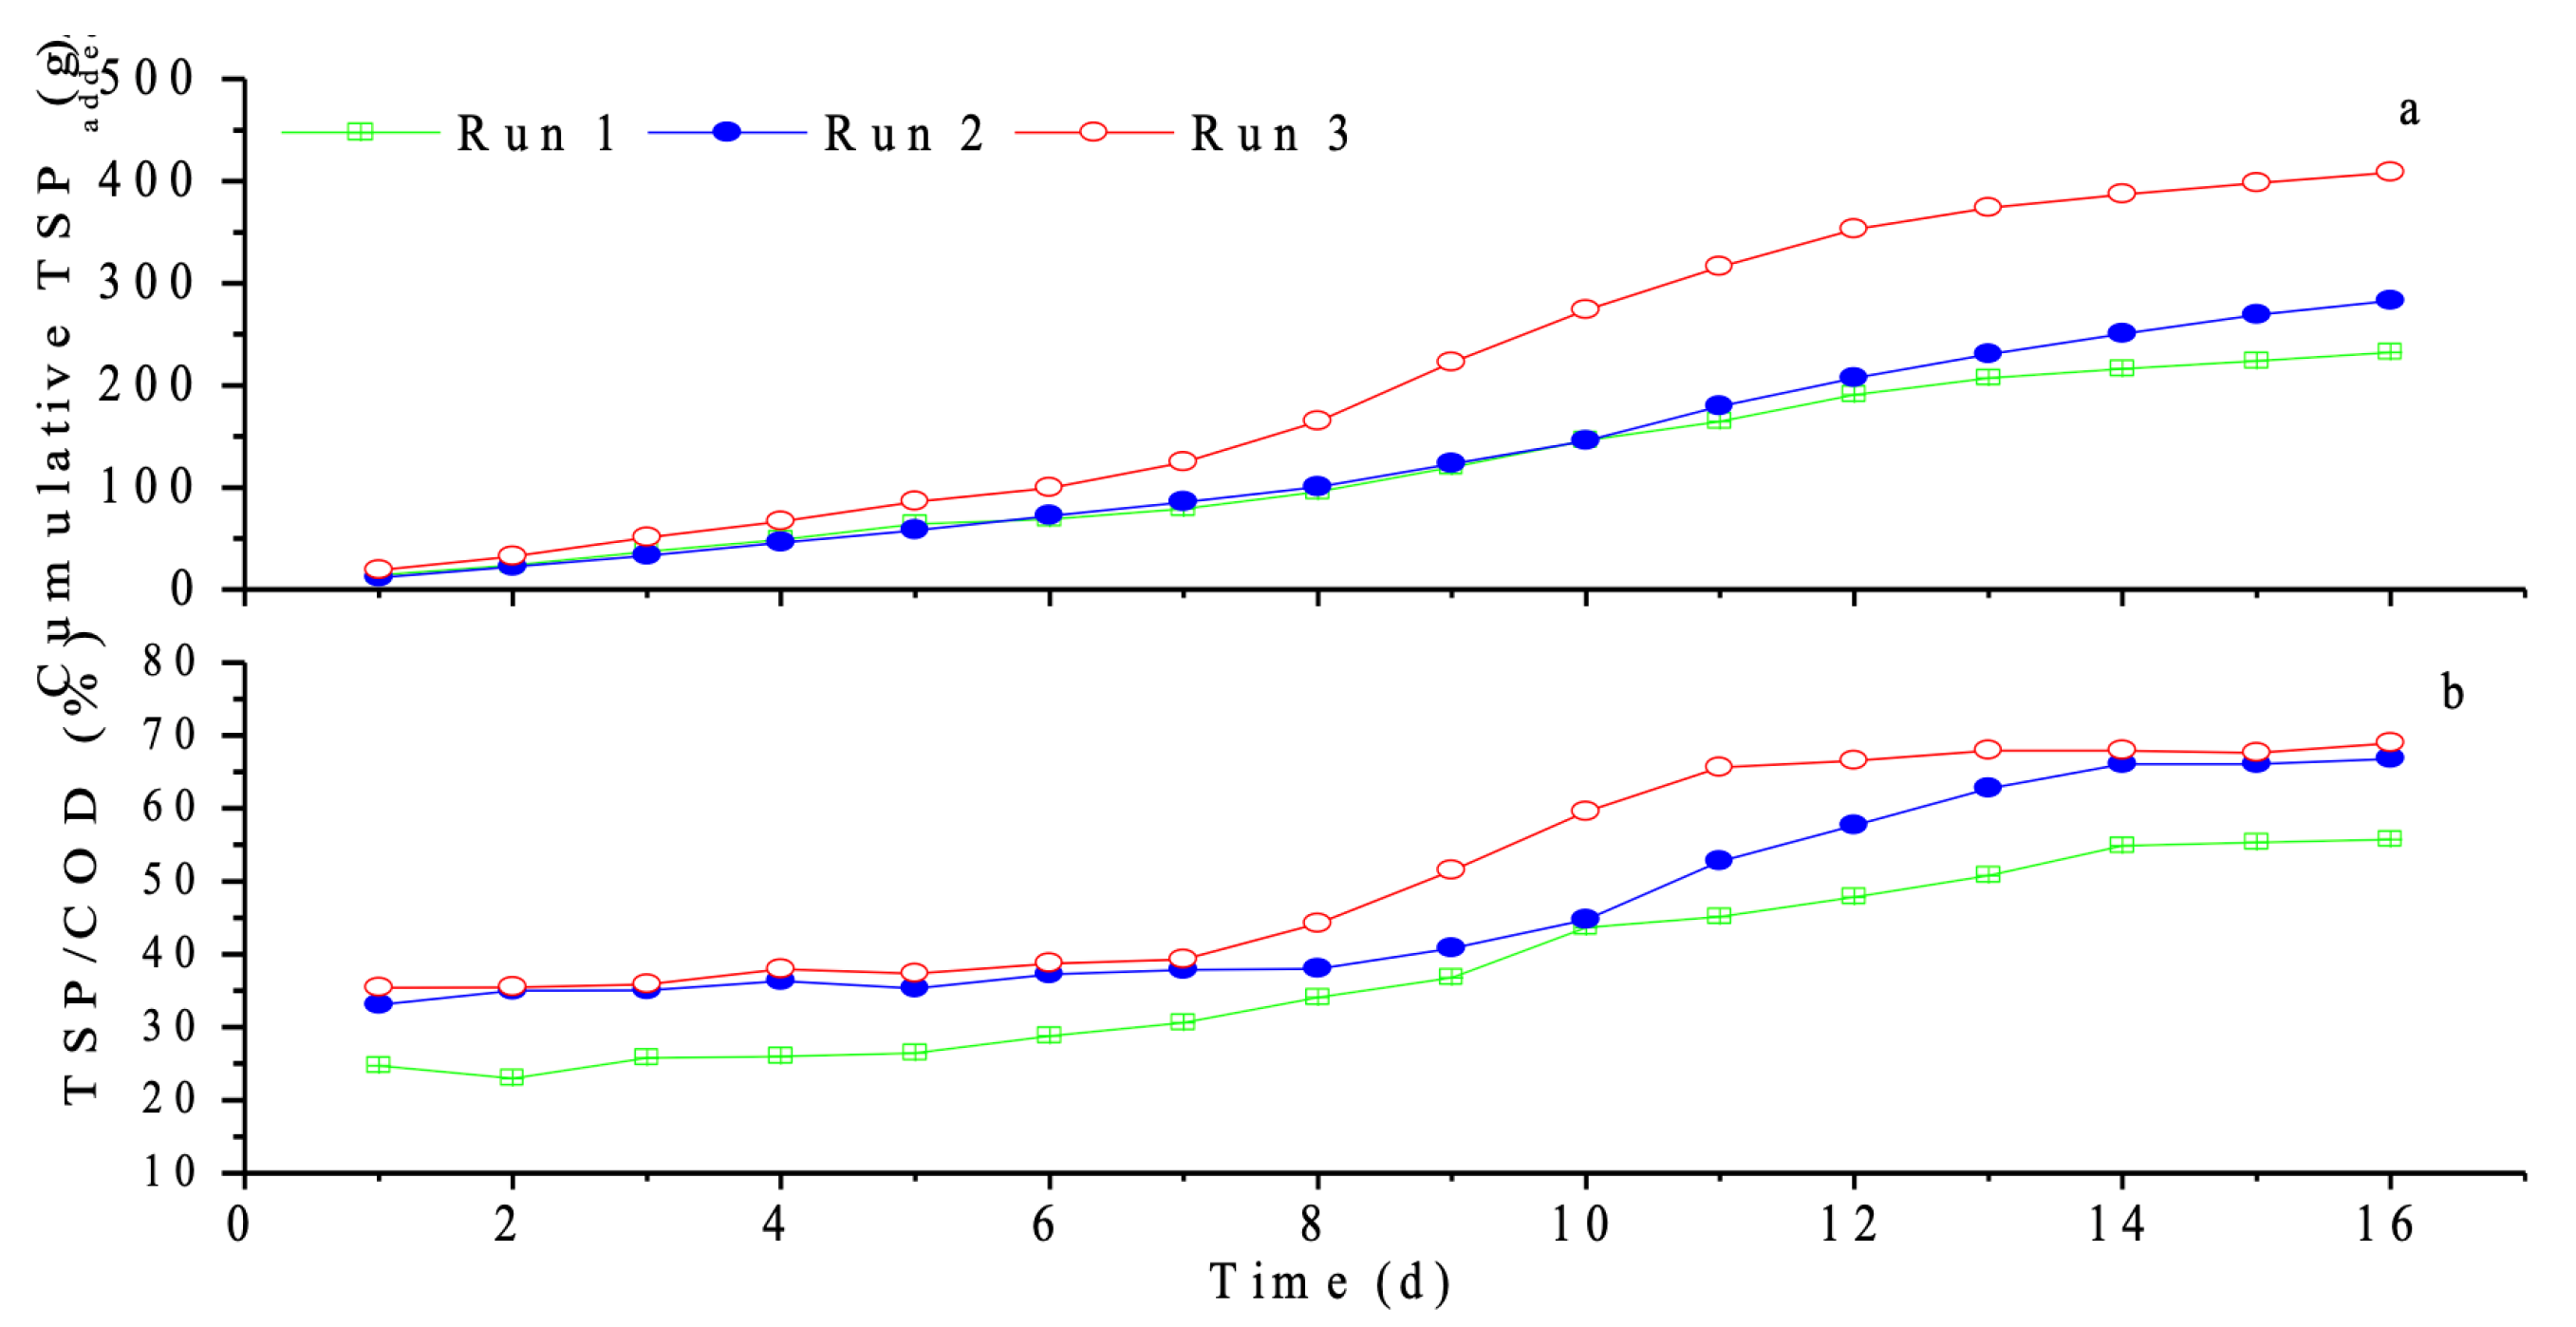
3.1.2. Leaching of Total Soluble Products (TSPs)

The concentrations of cumulative TSPs (alcohols, ethanol, propanol, and butanol; volatile fatty acids, acetic acid, propionic acid, iso-butyric acid, butyric acid, iso-valeric acid, valeric acid, and caproic acid) of the three runs are presented in Figure 3a. Similarly to cumulative COD production (Figure 2b), there were obvious differences among TSP values. TSP production peaked slightly later than COD production, indicating that TSP formation depends on soluble COD availability. Raw cow manure was directly inoculated to food waste in Run-1 and resulted in lower TSP production. Despite the abundance of microbes in cow manure, efficient hydrolytic–acidogenic microbes might be low in population and require a few days to achieve the specific proliferation of microbes. Furthermore, the storage of the cow manure could also have caused partial inactivation of the microbes that require time for activation or to be physiologically competent. Compared with Run-1, a 75.9% increase in TSPs was achieved in Run-3, which could be due to the specific enrichment of microbes during the 10-day hydrolysis–acidogenesis process in the LBR.
The TSP-to-COD ratio represents the solubilization levels of AD treating solid wastes. In all three runs, the solubilization levels increased along the experiment time. The lower TSP/COD ratio could be due to the leaching of fine particles during the first week, after which the ratio increased to a much higher level, i.e., >50%. The TSP/COD ratios increased to 50–70% during late-stage digestion as readily soluble COD declined (Figure 3b). The acidification assessment excluded several metabolites (formic acid, lactic acid, glycerol, and acetone) that may contribute to total soluble products.

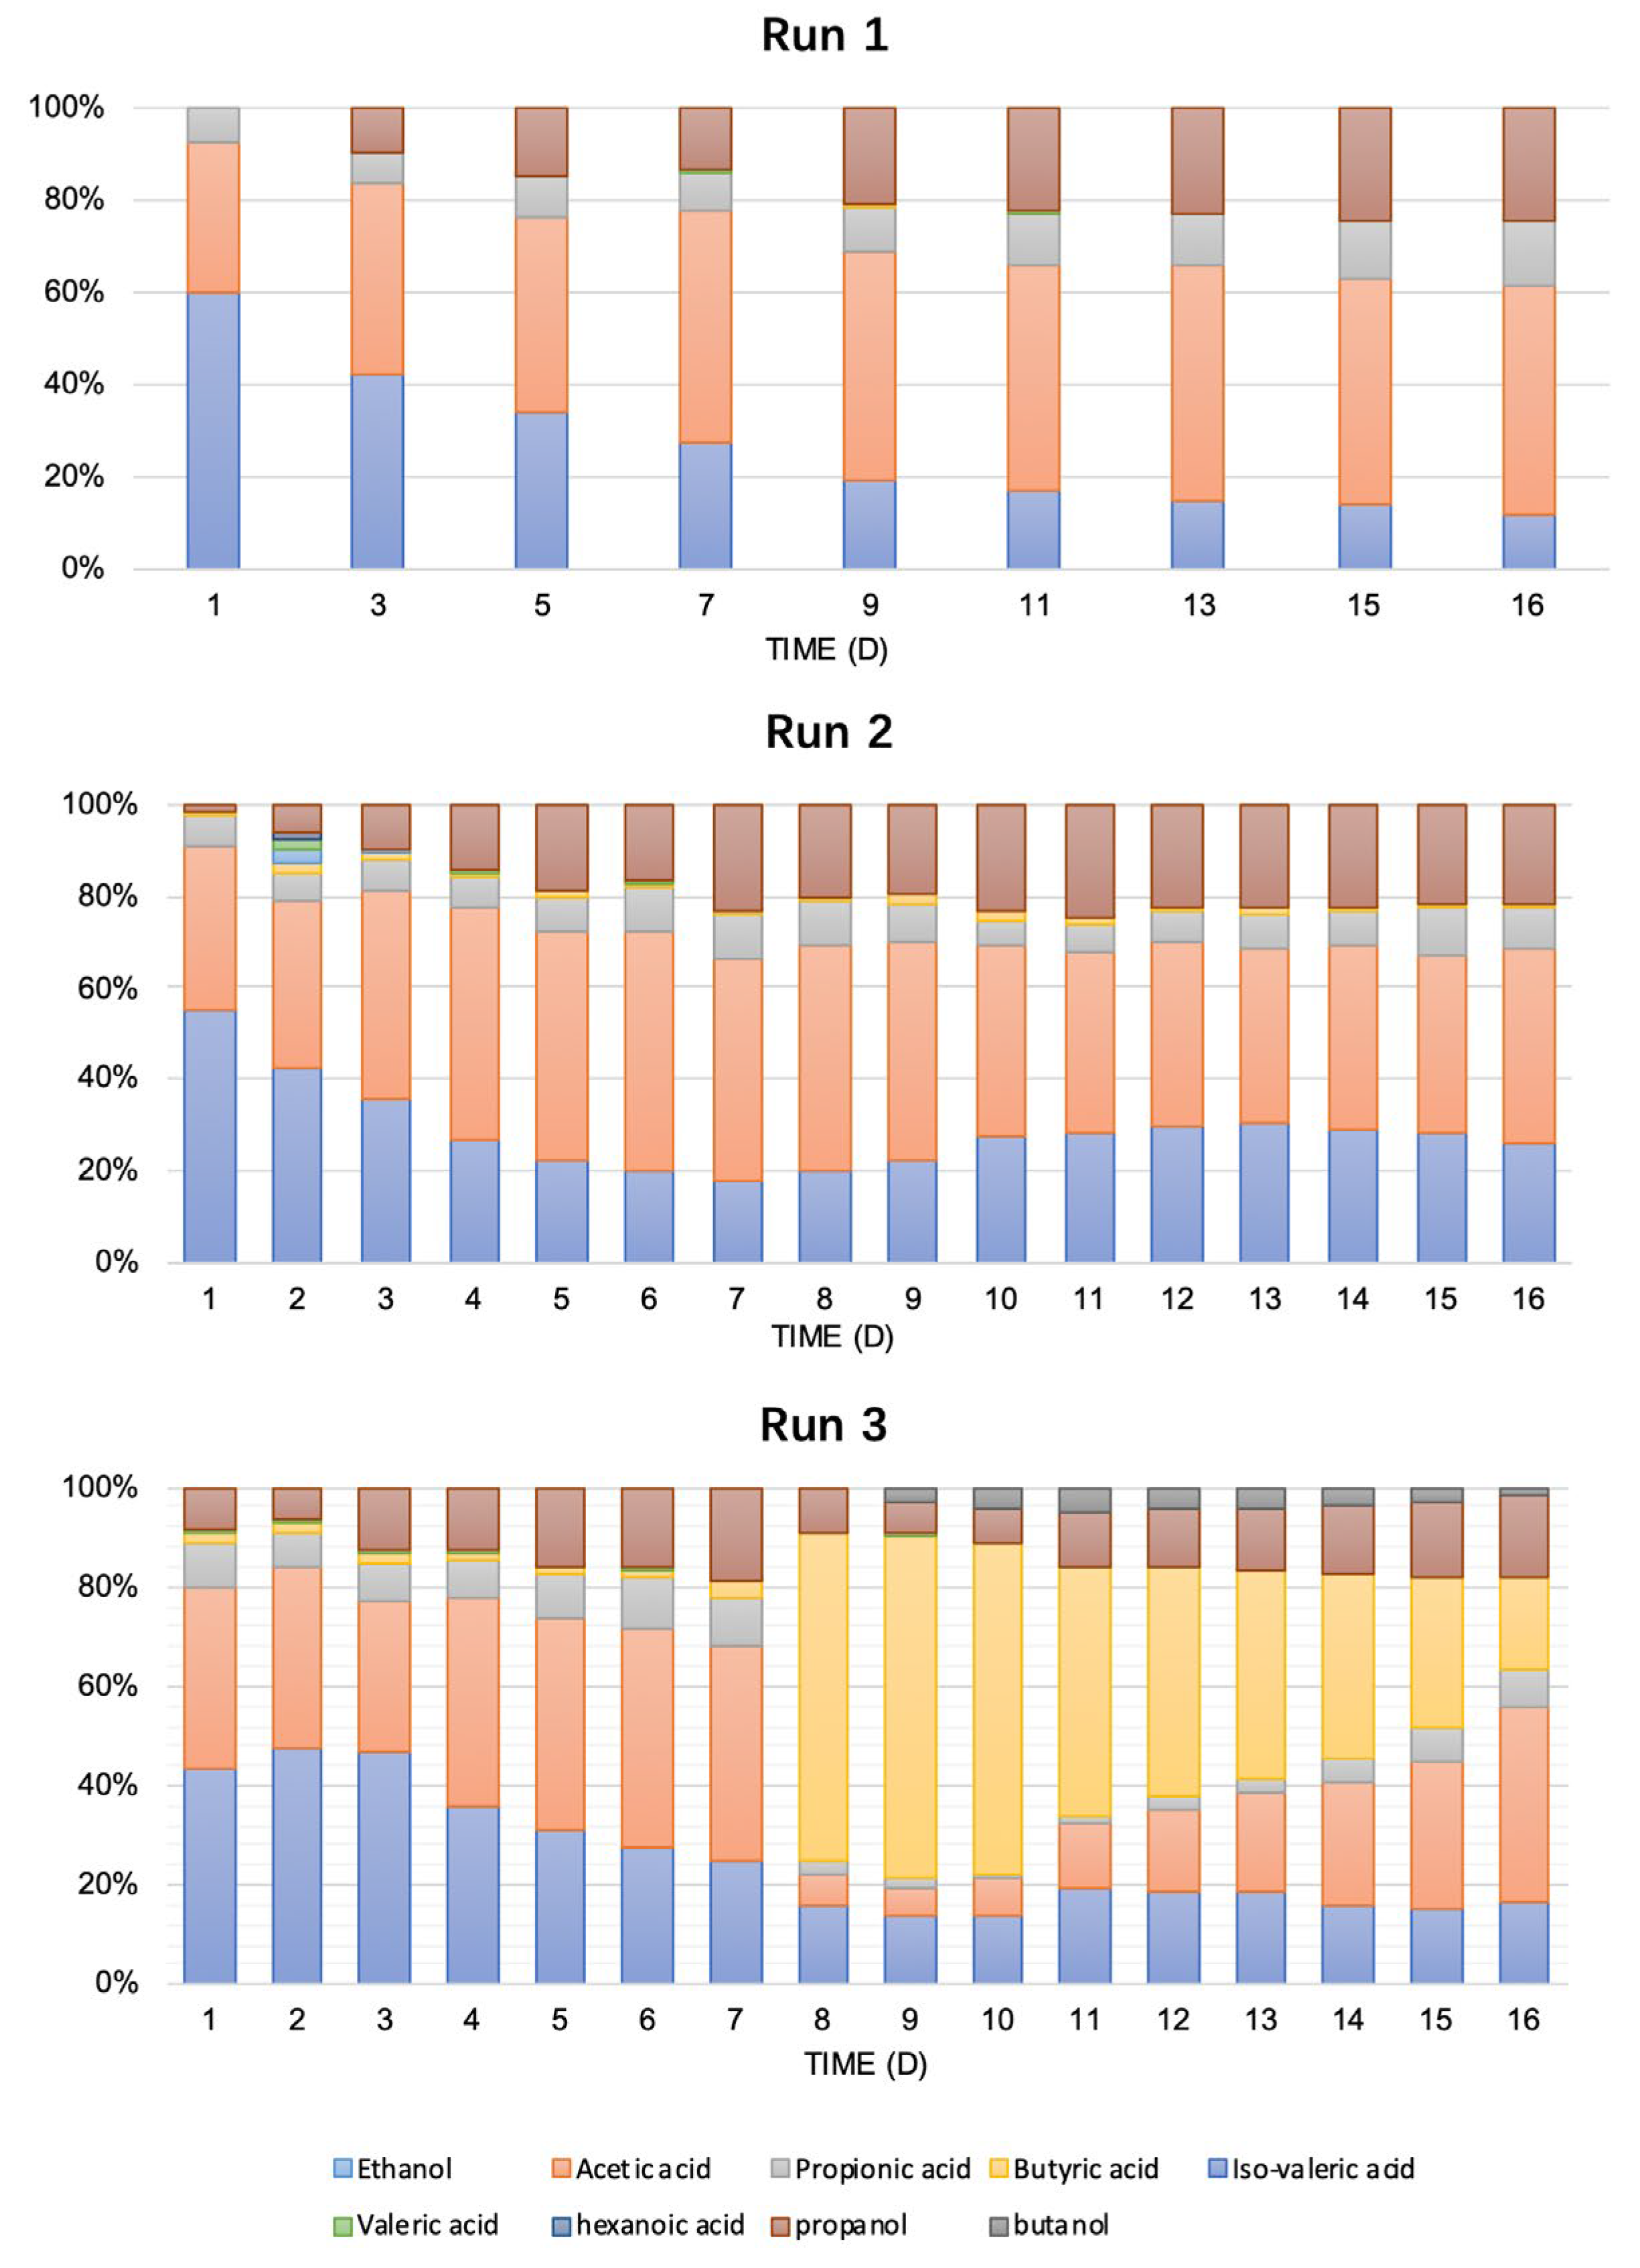
3.1.3. TSP Speciation

Interactions between microbes during the hydrolytic step of anaerobic digestion determine metabolic pathways in reactors and, consequently, the efficiency of fermentation processes. The speciation of total soluble products (Figure 4) and possible fermentation pathways were also analyzed in the three runs to explore the possible shift in pathways with acclimated microbes. Obviously, ethanol–acetate fermentation was prevalent in the first two runs throughout the operation period, whereas the dominant metabolic pathway changed to butyrate–acetate starting from day 8 in Run-3. A shift in the acidogenic metabolic pathway from ethanol–acetate to butyrate indicated the elevated function of acclimated microbes in Run-3, which is in agreement with the profiles of COD and TSP. The speciation of various components in each metabolic pathway shows the varied distributions of electron equivalents. Acetate formation is the favored pathway for acidogenic microbes during production from acetyl-CoA and led to reduced soluble product or H2 with simultaneous NADH generation [22]. Acetyl-CoA is pivoted to both ethanol and butyrate production with the consumption of NADH and thus reduces H2 production. It was reported that the acetate–butyrate pathway fermentation exhibited a higher biohydrogen yield than the acetate–ethanol pathway, which would be more favorable for subsequent methanogenesis [21,22].
Soluble nitrogen release in the reactor primarily occurred during protein degradation. Figure 5a,b illustrate the TN and NH4+-N concentration variations across the three experimental runs. Both parameters reached peak concentrations within the first 3 days, attributed to the rapid leaching of readily degradable proteinaceous compounds. This observation aligns with Alvarado et al.’s findings that easily degradable proteinaceous components in food waste are converted to organic nitrogen and readily solubilized during early hydrolysis phases. Following the initial peaks, the TN and NH4+-N concentrations gradually declined in Run-3 throughout the experimental period, while secondary peaks emerged on days 14 and 10 in Run-1 and Run-2, respectively. These secondary peaks can be attributed to enhanced protein degradation capacity resulting from microbial consortium enrichment. However, continuous dilution and increasing carbohydrate concentrations subsequently inhibited protein degradation [23]. The final TN and NH4+-N concentrations were 303.4 and 40.2 mg/L (Run-1), 251.5 and 24.2 mg/L (Run-2), and 168.0 and 22.9 mg/L (Run-3), respectively. The NH4+-N and TKN leaching profiles confirmed the superior protein degradation performance of the enriched microbial consortium.

3.2. Kinetic Analysis

First-order kinetics described COD production well in all runs (R2 > 0.99, Table 2), confirming effective food waste degradation rate analysis. Run-3 exhibited the highest conversion coefficient (0.56) compared to 0.30 and 0.36 for Run-1 and Run-2, respectively. After a period of specific enrichment, the hydrolysis rate of food waste regarding COD production of Run-3 was significantly increased (p < 0.05), which indicated that the activation of inoculating microbes and the newly grown bacteria were very effective in hydrolyzing carbohydrates. The same kinetic model was applied to analyze the degradation of proteins. Kinetic constant values of 0.40, 0.43, and 0.46 were observed in Run-1, Run-2, and Run-3, respectively. The kinetic constant in Run-3 was clearly much higher than that obtained when using Acetobacterium woodii plus heat-treated sludge as an inoculum in an acidogenic reactor (ref: a novel way to utilize hydrogen and carbon dioxide in an acidogenic reactor through homoacetogenesis). The degradation rate of protein was not as high as that of COD in Run-3, while higher protein degradation rates relative to those of COD in Run-1 and Run-2 were achieved. A possible explanation is that the hydrolysis of protein was rate-limited in an acidic environment [11] and the protein degradation abilities of the inocula were not highly improved by serial enrichment.

3.3. Bacterial Diversity of Enriched Consortium

In consideration of the fast hydrolysis rate at day 5 and the high adaptation of the bacteria community to the acidic condition, a dedicated enrichment of microorganisms from cow manure was carried out in batches. At four sampling points (days 1, 5, 10, and 16) of each run, the samples were analyzed for bacterial diversity. The bacterial community in the three runs mainly consisted of three phylotypes belonging to Firmicutes, Proteobacteria, and Actinobacteria (Figure 6 and Table 3). Most of the bacteria in the samples belonged to Firmicutes, except for small fractions of Proteobacteria and Actinobacteria. At the beginning of the enrichment process (Figure 6), the bacterial community consisted of Proteobacteria, Actinobacteria, and Firmicutes. Phylotypes that had high similarity to Weissella cibaria, Clostridium tyrobutyricum, Streptomyces sp., Clostridium sporogenes, and Bifidobacterium thermacidophilum were the most abundant. The bacteria community compositions on day 10 of Run-1 (Figure 6) were different from those on day 5, which mainly comprised Uncultured bacterium (intensity of 30.9%) and Bifidobacterium thermacidophilum (intensity of 43.2%). It is clear that the bacteria community on day 5 and day 10 of Run-1 differed greatly, with more diverse species on day 5, while more intensified and highly adopted species appeared on day 10 [24].
Bacterial community structure and composition underwent significant changes during enrichment, with Pearson correlation coefficients below 0.1 between days 5 and 10 in both Run-1 and Run-2 (Figure 6). In particular, Weissella cibaria (band 5) and Streptomyces sp. initially occurring in the microbial consortium became undetectable at day 5 of Run-2, whereas Lactobacillus jensenii was dominantly enriched at the same time (Figure 6, Table 3). Further enrichment on day 10 induced much evidenced changes in the structure and composition of the microbial community, as shown in Figure 6. On day 10, two species were further intensified, namely Clostridium tyrobutyricum (from 5.8% to 20.1%) and Lactobacillus jensenii (from 5.8% to 14.1%), Streptomyces sp. (band 12) disappeared, and two new species emerged at the end of the enrichment of Run-3, namely Clostridium sporogenes and Lactobacillus casei.
The functional prediction of major bacteria sourcing from three runs was performed. The results show significant variations in gene copy numbers among different bacteria in different pathways (Figure 6a). The changes in gene copy numbers were closely related to their corresponding functions [25]. We compared the gene copy numbers of bacteria present in different reactors in their respective metabolic pathways. To understand the strong hydrolytic capacity of Run-3, we focused on bacterial species that exhibited differences compared to Run-1 and Run-2. Among them, Weissella cibaria (5) and Escherichia coli (6) were absent in Run-3. Weissella cibaria exhibited higher gene abundances in fatty acid pathways, while E. coli showed elevated levels in carbohydrate and amino sugar metabolism genes. This indicates the role of these pathways in the differences between Run-1/Run-2 and Run-3. Two species of Lactobacillus, Lactobacillus rhamnosus (7) and Lactococcus lactis (10), were only identified in Run-3. Both species showed significantly higher gene copy numbers in various pathways, indicating their strong capabilities in carbohydrate, fatty acid, carbon, and nitrogen metabolism. It was reported that Lactobacillus rhamnosus and Lactococcus lactis could be used to improve lactic acid production and achieve strong hydrolysis [26,27,28]. Calculating the average values revealed that the gene copy numbers for pyruvate synthesis and fatty acid synthesis and metabolism pathways were higher in all bacterial species in Run-3 compared to the other runs (Figure 6b). Therefore, the purification capacity of the bacterial species in Run-3 may be enhanced through stronger pyruvate synthesis and fatty acid synthesis and metabolism pathways. Additionally, Lactobacillus rhamnosus (7) and Lactococcus lactis (10) may play crucial roles. However, apart from the combination of species, the abundance of different bacteria and gene expression also has an impact on the results; thus, further research is needed to determine the corresponding molecular mechanisms.
As revealed above, the species enrichment of the bacteria community (day 5) in Run-2 was intensified but with reduced diversity, and both the intensity and diversity were enriched on day 10 along with high degradation ability and acidic tolerance (Run-3). This strongly suggests that the increased hydrolysis rate in Run-3 throughout the experiment was mainly due to the adaptation of the bacterial community.
A functional gene analysis indicated that pyruvate metabolism and fatty acid synthesis pathways were significantly upregulated in Run-3 compared to Run-1 and Run-2 (Figure 6a). These pathways play critical roles in anaerobic hydrolysis and acidogenesis, where complex organic substrates such as carbohydrates and proteins are broken down into simpler compounds like pyruvate, which then enter various fermentation pathways. Genes related to pyruvate metabolism, including those involved in pyruvate dehydrogenase and acetyl-CoA synthesis, were highly expressed in Run-3. Pyruvate serves as a key intermediate that can be further converted into various fermentation products, including volatile fatty acids (VFAs) such as acetate and butyrate, which are essential for biogas production in the subsequent methanogenic phase [21]. The upregulation of genes involved in fatty acid biosynthesis further suggests that the microbial community in Run-3 had an enhanced capacity for converting pyruvate into fatty acids, supporting higher rates of hydrolysis and acidogenesis. The dominance of butyrate–acetate fermentation in Run-3, as shown by the VFA profile, is consistent with the higher expression of genes in the fatty acid synthesis pathway, which is known to drive more efficient hydrolysis and acid production [22].
It is important to note that the functional gene analysis conducted in this study relied on predictive methods, specifically the quantification of gene copy numbers associated with key metabolic pathways. While this approach offers insights into the potential presence and abundance of functional genes, it does not directly measure gene expression or the corresponding enzymatic activity. As such, variations in gene copy numbers may not always reflect actual metabolic activity or pathway utilization. Future research combining gene copy number data with direct measurements of gene expression or proteomic analyses would provide a more comprehensive understanding of microbial metabolism and pathway dynamics in the reactor system.
The microbial enrichment strategy demonstrated in this study showed promising potential in enhancing food waste hydrolysis in laboratory-scale reactors. However, its use in full-scale applications presents several challenges. Maintaining optimal conditions for microbial enrichment, including temperature, pH, and substrate composition, could be difficult in larger reactors. Additionally, the time required for microbial acclimation and the ability to sustain microbial activity over extended periods could pose operational hurdles. From an economic perspective, while microbial enrichment may increase operational costs, it could result in significant improvements in hydrolysis efficiency and overall process performance, potentially reducing the need for costly additives or extended retention times. Further research, including pilot-scale trials, is crucial to assess the economic feasibility and long-term stability of this approach in large-scale food waste treatment systems.

4. Conclusions

An anaerobic consortium at specific sampling points (fast hydrolysis rate, day 5; highly adopted point, day 10) of the hydrolytic–acidogenic process was applied to enhance the hydrolysis of food waste in an LBR. An anaerobic consortium capable of effectively hydrolyzing food waste was obtained with the enrichment of the microbial community on day 10. This community was composed of bacteria with the abilities to perform high fermentation and adapt to acidic environments. Significantly improved performance regarding the COD, TSP, and NH4+-N leaching confirmed the activity of the enriched microbes in Run-3. These results support the implementation of enriched microbial consortia as an effective approach for improving food waste hydrolysis performance.

Author Contributions

Conceptualization, L.Z.; methodology, L.Z., and Y.L.; validation, Y.Z., X.Y., and L.Z.; formal analysis, X.Y.; writing—original draft preparation, L.Z.; writing—review and editing, K.F.; supervision, B.Y., and K.F.; funding acquisition, L.Z., and Y.L. All authors have read and agreed to the published version of the manuscript.

Funding

This work was supported by the Natural Science Foundation of Guangdong Province (2020A1515010074), the Professorial and Doctoral Scientific Research Foundation of Huizhou University (2020JB030), the National College Students’ innovation and entrepreneurship training program (S202310577058), and the Huizhou Science and Technology Project (2022CQ010009).

Data Availability Statement

The data that support the findings of this study are available from the corresponding author upon reasonable request.

Acknowledgments

The authors express their gratitude to everyone who assisted them with the present study.

Conflicts of Interest

The authors declare no conflicts of interest.

References

  1. Xiao, J.; Tao, T.; Shi, Y.; Zhao, J.; Wu, B.; Tai, J.; Xu, M.; Zhang, X.; Peng, Y.; Bi, Z. Megacity’s pathway toward sustainable food waste management and its environmental performance in a developing country: Evidence from Shanghai, China. Sci. Total Environ. 2023, 892, 164706. [Google Scholar] [CrossRef]
  2. Anand, N.; Palani, S.G. A comprehensive investigation of toxicity and pollution potential of municipal solid waste landfill leachate. Sci. Total Environ. 2022, 838, 155891. [Google Scholar] [CrossRef]
  3. Hunter, S.M.; Blanco, E.; Borrion, A. Expanding the anaerobic digestion map: A review of intermediates in the digestion of food waste. Sci. Total Environ. 2020, 767, 144265. [Google Scholar] [CrossRef]
  4. Raketh, M.; Kongjan, P.; Sani, K.; Trably, E.; Cheirsilp, B.; Jariyaboon, R. Biodegradation efficiencies and economic feasibility of single-stage and two-stage anaerobic digestion of desulfated Skim Latex Serum (SLS) by using rubber wood ash. Process Saf. Environ. 2022, 162, 721–732. [Google Scholar] [CrossRef]
  5. Chen, Z.; Li, D.; Wen, Q. Investigation of hydrolysis acidification process during anaerobic treatment of coal gasification wastewater (CGW): Evolution of dissolved organic matter and biotoxicity. Sci. Total Environ. 2020, 723, 137995. [Google Scholar] [CrossRef]
  6. Chakraborty, D.; Karthikeyan, O.P.; Selvam, A.; Palani, S.G.; Ghangrekar, M.M.; Wong, J.W. Two-phase anaerobic digestion of food waste: Effect of semi-continuous feeding on acidogenesis and methane production. Bioresour. Technol. 2022, 346, 126–396. [Google Scholar] [CrossRef]
  7. Lv, Y.; Chang, N.; Li, Y.; Liu, J. Anaerobic co-digestion of food waste with municipal solid waste leachate: A review and prospective application with more benefits. Resour. Conserv. Recycl. 2021, 174, 105832. [Google Scholar] [CrossRef]
  8. Jiang, M.; Qiao, W.; Wang, Y.; Zou, T.; Lin, M.; Dong, R. Balancing acidogenesis and methanogenesis metabolism in thermophilic anaerobic digestion of food waste under a high loading rate. Sci. Total Environ. 2022, 824, 153867. [Google Scholar] [CrossRef]
  9. Qi, C.; Zhang, Y.; Jia, S.; Wang, R.; Han, Y.; Luo, W.; Li, G.; Li, Y. Effects of digestion duration on energy efficiency, compost quality, and carbon flow during solid state anaerobic digestion and composting hybrid process. Sci. Total Environ. 2022, 811, 151363. [Google Scholar] [CrossRef]
  10. Radadiya, P.; Lee, J.; Venkateshwaran, K.; Benn, N.; Lee, H.-S.; Hussain, A. Acidogenic fermentation of food waste in a leachate bed reactor (LBR) at high volumetric organic Loading: Effect of granular activated carbon (GAC) and sequential enrichment of inoculum. Bioresour. Technol. 2022, 361, 127705. [Google Scholar] [CrossRef]
  11. Rocamora, I.; Wagland, S.T.; Villa, R.; Simpson, E.D.; Fernández, O.; Bajón-Fernández, Y. Dry anaerobic digestion of organic waste: A review of operational parameters and their impact on process performance. Bioresour. Technol. 2020, 299, 122681. [Google Scholar] [CrossRef]
  12. Jeong, K.; Abbas, A.; Shin, J.; Son, M.; Kim, Y.M.; Cho, K.H. Prediction of biogas production in anaerobic co-digestion of organic wastes using deep learning models. Water Res. 2021, 205, 117697. [Google Scholar] [CrossRef]
  13. Ruas, G.; López-Serna, R.; Scarcelli, P.G.; Serejo, M.L.; Boncz, M.Á.; Muñoz, R. Influence of the hydraulic retention time on the removal of emerging contaminants in an anoxic-aerobic algal-bacterial photobioreactor coupled with anaerobic digestion. Sci. Total Environ. 2022, 827, 154262. [Google Scholar] [CrossRef]
  14. Fu, S.F.; Liu, R.; Sun, W.X.; Zhu, R.; Zou, H.; Zheng, Y.; Wang, Z.-Y. Enhancing energy recovery from corn straw via two-stage anaerobic digestion with stepwise microaerobic hydrogen fermentation and methanogenesis. J. Clean. Prod. 2020, 247, 119651. [Google Scholar] [CrossRef]
  15. Selvam, A.; Xu, S.Y.; Gu, X.Y.; Wong, J.W.C. Food waste decomposition in leachbed reactor: Role of neutralizing solutions on the leachate quality. Bioresour. Technol. 2010, 101, 1707–1714. [Google Scholar] [CrossRef]
  16. Zhou, H.; Jiang, J.; Zhao, Q.; Wang, Z.; Li, L.; Gao, Q.; Wang, K. Performance of high solids enzymatic hydrolysis and bioethanol fermentation of food waste under the regulation of saponin. Bioresour. Technol. 2023, 387, 129486. [Google Scholar] [CrossRef]
  17. Wimmer, B.H.; Moraïs, S.; Zalk, R.; Mizrahi, I.; Medalia, O. Phylogenetic diversity of core rumen microbiota as described by cryo-ET. microLife 2023, 4, uqad010. [Google Scholar] [CrossRef]
  18. Nelson, D.W.; Sommers, L.E. Total Carbon, Organic Carbon, and Organic Matter. In Methods of Soil Analysis; Part 2; Page, A.L., Miller, R.H., Keeney, D.R., Eds.; American Society of Agronomy: Madison, WI, USA, 1982; pp. 539–580. [Google Scholar]
  19. APHA. Standard Methods for the Examination of Water and Wastewater, 21st ed.; American Public Health Association: Washington, DC, USA; American Water Works Association an Water Environment Federation: Denver, CO, USA, 2005. [Google Scholar]
  20. Vavilin, V.A.; Fernandez, B.; Palatsi, J.; Flotats, X. Hydrolysis kinetics in anaerobic degradation of particulate organic material: An overview. Waste Manag. 2008, 28, 939–951. [Google Scholar] [CrossRef]
  21. Taheri, E.; Amin, M.M.; Pourzamani, H.; Fatehizadeh, A.; Ghasemian, M.; Bina, B. Comparison of acetate-butyrate and acetate-ethanol metabolic pathway in biohydrogen production. J. Med. Signals Sens. 2018, 8, 101–107. [Google Scholar]
  22. Yan, B.H.; Selvam, A.; Wong, J.W. Application of rumen microbes to enhance food waste hydrolysis in acidogenic leach-bed reactors. Bioresour. Technol. 2014, 168, 64–71. [Google Scholar] [CrossRef]
  23. Perman, E.; Schnürer, A.; Björn, A. Serial anaerobic digestion improves protein degradation and biogas production from mixed food waste. Biomass Bioenerg. 2022, 161, 106478. [Google Scholar] [CrossRef]
  24. Dong, X.; Xin, Y.; Jian, W.; Liu, X.; Ling, D. Bifidobacterium thermacidophilum sp. nov., isolated from an anaerobic digester. Int. J. Syst. Evol. Microbiol. 2000, 50, 119–125. [Google Scholar] [CrossRef] [PubMed]
  25. Provorov, N.A.; Andronov, E.E.; Kimeklis, A.K.; Onishchuk, O.P.; Igolkina, A.A.; Karasev, E.S. Microevolution, speciation and macroevolution in rhizobia: Genomic mechanisms and selective patterns. Front. Plant Sci. 2022, 13, 1026943. [Google Scholar] [CrossRef] [PubMed]
  26. Veiga, P.; Bulbarela-Sampieri, C.; Furlan, S.; Maisons, A.; Chapot-Chartier, M.-P.; Erkelenz, M.; Mervelet, P.; Noirot, P.; Frees, D.; Kuipers, O.P. SpxB regulates O-acetylation-dependent resistance of Lactococcus lactis peptidoglycan to hydrolysis. J. Biol. Chem. 2007, 282, 19342–19354. [Google Scholar] [CrossRef]
  27. Petrov, K.; Urshev, Z.; Petrova, P. L (+)-Lactic acid production from starch by a novel amylolytic Lactococcus lactis subsp. lactis B84. Food Microbiol. 2008, 25, 550–557. [Google Scholar] [CrossRef]
  28. Huang, M.; Li, X.; Wu, Y.; Meng, X.; Tong, P.; Yuan, J.; Yang, A.; Wu, Z.; Chen, H.; Xiong, C. Potential allergenicity and hydrolysis assessment of bovine casein and β-casein by treatment with lactic acid bacteria. J. Food Biochem. 2022, 46, e14424. [Google Scholar] [CrossRef]
Figure 1. A schematic of the leach bed reactor.
Water 17 02082 g001
Figure 2. Daily COD (a) and cumulative COD (b) leaching from LBRs inoculated with different anaerobic consortia.
Water 17 02082 g002
Figure 3. Production of total soluble products (TSPs) from LBR. (a) Cumulative TSP; (b) TSP/COD ratio.
Water 17 02082 g003
Figure 4. Speciation of total soluble products in reactors: Run-1, Run-2, and Run-3. NH4+-N and TKN leaching.
Water 17 02082 g004
Figure 5. Nitrogen leaching over time: (a) NH4+-N; (b) TKN.
Water 17 02082 g005
Figure 6. The gene copy numbers of different bacterial species in different KEGG metabolic pathways across different runs. The heatmap is normalized along the x-axis. The green arrows indicate the absence of the corresponding bacteria in Run-3, while the purple arrows indicate the bacteria unique to Run-3. (a) shows the gene copy numbers of individual bacterial species. (b) shows the average gene copy numbers of bacterial species in the three runs. The bacterial species are as follows: (1) Clostridium acetobutylicum, (2) Weissella cibaria, (3) Weissella confusa, (4) unknown, (5) Weissella cibaria, (6) Clostridium acetobutylicum, (7) Lactobacillus rhamnosus, (8) unknown, (9) Clostridium tyrobutyricum, (10) Lactococcus lactis, (11) Lactobacillus jensenii, (12) Bifidobacterium thermacidophilum, (13) Clostridium sporogenes, (14) Lactobacillus casei, (15) unknown, (16) Bifidobacterium thermacidophilum, and (17) unknown.
Water 17 02082 g006
Table 1. Selected properties of food waste and inoculum.
ParameterFood WasteCow Manure
Total Solid (TS), %39.7 ± 0.0110.2 ± 0.1
Volatile Solid (VS/TS), %97.6 ± 0.189.6 ± 0.01
Total Organic Carbon (TOC), %47.0 ± 0.650.7 ± 0.01
Total Kjeldahl Nitrogen (TKN), g/kg20.0 ± 0.114.0 ± 0.01
Table 2. First-order kinetic parameters for COD and TKN production.
CODTreatmentk (d−1)SDR2
Run-10.300.0010.99
Run-20.360.0010.99
Run-30.560.0010.99
TKNRun-10.400.0010.99
Run-20.430.0020.96
Run-30.460.0020.96
Table 3. Molecular identification of bacteria with abundance >1% in reactors.
PhylotypeClosest Classified Relative (% certainty)Closest Described Bacterium
(Accession #)
Identity (%)
Firmicutes99Clostridium acetobutylicum HP7 (FM994940)96
Firmicutes100Uncultured firmicute bacterium (JF986956)97
Proteobacteria100Uncultured Novosphingobium sp. t301d499
Proteobacteria100Sphingomonas sp. AV6C (AF434172)98
Firmicutes100Weissella cibaria (AJ295989)99
Firmicutes86Clostridium acetobutylicum strain HP7(FM994940)92
Firmicutes99Lactobacillus rhamnosus strain NT10 (JN813101)91
Firmicutes100Clostridium sp. BL-22 16S (DQ196626)98
Firmicutes99Clostridium tyrobutyricum (L08062)92
Firmicutes100Lactococcus lactis (AM157424)100
Firmicutes100Lactobacillus jensenii (AF243159)99
Firmicutes99Streptomyces sp. 06-3 (AM889469)96
Firmicutes100Clostridium sporogenes strain CL2 (JF836013)97
Firmicutes100Lactobacillus casei (AJ272201)99
Firmicutes100Uncultured bacterium clone HPR122 (DQ464579)95
Actinobacteria100Bifidobacterium thermacidophilum (AY148470)100
Firmicutes99Clostridium sp. strain Z6 (AY949859)97
Disclaimer/Publisher’s Note: The statements, opinions and data contained in all publications are solely those of the individual author(s) and contributor(s) and not of MDPI and/or the editor(s). MDPI and/or the editor(s) disclaim responsibility for any injury to people or property resulting from any ideas, methods, instructions or products referred to in the content.

