
Entrance/Exit Characteristics-Driven Flood Risk Assessment of Urban Underground Garages Under Extreme Rainfall Scenarios


Abstract
1. Introduction
2. Materials and Methods
2.1. Study Area
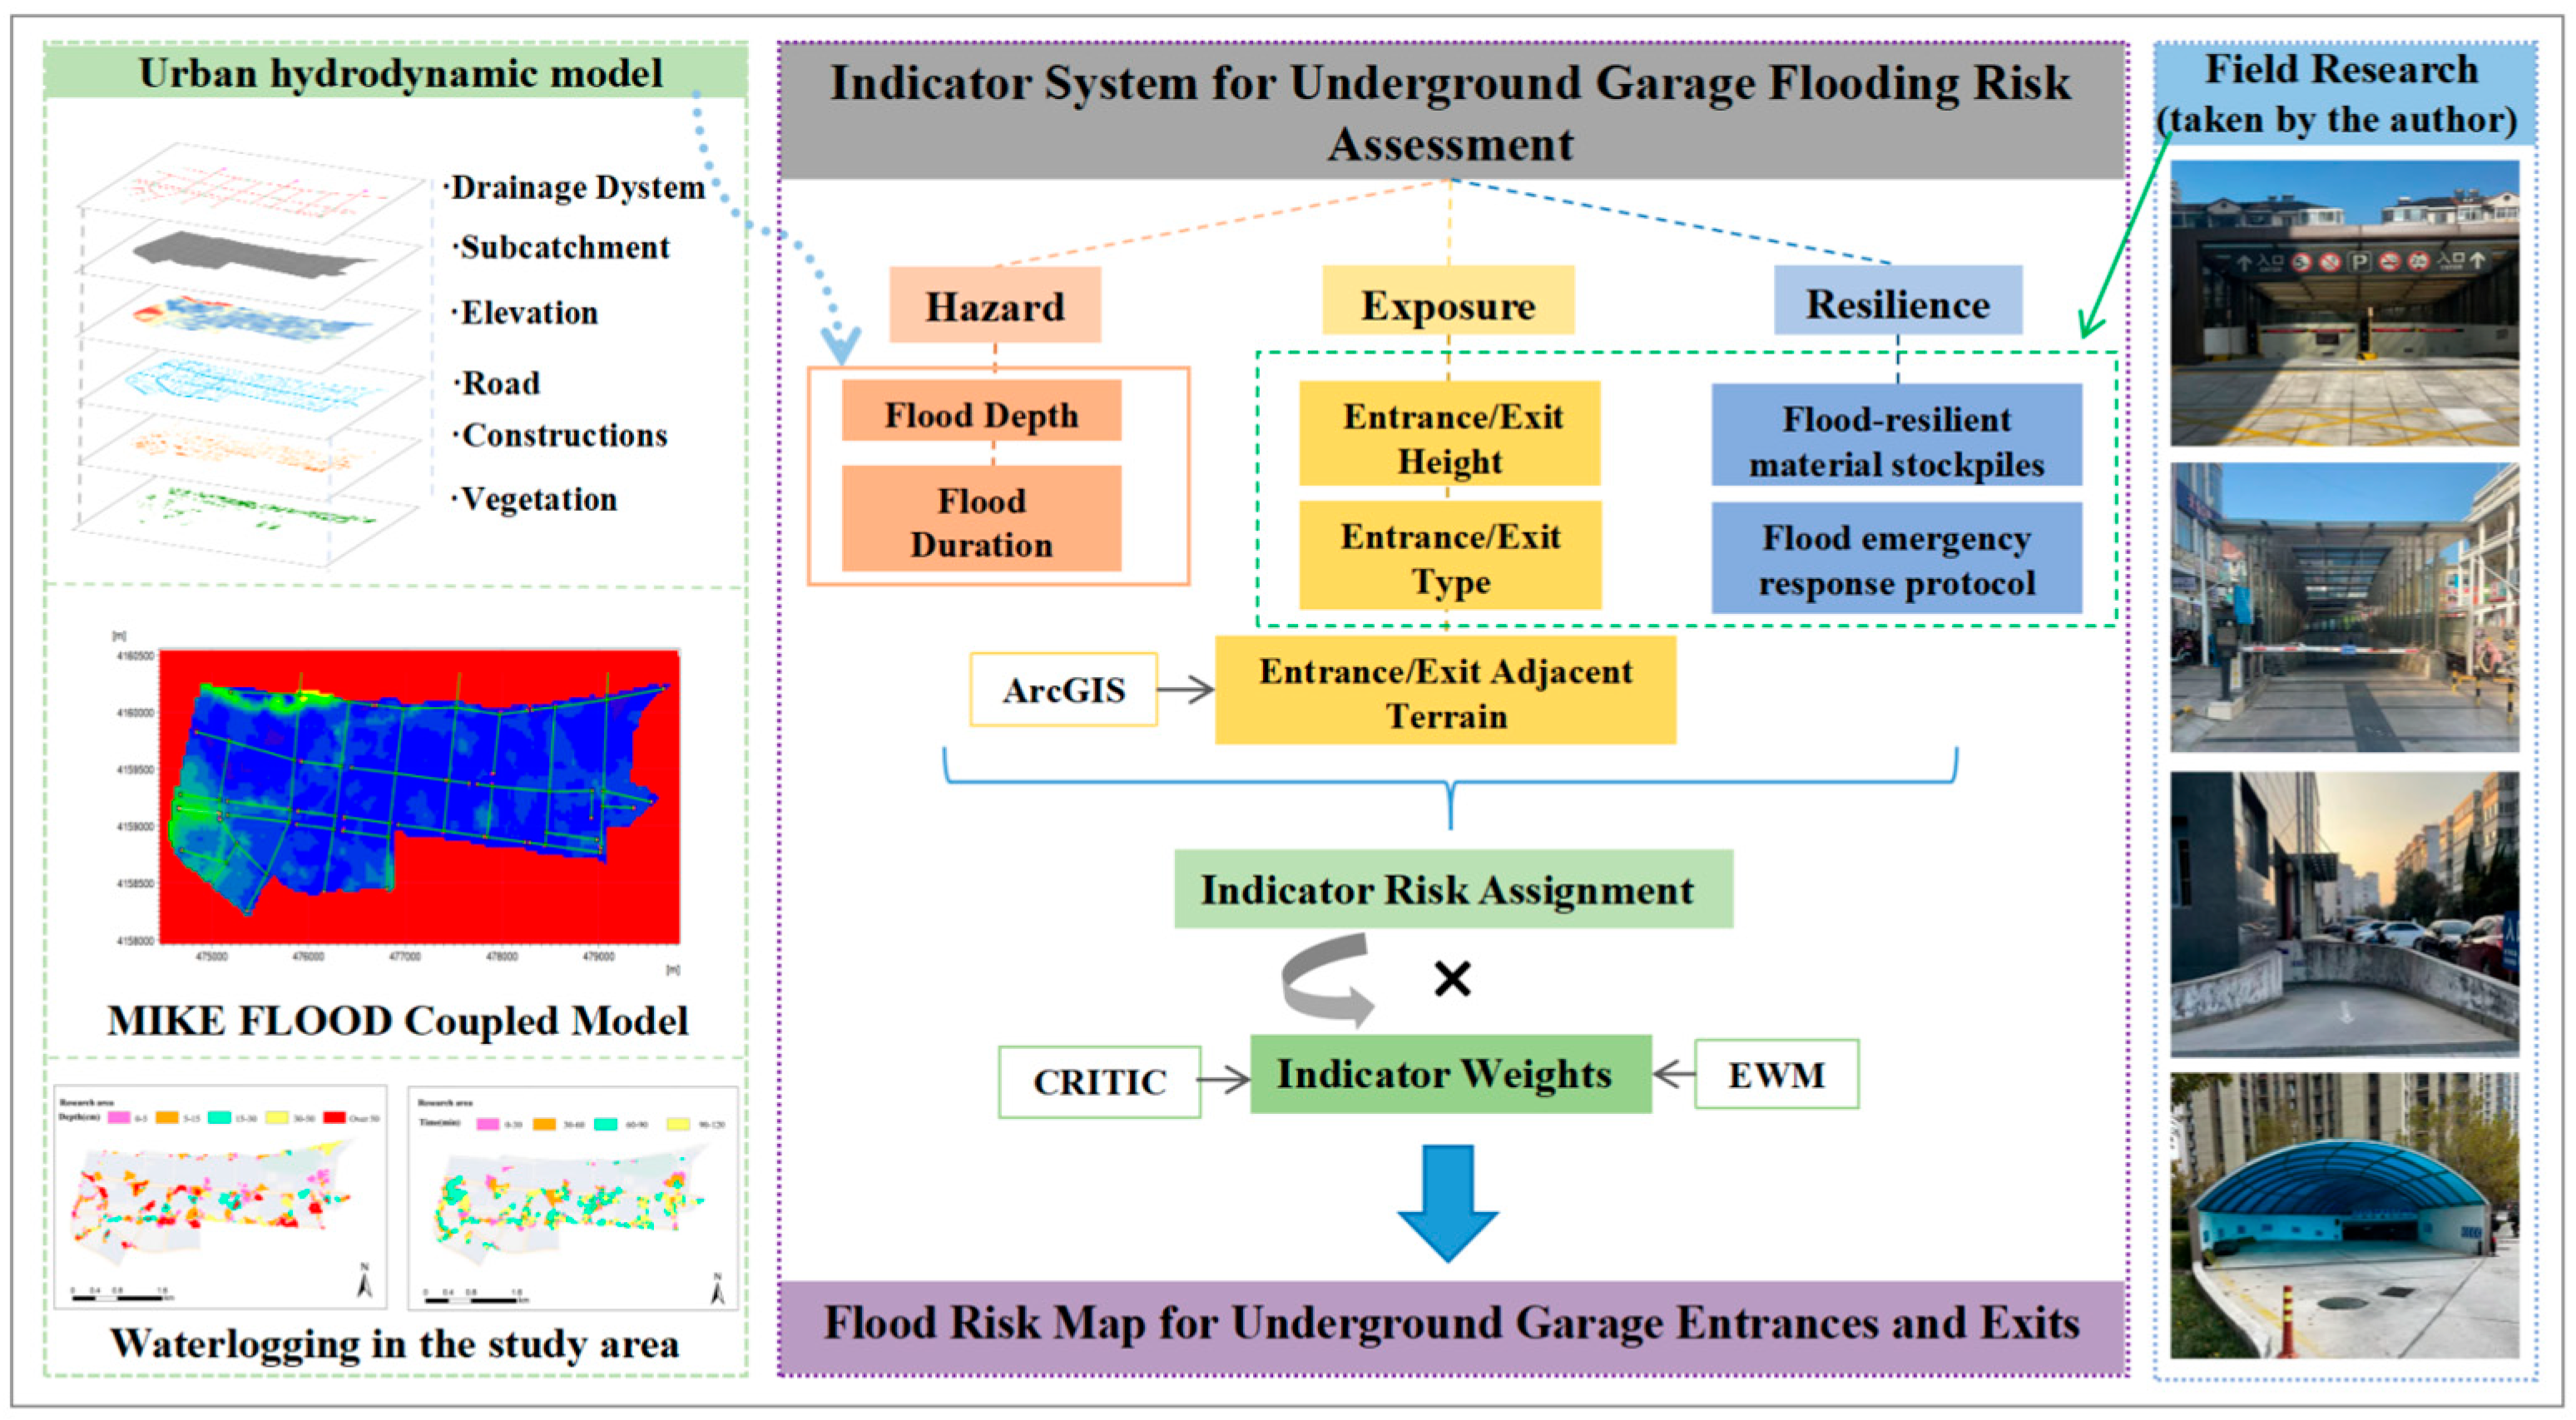
2.2. Research Framework
2.3. Construction of the Assessment Indicator System
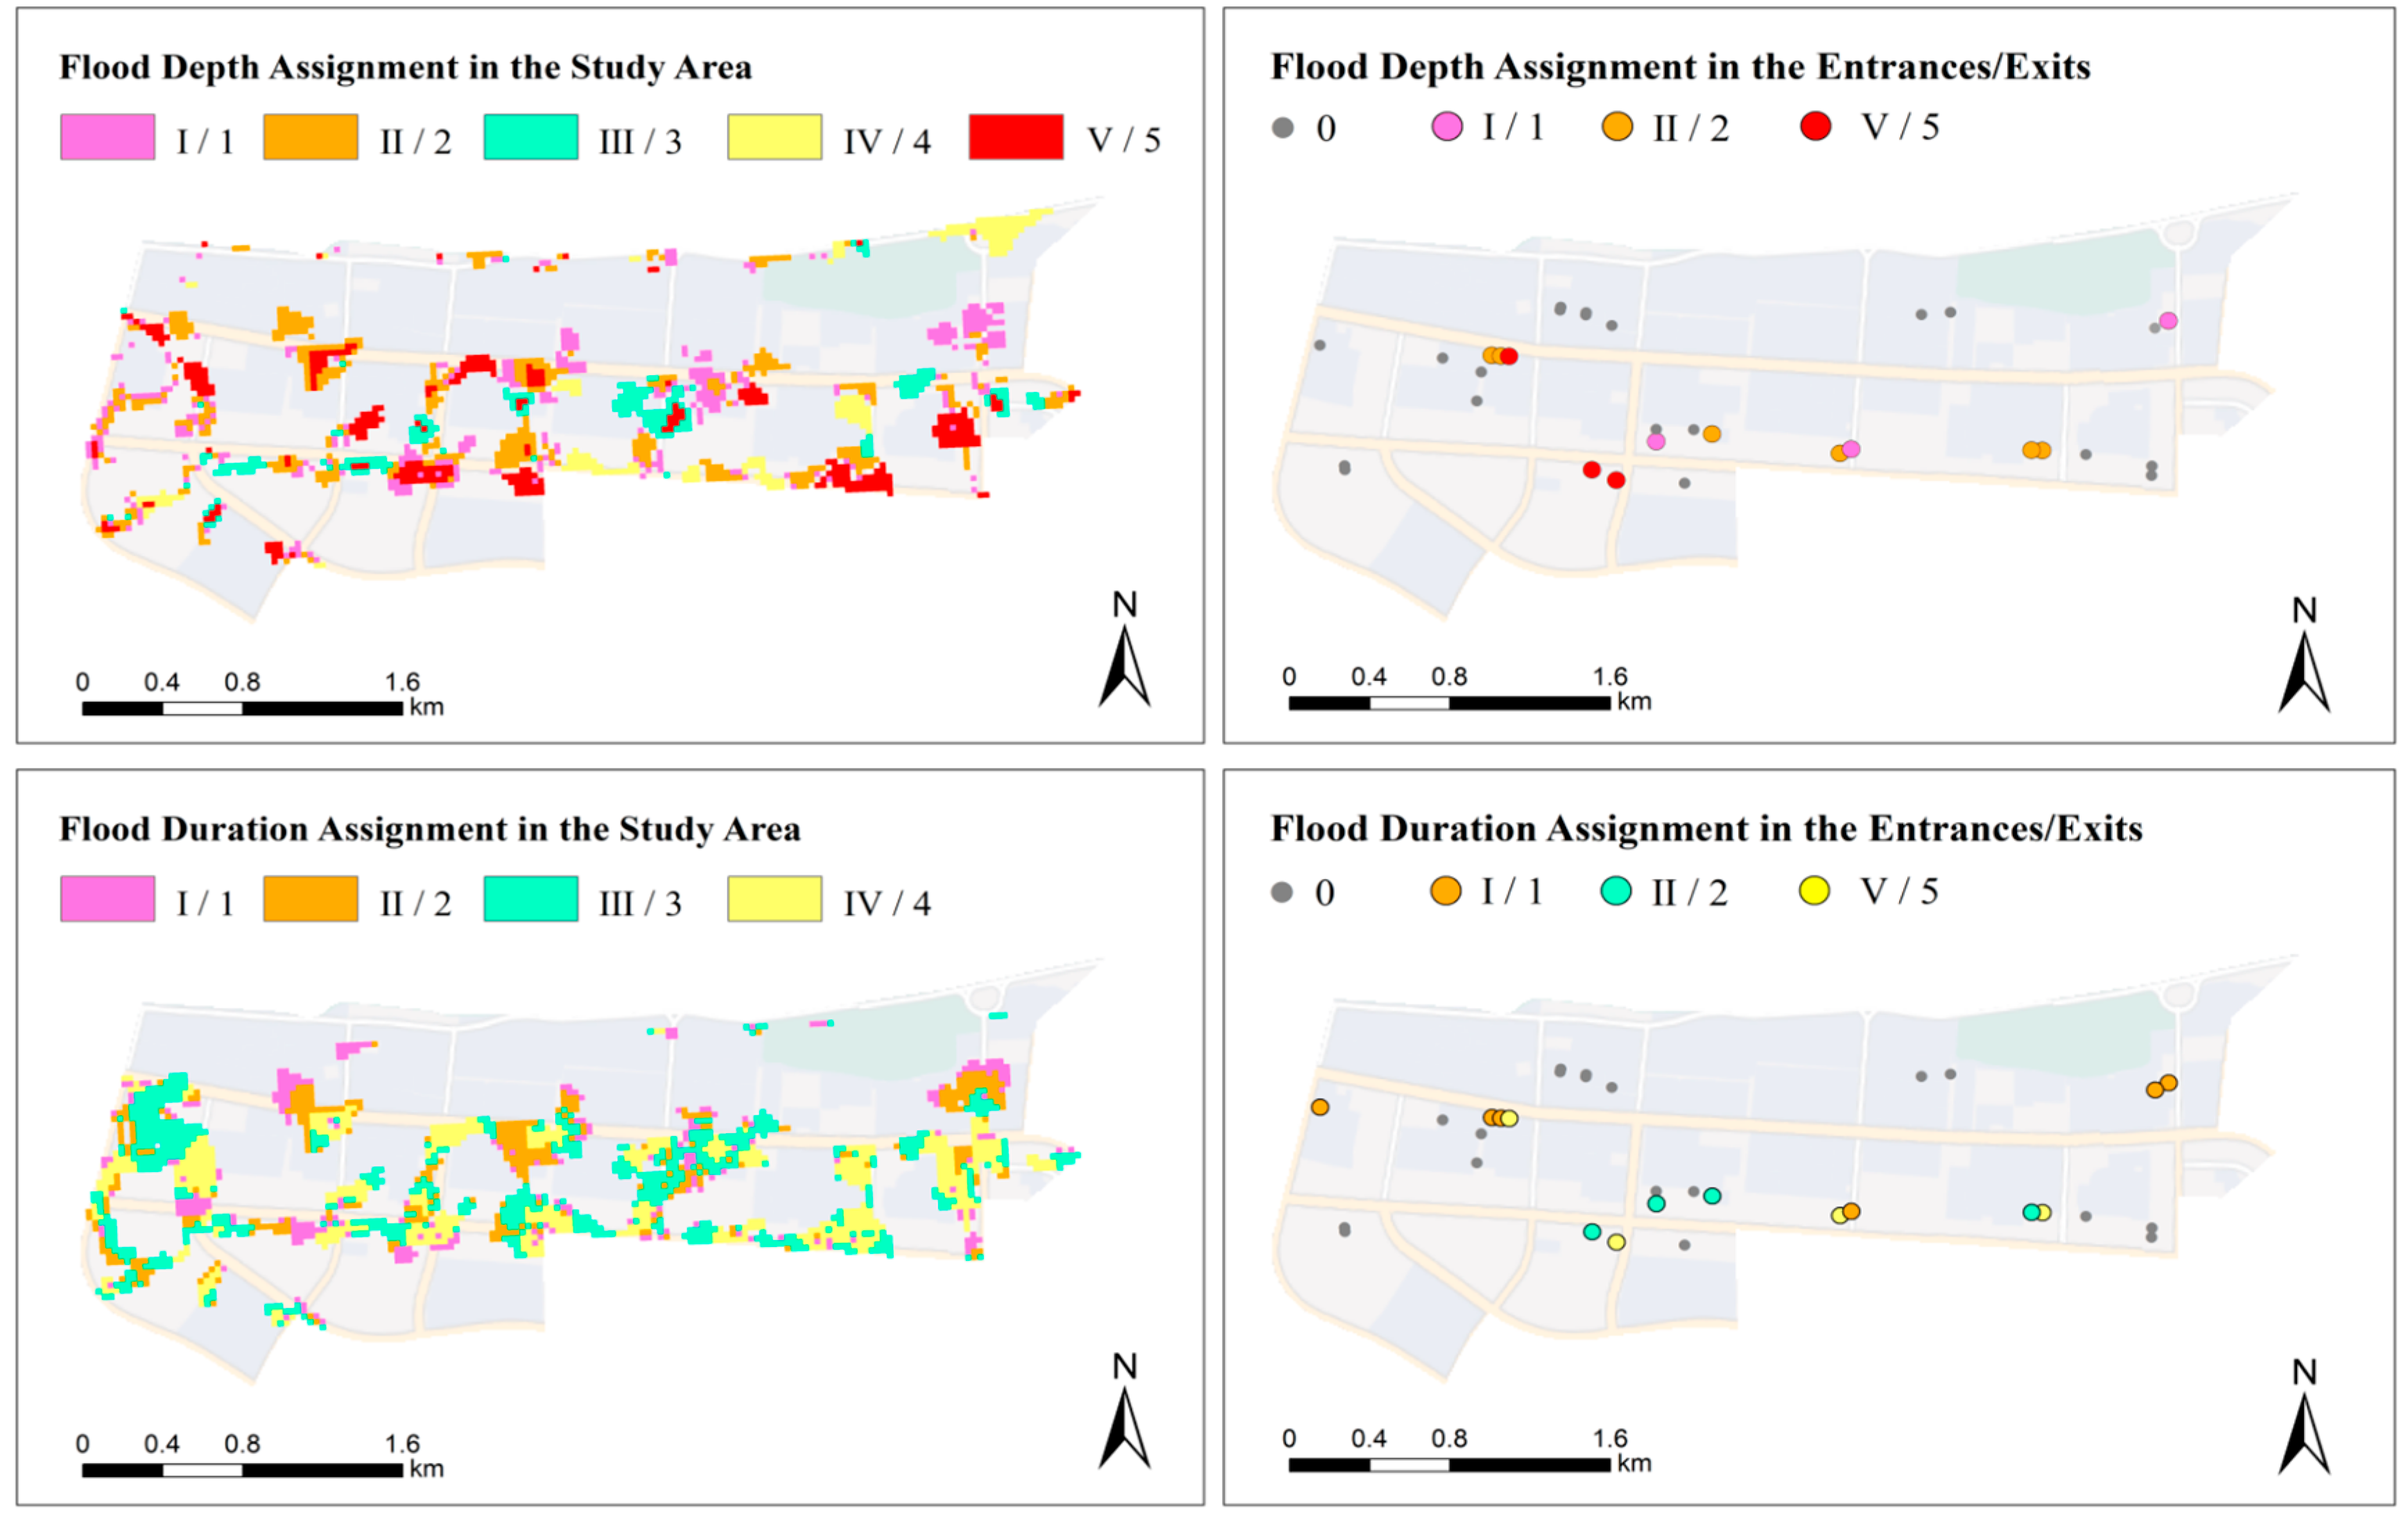
2.3.1. Flood Hazard Factors
Drainage Network Model
Meshing Model
Designed Rainfall Events
Model Validation
Garage Station Generalization
Selection of Indicators
2.3.2. Flood Exposure Factors
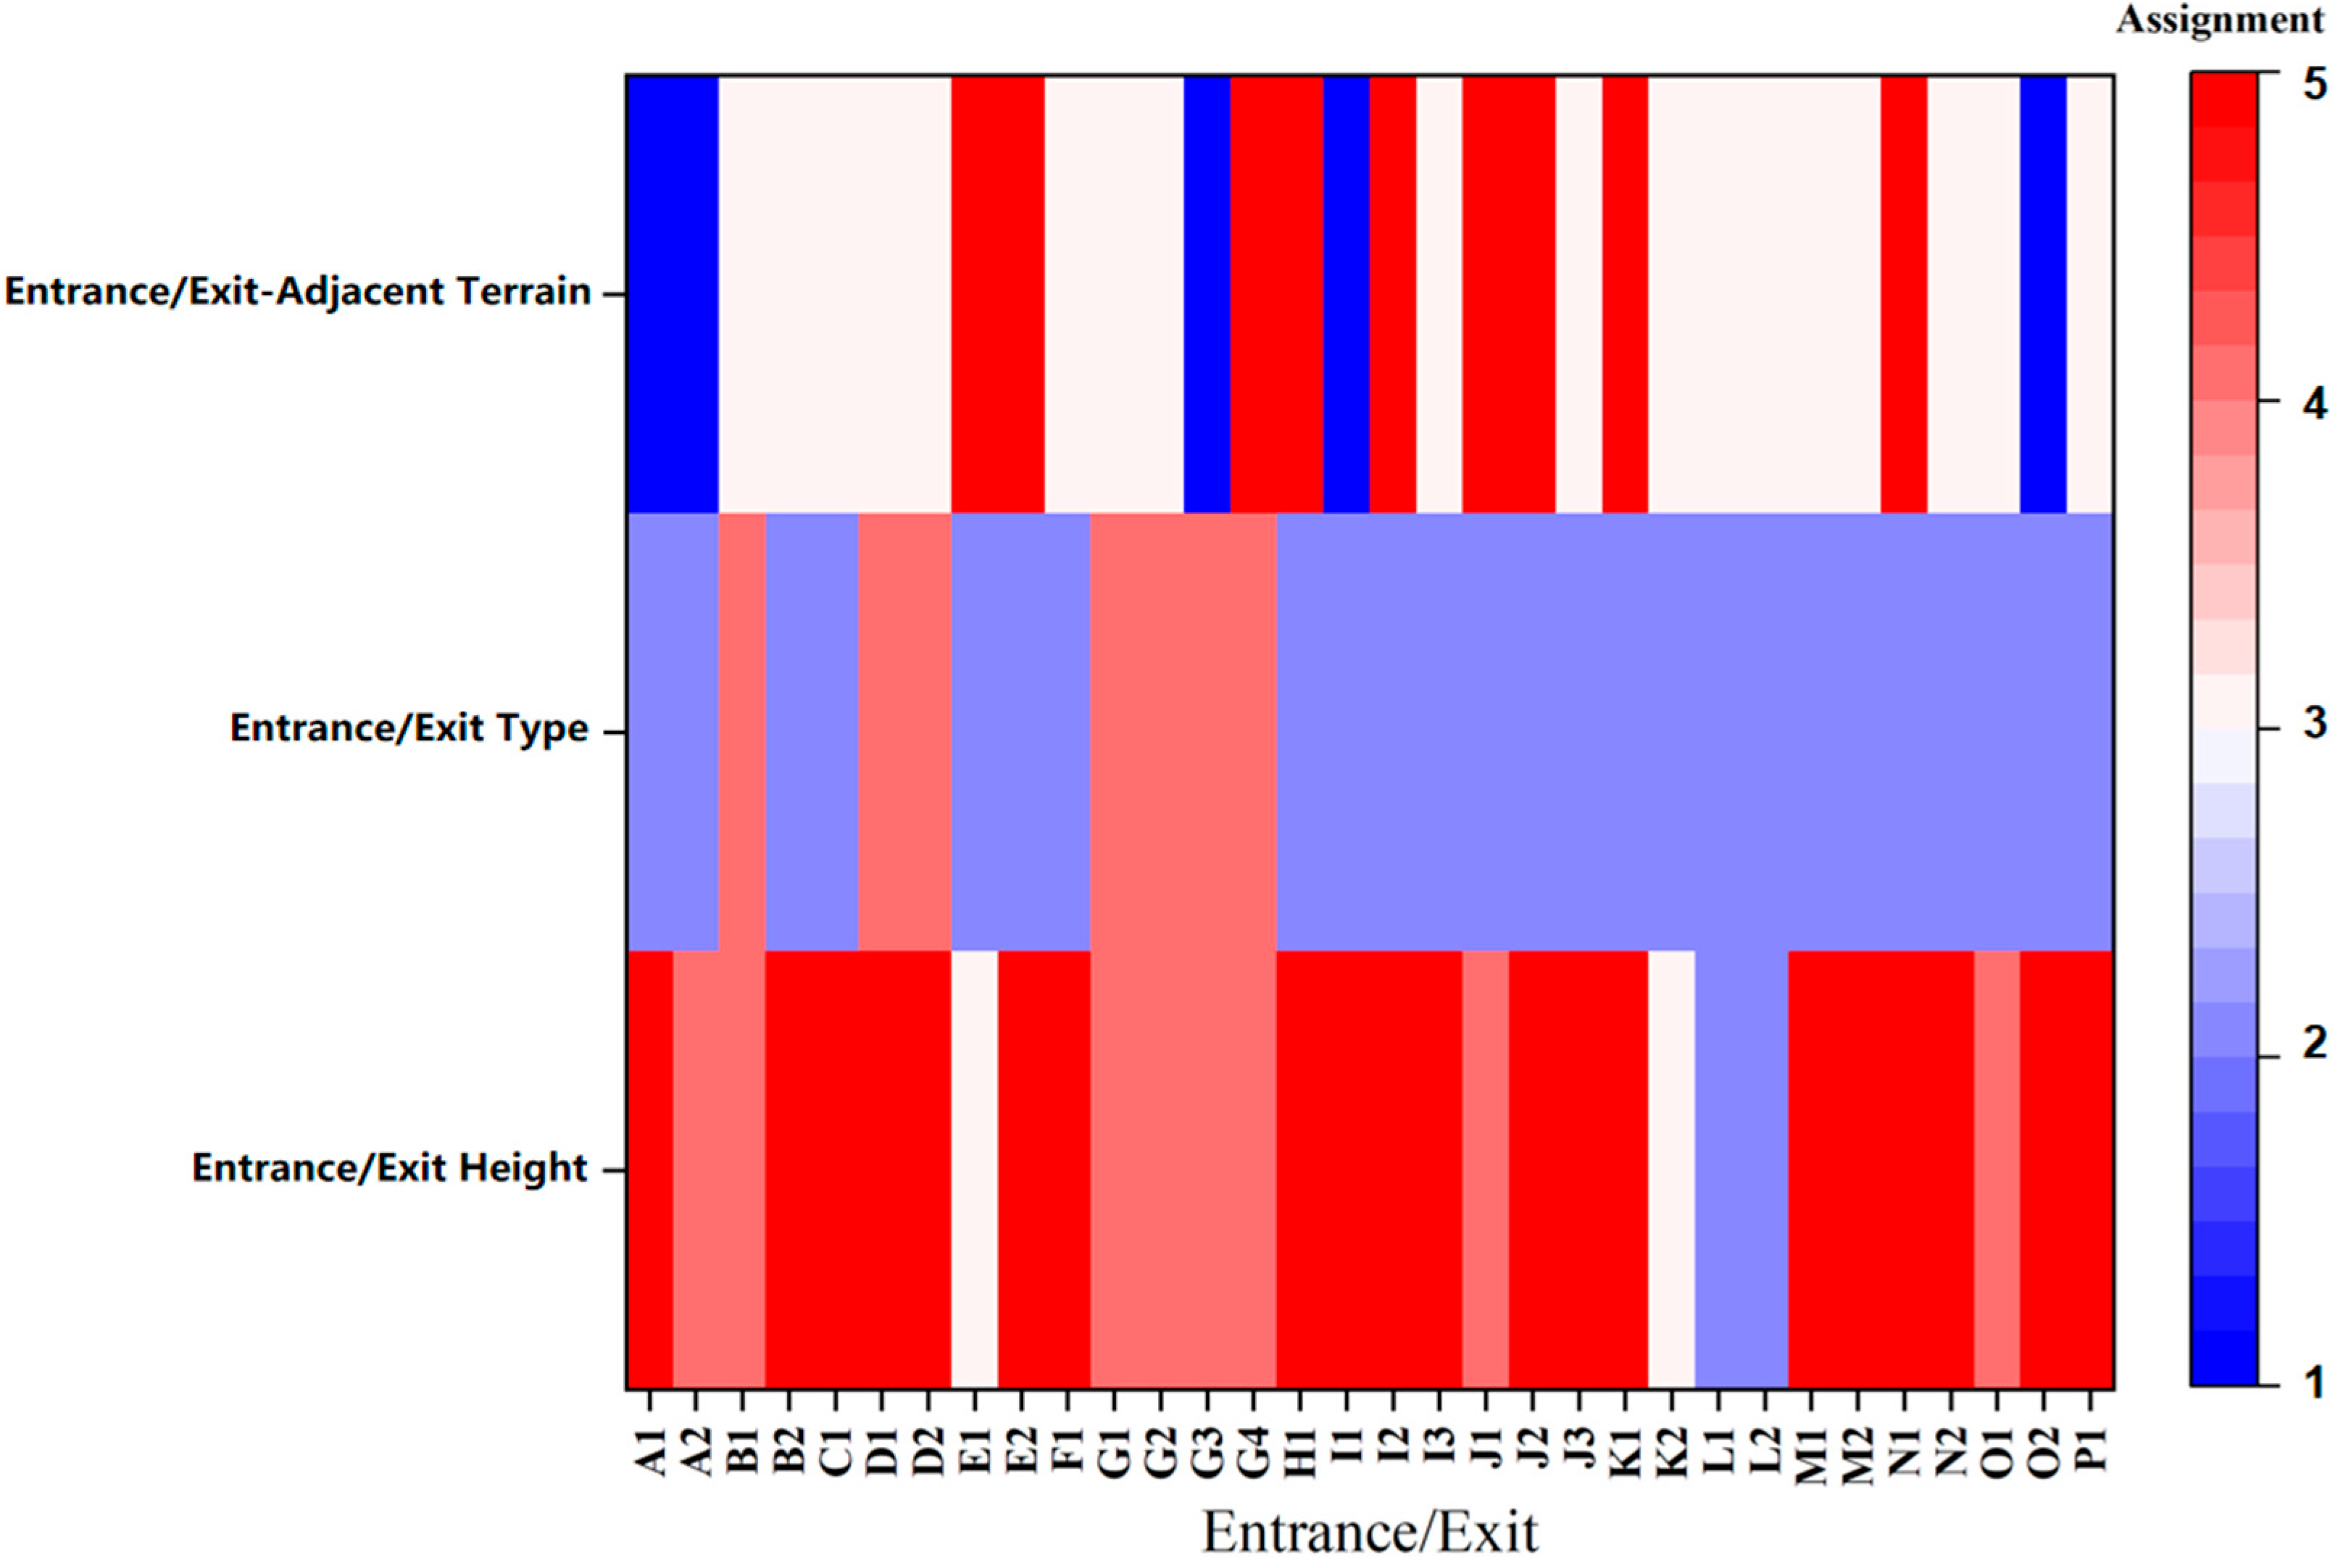
Entrance/Exit Height
Entrance/Exit Type
Entrance/Exit-Adjacent Terrain
2.3.3. Flood Resilience Factors
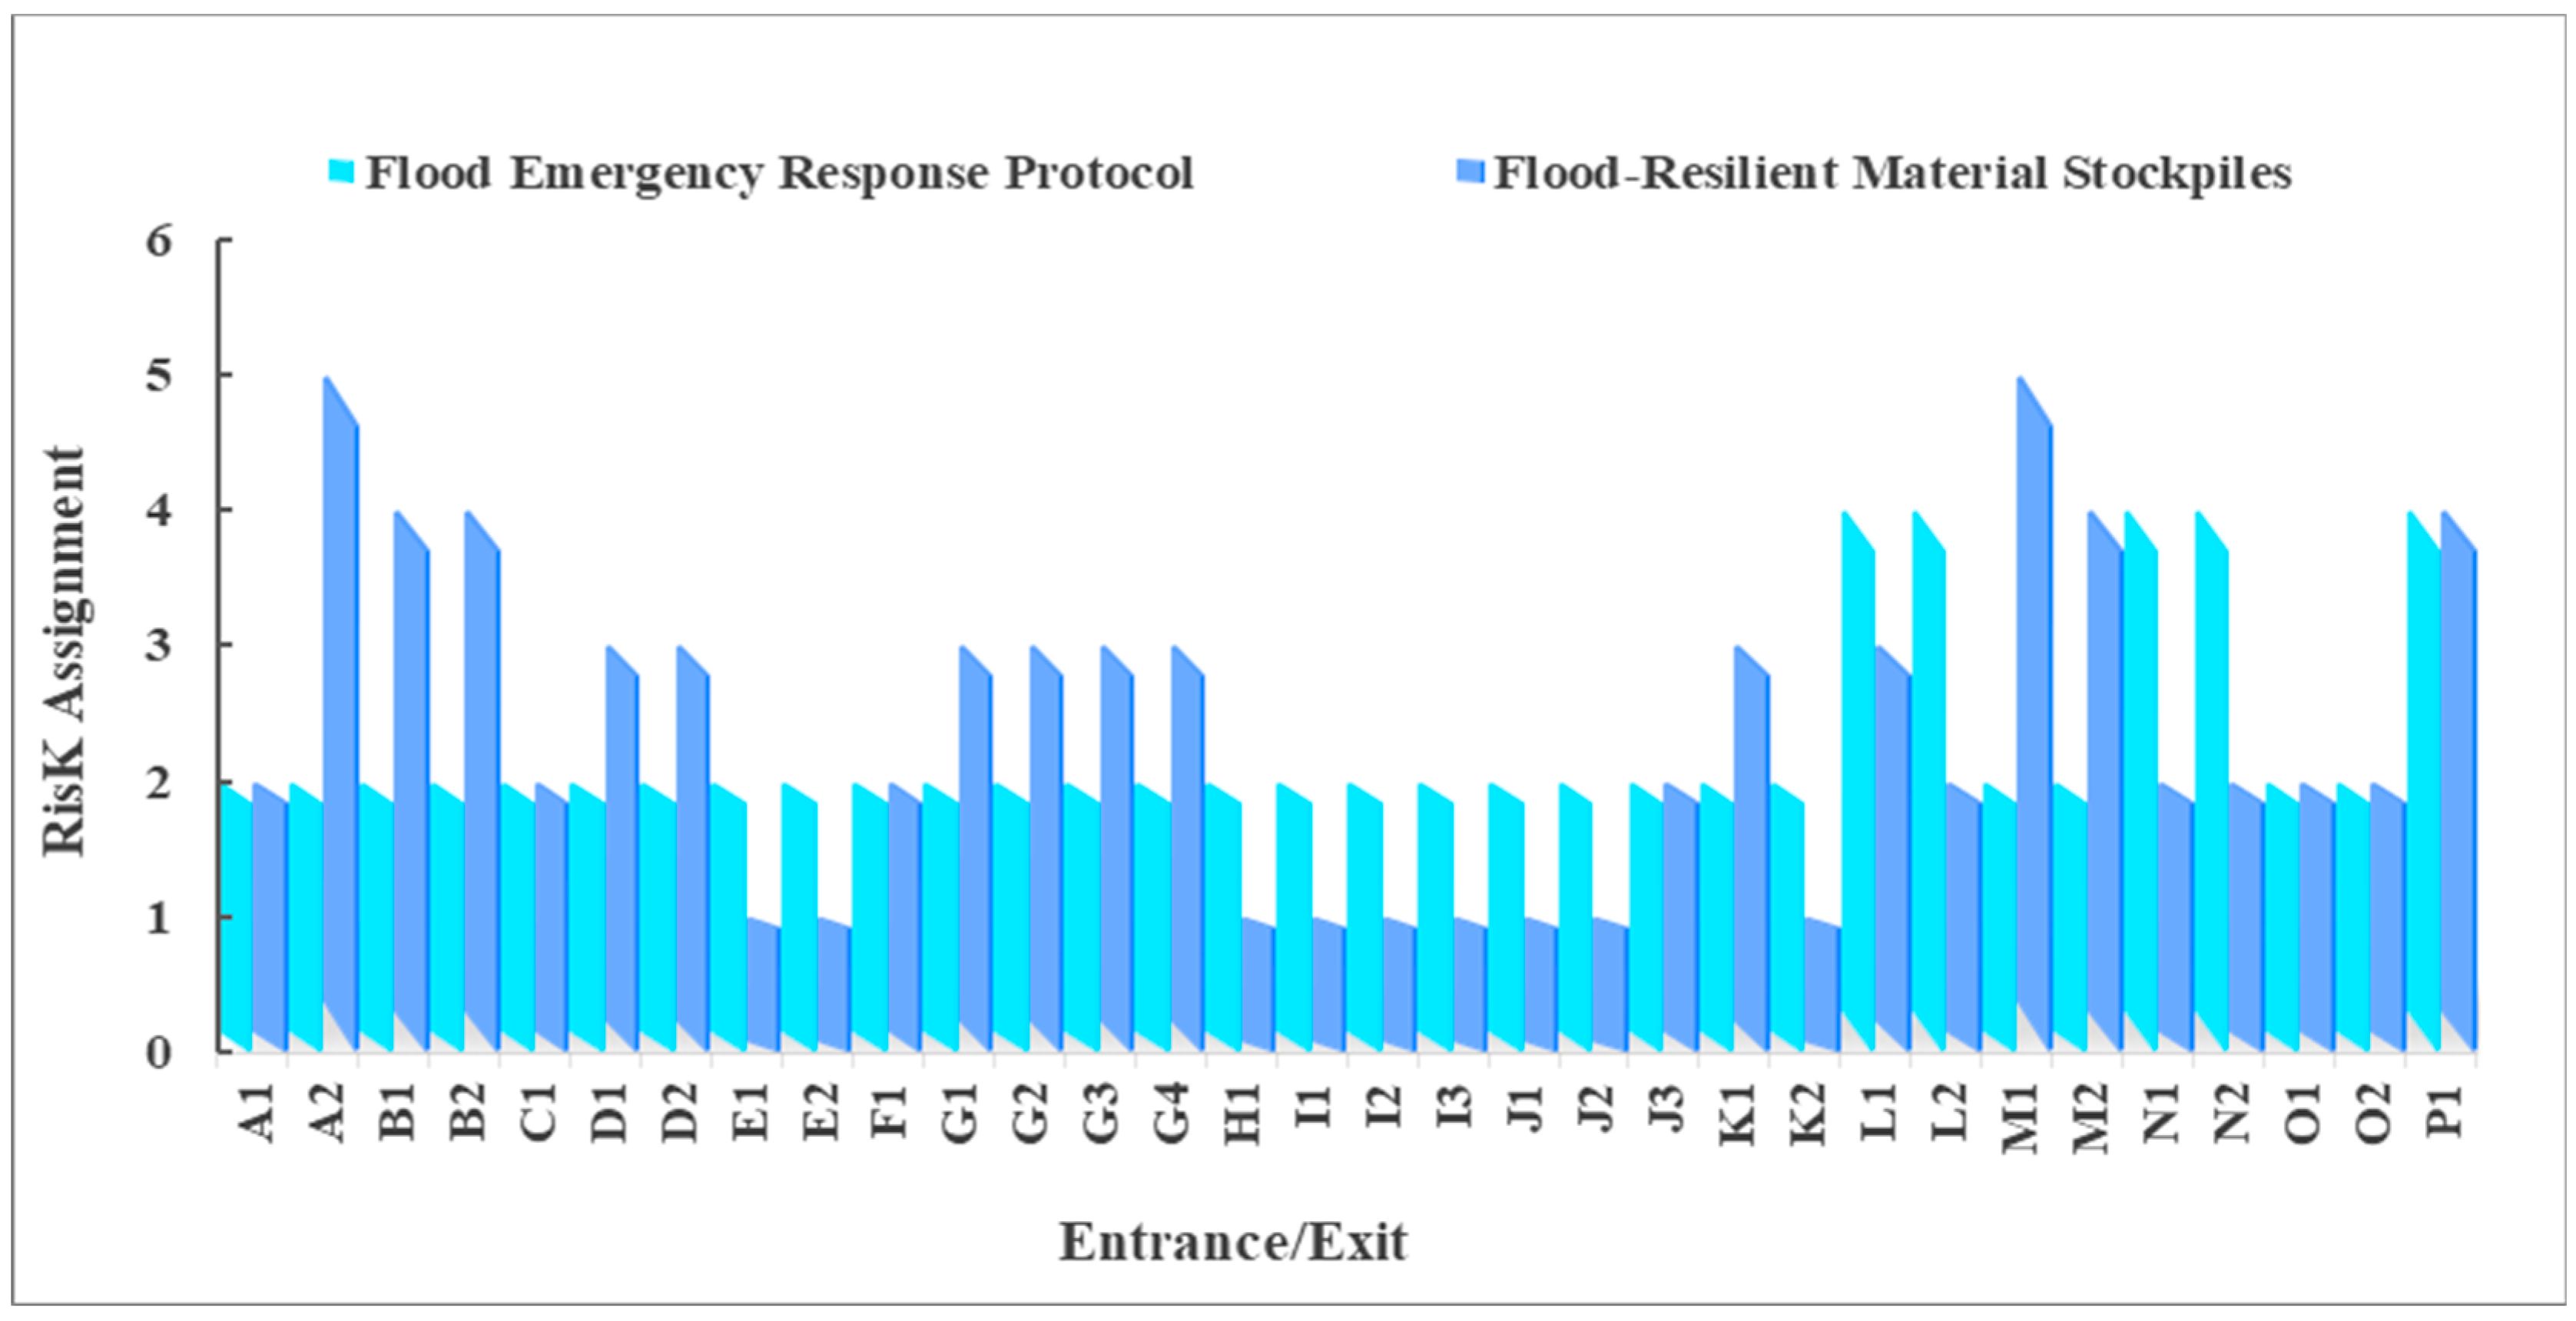
Flood-Resilient Material Stockpiles
Flood Emergency Response Protocol
2.4. Determination of Indicator Weights
3. Results
3.1. Calculation Results of Indicator Weights
3.2. Risk Metric Characterization
3.2.1. Analysis of Flood Hazards
3.2.2. Analysis of Flood Exposure
3.2.3. Analysis of Flood Resilience
3.3. Flood Risk Assessment of Entrances/Exits
3.4. Overall Ingress Risk of Underground Garages
4. Discussion
4.1. Strategies for Flood Risk Management
4.2. Limitations of Research Perspectives
5. Conclusions
- The hybrid EWM-CRITIC combination weighting method was employed to calculate composite indicators, effectively mitigating subjective bias in risk quantification. The results of weight analysis demonstrated that surface flood depth at the entrance/exit (0.2107) and entrance/exit height (0.2014) emerged as dominant determinants of the flood vulnerability of underground garages.
- Under the 100-year-return-period extreme rainfall scenario, the 32 entrances/exits of the 16 underground garages exhibited the following risk stratification: 6 were high-risk, 4 were medium-risk, 2 were low-risk, and 20 had no risk. The seven flood-prone underground garages were hierarchized as follows: Garage O > J > D > K > M > B > L.
- This study elucidated the primary causal factors of underground garage inundation risks and proposed targeted mitigation strategies.
Author Contributions
Funding
Data Availability Statement
Acknowledgments
Conflicts of Interest
References
- China Academy of Engineering; Chinese Society for Rock Mechanics & Engineering; Urban Planning Society of China. 2023 Blue Book on Urban Underground Space Development in China; China Science Publishing & Media Ltd.: Beijing, China, 2024; Available online: https://www.csrme.com/Content/Article/show/id/4617.do (accessed on 28 May 2025).
- Ariaratnam, S.T.; Chammout, B. Underground space development resulting from increased urban migration. Glob. J. Eng. Technol. Adv. 2021, 8, 46–55. [Google Scholar] [CrossRef]
- Yao, Y.C.; Hu, C.H.; Liu, C.S.; Yang, F.; Ma, B.Y.; Wu, Q.; Li, X.A.; Soomro, S.E.H. Comprehensive performance evaluation of stormwater management measures for sponge city construction: A case study in Gui’an New District, China. J. Flood Risk Manag. 2022, 15, e12834. [Google Scholar] [CrossRef]
- He, R.; Tiong, R.L.K.; Yuan, Y.; Zhang, L. Enhancing resilience of urban underground space under floods: Current status and future directions. Tunn. Undergr. Space Technol. 2024, 147, 105674. [Google Scholar] [CrossRef]
- Zhu, Y.; Liu, Y.; Zhu, L.; Liu, M.; Xie, Z.; Chen, J. Natural or man-made disaster? Lessons from the extreme rain and flood disaster in Zhengzhou, China on “2021.7.20″. Sustain. Cities Soc. 2025, 118, 105999. [Google Scholar] [CrossRef]
- Yuan, X.; Wu, M.; Tian, F.; Wang, X.; Wang, R. Identification of influencing factors and risk assessment of underground space flooding in the mountain city. Int. J. Disaster Risk Reduct. 2024, 113, 104807. [Google Scholar] [CrossRef]
- Liang, C.; Guan, M.; Guo, K.; Yin, J. Integrated Hazard-Dominated Approach for Assessing Flood Risks of Urban Metro Systems: A Case Study of the ‘9.7’ Extreme Flooding in Hong Kong. ResearchGate 2024. Available online: https://www.researchgate.net/publication/391856539 (accessed on 28 May 2025).
- Hussein, K.; Alhosani, N.; Al-Areeq, A.; Aghbari, A.; Elkamali, M.; Alsumaiti, T.; Sharif, H.O.; Almurshidi, A.; Abdalati, W. Unprecedented rainfall in the United Arab Emirates: Hydrologic and flood impact analysis of the April 2024 event. Nat. Hazards 2025, 121, 9363–9385. [Google Scholar] [CrossRef]
- Liu, J.Y.; Zheng, W.W.; Li, H.M.; Chen, J. Evaluation of Flooding Disaster Risks for Subway Stations Based on the PSR Cloud Model. Sustainability 2023, 15, 15552. [Google Scholar] [CrossRef]
- Wang, G.; Liu, Y.; Hu, Z.; Zhang, G.; Liu, J.; Lyu, Y.; Gu, Y.; Huang, X.; Zhang, Q.; Liu, L. Flood Risk Assessment of Subway Systems in Metropolitan Areas under Land Subsidence Scenario: A Case Study of Beijing. Remote Sens. 2021, 13, 637. [Google Scholar] [CrossRef]
- Xu, X.X.; Li, Z.L.; Wang, M.G.; Wang, H.Z.; Gong, Y.W. Research on the Method of Determining Rainfall Thresholds for Waterlogging Risk in Subway Stations. Water 2024, 16, 1596. [Google Scholar] [CrossRef]
- Lyu, H.M.; Shen, S.L.; Yang, J.; Yin, Z.Y. Inundation analysis of metro systems with the storm water management model incorporated into a geographical information system: A case study in Shanghai. Hydrol. Earth Syst. Sci. 2019, 23, 4293–4307. [Google Scholar] [CrossRef]
- Zhong, J.; Li, D.; Jiang, K. Assessment of urban underground spaces inundation during extreme rainfall events. Water Sci. Technol. 2024, 89, 2851–2866. [Google Scholar] [CrossRef] [PubMed]
- Bi, W.; Hackl, J.; MacAskill, K. Enhancing flood resilience of urban rail transit systems through recovery resource scheduling optimisation: A case study of London. Sustain. Cities Soc. 2025, 128, 106437. [Google Scholar] [CrossRef]
- Forero-Ortiz, E.; Martínez-Gomariz, E.; Porcuna, M.C. A review of flood impact assessment approaches for underground infrastructures in urban areas: A focus on transport systems. Hydrol. Sci. J. 2020, 65, 1943–1955. [Google Scholar] [CrossRef]
- Zhang, H.; Zhang, J.P.; Fang, H.Y.; Yang, F. Urban flooding response to rainstorm scenarios under different return period types. Sustain. Cities Soc. 2022, 87, 104184. [Google Scholar] [CrossRef]
- Jiang, Y.S.; Li, J.K.; Li, Y.P.; Gao, J.Y.; Xia, J. Influence of rainfall pattern and infiltration capacity on the spatial and temporal inundation characteristics of urban waterlogging. Environ. Sci. Pollut. Res. 2024, 31, 12387–12405. [Google Scholar] [CrossRef] [PubMed]
- Yang, H.; Zhao, L.S.; Chen, J. Metro System Inundation in Zhengzhou, Henan Province, China. Sustainability 2022, 14, 9292. [Google Scholar] [CrossRef]
- Chen, J.X.; Wang, S.S.; Wu, R.B. Optimization of the integrated green-gray-blue system to deal with urban flood under multi-objective decision-making. Water Sci. Technol. 2024, 89, 434–453. [Google Scholar] [CrossRef]
- Zhang, J.; Li, X.; Zhang, H.; Zhang, L. Urban waterlogging risk assessment in Zhengzhou based on the coupling land surface hazard-pregnant features and underground pipe network operation characteristics. J. Hydrol. Reg. Stud. 2025, 59, 102416. [Google Scholar] [CrossRef]
- Liu, Y.T.; Chen, B.; Duan, C.C.; Wang, H. Economic loss of urban waterlogging based on an integrated drainage model and network environ analyses. Resour. Conserv. Recycl. 2023, 192, 106923. [Google Scholar] [CrossRef]
- Xiao, Z.S.; Gao, Q.; Hou, X.S.; Ma, M.J.; Hu, B.B.; Song, W.F.; Jia, L.F. Rainstorm waterlogging vulnerability assessment of subway stations in the central area of Tianjin. Hydrol. Sci. J. 2023, 68, 2277–2297. [Google Scholar] [CrossRef]
- Toda, K.; Kawaike, K.; Yoneyama, N.; Fukakusa, S.; Yamamoto, D. Underground Inundation Analysis by Integrated Urban Flood Model. In Advances in Water Resources and Hydraulic Engineering; Springer: Berlin/Heidelberg, Germany, 2009; pp. 166–171. [Google Scholar] [CrossRef]
- Zhang, Z.; Huang, G. Flood resilience assessment of metro station entrances based on the PSR model framework: A case study of the Donghaochong Basin, Guangzhou. J. Environ. Manag. 2024, 366, 121922. [Google Scholar] [CrossRef] [PubMed]
- Liu, F.; Liu, X.D.; Xu, T.; Yang, G.; Zhao, Y.L. Driving Factors and Risk Assessment of Rainstorm Waterlogging in Urban Agglomeration Areas: A Case Study of the Guangdong-Hong Kong-Macao Greater Bay Area, China. Water 2021, 13, 770. [Google Scholar] [CrossRef]
- Luo, Z.Y.; Tian, J.; Zeng, J.; Pilla, F. Flood risk evaluation of the coastal city by the EWM-TOPSIS and machine learning hybrid method. Int. J. Disaster Risk Reduct. 2024, 106, 104435. [Google Scholar] [CrossRef]
- Ju, W.; Wu, J.; Cao, H.; Kang, Q.; Syed Salman Ali, S.; Xing, Z. Flood risk assessment of subway stations based on projection pursuit model optimized by whale algorithm: A case study of Changzhou, China. Int. J. Disaster Risk Reduct. 2023, 98, 104068. [Google Scholar] [CrossRef]
- Soni, L.; Iqbal, A.; Waheed, F.; Shah, A.A.; Akbar, N. Challenges and considerations of applying nature-based solutions for future mega-cities: Implications for Karachi as a Sponge City. Hum. Settl. Sustain. 2025, 1, 50–61. [Google Scholar] [CrossRef]
- Hoegh-Guldberg, F.; Visintin, C.; Lentini, P.; Selinske, M.; Bekessy, S. Where is the nature in nature-based flood management? Biodiversity is not considered enough. Sci. Total Environ. 2024, 957, 177698. [Google Scholar] [CrossRef]
- Zhou, H.; Li, H.P.; Zhao, X.B.; Ding, Y.Y. Emergy ecological model for sponge cities: A case study of China. J. Clean. Prod. 2021, 296, 126530. [Google Scholar] [CrossRef]
- Xiang, H.-T.; Lyu, H.-M. Assessment of vulnerability to waterlogging in subway stations using integrated EWM-TOPSIS. Smart Constr. Sustain. Cities 2023, 1, 17. [Google Scholar] [CrossRef]


| Date | Location | Impacts and Consequences |
|---|---|---|
| July 2017 | Paris, France | Twenty metro stations were temporarily closed |
| July 2021 | Zhengzhou, China | Flooding of Metro Line 5 led to 14 fatalities; more than half of residential underground spaces were inundated |
| July 2022 | New York City, USA | Train station services were suspended |
| September 2023 | Hongkong, China | Four subways were taken out of service |
| April 2024 | Oman and the United Arab Emirates (UAE) | Subway flooding caused a service suspension |
| Rainfall Period/a | Rainfall/mm | Model Comprehensive Runoff Coefficient | Comprehensive Runoff Coefficient | CV/% |
|---|---|---|---|---|
| 1 | 38.89 | 0.65 | 0.68 | 4.41 |
| 100 | 113.40 | 0.67 | 1.47 |
| Standardized Layer | Indicator Layer | Define | Source |
|---|---|---|---|
| Hazard | Flood Depth | Depth of water at entrance/exit | Simulation results of MIKE FLOOD |
| Flood Duration | Waterlogging time at entrance/exit | ||
| Exposure | Entrance/Exit Height | Relative height difference between highest point of entrance/exit and adjacent level ground | Field research |
| Entrance/Exit Type | Open or closed | ||
| Entrance/Exit-Adjacent Terrain | Elevation variations within 30 m buffer zone of entrance/exit | ArcGIS 10.5 elevation data analysis | |
| Resilience | Flood-Resilient Material Stockpiles | Completeness of flood control materials | Field research |
| Flood Emergency Response Protocol | Designation of key targets for official early warning and flood control | Urban management and law enforcement |
| Levels/Assignments | I/1 | II/2 | III/3 | IV/4 | V/5 |
|---|---|---|---|---|---|
| Flood Depth/cm | (0, 5] | (5, 15] | (15, 30] | (30, 50] | 50 |
| Flood Duration/min | (0, 30] | (30, 60] | (60, 90] | (90, 120] | >120 |
| Entrance/Exit Height/cm | >50 | (30, 50] | (15, 30] | (5, 15] | [0, 5] |
| Entrance/Exit Type | / | Closed | / | Open | / |
| Entrance/Exit-Adjacent Terrain | Elevation (entrance/exit) = Elevation (buffer max) | / | Elevation (buffer min) < Elevation (entrance/exit) < Elevation (buffer max) | / | Elevation (entrance/exit) = Elevation (buffer min) |
| Flood-Resilient Material Stockpiles | Sandbags, waterproof barriers, drainage ditches | Sandbags/waterproof barriers, drainage ditches | Drainage ditches | Sandbags /waterproof barriers | No |
| Flood Emergency Response Protocol | / | Included | / | Not included | / |
| Assessment Target | Standardized Layer | Indicator Layer | EWM Weights | CRITIC Weights | Combined Weights |
|---|---|---|---|---|---|
| Risk Assessment of Flooding in Underground Garages | Hazard | Flood Depth | 0.2805 | 0.1408 | 0.2107 |
| Flood Duration | 0.2221 | 0.1026 | 0.1624 | ||
| Exposure | Entrance/Exit Height | 0.2669 | 0.1358 | 0.2014 | |
| Entrance/Exit Type | 0.0663 | 0.1806 | 0.1235 | ||
| Entrance/Exit-Adjacent Terrain | 0.0806 | 0.1541 | 0.1174 | ||
| Resilience | Flood-Resilient Material Stockpiles | 0.0378 | 0.1252 | 0.0815 | |
| Flood Emergency Response Protocol | 0.0458 | 0.1609 | 0.1034 |
Disclaimer/Publisher’s Note: The statements, opinions and data contained in all publications are solely those of the individual author(s) and contributor(s) and not of MDPI and/or the editor(s). MDPI and/or the editor(s) disclaim responsibility for any injury to people or property resulting from any ideas, methods, instructions or products referred to in the content. |
© 2025 by the authors. Licensee MDPI, Basel, Switzerland. This article is an open access article distributed under the terms and conditions of the Creative Commons Attribution (CC BY) license (https://creativecommons.org/licenses/by/4.0/).
Share and Cite
Fang, J.; Wang, S.; Chen, J.; Ma, J.; Wu, R. Entrance/Exit Characteristics-Driven Flood Risk Assessment of Urban Underground Garages Under Extreme Rainfall Scenarios. Water 2025, 17, 2081. https://doi.org/10.3390/w17142081
Fang J, Wang S, Chen J, Ma J, Wu R. Entrance/Exit Characteristics-Driven Flood Risk Assessment of Urban Underground Garages Under Extreme Rainfall Scenarios. Water. 2025; 17(14):2081. https://doi.org/10.3390/w17142081
Chicago/Turabian StyleFang, Jialing, Sisi Wang, Jiaxuan Chen, Jinming Ma, and Ruobing Wu. 2025. "Entrance/Exit Characteristics-Driven Flood Risk Assessment of Urban Underground Garages Under Extreme Rainfall Scenarios" Water 17, no. 14: 2081. https://doi.org/10.3390/w17142081
APA StyleFang, J., Wang, S., Chen, J., Ma, J., & Wu, R. (2025). Entrance/Exit Characteristics-Driven Flood Risk Assessment of Urban Underground Garages Under Extreme Rainfall Scenarios. Water, 17(14), 2081. https://doi.org/10.3390/w17142081