Article

Optical, Photocatalytic, and Antibacterial Properties of Sol-Gel Derived Fe Doped SrTiO3 Powders

by
Stefani Petrova
1,2,*,
Kalina Ivanova
1,
Iliana Ivanova
3 and
Albena Bachvarova-Nedelcheva
1,4
1
Institute of General and Inorganic Chemistry, Bulgarian Academy of Sciences, Acad. G. Bonchev Str., bl. 11, 1113 Sofia, Bulgaria
2
Faculty of Chemistry and Pharmacy, Sofia University, St. Kliment Ohridski, 1164 Sofia, Bulgaria
3
Faculty of Biology, Sofia University, St. Kliment Ohridski, 8 Dragan Tsankov Blvd., 1164 Sofia, Bulgaria
4
National Centre of Excellence Mechatronics and Clean Technologies, 8 bul., Kl. Ohridski, 1756 Sofia, Bulgaria
*
Author to whom correspondence should be addressed.
Water 2025, 17(14), 2072; https://doi.org/10.3390/w17142072
Submission received: 13 June 2025 / Revised: 3 July 2025 / Accepted: 9 July 2025 / Published: 11 July 2025

Abstract

In this study, Fe-doped SrTiO3 powders have been synthesized using the sol-gel approach. The effect of the Fe3+ doping on the degradation efficiency of SrTiO3 toward specific pollutants was studied. The obtained samples were characterized using the following techniques: XRD, SEM-EDS, FTIR, UV-Vis, and BET. Subsequently, the samples were tested for degradation of two organic pollutants—tetracycline hydrochloride and Malachite green in distilled water under different light sources—UV light and visible light. The investigated powders exhibited good photocatalytic degradation efficiency against both pollutants. A comparison of the photocatalytic abilities of the samples under different lights has been made, which emphasizes the paper’s novelty. Undoped SrTiO3 exhibited better photocatalytic activity for TCH both under UV and visible light irradiation in comparison to the Fe-doped. The SrTi0.15Fe0.85O3 shows superior photocatalytic activity under visible light irradiation for the degradation of MG dye. The antibacterial activity has been tested against two bacterial strains, E. coli ATCC 25922 and P. aeruginosa ATCC 27853. It has been found that the antibacterial efficiency of the Fe-doped sample is greater than compared of the undoped one.

1. Introduction

Water pollution caused by organic contaminants has emerged as a critical environmental issue due to the extensive use of pharmaceuticals, dyes, and other industrial chemicals. Among these, tetracycline hydrochloride (TCH), a widely used antibiotic, and malachite green (MG), a synthetic dye frequently employed in the textile and aquaculture industries, pose significant ecological and health risks [1]. Their persistence in aqueous environments, potential toxicity, and resistance to conventional wastewater treatment methods necessitate the development of effective remediation technologies. One promising approach involves the utilization of photocatalysis, an advanced oxidation process capable of degrading complex organic molecules and products through light-induced catalytic reactions [2,3].
Heterogeneous photocatalysis has garnered considerable attention due to its efficiency, environmental compatibility, and ability to harness solar energy for pollutant degradation. Among various photocatalysts, perovskite-based oxides have shown remarkable potential due to their tunable electronic structure, high stability, and excellent charge transport properties [3,4]. In particular, strontium titanate-based perovskites (SrTiO3) have demonstrated notable photocatalytic activity under both ultraviolet and visible light irradiations. However, their performance can be further enhanced by substituting titanium with iron, which is known to improve structural stability, bandgap modulation, and charge separation efficiency [5,6].
Simultaneously, increasing concern has emerged regarding microbial contamination of water ecosystems with pathogenic strains such as Escherichia coli and Pseudomonas aeruginosa, which are frequently found in wastewater and pose significant risks to public health due to their antibiotic resistance and infection potential [7]. The global threat of antibiotic-resistant bacteria has driven research towards alternative disinfection strategies. Among the most promising are nanomaterials, particularly metal and metal oxide nanoparticles (e.g., Ag, ZnO, TiO2), which exhibit strong antibacterial activity via generation of reactive oxygen species (ROS), disruption of microbial membranes, and inhibition of metabolism [8,9]. Integrating these materials into photocatalytic systems has shown added benefits, as surface modifications and photocatalytic coatings enhance microbial contact and light-induced inactivation [10,11].
It is well known that SrTiO3 is a perovskite oxide that has been extensively studied for its photocatalytic applications. Moreover, it possesses excellent chemical stability, a high dielectric constant, and a favorable band structure for charge carrier separation. It has a wide bandgap (~3.2 eV), making it highly active under UV light, but its activity in the visible light spectrum is often limited [6,12,13]. To address this limitation, doping strategies and heterostructure formation have been employed to enhance its visible-light-driven photocatalytic efficiency [14]. Researchers have been doping SrTiO3 with various metals, which significantly influences its electronic and photocatalytic properties [12,13,14,15,16]. For instance, lanthanum (La)-doped SrTiO3 has been explored for its enhanced electrical conductivity and photocatalytic efficiency due to the introduction of extra charge carriers [17]. Niobium (Nb)-doped SrTiO3 has been studied for its modified band structure, which improves light absorption and charge transport properties [18]. Additionally, doping SrTiO3 with transition metals such as cobalt (Co) and chromium (Cr) has demonstrated improvements in visible-light activity by narrowing the bandgap and facilitating charge separation [19,20]. Among these dopants, iron (Fe) is particularly promising due to its ability to introduce intermediate energy levels within the band structure of SrTiO3, thereby extending its light absorption into the visible region [21]. Iron substitution in the SrTiO3 lattice modifies the electronic structure by altering the valence states of Fe (Fe3+/Fe4+) and introducing oxygen vacancies, which enhance charge carrier mobility and reduce recombination rates [19]. Furthermore, Fe doping can contribute to enhanced structural stability, improving the material’s durability under operational conditions [5].
The optical properties of various perovskites have been studied by several authors [19,22]. It has been generalized that the type of material and the dopant influence the band gap energy values. For example, La-doping causes the optical band of SrTiO3 to become narrower [19].
Several synthesis methods have been employed for the preparation of perovskite-based photocatalysts, including mechanochemical synthesis, solid-state reaction, hydrothermal synthesis, combustion synthesis, and co-precipitation methods. The solid-state reaction method is widely used due to its simplicity and scalability; however, it requires high temperatures and prolonged reaction times, leading to particle agglomeration and reduced surface area [23,24,25]. Hydrothermal synthesis allows for the production of highly crystalline nanomaterials under mild temperature and pressure conditions, but it often involves complex processing steps and requires specialized equipment [26]. Combustion synthesis provides rapid synthesis of perovskite oxides with controlled stoichiometry, but the process can be challenging to control, leading to inhomogeneous particle sizes [27]. Co-precipitation is another widely utilized technique that offers good control over composition and particle size, yet it often necessitates additional calcination steps to achieve the desired crystallinity and phase purity [28,29,30]. Mechanochemical synthesis is employed for its solvent-free, energy-efficient approach to producing nanomaterials and complex compounds, often under ambient conditions; however, it can suffer from limitations such as poor control over particle size distribution and challenges in scaling up the process for industrial applications [31].
The literature review showed that there is scarce data on the antibacterial properties of Fe-doped SrTiO3 phases. Zhang et al. [32] reported that strontium titanate ferrite metal oxide powders obtained by mechanochemical activation exhibited antibacterial effects against E. coli.
Up to now, the sol-gel synthesis technique is a preferred approach due to its ability to produce homogeneous, high-purity nanoparticles with controlled morphology and crystallinity [30,31]. The sol-gel method allows for precise control over stoichiometry, low-temperature processing, and the formation of highly porous structures, which are beneficial for photocatalytic applications. Additionally, the sol-gel method’s versatility stems from the fact that it allows for the mixing of beginning chemicals (precursors) in solution form at considerably lower temperatures, which provides good control over diverse components at the atomic level and improves the characteristics of the materials [33,34]. Furthermore, the sol-gel method gives multicomponent systems unquestionable homogeneity. The sol-gel method provides the best means of regulating the amount and uniformity of doping in the specific situation [33].
Despite extensive research on various doped SrTiO3 systems, the investigation of sol-gel derived iron-doped SrTiO3 with varying compositions for photocatalytic degradation of organic pollutants remains limited. Thus, it is necessary to improve its photocatalytic performance. Most prior studies have focused on binary or single-metal-doped perovskites, whereas the combination of Fe and Ti in a mixed perovskite system offers a unique interplay of electronic and structural modifications that can be exploited for superior photocatalytic performance.
This study aims to verify the synthesis and photocatalytic behavior of sol-gel prepared Fe-doped SrTiO3 perovskites for the degradation of organic pollutants—Tetracycline hydrochloride and Malachite green under both UV and visible light. The optical and antibacterial properties have been tested as well, which highlights the paper’s originality. The obtained results will provide useful information on the role of Fe2O3 and the chosen composition on structural modifications, thereby contributing greatly to the new findings in the field of environmental technologies.

2. Materials and Methods

2.1. Materials

The analytically pure chemicals Fe(NO3)3·9H2O (p.а., Sigma-Aldrich, Milwaukee, WI, USA), Sr(NO3)2.4H2O (p.a., Sigma Aldrich), Ti(OBu)4 (reagent grade, 97%, Sigma-Aldrich, Milwaukee, WI, USA), citric acid monohydrate (Merck, California, USA), C2H5OH (96%) (Sigma-Aldrich) and NH3 (Sigma-Aldrich) were used in this study. As contaminants, two organic pollutants have been used—tetracycline hydrochloride (Ficher BioReagents, Waltham, MA, USA) as well as Malachite green oxalate salt dye (analytical standard, Merck KGaA, Darmstadt, Germany).

2.2. Synthesis SrFe1−XTiXO3 (X = 1, 0.85) Catalysts

The SrFe1−XTiXO3 (X = 1, 0.85), mol% compositions were obtained by a sol-gel method. Three solutions, A, B, and C, were prepared by mixing the appropriate amount of the precursors. Similar schemes for the synthesis of such perovskites have been applied by several authors [12,35,36]. The investigated compositions were denoted as STO (SrTiO3) and SFTO (SrFe1−XTiXO3) (X = 1, 0.85), mol%, which indicates merely the nominal composition of the solids. The Ti(OBu)4 was mixed with ethanol and citric acid under vigorous stirring (solution A), while solution B was prepared keeping the desired ratio of Sr(NO3)2/C2H5OH 1:1 molar ratio (solution B). Solution C is prepared keeping the desired ratio of Fe(NO3)3/C2H5OH 1:1 molar ratio (solution C). The precursor solutions were subjected to 5–10 min intensive stirring at room temperature to achieve complete dissolution. The solutions B and C were slowly dropped into solution A and stirred at 50 °C to form the transparent gel under the polymerization effect After mixing the resulting solutions for 60 min at 400–500 rpm with a magnetic stirrer, the pH of the mixture was also brought to 5 by adding ammonia solution drop by drop (D). The gelation occurred at room temperature, but depending on the composition, it occurred for different times. The gelation of the examined compositions occurred for ~2 h. The gels were obtained and stabilized at low relative humidity (~2%). The resulting products were calcined at 1100 °C until the XRD pattern indicated the complete conversion to the desired perovskite phases. The temperature has been selected on the basis of the literature review [36]. Figure 1 represents the main stages of the preparation of the examined samples.

2.3. Catalysts Characterization

Powder XRD patterns were registered at room temperature with a Bruker D8 Advance (Berlin, Germany) X-ray powder diffractometer with a Cu Ka radiation (k = 1.54056 Å) with a LynxEye solid position sensitive detector and X-ray tube operated at 40 kV and 40 mA. X-ray diffraction patterns were recorded in the range of 5.3–80° 1 h with a step of 0.02° 2 h. The infrared spectra were made in the range 1600–400 cm−1 using the KBr pellet technique on a Nicolet-320 FTIR spectrometer (Madison, WI, USA) with 64 scans and a resolution of ±1 cm−1. The UV–VIS diffused reflectance Spectrophotometer Evolution 300 (Thermo Electron Corporation, Madison, WI, USA) with a magnesium oxide reflectance standard as the baseline was used for recording the optical absorption spectra of the powdered samples in the wavelength range 200–600 nm. The band gap energy was calculated using the Kubelka-Munk theory and Tauc’s plots (ℎνF(R∞))n = A(ℎν − Eg), where F(R∞) is the Kubelka-Munk function, A is a constant independent of ℎν, Eg is the semiconductor band gap, and n depends on the type of transition [37]. The approach for semiconductor band gap energy determination from the intersection of linear fits of (F(R∞))1/n versus hv on the x-axis was used, where n can be 1/2 and 2 for direct and indirect band gaps, respectively. The as-obtained gels, along with the heated samples, were imaged by a scanning electron microscope (SEM) JSM-5510 (JEOL, Tokyo, Japan), operated at 10 kV of acceleration voltage. The investigated samples were coated with gold by JFC-1200 fine coater (JEOL, Tokyo, Japan) before observation. The energy dispersive X-ray spectroscopy (EDS) analysis was carried out on a Zeiss Evo 15 microscope (Bruker Resolution 126 eV, Berlin, Germany). The textural properties of the produced materials were derived from the adsorption–desorption isotherms obtained by low-temperature N2 adsorption at 77 K on the Quantachrome Nova 1200e instrument (Boynton Beach, FL, USA). The specific surface area was determined by the BET equation, the total pore volume was calculated at the end of the isotherm close p/p0 ≈ 0.99, and the mean pore diameter was determined by NLDFT (slit pores, equilibrium model). The pore size distributions were made by NLDFT (slit pores, equilibrium model).

2.4. Photocatalytic Activity Tests

The photocatalytic activity of the as-prepared powdered photocatalysts was tested for the degradation of tetracycline hydrochloride (TCH) and Malachite green (MG) under UV light (Sylvania 18 W fluorescence blacklight, λmax = 365 nm, Wilmington, MA, USA) and visible light illumination (Schott KL-2500, Los Angeles, CA, USA), both situated 7 cm above the slurry. The height of the slurry layer in the photoreactor was maintained at approximately 2 cm. A model TCH solution in ultra-pure water (18.2 MΩ) with concentration 10 ppm and volume 200 mL was prepared. The same concentration and model solution have been prepared for the MG as well. The solution was stirred by a magnetic stirrer in a batch slurry reactor (Lenz Laborglas glass, KL-100, Solana Beach, CA, USA) connected to a circulating bath (ArgoLab CB5-10, Modena, Italy), keeping a constant temperature of 25 ± 0.1 °C. After adding 0.1 g of the catalyst, a 30 min “dark” period followed to establish the sorption-desorption equilibrium. The reaction time was 60 min under the irradiation of the light source. Every 10 min, a 3 mL sample of the solution was extracted and filtered by a 0.22 µm membrane syringe filter to remove the catalyst from the solution. All samples taken were then measured for the concentration of TCH and Malachite green by a UV-Vis spectrophotometer (Thermo Scientific, Evolution 300, Madison, WI, USA) with an absorption peak of 355 nm (TCL) and 614 nm (MG). A C/C0 vs. time graph was plotted to show the degradation of the pollutant, and a Langmuir-Hinshelwood kinetic model (−ln(C/C0 vs. time plot) was used to determine the rate constant of the reaction (assuming first-order kinetics). The initial concentration C0 is the concentration after the dark period. The adsorption efficiency has been calculated following the formula = {(C00 − C0)/C00} × 100, where C00 is the concentration of the pollutant before the dark period.

2.5. Antibacterial Testing

To evaluate the antibacterial properties of the sample, two bacterial strains—Escherichica coli ATCC 25922 and Pseudomonas aeruginosa ATCC 27853 were used. These strains were selected due to their medical significance and representation of Gram-negative bacteria with different intrinsic resistance mechanisms. The antibacterial potential of the tested nanopowders was assessed using both qualitative and quantitative methods. A spot test assay was performed at two time intervals- after 3 h and after 24 h of exposure—to monitor both immediate and sustained antibacterial effects.
For quantitative analysis, the minimum inhibitory concentration (MIC) and minimum bactericidal concentration (MBC) of the nanopowders were determined using the broth microdilution method [38]. Prior to testing, bacterial suspensions were adjusted to a turbidity equivalent to 0.5 on the McFarland scale, ensuring a standardized bacterial density of approximately 1.5 × 10⁸ CFU/mL. The nanoparticles were dispersed by an ultrasonic bath (Sonorex Bandelin, Berlin, Germany) at 35 kHz for 60 min at room temperature. The ultrasound treatment served both to disperse the nanoparticles and to reduce potential microbial contamination.
The assay was conducted in a 96-well plate, with each well containing 100 μL of the standardized bacterial suspension and 100 μL of nanopowder solution prepared at different concentrations. Control wells containing only the bacterial culture without nanopowders were included to confirm the viability and growth of untreated bacteria. The plates were incubated under aerobic conditions at 35 ± 2 °C for 18 to 24 h.
After incubation, the antibacterial effect was further evaluated by performing tenfold serial dilutions of the treated bacterial cultures, which were then plated on Mueller-Hinton agar to determine the number of surviving bacteria. The MBC was defined as the lowest concentration of the sample that resulted in a ≥99.9% reduction in colony-forming units per milliliter (CFU/mL), indicating effective bacterial killing. In contrast, the MIC was established as the lowest concentration at which visible bacterial growth was inhibited. The surviving bacterial population was quantified using the formula:
CFU/mL = (number of colonies × dilution factor)/volume of inoculum (1), providing a reliable measure of the bacteriostatic and bactericidal capabilities of the samples against E. coli and P. aeruginosa.

3. Results and Discussion

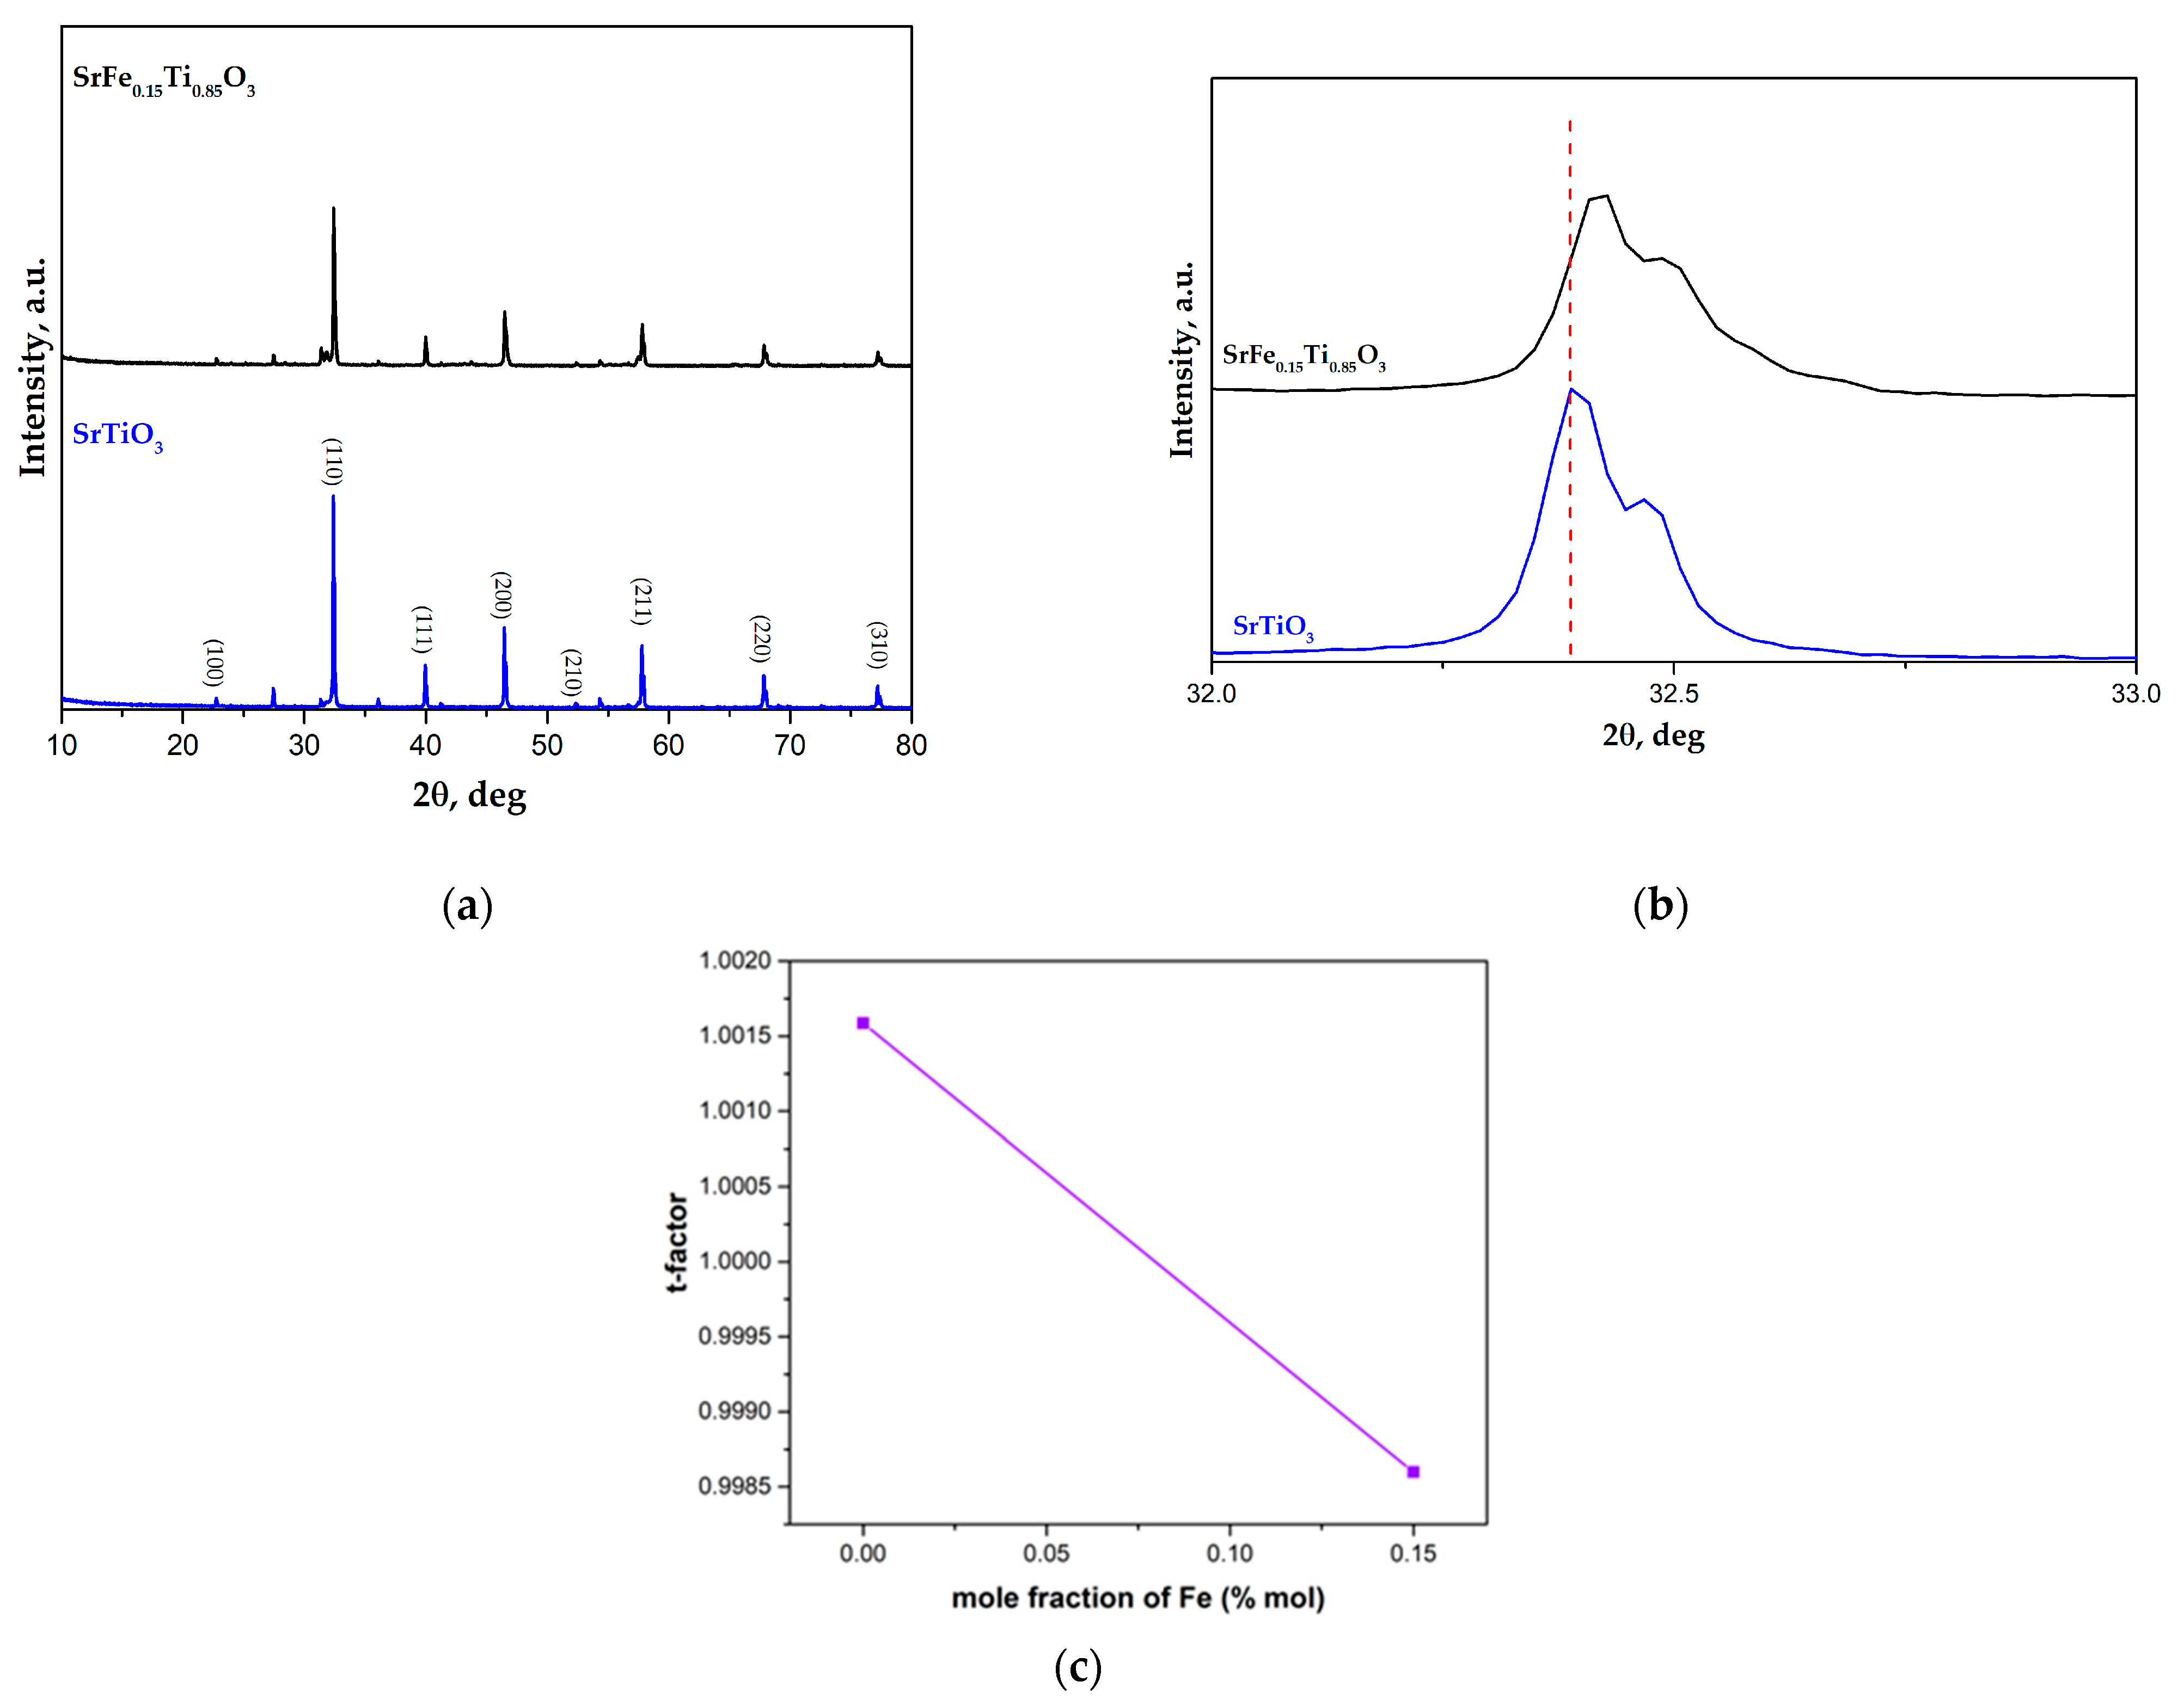
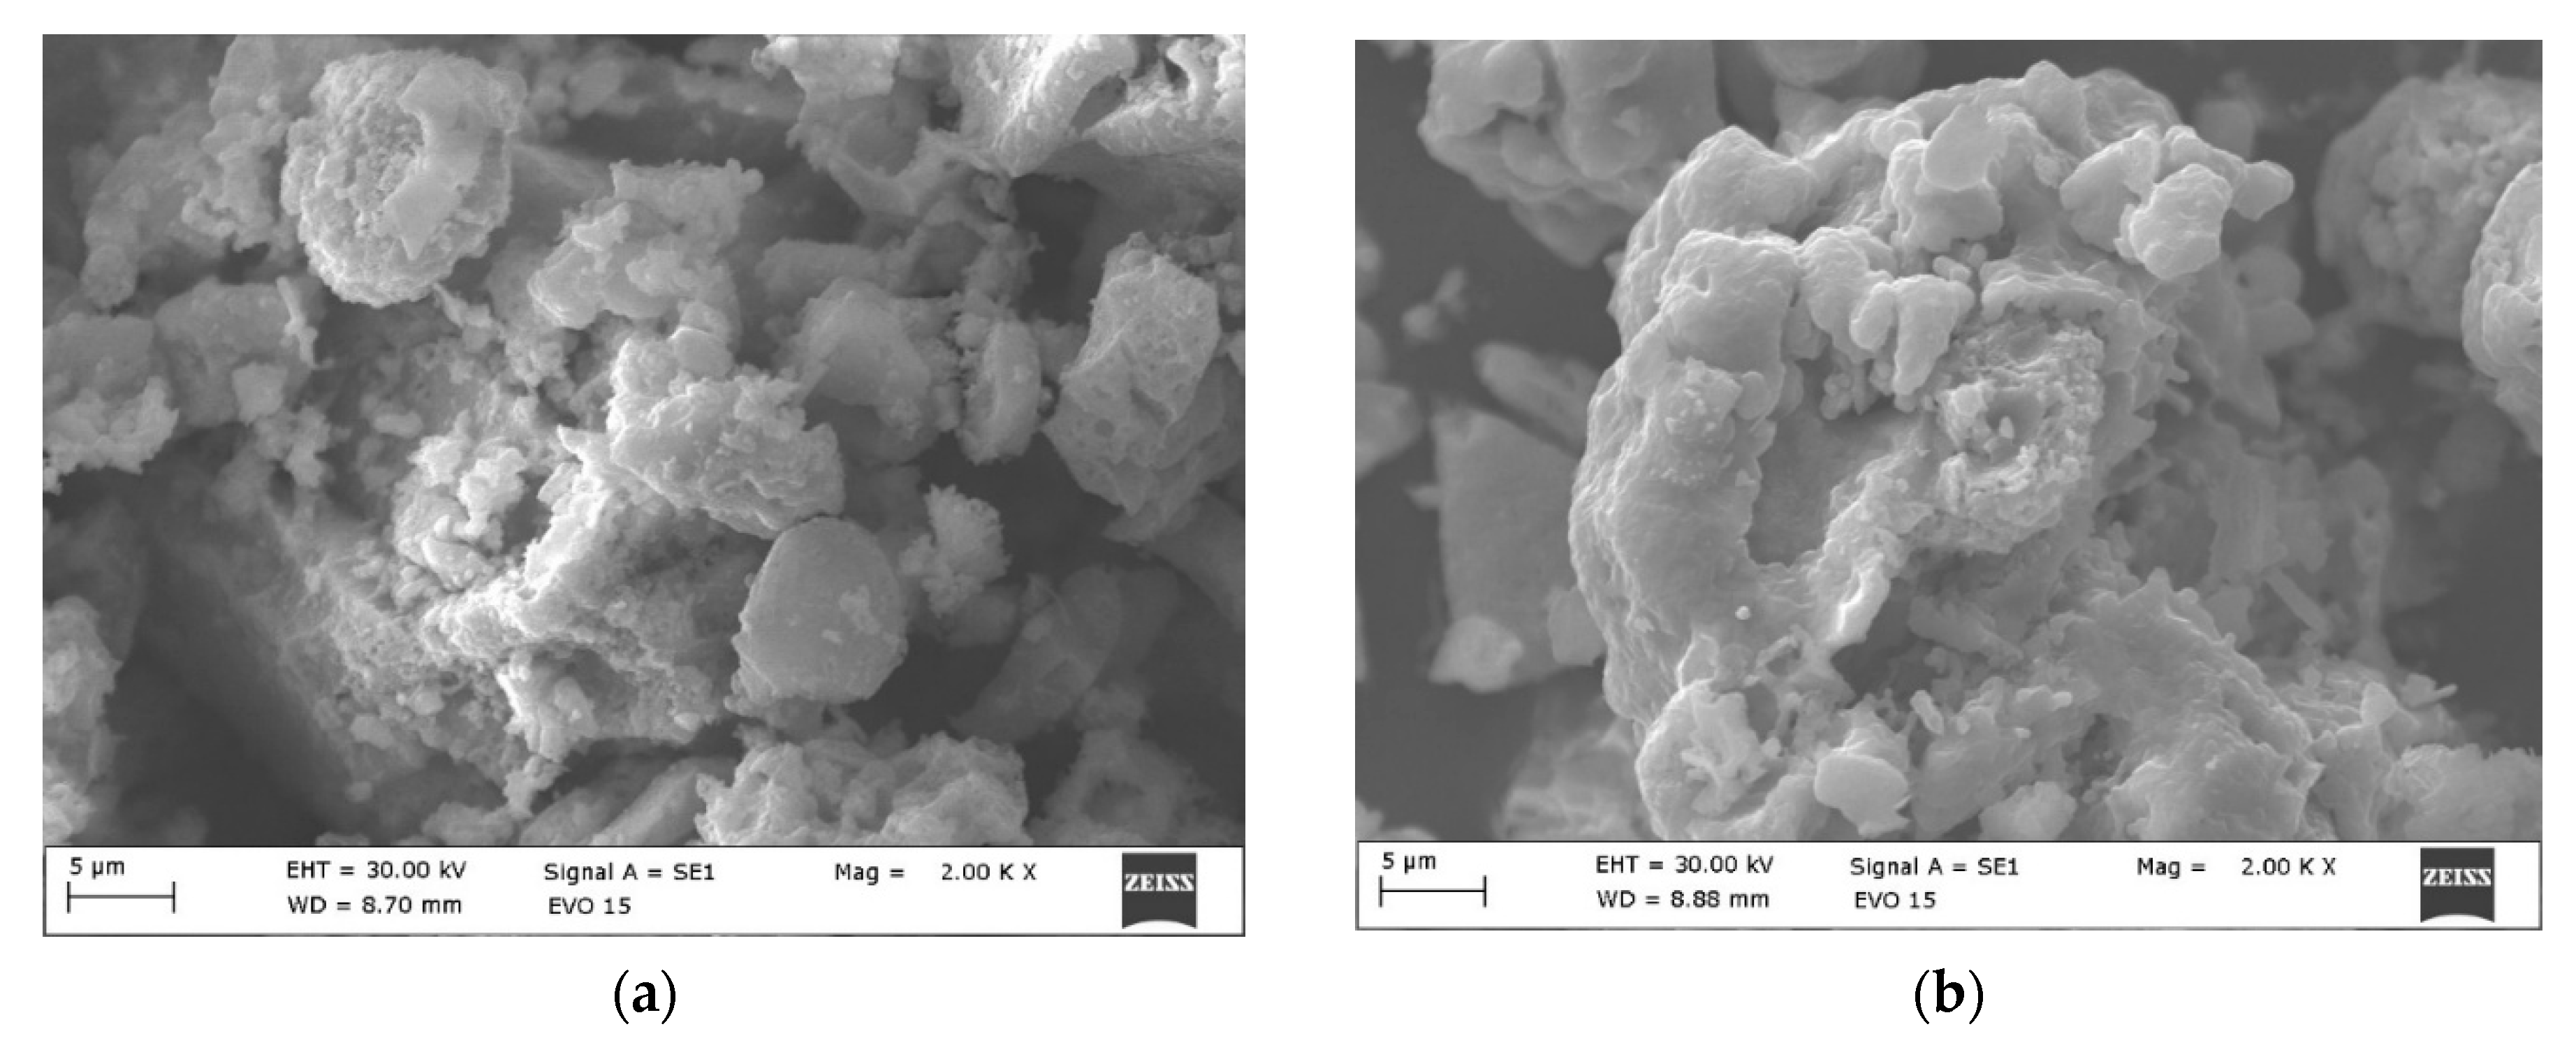
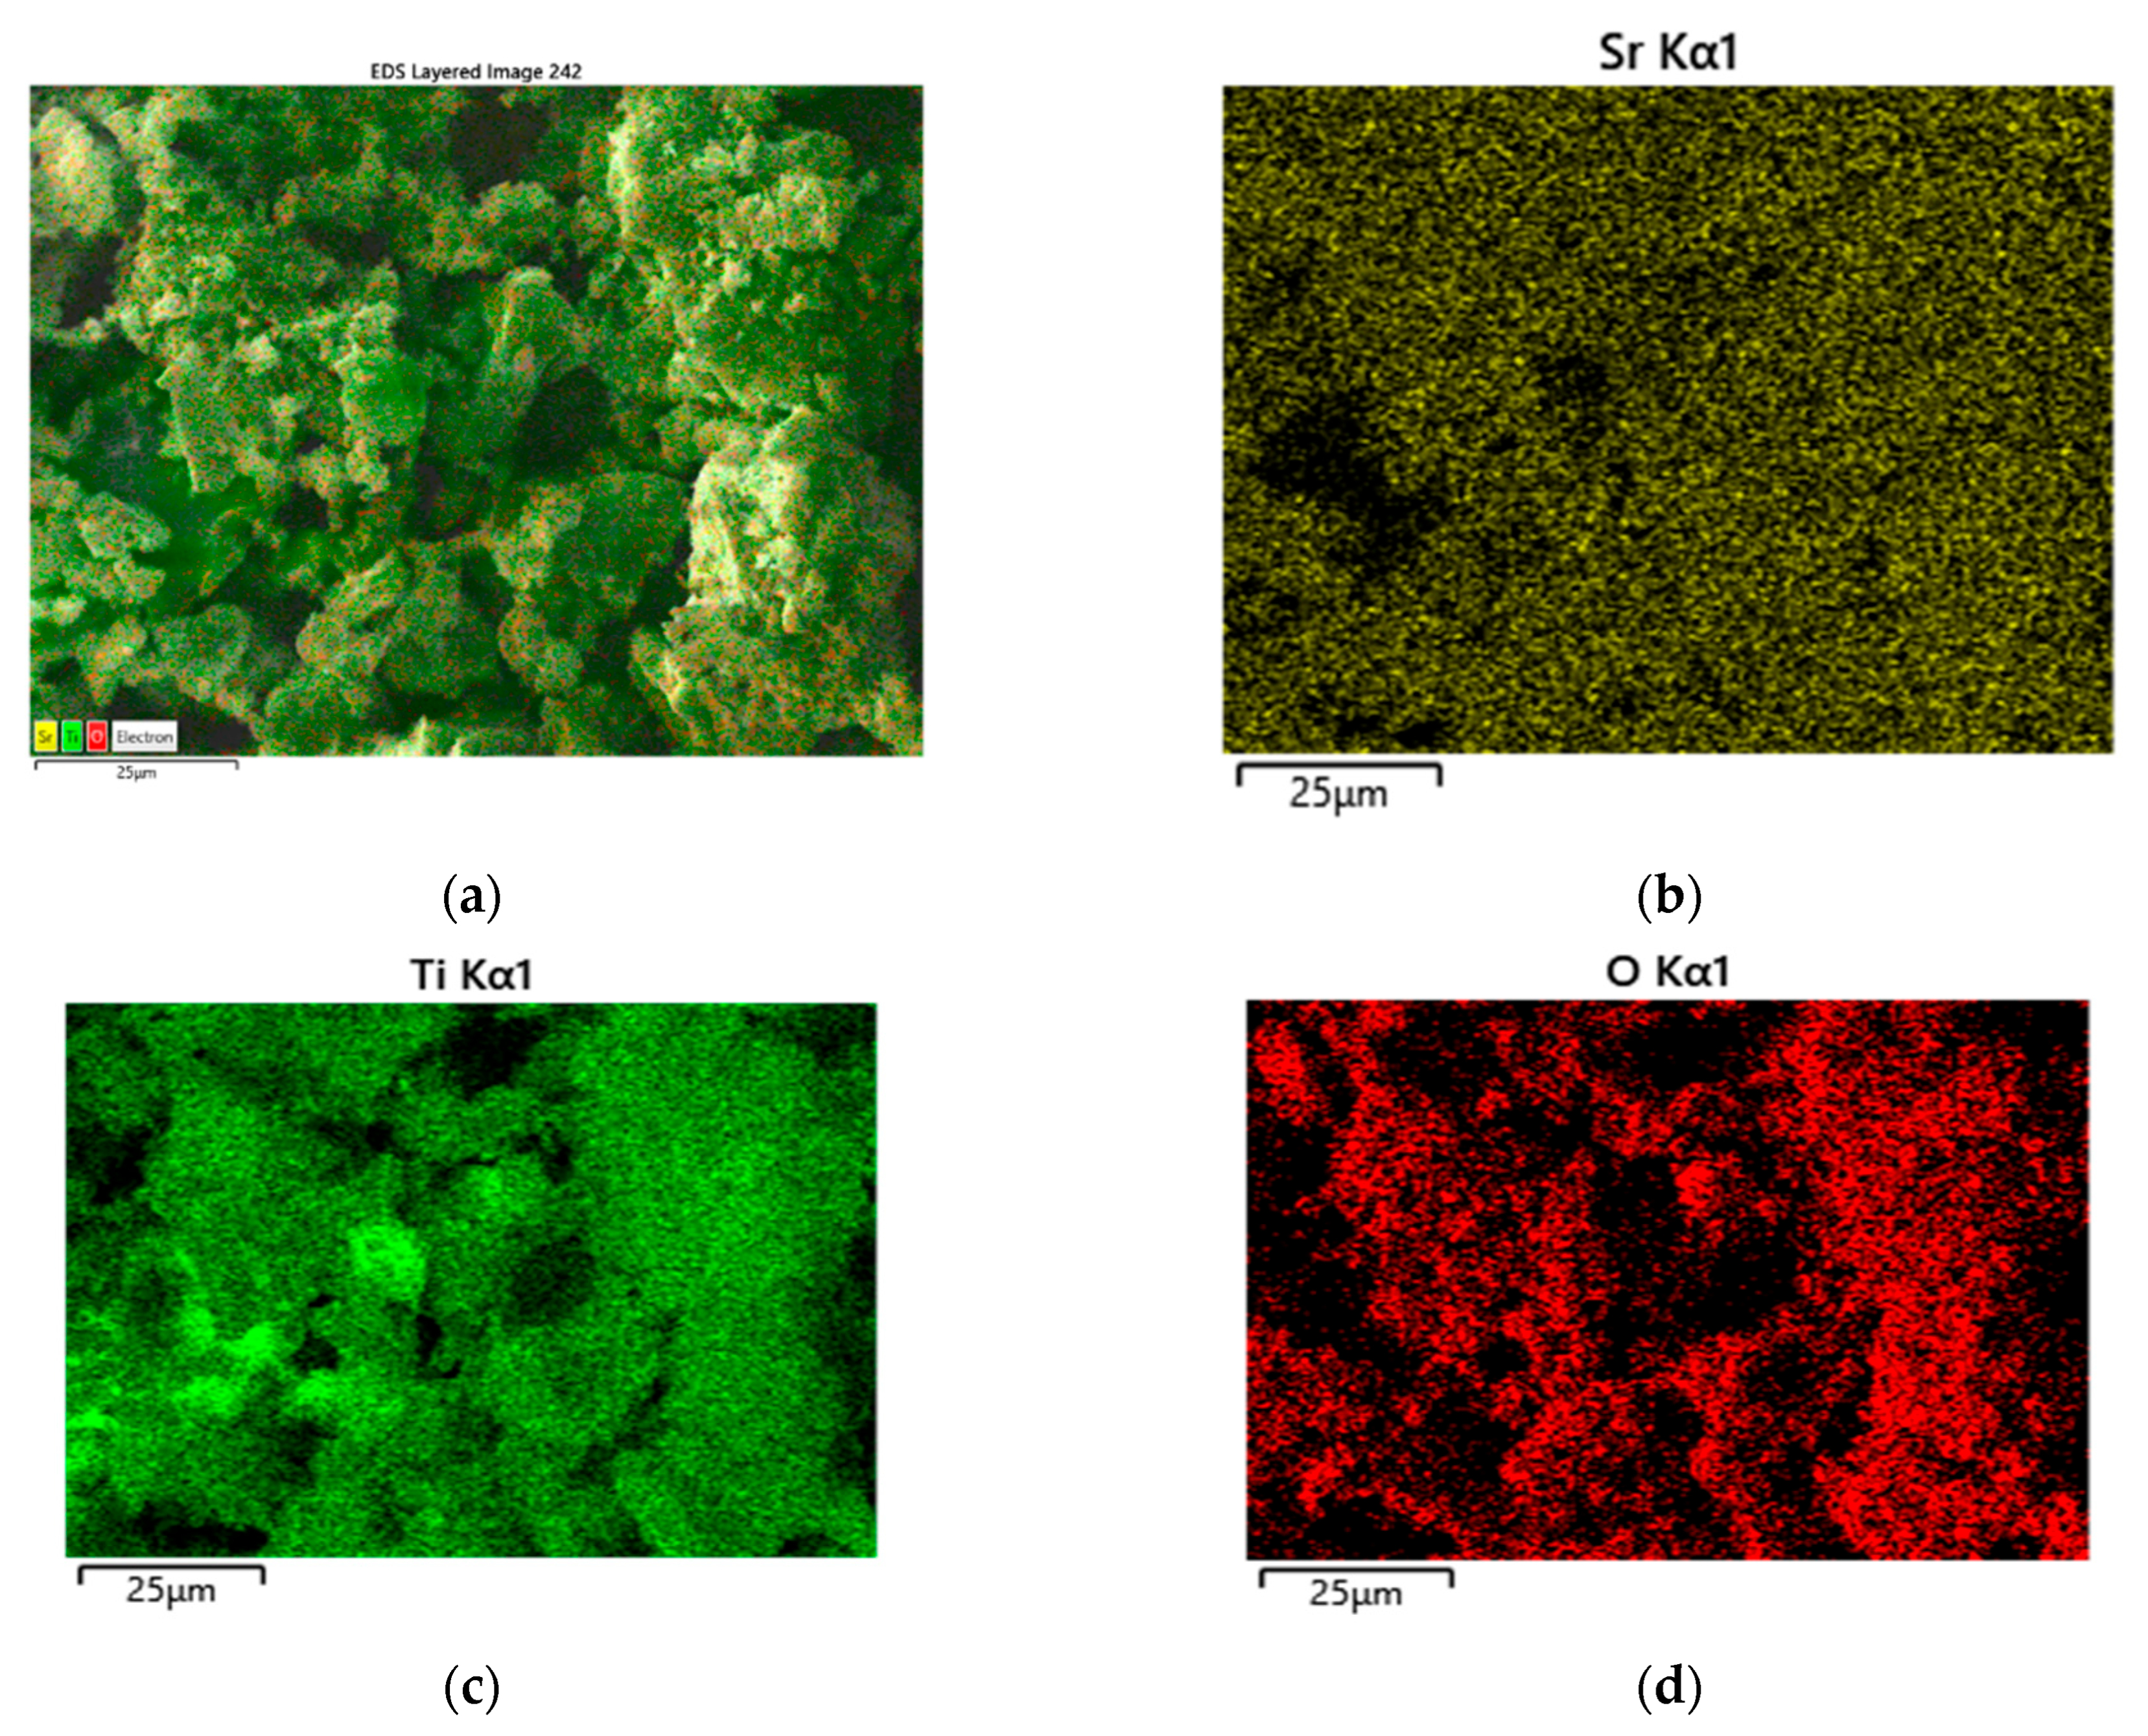
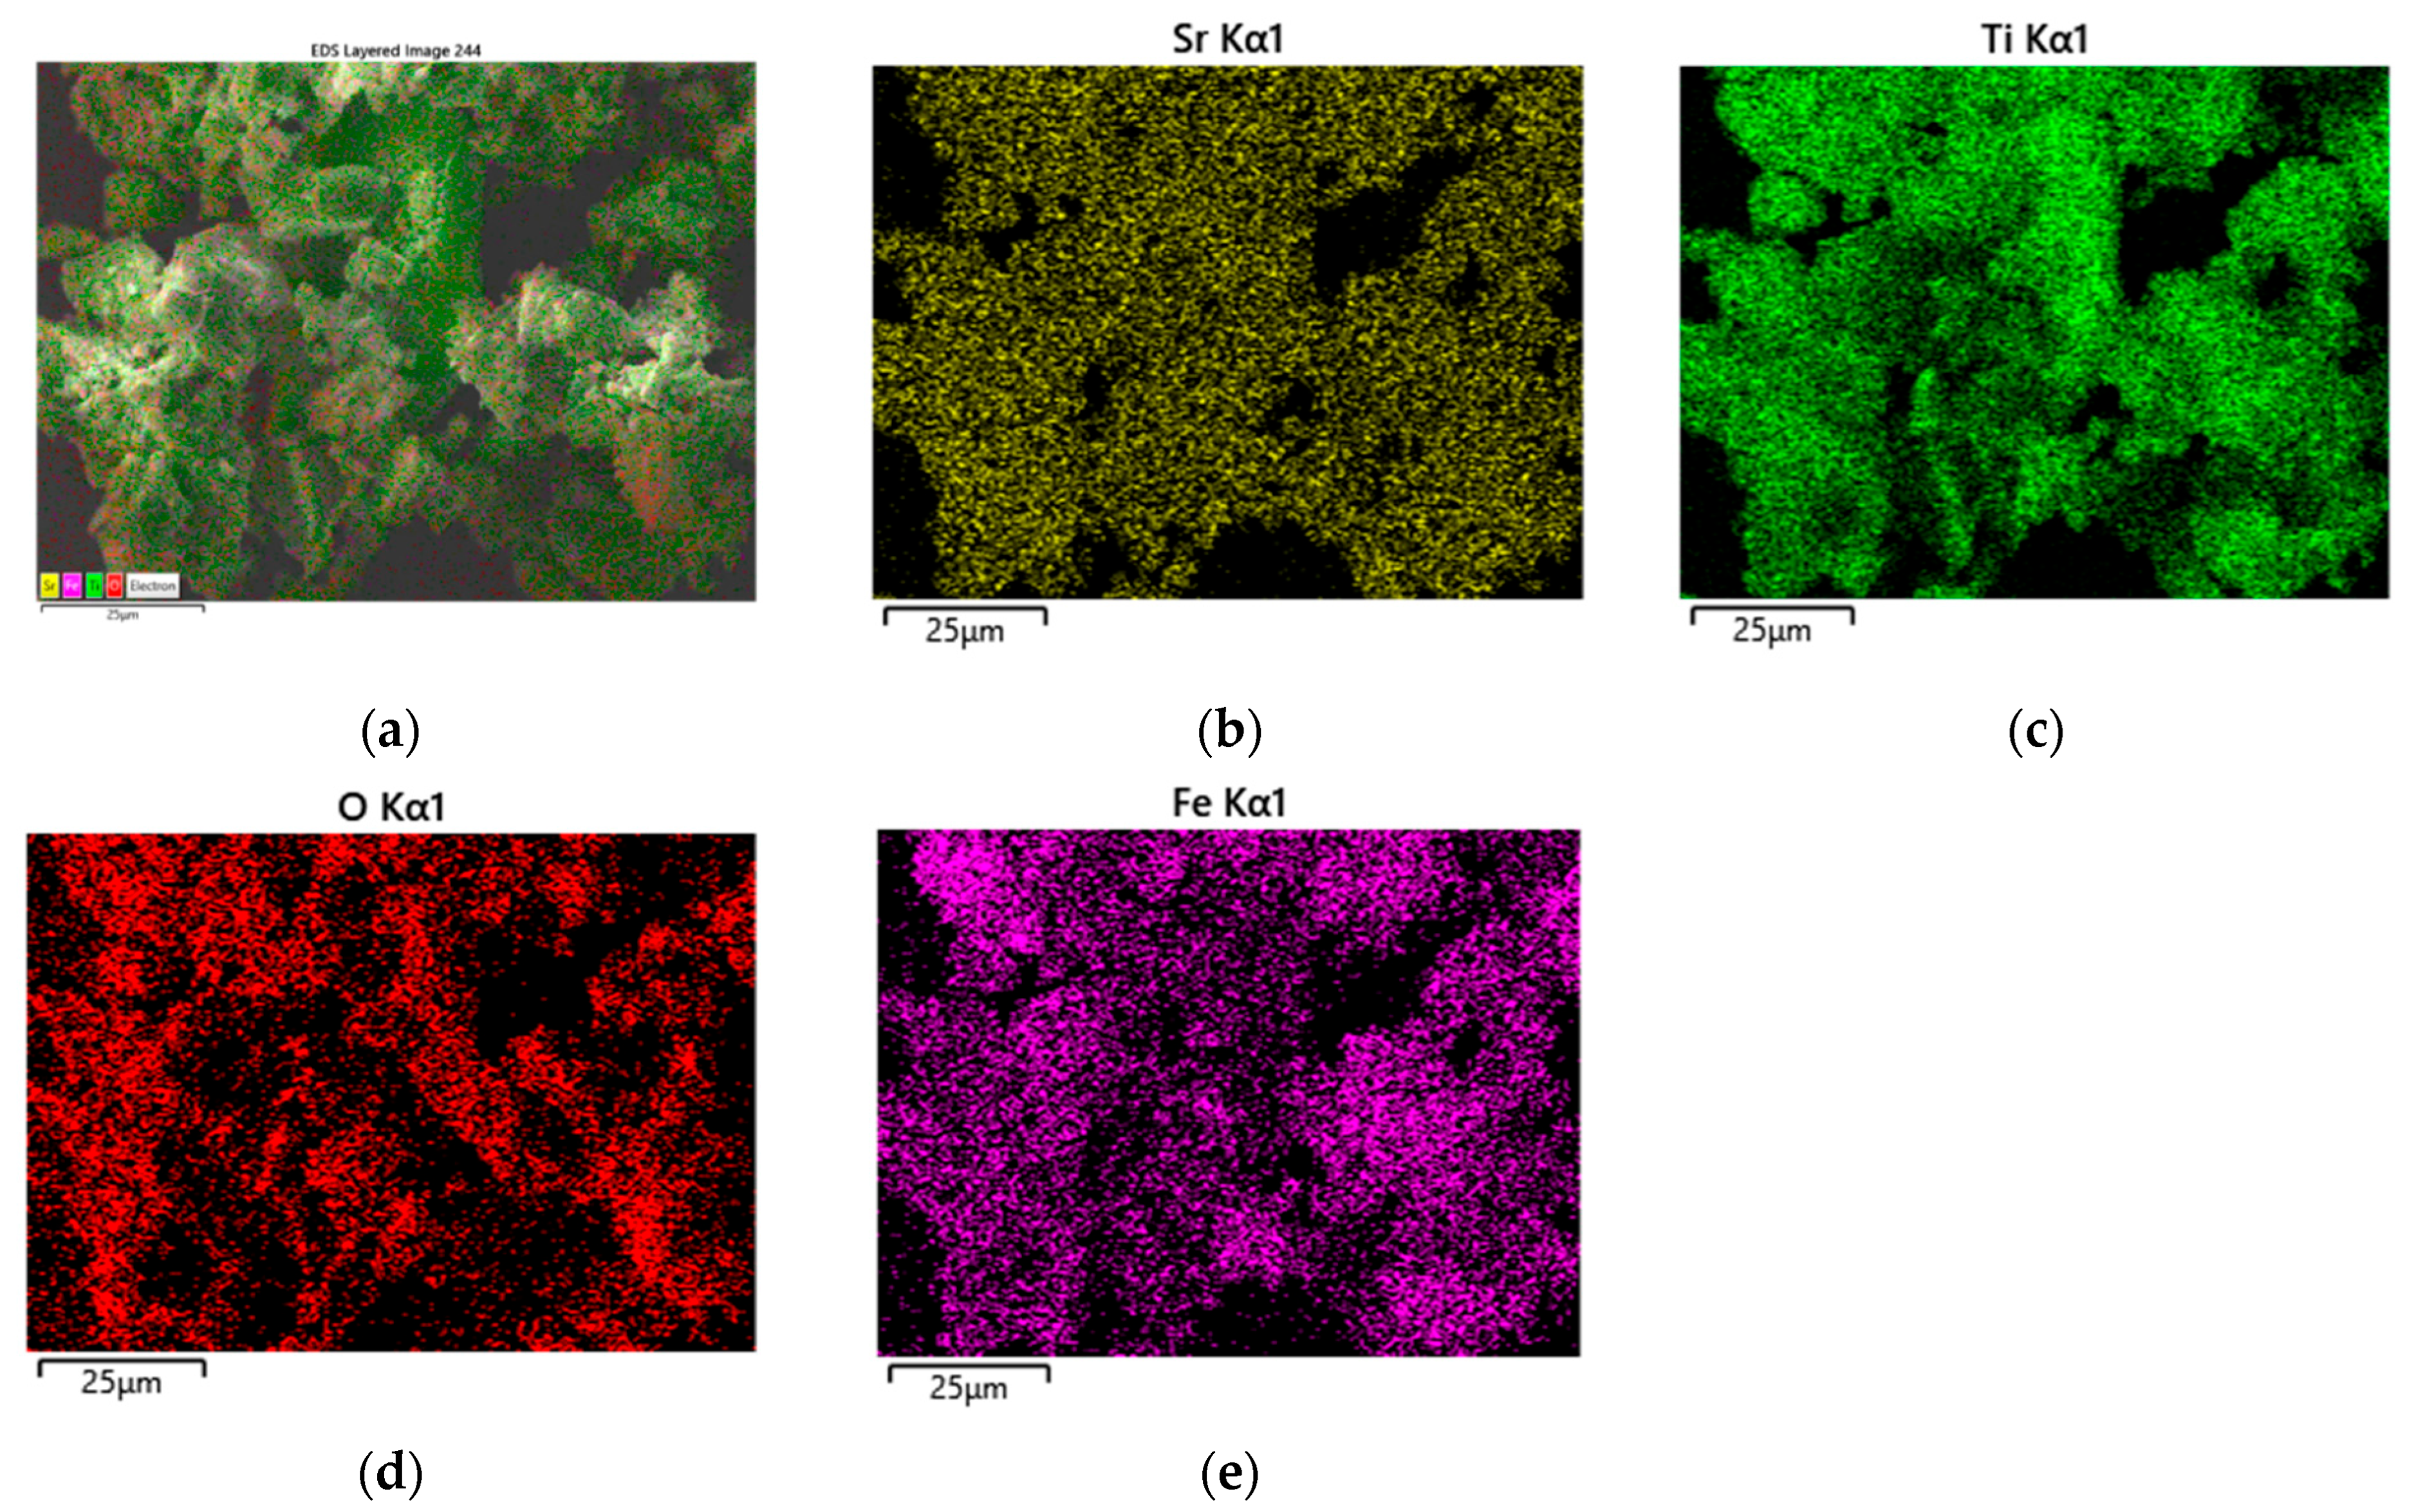
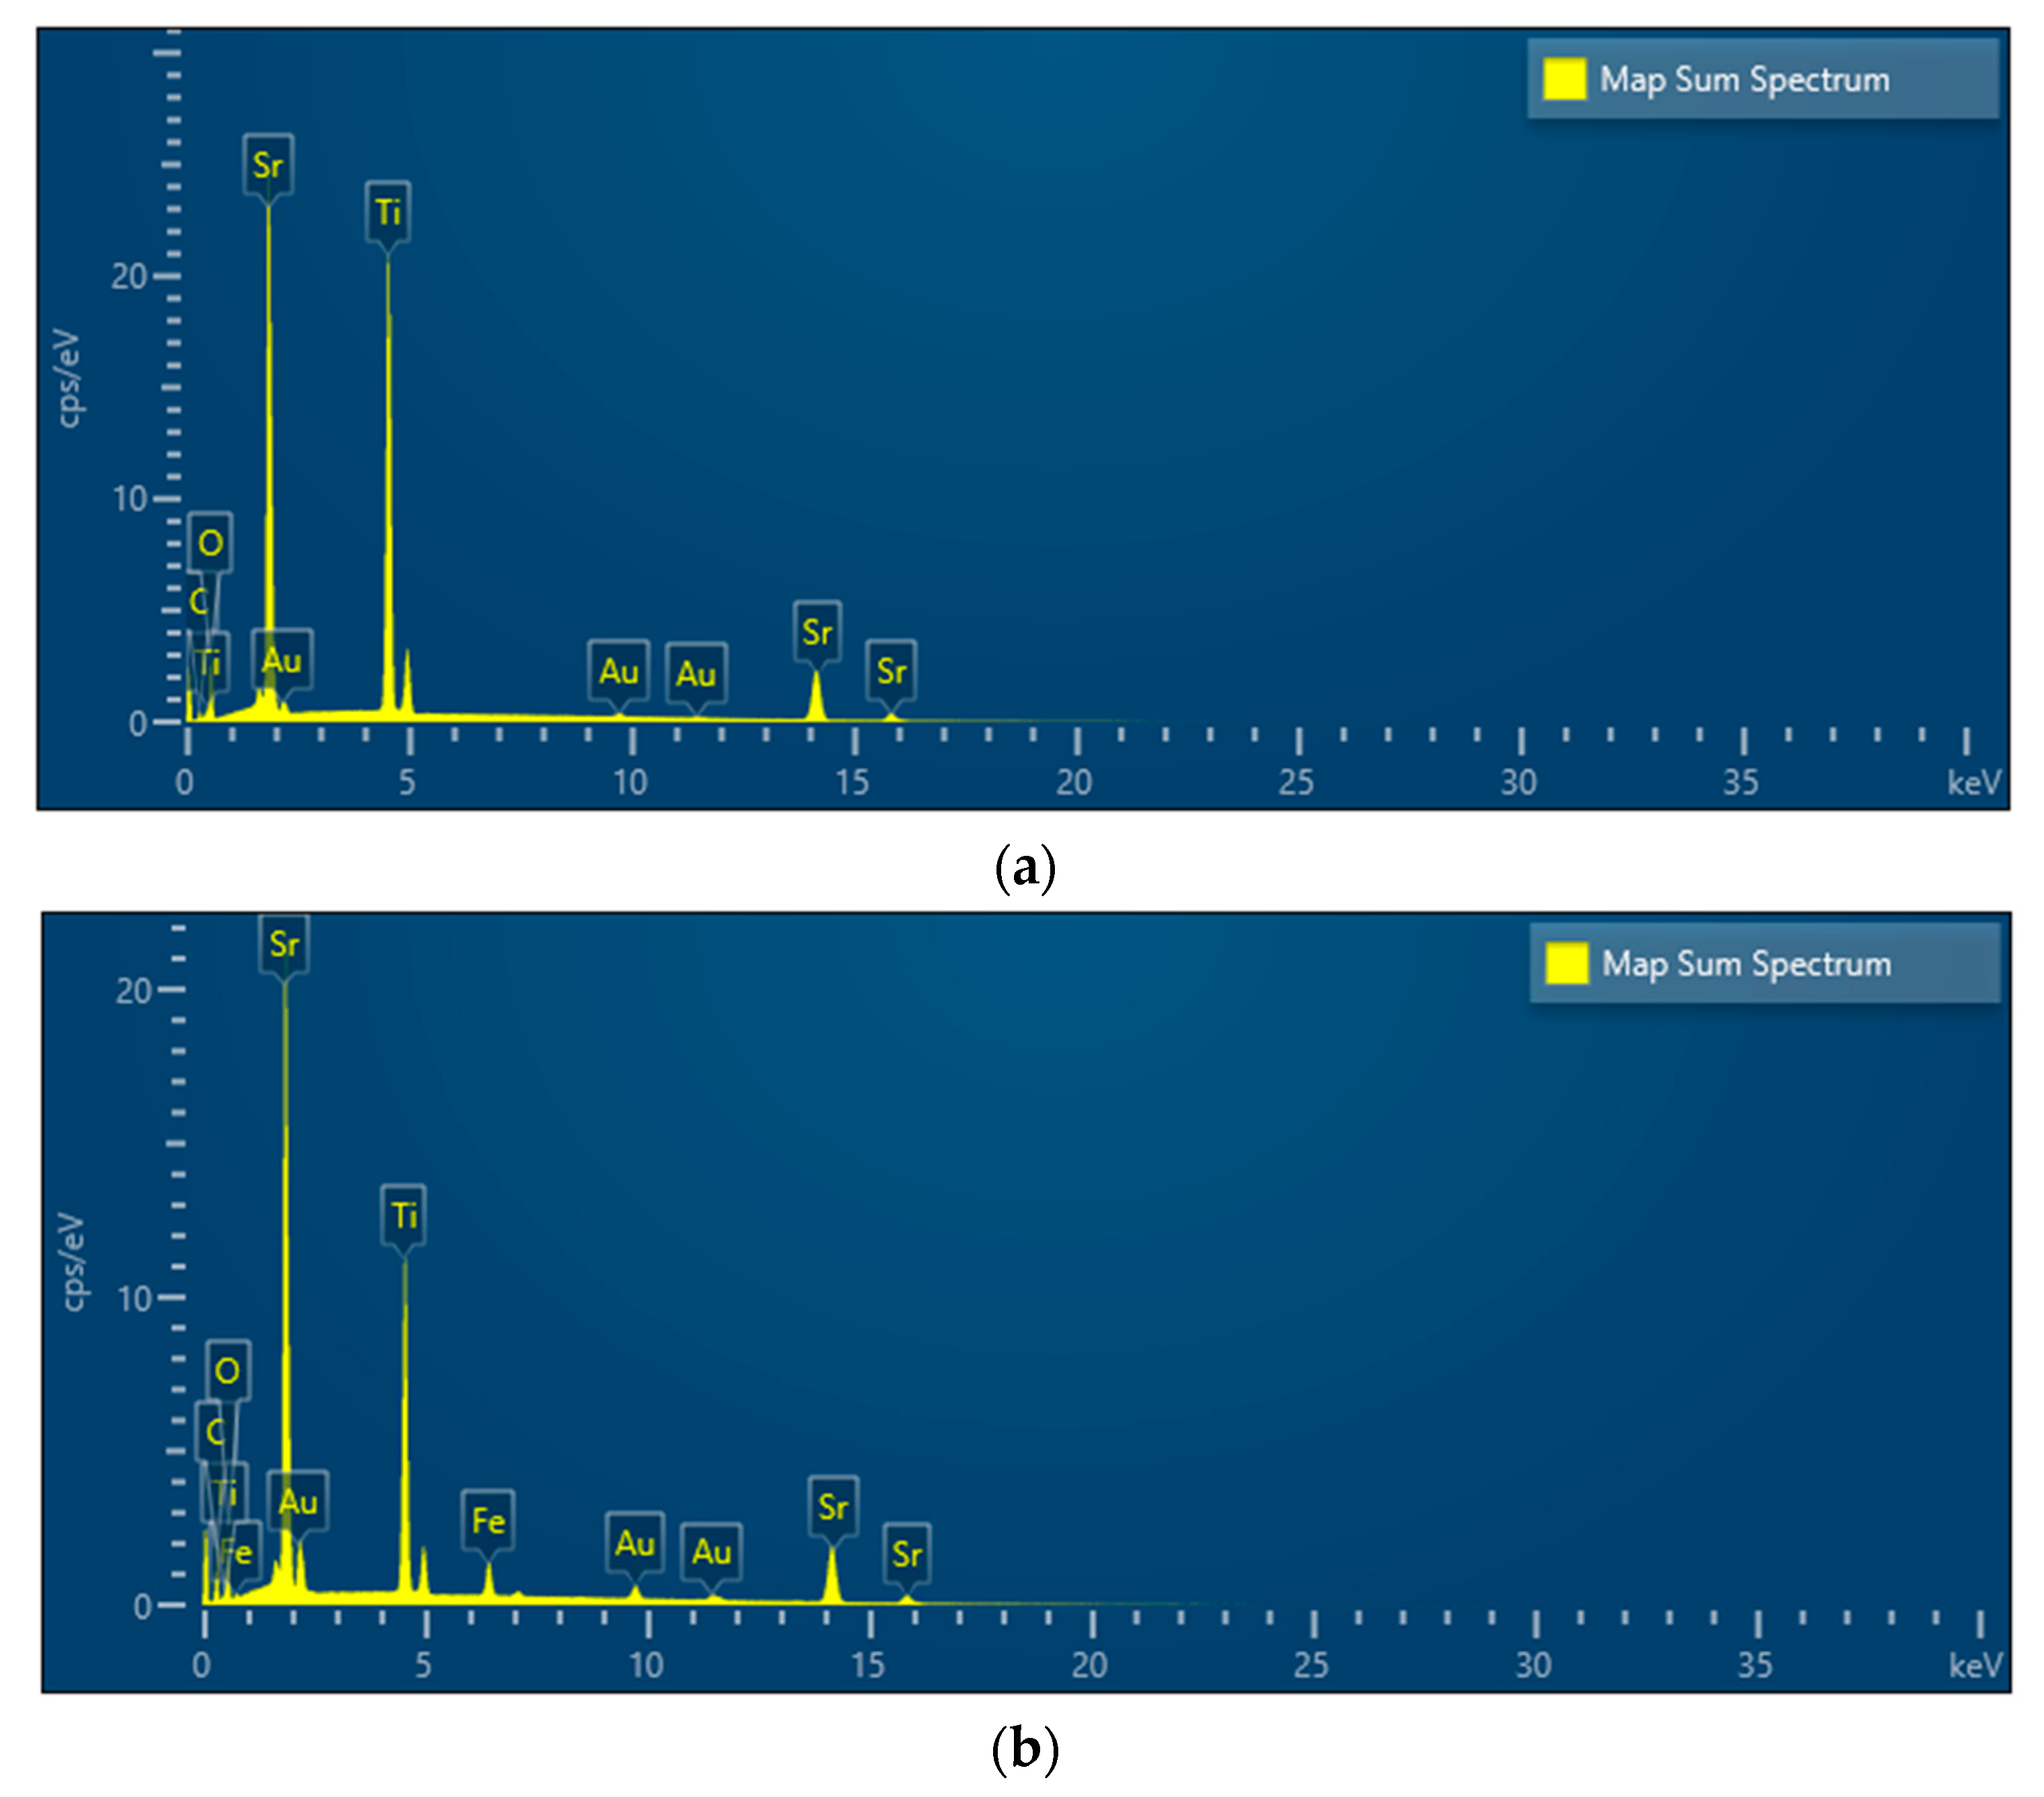
3.1. XRD and SEM Morphology of the Prepared Catalysts

The X-ray diffraction patterns of the prepared samples SrTiO3 (STO) and SrFe0.15Ti0.85O3 (SFTO) are shown in Figure 2. A magnification of the (110) Bragg reflection is shown in Figure 2b, where the shift of the peak is observed towards lower 2theta. All peaks of the cubic crystal system corresponding to the space group Pm-3m were indexed for both samples—SrTiO3 ICDD card 120 900-6864 and for SrFe1−XTiXO3 ICDD card 153-0017. This observation aligns with expectations, considering that the unit cell parameter for SrFeO3 is 3.85086 Å (ICSD 92335), whereas for pure SrTiO3, it is 3.911 Å (ICSD 187480). Small amounts of impurities consisting mainly of TiO2 (rutile ICDD 75-1537) were observed. In the literature, the amount of iron (Fe) incorporated into SrFeTiO-type perovskites varies between 1 to above 50 mol%, and its amount is often chosen based on the desired property. There are scarce investigations concerning the perovskites doped with middle-range Fe content (15–20 mol %). These results proved the previous findings that the Fe doping up to 20 mol % retains the cubic Pm-3m structure [39].
The observed shift of the main diffraction peak toward higher 2θ angles in the Fe-doped SrTiO3 sample (SrFe0.15Ti0.85O3) compared to the undoped SrTiO3 (Figure 2b) can be attributed to a reduction in the lattice parameter upon Fe substitution. According to Vegard’s law, the substitution of smaller Fe3+ ions (ionic radius ~0.645 Å in octahedral coordination) in place of larger Ti4+ ions (~0.605 Å for high-spin Fe3+, or even smaller for Fe4+) in the perovskite lattice leads to a decrease in unit cell dimensions [40]. This lattice contraction results in a shift of the diffraction peaks to higher angles.
The contraction of the lattice introduces local structural distortions, which can significantly impact the electronic structure and catalytic properties of the material. These distortions may increase the overall crystal energy and generate new surface-active sites, either by modifying the local coordination environment or by creating oxygen vacancies associated with charge compensation [41]. The Fe–O bonds formed in the doped structure may differ in bond length and strength from the original Ti–O bonds, thereby altering the electronic density distribution and enhancing the material’s adsorption properties.
These newly formed Fe–O bonds and lattice distortions may act as preferential adsorption sites for target molecules, promoting stronger interactions and facilitating photocatalytic activation [42]. In addition, the increased lattice strain can enhance charge carrier separation and transport, contributing to the generation of more reactive oxygen species (ROS) under light irradiation [43].
Thus, the shift in 2θ, as per Vegard’s law, is not only an indicator of Fe incorporation into the SrTiO3 lattice but also provides indirect evidence for the generation of structurally and chemically active sites that could predict good photocatalytic and antibacterial performance of the materials [44].
As it is known, the substances of the perovskite structure type are normally defined by the tolerance factor (t-factor), which is calculated by the Goldsmith formula (Figure 2c) [45]. Generally, the perovskite structure with cubic symmetry has an allowable range of t-factor of 0.9–1.0 [46]. Due to the difference in radius and valence between Fe and Ti elements, the lattice structure is slightly distorted, but the original cubic symmetry in the perovskite structure is not changed. Thus, the calculated t-factors in Figure 2c depict a decrease in the value with the Fe doping. By introducing the Fe content, the tolerance factor decreases, which leads to an increase in the distortion in the crystal structure, thereby decreasing the angle between Fe-O-Fe and increasing the tilting of the FeO6 octahedron [47].
It is important to verify the morphology and materials composition, which has been performed by applying SEM (Figure 3a,b) and EDX mappings (Figure 4 and Figure 5). Figure 3a,b exhibit the SEM images of the areas from which EDX spectra were acquired. It is important to note that both samples showed a strong tendency towards agglomeration, and large perovskite crystals above 1 μm can be observed. Generally, Fe doping significantly influences the morphology of SrTiO3 perovskites, and it enhances surface complexity, especially when synthesized via sol-gel methods. It is reported that as the Fe content increases, particles tend to become more irregular in shape and more agglomerated, deviating from the smooth, spherical morphology typical of undoped SrTiO3. This is due to lattice distortions, oxygen vacancies, and defect formation introduced by Fe ions substitution at the B-site. It has been reported that at moderate doping levels (10–20 mol %), the crystallite size remains in the nanometer range (50–200 nm), but agglomeration increases [48,49]. The corresponding energy dispersive X-ray (EDX) elemental mapping (Figure 4 and Figure 5) confirms the presence of elements Sr, Ti, and O. In comparison to the sample STO, the presence of Fe has been detected additionally in the SrFe1−XTiXO3 one. A homogeneous distribution of all elements is observed as well. The presence of all elements observed is shown in Figure 6.

3.2. Low-Temperature Nitrogen Adsorption

The textural properties of the investigated samples were assessed using low-temperature nitrogen adsorption. The adsorption–desorption isotherms of SrTiO3 and SrFe0.15Ti0.85O3 are presented in Figure 7a,b and the pore size distributions are shown as insets for both samples. The texture parameters of the above samples are placed in Table 1. According to the IUPAC classification, the sample isotherm can be classified as a Type II isotherm, which is typical for mesoporous or nonporous materials, and exhibits a hysteresis loop of type H3, which is associated with non-rigid aggregates of plate-like or slit-shaped pores [50]. The obtained experimental data showed that SrTiO3 has a relatively compact surface area (4 m2/g) and moderately sized pores (24 nm), which suggests a mesoporous structure and a small total pore volume, which indicates a not so highly porous network. The introduction of small quantities of Fe3+ did not change the type of isotherm as well as the hysteresis, and preserved the structure of the materials. It has to be noted that the substitution of Ti4+ with Fe3+ leads to a slight decrease in the surface area, diameter pore size, and average diameter of the pores (Table 1). Having in mind that the ionic radii of Fe3+ (0.645 Å, high spin coordination number 6) is slightly larger than Ti4+ (0.605 Å) [51]. It may be suggested that the introduction of Fe could lead to a decrease in local lattice distortions. These findings are consistent with the information obtained from the XRD analysis. For both samples, it was observed that the maximum in the pore size distribution is at about 45–50 nm (Figure 7a,b—insets).

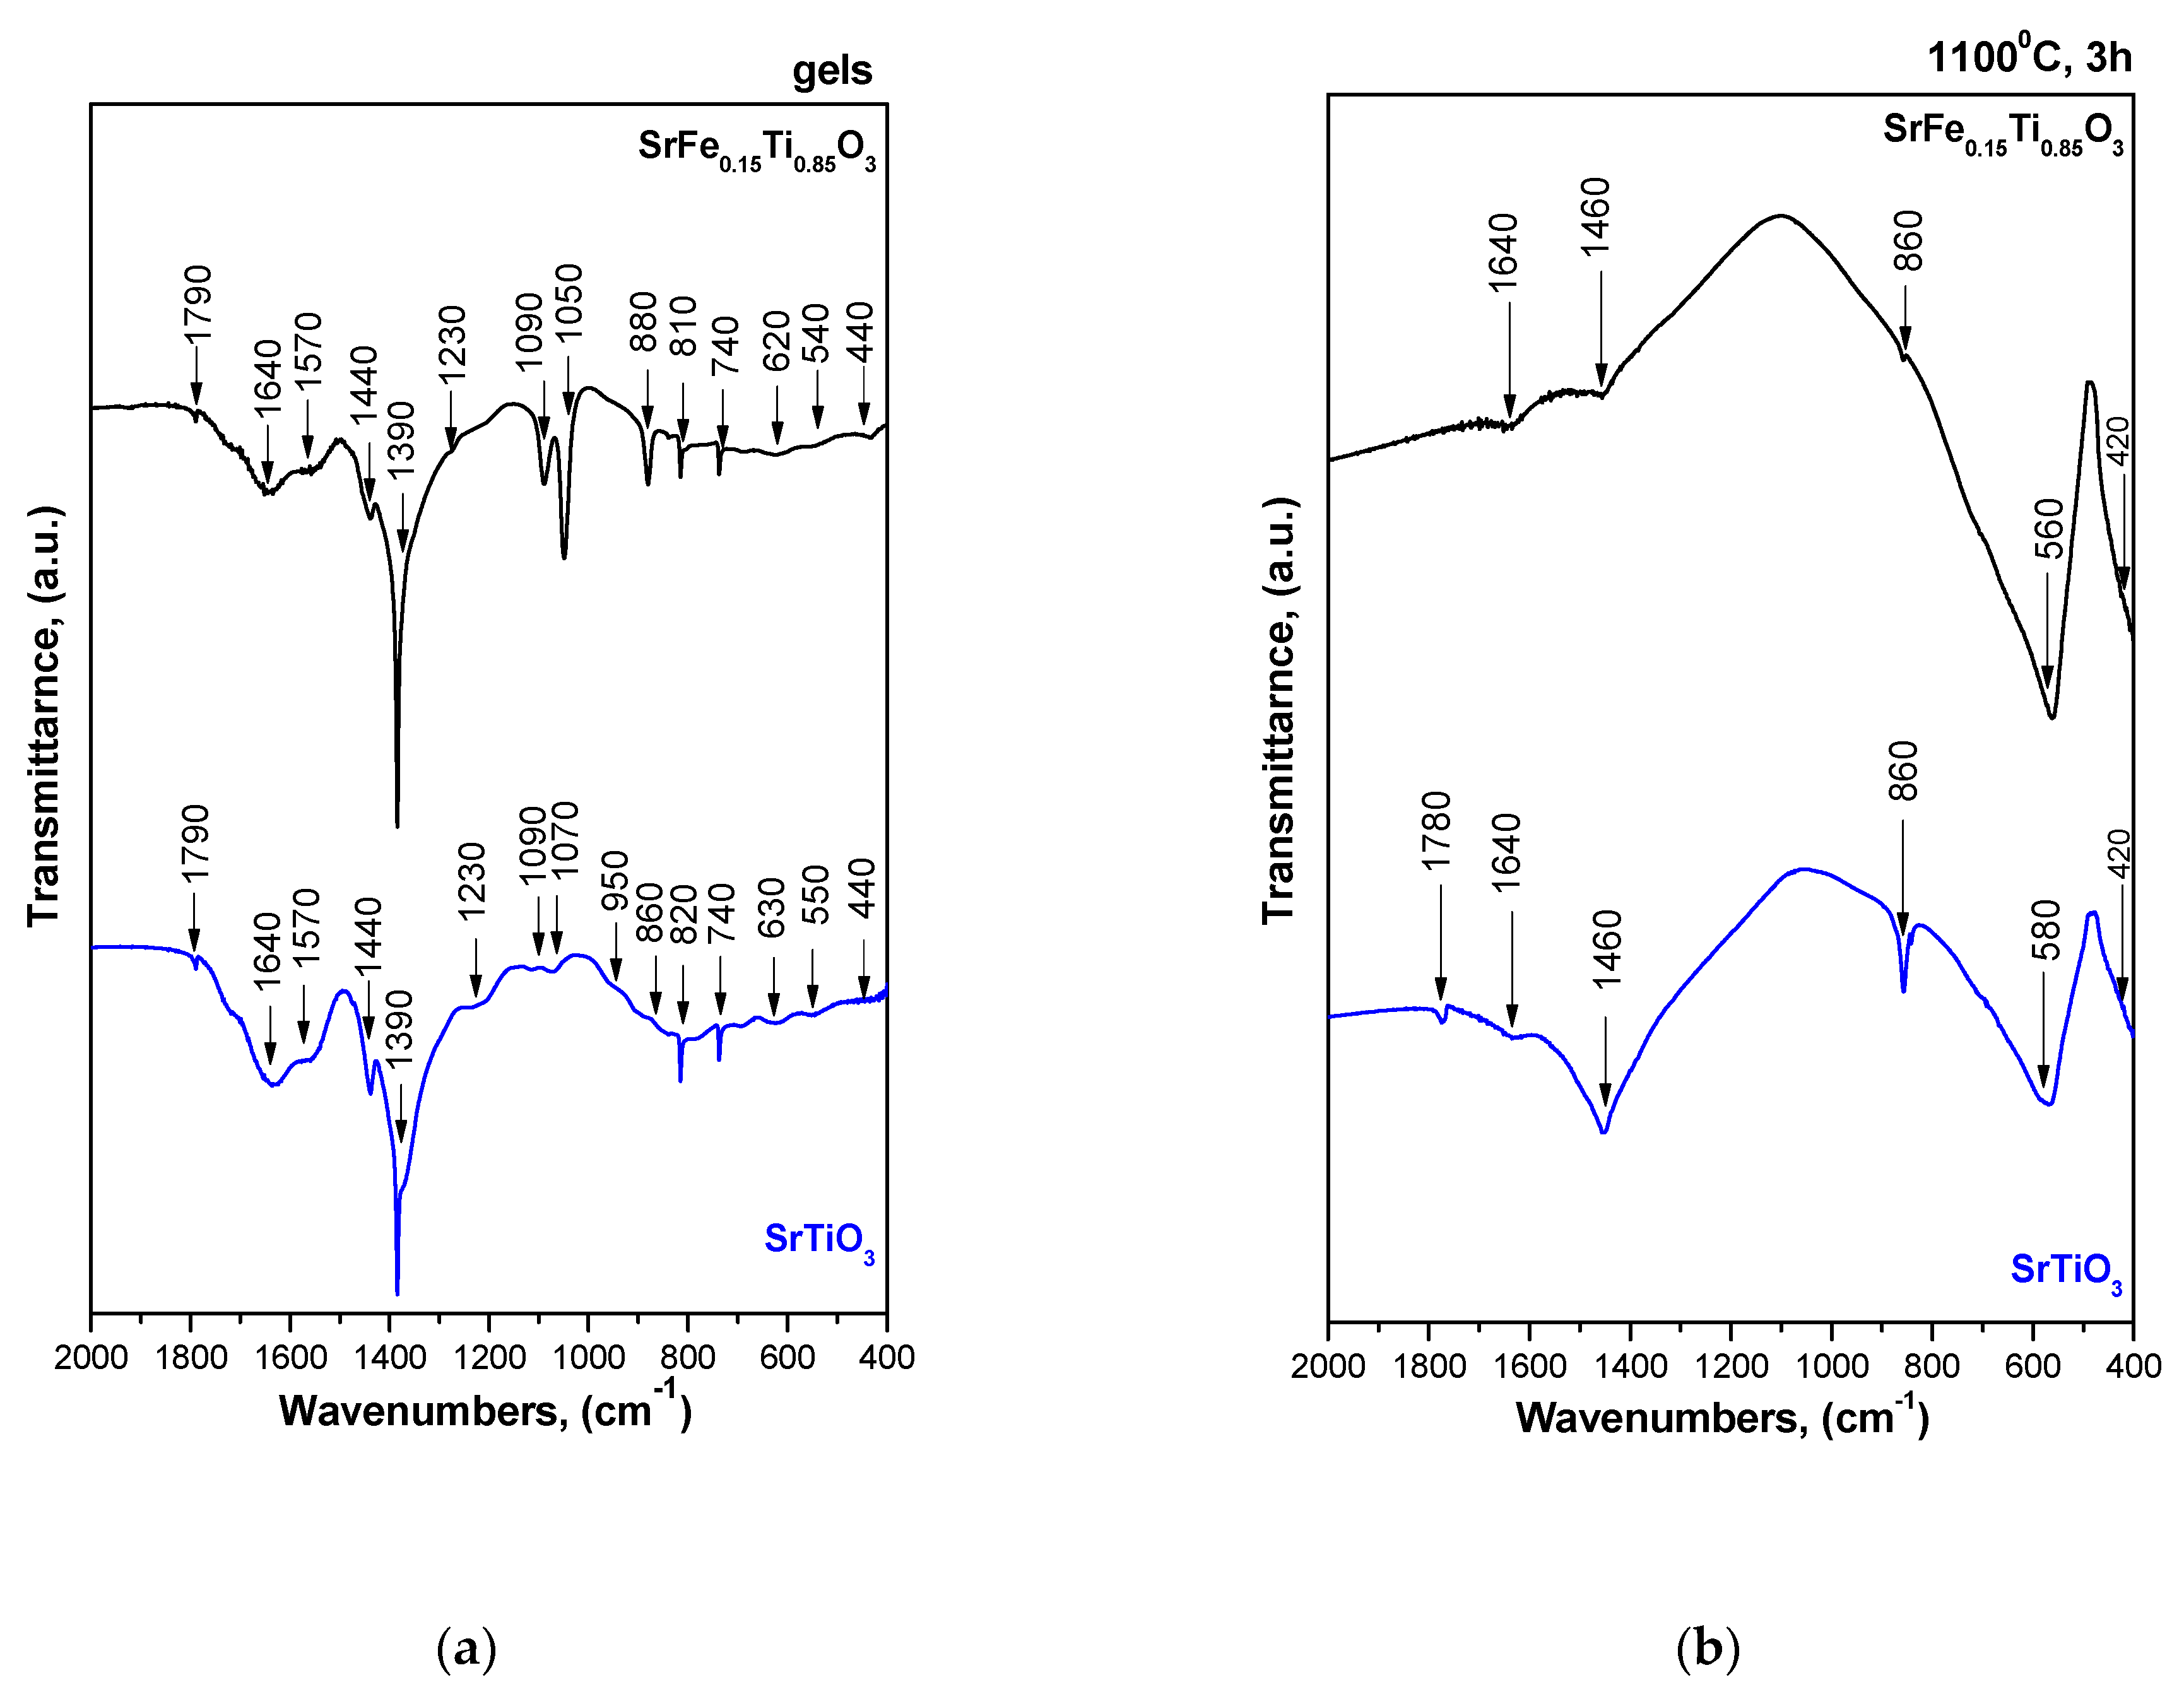
3.3. IR Structural Investigations

The IR spectroscopy is used in order to provide complementary information about the structure of the as-obtained catalysts, and the analysis demonstrates the presence of various characteristic functional groups. Figure 8a exhibits the IR spectra of the as-prepared at room temperature SrTiO3 and SrFe0.15Ti0.85O3 gels. As it is seen from the figure, the IR spectra of the gels exhibited various absorption bands which are more intensive as compared to those of the heated powders (Figure 8b). All IR spectra can be conditionally divided into two areas—below and above 1000 cm−1. The IR spectra of the gels and heated samples show several bands in the region 900–400 cm−1. It has to be noted that in the spectra of the gels, all observed bands in the range 900–400 cm−1 are weak and they could be related to the vibrations of MOn units [52,53,54,55,56]. According to the literature data [55,57,58] in this region exist the typical vibration of TiOn, SrOn, and FeOn which causes difficulties in distinguishing the vibrations of the inorganic structural groups due to their overlapping. The absorption bands located between 1500 and 1050 cm−1 are characteristic of the Ti(IV) n-butoxide precursor, and they could be interpreted as follows. The bands in the range 1500–1300 cm−1 could be assigned to the bending vibrations of CH3 and CH2 groups, while those at 1090 and 1070–1050 cm−1 are connected to the vibrations of terminal and bridging C–O bonds in butoxy ligands [59]. The latter bands are very weak in the IR spectrum of undoped SrTiO3, which is an indication of the more complete hydrolysis condensation processes in this gel. The very weak band at 950 cm−1 may be ascribed to the vibrations of C–O bonds in CH2–OH in the spectrum of the used alcohol. The bands above 1600 cm−1 could be associated with the hydroxyl groups [60].
The IR spectra of heat-treated powders (1100 °C for 3 h exposure time) exhibited the disappearance of the absorption bands of organic groups (Figure 8b). Generally, it is assumed that bands at 560 cm−1 and 420 cm−1 confirm the formation of the perovskite structure (ABO3) [61]. On the other hand, both IR spectra are identical, but two differences were observed, and they concern the spectrum of the SFTO sample. The first one concerns the absorption band at 580 cm−1, which is stronger as compared to that of the STO sample (Figure 8b), while the other one is related to the decrease in the intensity of the band at 860 cm−1. The band centered at about 580–560 cm−1 is related to the vibrations of TiO6 and FeO6. With the addition of Fe2O3, this band became stronger due to the overlapping of the vibrations of the above-mentioned inorganic structural groups. According to the literature data [57], the band at 860 cm−1 could be related to the stretching vibrations of SrOn polyhedra. The high frequency peaks at 1430 and 1790 cm−1 represent stretching and bending vibrations of OH groups adsorbed by the samples [62].

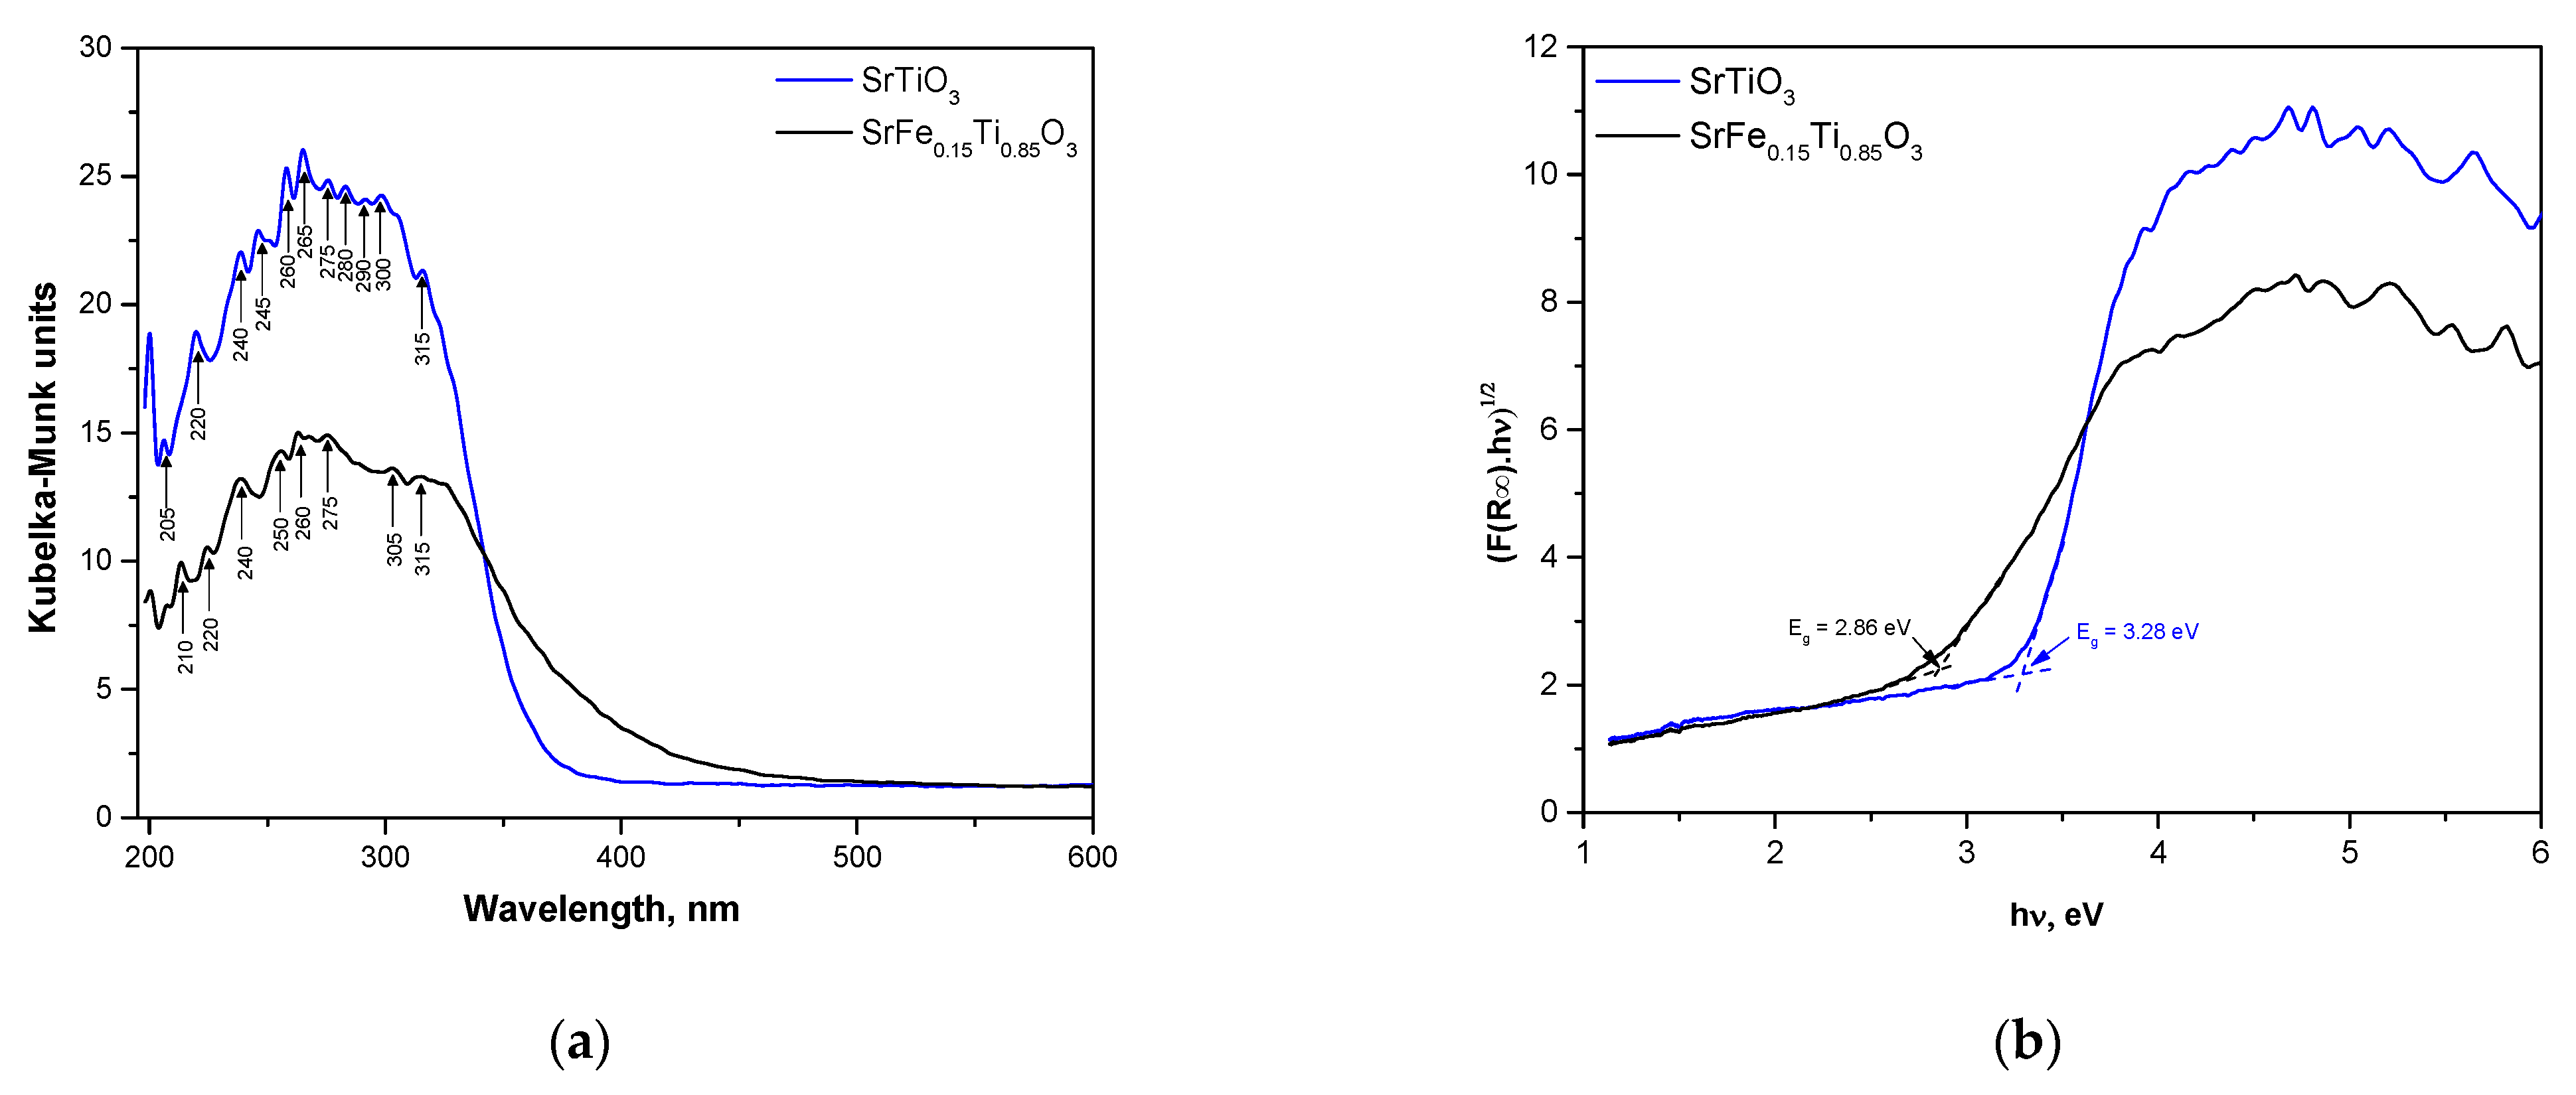
3.4. UV-Vis Spectroscopy

The UV-Vis spectra of SrTiO3 and SrFe0.15Ti0.85O3 are presented in Figure 9a. As it is seen from the figure, the UV–vis spectrum is changed when Fe3+ is added to STO. Generally, the color of the solid is determined by its optical absorption, and the sample doped with Fe3+ is yellowish to different extents, while the pure STO is white. This shows that doping modifies the material’s absorption. Both absorption spectra exhibited different bands in the range 200–300 nm. The spectrum of SFTO exhibited stronger absorbance as well as more intense bands. Generally, the UV—Vis spectra of gels derived by Ti(IV) butoxide exhibit two maxima, 230–260 nm and 300–325 nm, which could be assigned to the isolated TiO4 and TiO6 units, respectively [63,64,65]. Despite the small amount of Fe2O3 (15 mol%), the experimental results indicate that Fe3+ affects the UV–vis spectrum. As a result, after its addition, the absorption bands about 280 and 290 nm disappeared, while those in the range 250–275 decreased their intensity. According to the XRD data (Figure 2), the addition of Fe2O3 does not change the structure of SFTO. Some authors [66] stated that the results obtained by UV-Vis spectroscopy could be related to the structural changes as the Fe3+ replaces Ti4+.
The experimental results (Table 2) show that the absorption edge of STO is near 378 nm, while for the SFTO sample it is ~430 nm. Obviously, the addition of 15 mol% Fe2O3 caused a red shift of the cut-off, which confirms its role in determining the optical properties of the materials. This observation has already been found and explained by many authors [3,67]. It has been stated that the reason for this phenomenon is the formation of impurity energy levels due to the Fe doping, which causes the narrowing of the band gap. This is an additional indication for the substitution of Fe ions for Ti sites. The linear intercept of the curve of the plot of [F(R∞)ℎν]1/2 versus photon energy (ℎν) gives the optical energy band as shown in Figure 10b. The optical band gap of the pure STO is found to be 3.28 eV, which is in good agreement with that reported in the literature (3.28 eV) [68], corresponding to UV-light absorption. The Eg value changes with the addition of Fe, and it leads to a decrease in the band gap energy of the SFTO sample (2.86 eV). This bandgap narrowing shifts the absorption edge into the visible-light region, thus enhancing the material’s ability to utilize a broader portion of the solar spectrum. This phenomenon can be attributed to an increase in structural order–disorder in the lattice, which increases the intermediary energy levels in the band gap region of disordered SrFe0.15Ti0.85O3 powders [69]. It has to be attention that according to the XRD results, the presence of impurities has been registered. In such a case, when a mixture of crystalline phases exists, the resulting UV-Vis spectrum is determined by the dominant crystalline phase, respectively by its Eg value [70]. Obviously, the Eg value of the system is determined by the SrTiO3, which is a dominating one in both investigated samples. Further research about the doping effect in different perovskite structures must be performed. On the basis of the obtained results, good photocatalytic properties could be predicted.
The potentials of the conductive band (CB) and valence band (VB) are determined using Equations (1) and (2):
ECB = X − 4.5 − 0.5Eg,
EVB = ECB + Eg,
where Eg represents the band gap energy, and X denotes the absolute electronegativity of the material, which was determined using Mulliken’s principle (Table 2). The energy of the free electrons on the hydrogen scale (E0 = 4.5 eV) was used for the above calculations. Based on band potentials, it is expected that the prepared photocatalysts will be able to generate both OH-radicals and superoxide radicals, among other reactive oxygen species.
The potentials of the conductive band (CB) and valence band (VB) are determined using the equations: ECB = X − 4.5 − 0.5Eg and EVB = ECB + Eg, where Eg represents the band gap energy, and X denotes the absolute electronegativity of the material, which was determined using Mulliken’s principle (Table 2). The energy of the free electrons on the hydrogen scale (E0 = 4.5 eV) was used for the above calculations. Based on band potentials, it is expected that the prepared photocatalysts will be able to generate both OH-radicals and superoxide radicals, among other reactive oxygen species.

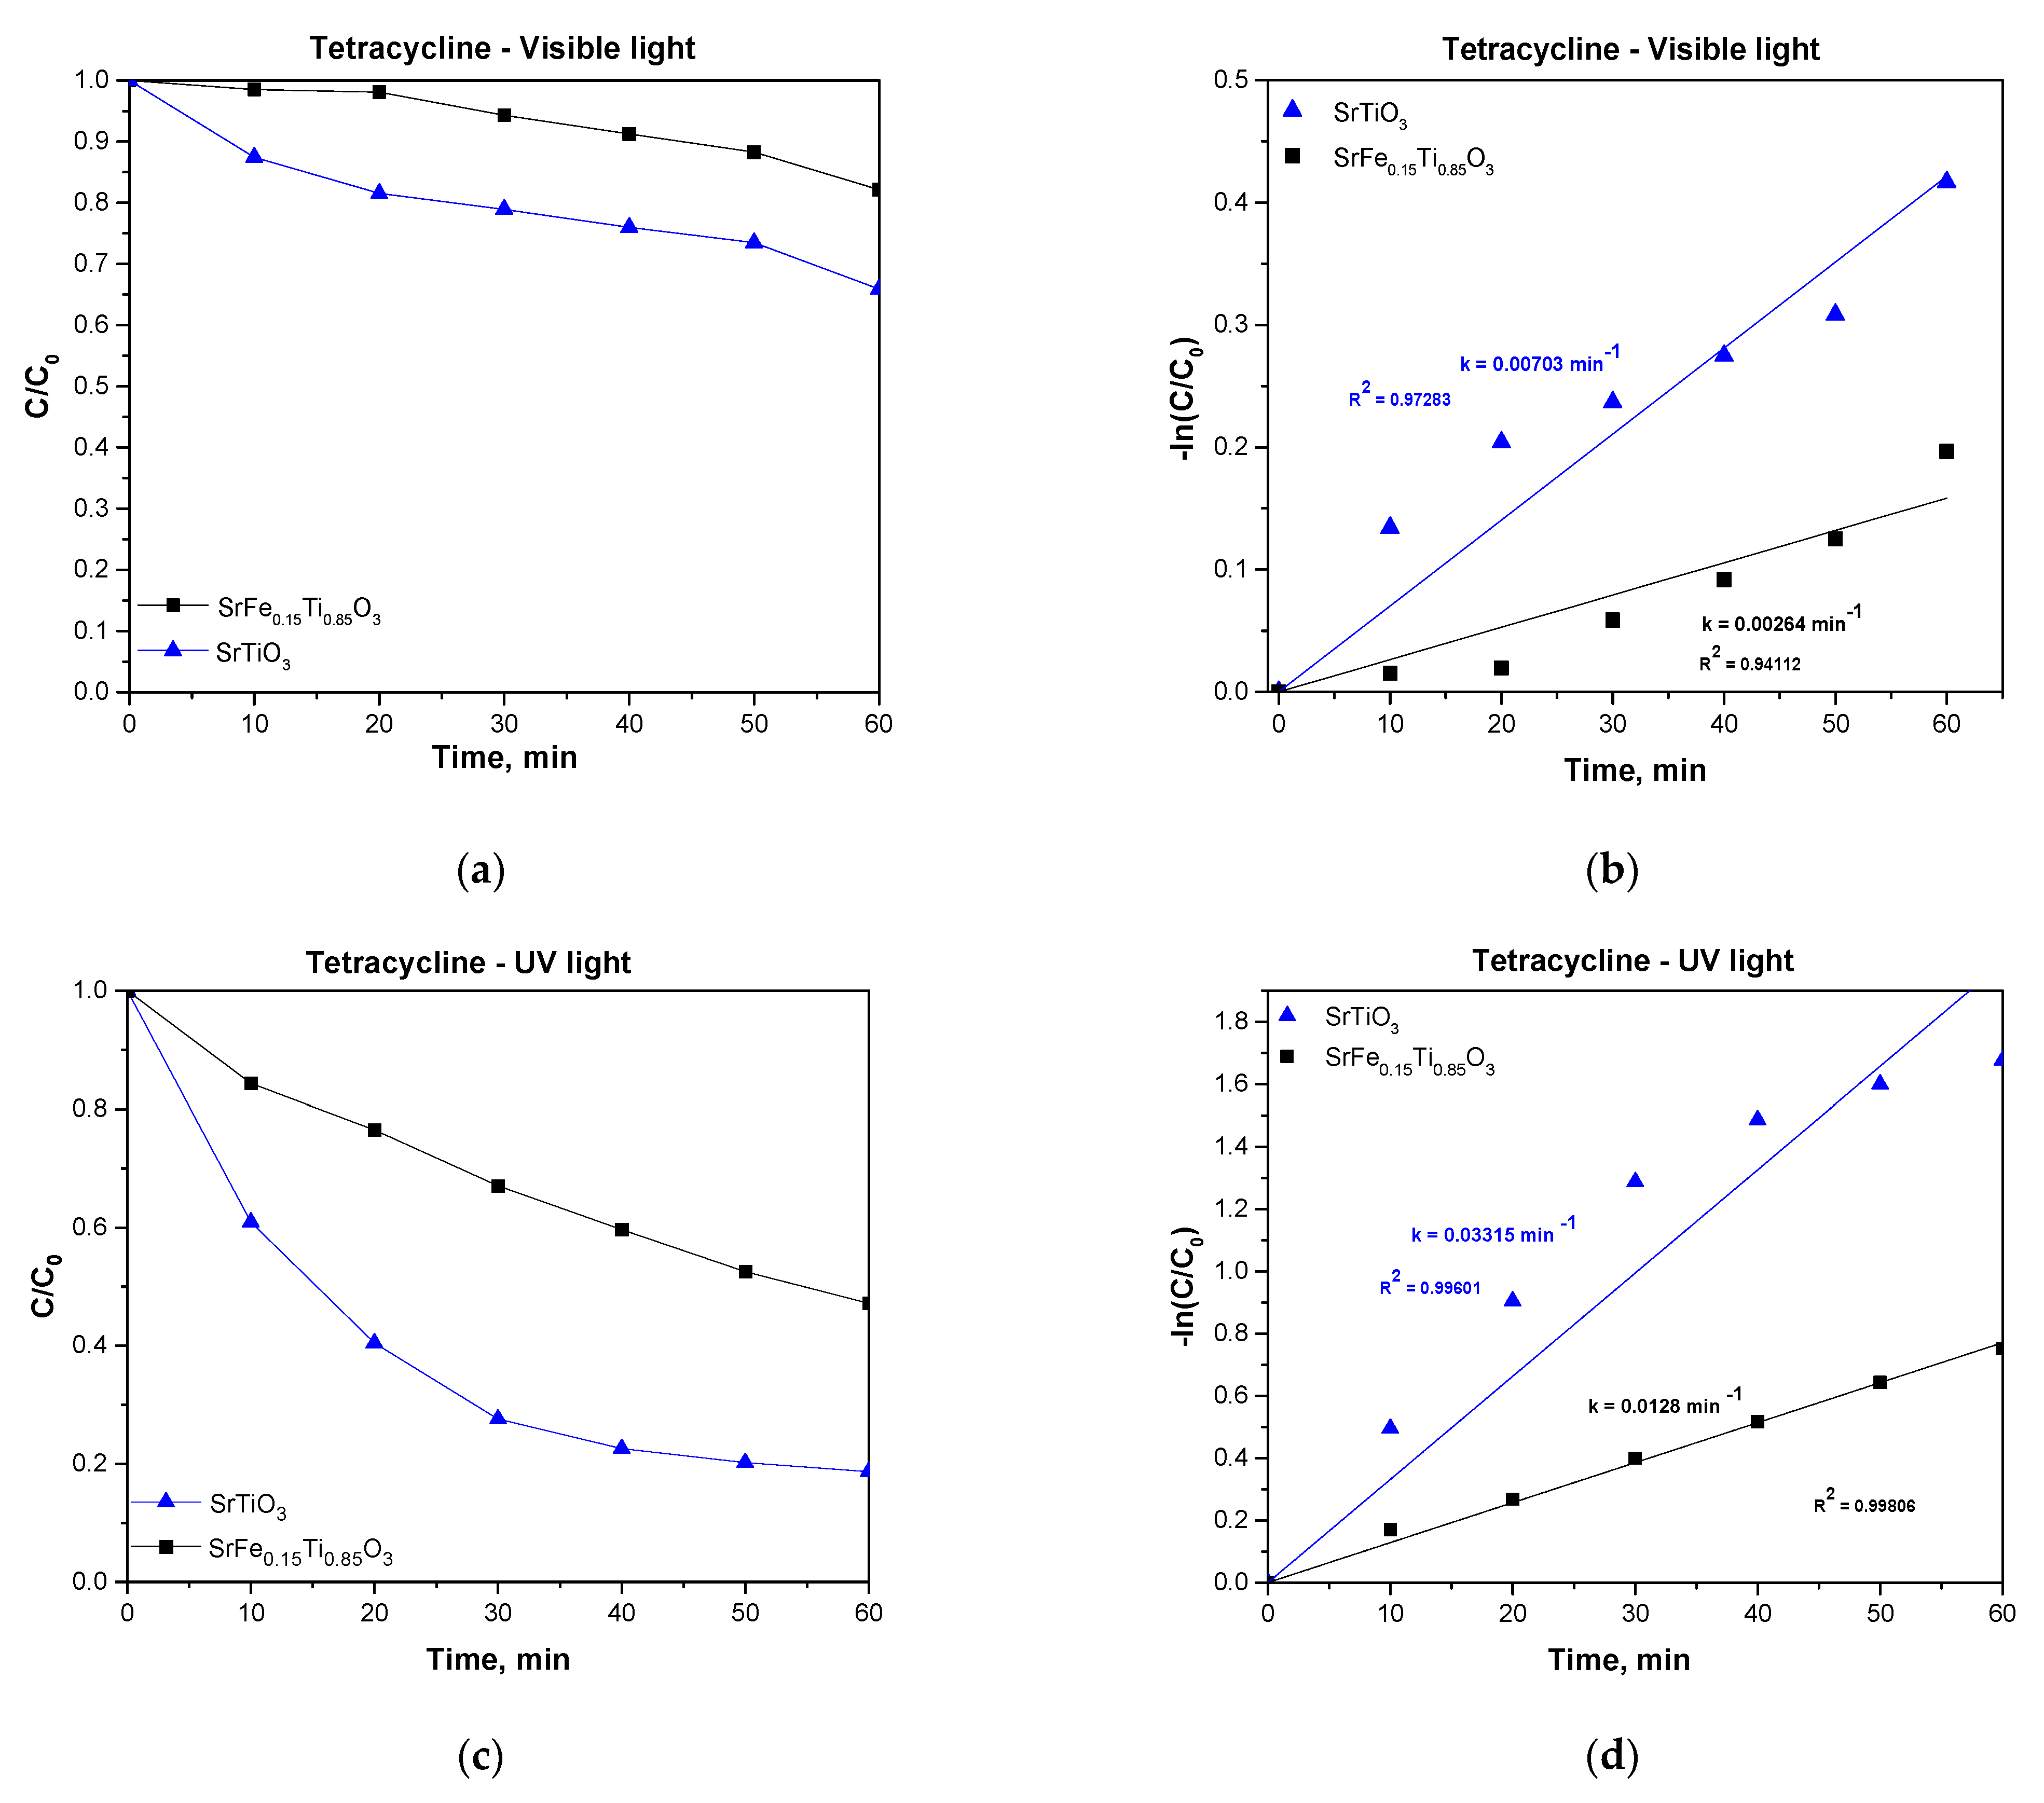
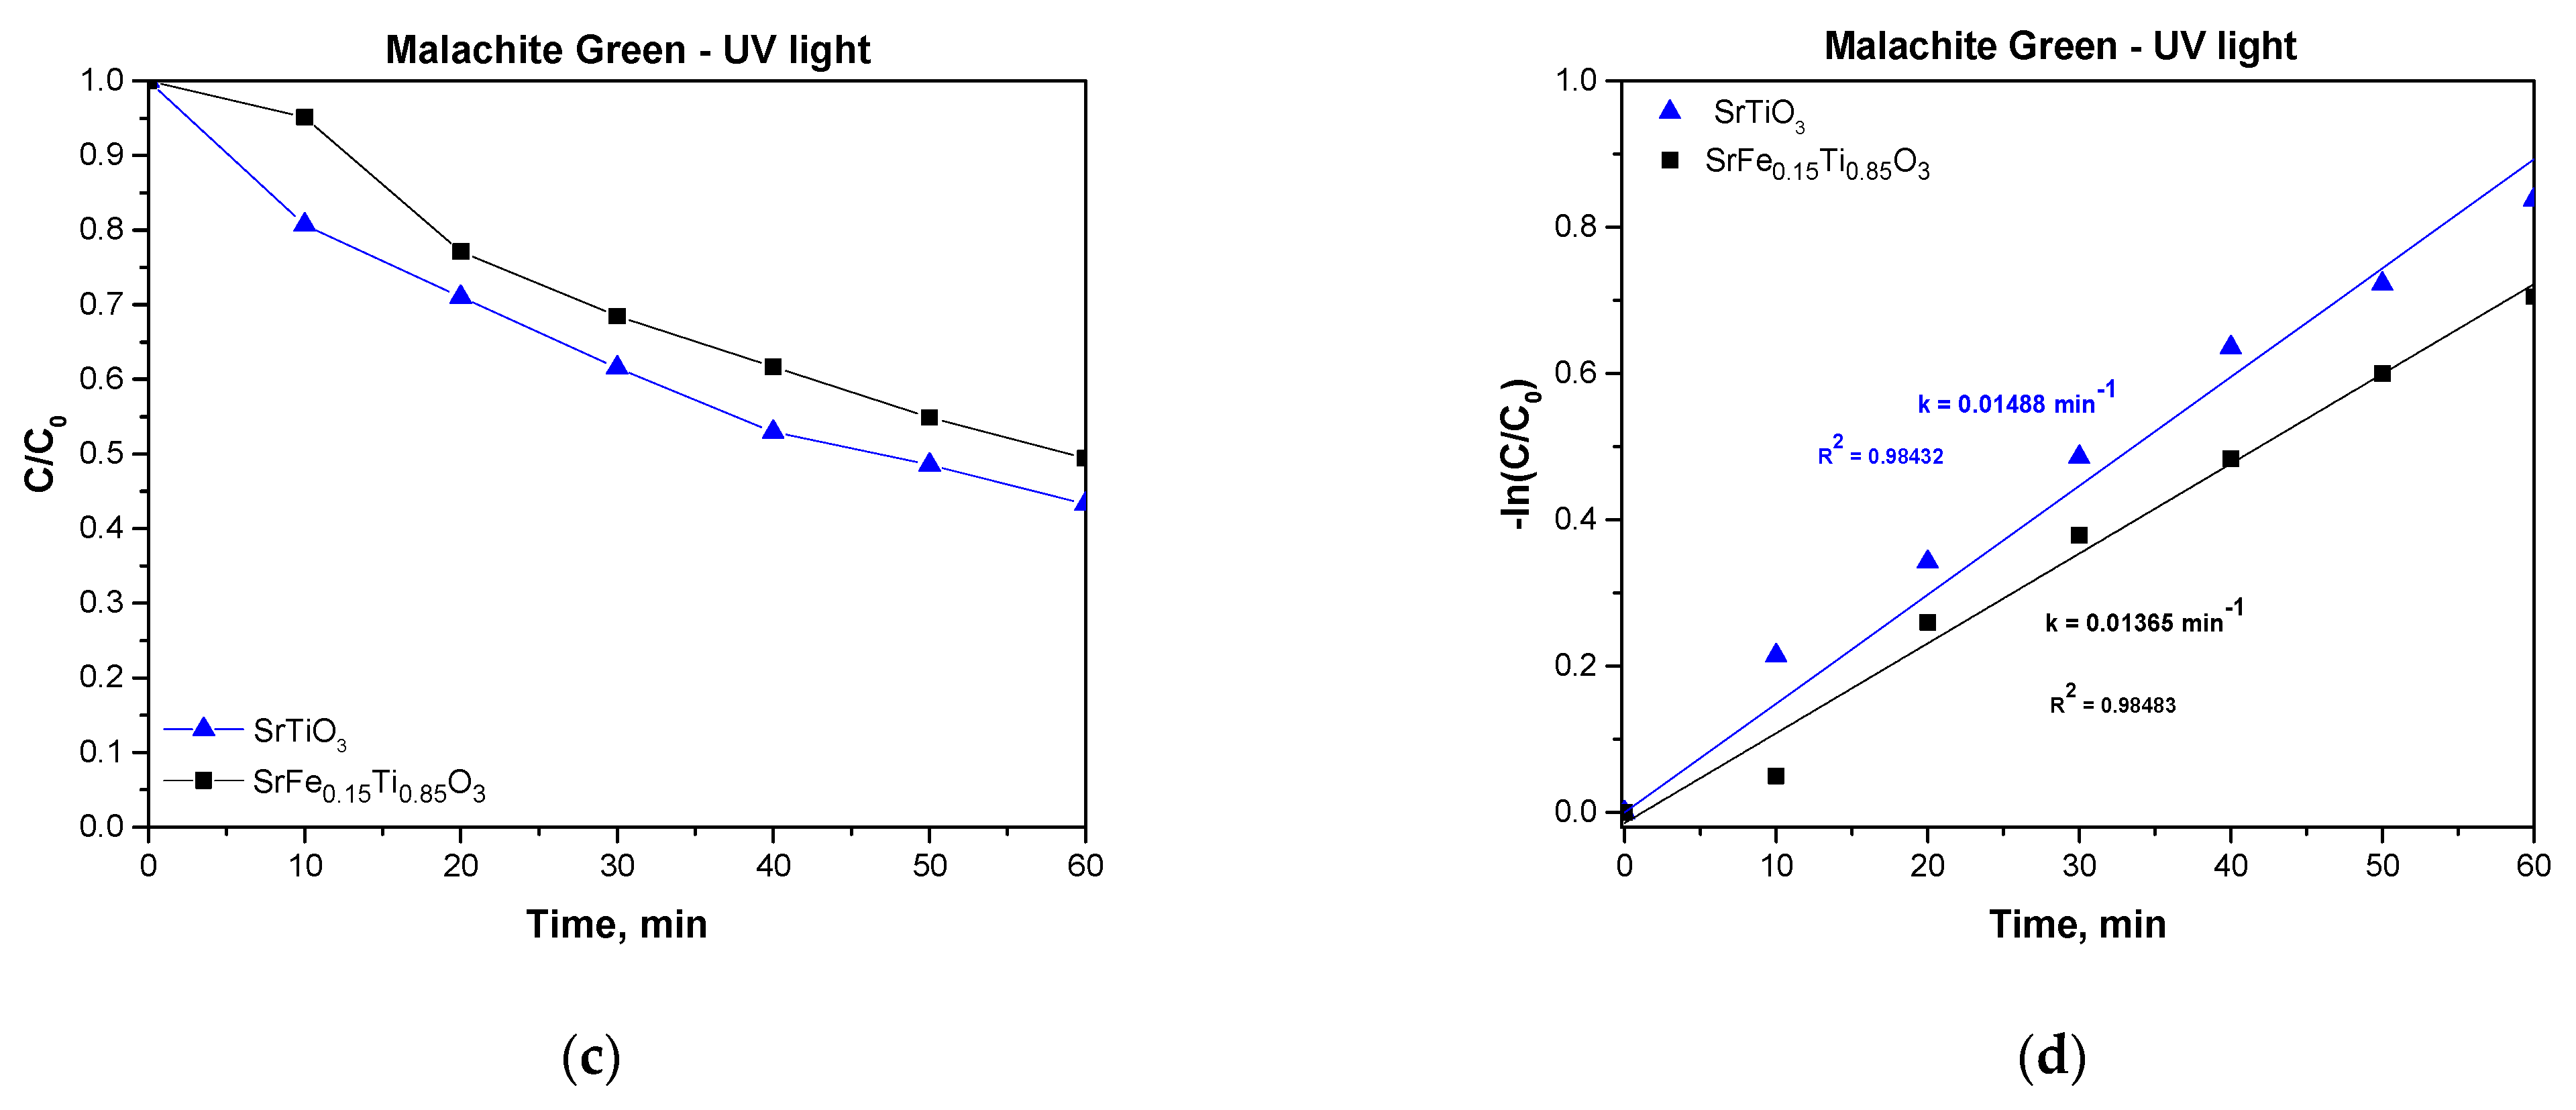
3.5. Photocatalytic Properties

The degradation of Malachite Green (MG) and Tetracycline hydrochloride (TCH) was used to investigate the photocatalytic activity of the synthesized STO and STFO samples under both visible and UV light exposure (Figure 10 and Figure 11). The kinetic data for both pollutants fit well with the Langmuir-Hinshelwood model [71], showing first-order reaction behavior (Figure 10b,d and Figure 11b,d). The calculated rate constants (kapp) are consistent with the experimentally observed degradation rates.
Photocatalytic degradation mechanisms can vary depending on the structure and redox characteristics of the target pollutant, as well as the type of irradiation used. In addition to reactive oxygen species (ROS), direct surface-mediated oxidation and reduction processes can also play significant roles. The valence band potentials of STO and STFO are quite similar, suggesting comparable oxidative abilities. However, STFO has a more negative conductive band (Table 2), which theoretically provides stronger reductive capability and might influence its photocatalytic response differently from STO.
Prior to irradiation, all samples were subjected to 30 min of dark adsorption equilibration to evaluate their affinity for the target pollutants. The adsorption efficiencies were calculated based on the concentration drop in the dark. For malachite green, SrTiO3 adsorbed 68% under UV and 73% under visible light, while SrFe0.15Ti0.85O3 showed 67% (UV) and 70% (visible). For tetracycline, the values were lower: 14% (UV) and 18% (visible) for SrTiO3, and 15% (UV) and 18% (visible) for SrFe0.15Ti0.85O3. These results reflect the influence of pollutant structure and charge on adsorption affinity and confirm that Fe doping does not significantly affect the surface adsorption properties under the conditions used. The slightly higher adsorption values observed for malachite green are attributed to its cationic nature and stronger electrostatic interaction with the catalyst surface [72].
Under visible light, TCH degradation was lower, with STO reaching 34% and STFO only 18%. These results align with previous findings, where limited visible light activity is often linked to the wide band gap of SrTiO3—based materials, which hinders efficient photoexcitation and charge separation [73]. Surprisingly, the Fe-doped STFO sample, despite its narrower band gap allowing absorption of lower-energy photons, performed worse than the undoped STO. This unexpected result may be explained by STFO’s lower surface area (Table 1), which likely reduces the number of active sites available for photocatalytic reactions.
When the light source was switched to UV, both catalysts exhibited significantly enhanced degradation efficiency toward TCH, reaching 81% for STO and 53% for STFO. This highlights the importance of photon energy in driving photocatalytic activity, particularly for materials with wider band gaps.
The degradation behavior of MG, however, differed markedly from that of TCH. Under visible light, SFTO demonstrated a much higher photocatalytic activity, achieving 90% degradation within 60 min, compared to 42% for STO. Interestingly, this trend reversed under UV light, where STO slightly outperformed STFO (57% vs. 51%), although the overall degradation was lower than that for TCH. Additional photolysis experiments without any catalyst were conducted to evaluate the potential degradation of malachite green (MG) and tetracycline hydrochloride (TC) under both UV and visible light irradiation. The obtained results show that for malachite green, a slight decrease in concentration was observed over 60 min: approximately 12% degradation under UV and 8% under visible light. This indicates limited photolysis, consistent with previous studies [74]. For tetracycline, degradation was even less pronounced, with less than 2% change in concentration under UV and about 3% under visible light over 60 min, confirming that TC is highly stable under direct light exposure without a photocatalyst.
These results clearly demonstrate that direct photolysis contributes minimally to pollutant degradation and support the conclusion that the observed activity in the presence of the synthesized materials is due to true photocatalytic processes rather than light-induced decomposition alone.
The photocatalytic activity of the Fe-doped SrTiO3 sample for the degradation of TCH could be explained by the peculiarities of the structure of the antibiotic. It consists of ionizable functional groups that undergo protonation–deprotonation reactions, forming cation species depending on the pH values (<7) [16]. This addition of Fe2O3 impacts the easier TCH adsorption upon its solubilization, resulting in the probable formation of Fe–TC complexes in an acidified media, which determines the photocatalytic activity of this sample [75,76].
The degradation of Malachite green (MG) dye under the same conditions shows completely different trends than those observed for the TCH degradation. The STFO sample shows significant MG dye degradation, reaching 90% at 60 min, while the pure STO sample is able to remove 42% for the same amount of time. Changing the light source, the behavior of both catalysts is reversed, but in general, the degradation efficiency is much lower than that of TCH (57% for STO and 51% for STFO, Figure 11). Similar results have been obtained for the photocatalytic activity of Ti-based photocatalysts doped with Sr and Fe [77].
The higher efficiency of Fe-doped SrTiO3 in Malachite green degradation could also be related to its low band-gap energy, as was mentioned above. Obviously, under visible light, the electron–hole generation is prevalent, and the recombination is poor. This behavior proves the catalyst activity under visible light, in which no energy consumption is required, which is in relation to other investigations [15,78].
According to the XRD results (Figure 2) small amount of impurities has been obtained. Findings for the influence of the impurities on the photocatalytic activity were made by Shymanovska et al. [79]. The authors stated that the relation between the rate of photoinduced charge transfer from the volume to the surface of the investigated sample and the recombination rate of photoexcited electrons and holes plays an important role. Usually, transition metal ion impurities, depending on their concentration, can be additional traps of photogenerated electrons and holes or be the centers of their recombination. There is an optimal concentration of the transition element impurities, above which these impurities act as the recombination centers. Our experimental data show that the observed impurities are in such concentrations that they increase the rate of photocatalytic reaction because of the increase in the photoabsorption of the STO phase. Thus, they do not influence the photocatalytic process.
On the other hand, the interpretation of the photocatalytic activity UV-Vis analysis must be taken into account. It has been stated that the complications of the UV-Vis analysis appeared when several phases were observed [70]. It was mentioned above that when a mixture of crystalline phases exists, the resulting UV-Vis spectrum is determined by the dominant crystalline phase, respectively by its Eg value. Thus, the apparent Eg value of the mixture is dominated by the lower Eg value of the strongest phase. Similar results are observed in our data, and the Eg value of the system is determined by the SrTiO3, which is a dominating one in both investigated samples. Thus, the enhanced photocatalytic activity of the SFTO sample under Vis irradiation could be attributed to the surface defects that provide more active sites for organic pollutant adsorption, which is crucial for initiating redox reactions that degrade the organic dye. It is known that surface defects such as oxygen vacancies improve charge carrier separation and mobility, which is essential for efficient photocatalysis [80]. Additional experiments concerning the photocatalytic activity of the obtained powders in a tap water solution model have been performed. The obtained results revealed consistent trends in degradation efficiency, reaction kinetics, and correlation coefficients (R2 values), indicating reliable and reproducible photocatalytic performance across the as-prepared samples.
Considering the different structures of both organic molecules, their stability, and redox properties, it can be expected that the mechanism of degradation is different under UV and visible light irradiation for TCH and MG. It should be noted that photocatalytic degradation does not always involve only ROS but also direct oxidation/reduction on the surface of the catalysts. Considering the similar valence band potentials of both materials, their oxidation properties are equal, but the STFO conductive band is more reductive than that of the STO, which can affect the photocatalytic performance. Obviously, in contrast to conventional high surface area photocatalysts, STO and SFTO exhibit higher activity despite their low BET value due to the intrinsic perovskite properties, visible-light absorption, and effective charge carrier dynamics [76].
The high R2 values obtained from the linear fits indicate excellent correlation between the experimental data and the fitted model, demonstrating a strong linear relationship and reliable data fitting.

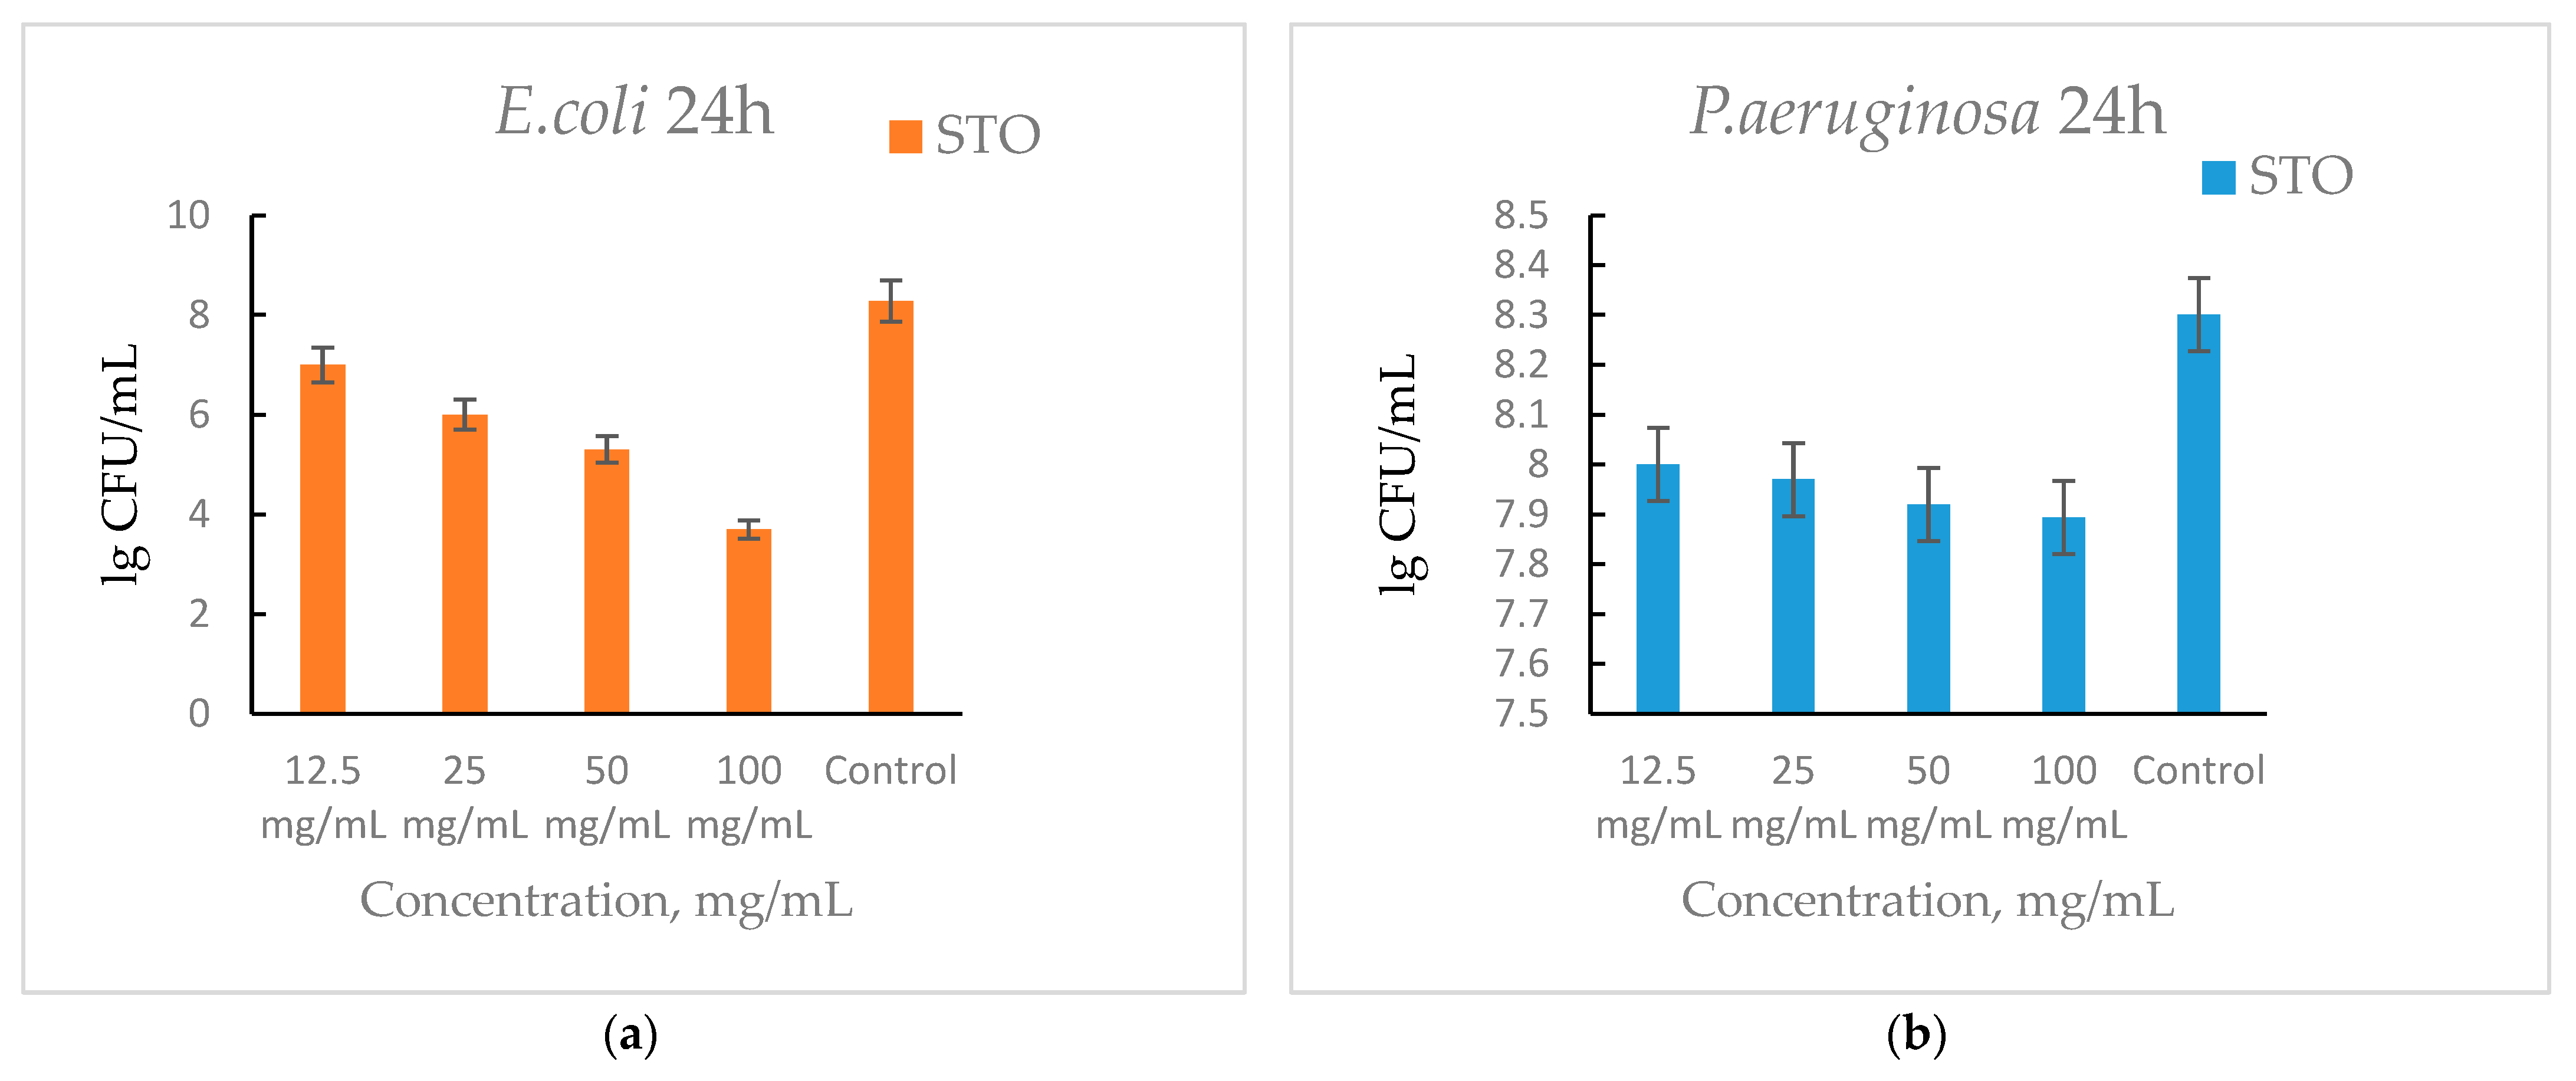
3.6. Antibacterial Activity Results

To gather more comprehensive information about the antibacterial activity of the prepared samples (STO and SFTO), two types of tests were conducted: a quantitative microdilution method and a qualitative spot test. The spot test served to predict the antibacterial effectiveness of the samples. However, based on the data collected, only the results from the quantitative analysis are presented here. For these tests, the two powder samples were dissolved in deionized water to prepare solutions with concentrations of 100 mg/mL, 50 mg/mL, 25 mg/mL, and 12.5 mg/mL, which were then subjected to ultrasound treatment.
The antibacterial activity of STO was tested against E. coli ATCC 25922 and P. aeruginosa ATCC 27853 over 24 h. As was shown in Figure 12a for E. coli, the bacterial count decreased with increasing concentration of the sample, showing inhibition at 50 mg/mL by three orders of magnitude, and 100 mg/mL—four orders of magnitude, compared to the control. However, against (b) P. aeruginosa ATCC 27853, STO demonstrated limited inhibition, with only slight reductions in bacterial counts observed across all tested concentrations of the sample compared to the control (Figure 12b).
The antimicrobial activity of SFTO is presented in Figure 13a,b. The sample exhibited bactericidal effects against both bacteria. Against E. coli ATCC 25922 (a), bactericidal effect was observed at 50 mg/mL and 100 mg/mL concentrations, with bacterial count dropping to zero—8 orders of magnitude. The minimal inhibitory concentration (MIC) was 25 mg/mL, 5 orders of magnitude. The minimal bactericidal concentration (MBC) stands at 50 mg/mL.
Similar trends were obtained for P. aeruginosa ATCC 27853, where bacterial counts were substantially reduced starting from 25 mg/mL. The MBC was determined to be 100 mg/mL, resulting in a 5-log10 reduction in bacterial cell count. The MIC is 50 mg/mL. This sample demonstrated good antibacterial activity compared to STO across both bacterial strains.
The results demonstrate that SrFe0.15Ti0.85O3 1100 °C exhibits greater antibacterial activity compared to SrTiO3 1100 °C. While SrTiO3 showed only inhibitory effects at higher concentrations, SrFe0.15Ti0.85O3 achieved inhibition of E. coli ATCC 25922 at 25 mg/mL and showed bactericidal effects from 50 mg/mL onward. SrFe0.15Ti0.85O3 proved more effective against P. aeruginosa ATCC 27853 as well, achieving substantial bacterial inhibition at higher concentrations.
The enhanced performance of the iron-doped sample may be attributed to changes in physicochemical properties such as increased surface reactivity, oxygen vacancies, or altered electronic structure, which can improve reactive oxygen species (ROS) generation and membrane disruption. These findings suggest that incorporation of Fe enhances the antimicrobial potential of the SFTO sample, making it a promising candidate for antimicrobial applications [35]. Beyond ROS generation, it is likely that several additional mechanisms contribute to the antibacterial activity demonstrated by the studied materials [81]. These include the possibility of ion release (particularly Fe ions from SFTO), which might disrupt essential biological functions, and direct interaction of the nanoparticles with bacterial membranes, which can cause membrane disruption [82]. Destabilizing membrane integrity may also be a result of the electrostatic interactions between the surfaces of the nanoparticles and the bacterial cell walls [9]. The bactericidal impact of the materials could be attributed to their ability to disturb bacterial metabolism or denature vital proteins [81]. As a result, SFTO’s stronger antibacterial activity over STO may be due to a variety of mechanisms beyond photocatalytic ROS generation.

4. Conclusions

Applying the sol-gel method, SrFe1−XTiXO3 (X = 1, 0.85) powders have been synthesized. The phase formation of the gels and heat-treated samples was investigated by XRD. The analysis confirmed the perovskite structure of the as-obtained samples. The IR, UV-Vis, and SEM-EDS proved the incorporation of the iron in the crystal lattice. The degradation of tetracycline hydrochloride and Malachite green was successful for both samples. Better photocatalytic activity has been shown for SrTiO3 in comparison to SrTi0.15Fe0.85O3 for TCH, both under UV and visible light irradiation, and for MG under UV irradiation. The SrFe0.85Ti0.15O3 shows superior photocatalytic activity under visible light irradiation for the degradation of MG dye. The experimental data show that the observed impurities are in such concentrations that they increase the rate of photocatalytic reaction because of the increase in the photoabsorption of the synthesized phases. The as—prepared powders could be applied for the purification of wastewaters. The results obtained imply that the synthesized powders can serve as photocatalysts for the removal of organic pollutants. The antibacterial results demonstrated that the SrFe0.15Ti0.85O3 sample exhibited greater antibacterial activity compared to SrTiO3. Nevertheless, both samples are promising candidates for antimicrobial applications.

Author Contributions

Conceptualization, S.P. and A.B.-N.; methodology, A.B.-N.; investigation, S.P., K.I. and I.I.; writing—original draft preparation, S.P., A.B.-N. and K.I.; writing photocatalytic properties—S.P., antibacterial properties, K.I., and I.I. All authors have read and agreed to the published version of the manuscript.

Funding

This work was in part supported by the European Union-NextGeneration EU, through the National Recovery and Resilience Plan of the Republic of Bulgaria, Project No. BG-RRP-2.004-0008-C01, project 4120, contract 70-123-661/16.04.2024.

Data Availability Statement

The original contributions presented in this study are included in the article. Further inquiries can be directed to the corresponding author.

Acknowledgments

The authors, S.P. and A.B.-N. would like to express their gratitude to Martin Tsvetkov from the Laboratory of Chemistry of Rare-Earth elements for the valuable discussion on the photocatalytic properties. The author A. Bachvarova-Nedelcheva is thankful to the support by European Regional Development Fund under Research Innovation and Digitization for Smart Transformation” program 2021–2027 under the Project BG16RFPR002-1.014-0006 National Centre of Excellence Mechatronics and Clean Technologies. Research equipment of distributed research infrastructure INFRAMAT, supported by the Bulgarian Ministry of Education and Science was used.

Conflicts of Interest

The authors declare no conflicts of interest.

References

  1. Fujishima, A.; Honda, K. Electrochemical Photolysis of Water at a Semiconductor Electrode. Nature 1972, 238, 37–38. [Google Scholar] [CrossRef] [PubMed]
  2. Ollis, D.F.; Pelizzetti, E.; Serpone, N. Photocatalyzed Destruction of Water Contaminants. Environ. Sci. Technol. 1991, 25, 1522–1529. [Google Scholar] [CrossRef]
  3. Abdi, M.; Mahdikhah, V.; Sheibani, S. Visible light photocatalytic performance of La-Fe co-doped SrTiO3 perovskite powder. Opt. Mater. 2020, 102, 109803. [Google Scholar] [CrossRef]
  4. Temerov, F.; Baghdadi, Y.; Rattner, E.; Eslava, S. A Review on Halide Perovskite-Based Photocatalysts: Key Factors and Challenges. ACS Appl. Energy Mater. 2022, 5, 14605–14637. [Google Scholar] [CrossRef] [PubMed]
  5. Xu, Y.; Liang, Y.; He, Q.; Xu, R.; Chen, D.; Xu, X.; Hu, H. Review of Doping SrTiO3 for Photocatalytic Applications. Bull. Mater. Sci. 2022, 46, 6. [Google Scholar] [CrossRef]
  6. Rodrigues, A.S.; Jorge, M.E.M.; Ciríaco, L.; Pacheco, M.J.; Lopes, A. Perovskites (La,Ba)(Fe,Ti)O3:AO7 Photocatalysis under Visible Light. Rev. Adv. Mater. Sci. 2020, 59, 151–159. [Google Scholar] [CrossRef]
  7. Schalli, M.; Romero-González, L.E. Microbiological Behavior of Waterborne Pathogens. Heliyon 2023, 9, e21634. [Google Scholar] [CrossRef]
  8. Mondal, S.K.; Chakraborty, S.; Manna, S.; Mandal, S.M. Antimicrobial Nanoparticles: Current Landscape and Future Challenges. RSC Pharm. 2024, 1, 388–402. [Google Scholar] [CrossRef]
  9. Franco, D.; Calabrese, G.; Guglielmino, S.P.P.; Conoci, S. Metal-Based Nanoparticles: Antibacterial Mechanisms and Biomedical Application. Microorganisms 2022, 10, 1778. [Google Scholar] [CrossRef]
  10. Barylyak, A.; Wojnarowska-Nowak, R.; Kus-Liśkiewicz, M.; Krzemiński, P.; Płoch, D.; Cieniek, B.; Bobitski, Y.; Kisała, J. Photocatalytic and Antibacterial Activity Properties of Ti Surface Treated by Femtosecond Laser—A Prospective Solution to Peri-Implant Disease. Sci. Rep. 2024, 14, 20926. [Google Scholar] [CrossRef]
  11. Ubaldi, F.; Valeriani, F.; Volpini, V.; Lofrano, G.; Romano Spica, V. Antimicrobial Activity of Photocatalytic Coatings on Surfaces: A Systematic Review and Meta-Analysis. Coatings 2024, 14, 92. [Google Scholar] [CrossRef]
  12. Da Silva, L.F.; Bernardi, M.I.B.; Maia, L.J.Q.; Frigo, G.J.M.; Mastelaro, V.R. Synthesis and Thermal Decomposition of SrTi1−xFexO3 (0.0 ≤ x ≤ 0.1) Powders Obtained by the Polymeric Precursor Method. J. Therm. Anal. Calorim. 2009, 97, 173–177. [Google Scholar] [CrossRef]
  13. Lobacheva, O.; Yiu, Y.M.; Chen, N.; Sham, T.K.; Goncharova, L.V. Changes in Local Surface Structure and Sr Depletion in Fe-Implanted SrTiO3 (001). Appl. Surf. Sci. 2017, 393, 74–81. [Google Scholar] [CrossRef]
  14. Yu, J.G.; Dai, G.P.; Huang, B. Effects of Calcination Temperature on Photocatalytic Activity of Hydrothermal Synthesized Nano-Sized SrTiO3 Powders. J. Phys. Chem. Solids 2008, 69, 2357–2362. [Google Scholar]
  15. Mostafa, E.M.; Amdeha, E. Enhanced Photocatalytic Degradation of Malachite Green Dye by Highly Stable Visible-Light-Responsive Fe-Based Tri-Composite Photocatalysts. Environ. Sci. Pollut. Res. Int. 2022, 29, 69861–69874. [Google Scholar] [CrossRef]
  16. Xiang, Q.; Cheng, B.; Yu, J. TiO2-Based Photocatalysts for Hydrogen Production. J. Phys. Chem. Lett. 2018, 9, 3452–3461. [Google Scholar]
  17. Zou, Z.; Ye, J.; Sayama, K.; Arakawa, H. Direct Splitting of Water under Visible Light Irradiation with an Oxide Semiconductor Photocatalyst. Nature 2001, 414, 625–627. [Google Scholar] [CrossRef] [PubMed]
  18. Siebenhofer, M.; Viernstein, A.; Morgenbesser, M.; Fleig, J.; Kubicek, M. Photoinduced Electronic and Ionic Effects in Strontium Titanate. Mater. Adv. 2021, 2, 7583–7619. [Google Scholar] [CrossRef] [PubMed]
  19. Jiang-Ni, Y.; Zhi-Yong, Z.; Jun-Feng, Y.; Wu, Z. Electronic Structure and Optical Properties of La-Doped SrTiO3 and Sr2TiO4 by Density Function Theory. Chin. Phys. Lett. 2009, 26, 017107. [Google Scholar] [CrossRef]
  20. Karczewski, J.; Riegel, B.; Gazda, M.; Jasinski, P.; Kusz, B. Electrical and Structural Properties of Nb-Doped SrTiO3 Ceramics. J. Electroceram. 2009, 24, 326–330. [Google Scholar] [CrossRef]
  21. Wang, D.; Ye, J.; Kako, T.; Kimura, T. Photophysical and Photocatalytic Properties of SrTiO3 Doped with Cr Cations on Different Sites. J. Phys. Chem. B 2006, 110, 15824–15830. [Google Scholar] [CrossRef] [PubMed]
  22. Villa-Bracamonte, M.F.; Montes-Bojorquez, J.R.; Ayon, A.A. Optical properties study of a perovskite solar cell film stack by spectroscopic ellipsometry and spectrophotometry. Results Opt. 2024, 15, 100640. [Google Scholar] [CrossRef]
  23. Li, X.; Zhao, H.; Xu, N.; Zhou, X.; Zhang, C.; Chen, N. Electrical Conduction Behavior of La, Co Co-Doped SrTiO3 Perovskite as Anode Material for Solid Oxide Fuel Cells. Int. J. Hydrogen Energy 2009, 34, 6407–6414. [Google Scholar] [CrossRef]
  24. Da Silva, L.F.; M’Peko, J.; Andrés, J.; Beltrán, A.; Gracia, L.; Bernardi, M.I.B.; Mesquita, A.; Antonelli, E.; Moreira, M.L.; Mastelaro, V.R. Insight into the Effects of Fe Addition on the Local Structure and Electronic Properties of SrTiO3. J. Phys. Chem. C 2014, 118, 4930–4940. [Google Scholar] [CrossRef]
  25. El-Sadek, M.; Farahat, M.; Ali, H.; Zaki, Z. Synthesis of SrTiO3 from Celestite and Rutile by Mechanical Activation Assisted Solid-State Reaction. Adv. Powder Technol. 2022, 33, 103548. [Google Scholar] [CrossRef]
  26. Kalyani, V.; Vasile, B.S.; Ianculescu, A.; Testino, A.; Carino, A.; Buscaglia, M.T.; Buscaglia, V.; Nanni, P. Hydrothermal Synthesis of SrTiO3: Role of Interfaces. Cryst. Growth Des. 2015, 15, 5712–5725. [Google Scholar] [CrossRef]
  27. Luxová, J.; Dohnalová, Ž.; Šulcová, P.; Reinders, N. Mn-Doped SrTiO3 Perovskite: Synthesis and Characterisation of a Visible Light-Active Semiconductor. Mater. Sci. Eng. B 2024, 313, 117889. [Google Scholar] [CrossRef]
  28. Sharma, N.; Hernadi, K. The Emerging Career of Strontium Titanates in Photocatalytic Applications: A Review. Catalysts 2022, 12, 1619. [Google Scholar] [CrossRef]
  29. Feldhoff, A.; Arnold, M.; Martynczuk, J.; Gesing, T.M.; Wang, H. The Sol–Gel Synthesis of Perovskites by an EDTA/Citrate Complexing Method Involves Nanoscale Solid State Reactions. Solid State Sci. 2008, 10, 689–701. [Google Scholar] [CrossRef]
  30. Navas, D.; Fuentes, S.; Castro-Alvarez, A.; Chavez-Angel, E. Review on Sol-Gel Synthesis of Perovskite and Oxide Nanomaterials. Gels 2021, 7, 275. [Google Scholar] [CrossRef]
  31. Tsvetkov, M.; Encheva, E.; Petrova, S.; Spassova, I.; Milanova, M. Mechanochemically Synthesized Solid Solutions La1−xCexFeO3+x/2 for Activation of Peroxydisulfate in Catalytic Reaction for Tetracycline Degradation. Crystals 2023, 13, 769. [Google Scholar] [CrossRef]
  32. Zhang, L.; Tan, P.Y.; Chow, C.L.; Lim, C.K.; Tan, O.K.; Tse, M.S.; Sze, C.C. Antibacterial activities of mechanochemically synthesized perovskite strontium titanate ferrite metal oxide. Colloids Surf. A Physicochem. Eng. Asp. 2014, 456, 169–175. [Google Scholar] [CrossRef]
  33. Hench, L.L.; West, J.K. The sol-gel process. Chem. Rev. 1990, 90, 33–72. [Google Scholar] [CrossRef]
  34. Jose, S.; Joshy, D.; Narendranath, S.B.; Periyat, P. Recent Advances in Infrared Reflective Inorganic Pigments. Sol. Energy Mater. Sol. Cells 2019, 194, 7–27. [Google Scholar] [CrossRef]
  35. Koli, V.B.; Delekar, S.D.; Pawar, S.H. Photoinactivation of bacteria by using Fe-doped TiO2-MWCNTs nanocomposites. J. Mater. Sci. Mater. Med. 2016, 27, 1–10. [Google Scholar] [CrossRef]
  36. Li, Y.; Niu, S.; Hao, Y.; Zhou, W.; Wang, J.; Liu, J. Role of Oxygen Vacancy on Activity of Fe-Doped SrTiO3 Perovskite Bifunctional Catalysts for Biodiesel Production. Renew. Energy 2022, 199, 1258–1271. [Google Scholar] [CrossRef]
  37. Tauc, J.; Grigorovici, R.; Vancu, A. Optical Properties And Electronic Structure of Amorphous Germanium. Phys. Status Solidi B 1966, 15, 627–637. [Google Scholar] [CrossRef]
  38. Reller, L.B.; Weinstein, M.; Jorgensen, J.H.; Ferraro, M.J. Antimicrobial Susceptibility Testing: A Review of General Principles and Contemporary Practices. Clin. Infect. Dis. 2009, 49, 1749–1755. [Google Scholar]
  39. Long, Y. A-Site Ordered Quadruple Perovskite Oxides AA3B4O12. Chin. Phys. B 2016, 25, 078108. [Google Scholar] [CrossRef]
  40. Vegard, L. Die Konstitution der Mischkristalle und die Raumfüllung der Atome. Z. Phys. 1921, 5, 17–26. [Google Scholar] [CrossRef]
  41. Goodenough, J.B. Electronic and Ionic Transport Properties and Other Physical Aspects of Perovskites. Rep. Prog. Phys. 2004, 67, 1915–1993. [Google Scholar] [CrossRef]
  42. Ghadiri, M.; Amini, M.M. The Effect of Metal Dopants on Structural, Optical and Photocatalytic Properties of Perovskite-Type Oxides: A Review. Mater. Sci. Semicond. Process. 2020, 107, 104849. [Google Scholar] [CrossRef]
  43. Ohtomo, A.; Hwang, H.Y. A High-Mobility Electron Gas at the LaAlO3/SrTiO3 Heterointerface. Nature 2004, 427, 423–426. [Google Scholar] [CrossRef] [PubMed]
  44. Gupta, K.; Singh, R.P.; Pandey, A.; Pandey, A. Photocatalytic antibacterial performance of TiO2 and Ag-doped TiO2 against S. aureus. P. aeruginosa and E. coli. Beilstein J. Nanotechnol. 2013, 4, 345–351. [Google Scholar] [CrossRef]
  45. Goldschmidt, V.M. Die Gesetze der Krystallochemie. Naturwissenschaften 1926, 14, 477–485. [Google Scholar] [CrossRef]
  46. Łańcucki, Ł.; Mizera, A.; Łącz, A.; Drożdż, E.; Bućko, M.M.; Pasierb, P. Development and Chemical Stability Evaluation of Enhanced Surface LaFe1–xTixO3 (LFT) Perovskites Using Polystyrene Nanospheres as Templating Agent. J. Alloys Compd. 2017, 727, 863–870. [Google Scholar] [CrossRef]
  47. Arman, M.M.; El-Dek, S.I. Enhancement in Dielectric and Optical Properties of La1–xCexFeO3 Nanoparticles. J. Mater. Sci. Appl. 2019, 8, 5396–5404. [Google Scholar] [CrossRef]
  48. Fuentes, S.; Muñoz, P.; Barraza, N.; Chávez-Angel, E.; Sotomayor Torres, C.M. Structural Characterisation of Slightly Fe-Doped SrTiO3 Grown via a Sol–Gel Hydrothermal Synthesis. J. Sol-Gel Sci. Technol. 2015, 75, 593–601. [Google Scholar] [CrossRef]
  49. Sahner, K.; Gouma, P.; Moos, R. Electrodeposited and Sol-Gel Precipitated p-Type SrTi1−xFexO3−δ Semiconductors for Gas Sensing. Sensors 2007, 7, 1871–1886. [Google Scholar] [CrossRef]
  50. Thommes, M.; Kaneko, K.; Neimark, A.V.; Olivier, J.P.; Rodriguez-Reinoso, F.; Rouquerol, J.; Sing, K.S. Physisorption of Gases, with Special Reference to the Evaluation of Surface Area and Pore Size Distribution (IUPAC Technical Report). Pure Appl. Chem. 2015, 87, 1051–1069. [Google Scholar] [CrossRef]
  51. Shannon, R.D. Revised Effective Ionic Radii and Systematic Studies of Interatomic Distances in Halides and Chalcogenides. Acta Crystallogr. Sect. A 1976, 32, 751–767. [Google Scholar] [CrossRef]
  52. Beattie, I.R.; Gilson, T. Single Crystal Laser Raman Spectroscopy. Proc. R. Soc. A 1968, 307, 407–429. [Google Scholar]
  53. Henry, M.; Leavage, J.; Sanchez, C. Sol-Gel Chemistry of Transition Metal Oxides. Prog. Solid State Chem. 1988, 18, 259–341. [Google Scholar]
  54. Velasco, M.J.; Rubio, F.; Rubio, J.; Oteo, J. Hydrolysis of Titanium Tetrabutoxide. Study by FT-IR Spectroscopy. Spectrosc. Lett. 1999, 32, 289–304. [Google Scholar] [CrossRef]
  55. Busca, G.; Saussey, H.; Saur, O.; Lavalley, J.C.; Lorenzelli, V. FT-IR characterization of the surface acidity of different titanium dioxide anatase preparations. Appl. Catal. 1985, 14, 245–260. [Google Scholar] [CrossRef]
  56. Iordanova, R.; Bachvarova-Nedelcheva, A.; Gegova, R.; Kostov, K.L.; Dimitriev, Y. Sol–Gel Synthesis of Composite Powders in the TiO2–TeO2–SeO2 System. J. Sol-Gel Sci. Technol. 2016, 79, 12–28. [Google Scholar] [CrossRef]
  57. Rocha-Rangel, E.; Pech-Rodríguez, W.J.; Lopez Hernandez, J.; Calles-Arriaga, C.; Armendáriz-Mireles, E.N.; Castillo-Robles, J.A. Synthesis of SrTiO3 by the Calcination of SrCO3 And TiO2 Mixtures Intensively Ground by Means of High Energy Milling. Arch. Metall. Mater. 2020, 52, 621–626. [Google Scholar] [CrossRef]
  58. Iordanova, R.; Dimitriev, Y.; Dimitrov, V.; Kassabov, S.; Klissurski, D. Glass Formation and Structure in the System MoO3–Bi2O3–Fe2O3. J. Non-Cryst. Solids 1998, 231, 227–233. [Google Scholar] [CrossRef]
  59. Bachvarova-Nedelcheva, A.; Iordanova, R.; Naydenov, A.; Stoyanova, A.; Georgieva, N.; Nemska, V.; Foteva, T. Sol–Gel Obtaining of TiO2/TeO2 Nanopowders with Biocidal and Environmental Applications. Catalysts 2023, 13, 257. [Google Scholar] [CrossRef]
  60. Abbas, N.; Shao, G.N.; Haider, M.S.; Imran, S.M.; Park, S.S.; Kim, H.T. Sol–Gel Synthesis of TiO2-Fe2O3 Systems: Effects of Fe2O3 Content and Their Photocatalytic Properties. J. Ind. Eng. Chem. 2016, 39, 112–120. [Google Scholar] [CrossRef]
  61. Atma, R.; Awalendra, K.T. Tunability of dielectric, optical and magnetic property by simultaneous co-substitution in LaFeO3. Mater. Sci. Eng. B 2017, 224, 139–149. [Google Scholar]
  62. Hasan, T.; Saha, A.; Khan, M.N.I.; Rashid, R.; Basith, M.A.; Bashar, M.S.; Ahmed, I. Structural, Electrical, and Magnetic Properties of Ce and Fe Doped SrTiO3. AIP Adv. 2022, 12, 095003. [Google Scholar] [CrossRef]
  63. Nagaveni, K.; Hegde, M.S.; Ravishankar, N.; Subbanna, G.N.; Madras, G. Synthesis and Structure of Nanocrystalline TiO2 with Lower Band Gap Showing High Photocatalytic Activity. Langmuir 2004, 20, 2900–2907. [Google Scholar] [CrossRef]
  64. Ngyen, V.V.H.; Beydoun, D.; Amal, R.J. Photocatalytic reduction of selenite and selenate using TiO2 photocatalyst. Photochem. Photobiol. A Chem. 2005, 171, 113–120. [Google Scholar] [CrossRef]
  65. Meng, Z.D.; Zhu, L.; Ullah, K.; Ye, S.; Oh, W.-C. Detection of oxygen species generated by WO3 modification fullerene/TiO2 in the degradation of 1,5-diphenyl carbazide. Mater. Res. Bull. 2014, 56, 45–53. [Google Scholar] [CrossRef]
  66. Zhu, Y.; Sun, D.; Huang, Q.; Jin, X.; Liu, H. UV–Visible Spectra of Perovskite Iron-Doped Ba0.72Sr0.28TiO3. Mater. Lett. 2008, 62, 407–409. [Google Scholar] [CrossRef]
  67. Zhang, C.; Wang, C.-L.; Li, J.-C.; Yang, K. Structural and Electronic Properties of Fe-Doped BaTiO3 and SrTiO3. Chin. Phys. 2007, 16, 1422. [Google Scholar]
  68. Thomas, R.; Dube, D.C. Optical Properties of Sol–Gel Processed Amorphous and Crystalline SrTiO3 Thin Films. Jpn. J. Appl. Phys. 2000, 39, 1771. [Google Scholar] [CrossRef]
  69. Bhoyar, D.N.; Somvanshi, S.B.; Nalle, P.B.; Mande, V.K.; Pandit, A.A.; Jadhavet, K.M. Multiferroic Fe3+ ion doped BaTiO3 Perovskite Nanoceramics: Structural, Optical, Electrical and Dielectric Investigations. J. Phys. Conf. Ser. 2020, 1644, 012058. [Google Scholar] [CrossRef]
  70. Ross-Medgaarden, E.I.; Wachs, I.E. Structural Determination of Bulk and Surface Tungsten Oxides with UV−Vis Diffuse Reflectance Spectroscopy and Raman Spectroscopy. J. Phys. Chem. C 2007, 111, 15089–15099. [Google Scholar] [CrossRef]
  71. Niu, J.; Ding, S.; Zhang, L.; Zhao, J.; Feng, C. Visible-light-mediated Sr-Bi2O3 photocatalysis of tetracycline: Kinetics, mechanisms and toxicity assessment. Chemosphere 2013, 93, 1–8. [Google Scholar] [CrossRef] [PubMed]
  72. Ibhadon, A.O.; Fitzpatrick, P. Heterogeneous Photocatalysis: Recent Advances and Applications. Catalysts 2013, 3, 189–218. [Google Scholar] [CrossRef]
  73. Li, P.; Liu, C.; Wu, G.; Heng, Y.; Lin, S.; Ren, A.; Lv, K.; Xiao, L.; Shi, W. Solvothermal synthesis and visible light-driven photocatalytic degradation for tetracycline of Fe-doped SrTiO3. RSC Adv. 2014, 4, 47615. [Google Scholar] [CrossRef]
  74. Modirshahla, N.; Behnajady, M.A. Decolorization of Malachite Green by UV/H2O2: Influence of Operational Parameters and Kinetic Modeling. J. Hazard. Mater. 2006, 137, 226–232. [Google Scholar] [CrossRef]
  75. Figueroa, R.A.; MacKay, A.A. Sorption of Oxytetracycline to Iron Oxides and Iron Oxide-Rich Soils. Environ. Sci. Technol. 2005, 39, 6664–6671. [Google Scholar] [CrossRef]
  76. Gu, C.; Karthikeyan, K.G. Interaction of Tetracycline with Aluminum and Iron Hydrous Oxides. Environ. Sci. Technol. 2005, 39, 2660–2667. [Google Scholar] [CrossRef] [PubMed]
  77. Rosa, D.; D’Agostino, F.; Bavasso, I.; Di Palma, L. An Innovative and Easy Method for Iron-Doped Titania Synthesis. Chem. Eng. Trans. 2023, 101, 13–18. [Google Scholar]
  78. El-Salamony, R.A.; Amdeha, E.; Ghoneim, S.A.; Badawy, N.A.; Salem, K.M.; Al-Sabagh, A.M. Titania Modified Activated Carbon Prepared from Sugarcane Bagasse: Adsorption and Photocatalytic Degradation of Methylene Blue under Visible Light Irradiation. Environ. Technol. 2017, 38, 3122–3136. [Google Scholar] [CrossRef] [PubMed]
  79. Shymanovska, V.; Kernazhitsky, L.; Puchkovska, G.; Naumov, V.; Khalyavka, T.; Kshnyakin, V.; Kshnyakina, S.; Chernyak, V. The Impurity Ion Influence on the Optical and Photocatalytic Properties of Anatase and Rutile. J. Nanoelectron. Phys. 2011, 3, 63–73. [Google Scholar]
  80. Musah, A.M.I.; Or, S.; Awodugba, A.O. Precursor Impurity-Mediated Effect in the Photocatalytic Activity of Precipitated Zinc Oxide. J. Am. Ceram. Soc. 2024, 107, 8269–8280. [Google Scholar]
  81. Slavin, Y.N.; Asnis, J.; Hńfeli, U.O.; Bach, H. Metal Nanoparticles: Understanding the Mechanisms Behind Antibacterial Activity. J. Nanobiotechnol. 2017, 15, 65. [Google Scholar] [CrossRef] [PubMed]
  82. Doolan, J.A.; Williams, G.T.; Hilton, K.L.F.; Chaudhari, R.; Fossey, J.S.; Goult, B.T.; Hiscock, J.R. Advancements in Antimicrobial Nanoscale Materials and Self-Assembling Systems. Chem. Soc. Rev. 2022, 51, 8696–8755. [Google Scholar] [CrossRef] [PubMed]
Figure 1. Main stages of the preparation of the examined samples.
Water 17 02072 g001
Figure 2. XRD patterns of sol-gel synthesized SrTiO3 and SrFe0.15Ti0.85O3 (a), magnification of the XRD in the range 32–33, 2Θ (b), and calculated t-factor (c).
Water 17 02072 g002
Figure 3. SEM images of SrTiO3 (a) and SrFe0.15Ti0.85O3 (b).
Water 17 02072 g003
Figure 4. SEM image elemental mapping of SrTiO3 sample (a); composition map of Sr (b); composition map of Ti (c); composition map of O (d).
Water 17 02072 g004
Figure 5. SEM image elemental mapping of SrFe0.15Ti0.85O3 sample (a); composition map of Sr (b); composition map of Ti (c); composition map of O (d); composition map of Fe (e).
Water 17 02072 g005
Figure 6. EDX results for the (a) STO and (b) STFO samples.
Water 17 02072 g006
Figure 7. Absorption-desorption BET isotherms of SrTiO3 (a) and SrFe0.15Ti0.85O3 (b). The insets show BJH pore diameter distribution, where V is pore volume and D is pore diameter.
Water 17 02072 g007
Figure 8. IR spectra of the STO and SFTO gels (a) and heated at 1100 °C samples (b).
Water 17 02072 g008
Figure 9. UV-Vis spectra of the investigated samples (a), band gap energy (Eg) determination using Tauc equation (b).
Water 17 02072 g009
Figure 10. Photocatalytic degradation of tetracycline hydrochloride under visible light irradiation (a) and UV light irradiation (c), and Langmuir-Hinshelwood kinetic models for visible light (b) and UV light (d).
Water 17 02072 g010
Figure 11. Photocatalytic degradation of Malachite Green under visible light irradiation (a) and UV light irradiation (c), and Langmuir-Hinshelwood kinetic models for visible light (b) and UV light (d).
Water 17 02072 g011aWater 17 02072 g011b
Figure 12. Antibacterial activity of SrTiO3 against (a) Escherichia coli ATCC 25922 and (b) Pseudomonas aeruginosa ATCC 27853 after 24 h of incubation at different concentrations (12.5–100 mg/mL). Bacterial viability is expressed as log10 CFU/mL.
Water 17 02072 g012
Figure 13. Antibacterial activity of SrFe0.15Ti0.85O3 against (a) Escherichia coli ATCC 25922 and (b) Pseudomonas aeruginosa ATCC 27853 after 24 h of incubation at different concentrations (12.5–100 mg/mL). Bacterial viability is expressed as log10 CFU/mL.
Water 17 02072 g013
Table 1. Textural characteristics of the samples, according to the BET analysis.
SampleSBET, m2/gVt, cm3/gDav, nm
SrFe0.15Ti0.85O330.02021
SrTiO340.02424
Table 2. Energy of the band gap, potentials of current band (CB) and valence band (VB), cut-off, and refractive index (n).
SampleEg, eVECB, eVEVB, eVCut-Off, nmRefractive Index, n
SrTiO33.28−0.8222.463782.32
SrFe0.15Ti0.85O32.86−0.7972.484332.43
Disclaimer/Publisher’s Note: The statements, opinions and data contained in all publications are solely those of the individual author(s) and contributor(s) and not of MDPI and/or the editor(s). MDPI and/or the editor(s) disclaim responsibility for any injury to people or property resulting from any ideas, methods, instructions or products referred to in the content.

