Abstract
Subsurface drainage and biochar application are conventional measures for improving saline–alkali soils. However, their combined effects on the fate of nitrogen (N) fertilizers remain unclear. This study investigated the combined effects of subsurface drainage and biochar amendment on the fate of nitrogen (N) in coastal saline–alkali soils, where these conventional remediation measures’ combined impacts on fertilizer N dynamics remain seldom studied. Using 15N-labeled urea tracing in an alfalfa–soil system, we examined how different drainage spacings (0, 6, 12, and 18 m) and biochar application rates (5, 10, and 15 t/ha) influenced N distribution patterns. Results demonstrated decreasing in drainage spacing and increasing in biochar application; these treatments enhanced 15N use efficiency on three harvested crops. Drainage showed more sustained effects than biochar. Notably, the combination of 6 m drainage spacing with 15 t/ha biochar application achieved optimal performance of 15N use, showing N utilization efficiency of 46.0% that significantly compared with most other treatments (p < 0.05). 15N mass balance analysis revealed that the plant absorption, the soil residual and the loss of applied N accounted for 21.6–46.0%, 38.6–67.5% and 8.5–18.1%, respectively. These findings provide important insights for optimizing nitrogen management in coastal saline–alkali agriculture, demonstrating that strategic integration of subsurface drainage (6 m spacing) with biochar amendment (15 t/ha) can maximize N use efficiency, although potential N losses warrant consideration in field applications.
1. Introduction
More than 1 × 10⁹ hectares of global land are affected by saline–alkali conditions, and this area is expanding at a rate of approximately 2 × 10⁶ hectares per year [1]. By effectively improving and developing these saline–alkali lands into arable land, the cultivated area can be directly increased, alleviating the problem of insufficient food production space. This is especially beneficial in densely populated regions where arable resources are relatively scarce, as the development of saline–alkali land helps expand food-production space and enhance food self-sufficiency [2]. However, saline–alkali land is often characterized by a high salinity, poor soil permeability, and low fertility [3,4]. A crucial pathway to developing saline–alkali agriculture is by using scientific amendments like biochar and engineering approaches like subsurface drainage to rehabilitate saline–alkali land, enhance crop nutrient absorption, and increase crop yields.
Biochar, derived from the pyrolysis of biomass such as wood, straw, husks, manure, and sludge [5], can be used as an ingredient in mixed products or on its own. It has widespread applications in soil improvement and resource-utilization efficiency enhancement [6]. Specifically, biochar can reportedly improve soil moisture retention and crack resistance [7]. Another study has confirmed that applying high amounts of biochar significantly increases soil organic matter, total nitrogen, total phosphorus, water-soluble organic carbon, ammonium nitrogen, available phosphorus, and microbial biomass nitrogen content, thereby enhancing soil fertility and ensuring stable crop yields in dryland areas [8]. Using corn straw biochar can enhance the effectiveness of urea nitrogen, promote soil microbial activity, and improve crop nutrient-absorption efficiency [9]. Given these characteristics of biochar, its application should be considered as one of the means to enhance crop production efficiency on saline–alkali land. However, its efficacy in saline–alkali soils remains underexplored, particularly when combined with drainage.
Subsurface drainage involves the installation of drainage pipes underground to remove excess moisture from the soil, and it is currently widely used to improve coastal saline–alkali land [10,11,12]. First, subsurface drainage effectively prevents waterlogging caused by excessive water accumulation in the soil. Waterlogging can lead to soil hypoxia, inhibiting the respiratory function of crop roots. Second, subsurface drainage can improve soil structure. Long-term water accumulation can result in soil compaction. Conversely, subsurface drainage can restore soil looseness, increase air exchange within the soil, and enhance its permeability and water conductivity, aiding crop roots for better expansion and absorption of nutrients and moisture [13]. Additionally, the soil environment created by subsurface drainage can promote the decomposition of organic matter, enhance soil fertility, and increase nutrient supply. Most importantly, subsurface drainage can remove soluble salts from the soil [14], alleviating the stress caused by salinity.
In agricultural ecosystems, nitrogen serves as a primary growth-limiting nutrient for crops, leading to the intense competition for soil nitrogen between crops and microorganisms [15]. Therefore, nitrogen is a research hotspot in various types of soils and crops [16]. The sources of nitrogen absorbed by plants are twofold: soil and fertilizers. Soils with strong productivity have better synergy between seasonal nitrogen fertilizer input and absorption, meaning that the nitrogen fertilizer applied in the season can be maximally absorbed by the crops [17]. The synergy of biochar and subsurface drainage may alter soil characteristics, creating comfortable conditions for root development and subsequently enhancing crops’ ability to absorb fertilizer nitrogen; however, this process has rarely been studied, and the efficiency of crop fertilizer nitrogen absorption and its distribution after improvement with biochar and subsurface drainage on coastal saline–alkali soils has not been quantitatively evaluated, which has limited the practical assessment of soil improvement efficacy.
In previous studies, 15N isotope labeling and tracing techniques have often been used to distinguish between nitrogen fertilizer and soil nitrogen [18], especially in research on nitrogen fertilizer utilization efficiency and its behavior. Utilizing 15N isotope labeling and tracing techniques is beneficial for better understanding the behavior of fertilizer nitrogen. In the present study, we used 15N-labeled urea as a source of fertilizer, with salt-tolerant alfalfa suitable for planting in coastal saline–alkali land as the plant material. Different spacings of subsurface drainage and varying amounts of biochar were designed to observe the movement and distribution of fertilizer nitrogen (15N) and to statistically analyze the seasonal crop utilization efficiency of 15N under different treatments. This work focused on (1) quantifying the differences in alfalfa 15N utilization efficiency under different spacings of subsurface drainage and the combined application of biochar, (2) clarifying the movement and balance of 15N under different treatments, and (3) identifying combinations that maximize 15N use efficiency while minimizing N losses.
2. Materials and Methods
2.1. Experimental Location
The field trial was conducted over an 8-month period (March–October 2024). The trial was performed in the planting area of Cixi Hangzhou Bay Ningbo Haihan Agricultural Development Co., Ltd., located at a geographical coordinate of 30°10′ N latitude and 121°13′ E longitude (Figure 1). Located within the subtropical zone, the region displays four distinct seasons. According to climate data from the past decade, the area receives 1422 mm of rainfall and accumulates 1850 h of sunlight annually. The salinity level of the alkaline soil in the study area ranges from a minimum of 10 g/kg to a maximum of 280 g/kg. Before the experiment, the soil underwent appropriate improvement measures, including leaching irrigation, plant cultivation, and application of organic fertilizers. The precipitation during the experimental period is shown in Figure 2a, and temperature data are depicted in Figure 2b.
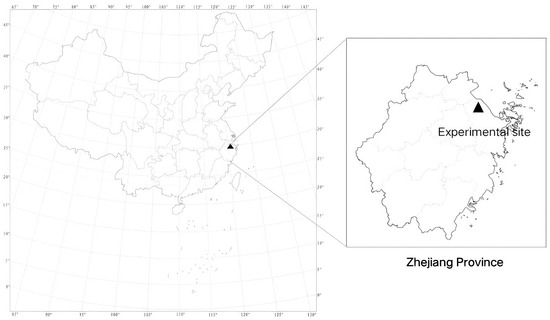
Figure 1.
Experimental site.
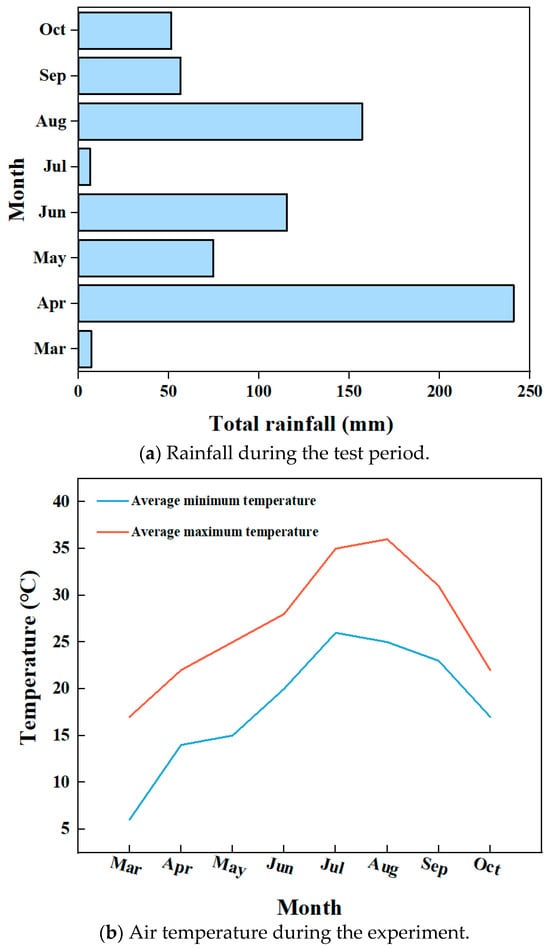
Figure 2.
Rainfall and temperature during the experiment.
Before experiment commencement, the physical and chemical indicators of the soil at a depth of 0–60 cm were measured, and results are shown in Table 1 and Table 2.

Table 1.
Physical and chemical properties of the soil.
Table 2.
Soil mechanical composition.
2.2. Experimental Design
The experimental design comprised four spacings of subsurface drainage (0 m (CK), 6 m (S1), 12 m (S2), and 18 m (S3)) combined with three application rates of biochar (5 t/ha (C1), 10 t/ha (C2), and 15 t/ha (C3)), resulting in a total of 4 × 3 = 12 treatments, each replicated three times (Figure 3). The subsurface drainage pipes were made of PVC corrugated pipes wrapped in non-woven fabric, buried at a depth of 1 m, with a gradient of 1‰. The raw material for biochar was peanut shells, carbonized at temperatures ranging from 350 °C to 500 °C. The biochar produced exhibited the following characteristics: pH 9.7, total nitrogen 5.6 g/kg, organic carbon 446.3 g/kg, and specific surface area 9.12 m2/g. Aside from the differences in subsurface drainage spacing and biochar application rates, all other field-management measures for each treatment were retained.
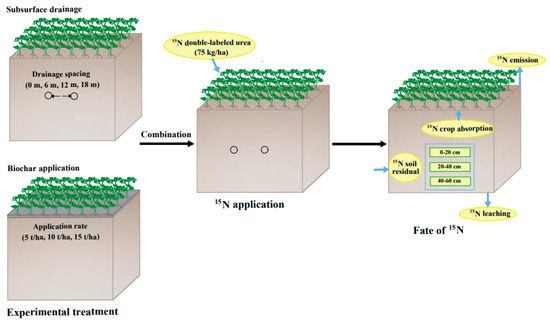
Figure 3.
Schematic of the experimental treatments.
Before sowing, 1000 kg/ha of organic fertilizer was mixed into the top 0–10 cm of soil. The organic fertilizer, formulated through the fermentation of effective microorganisms (EM)-activated solution combined with rice straw, soybean meal, and poultry manure, had a nutrient composition of 4.5% nitrogen, 2.5% phosphorus pentoxide, and 1.5% potassium oxide. For this study, Medicago sativa L. cv. ‘Zhongmu No. 3’ was used as the experimental plant material., and alfalfa seeds were sown on March 12 at a 25 kg/ha density. Irrigation was performed three times throughout the entire experiment, with amounts of 880, 960, and 830 m3/ha on 27 March, 2 July, and 17 August, respectively. Alfalfa was harvested three times on 4 June, 29 July, and 2 October.
A fragmented planting design was implemented, comprising multiple 60 m × 40 m (2400 m2) cultivation units. A 60 cm deep isolation membrane separated the fragments to prevent lateral moisture seepage. Each spacing of the drainage pipes occupied one fragment, and a 6 m × 6 m sub-area was set up in the middle of adjacent drainage pipes within the same fragment for the application of biochar. Each fragment contained three sub-areas, applying three different amounts of biochar. In the center of each sub-area, a 1 m×1 m micro-area was established, where 75 kg/ha of 15N double-labeled urea (abundance 19.6%) was applied. Each treatment was replicated three times, resulting in a total of 36 micro-areas.
2.3. Measurement Projects and Methods
At each harvesting of alfalfa, a random sample of 500 g was collected and subjected to high-temperature killing at 105 °C for 30 min. After the killing process, the temperature was lowered to 75 °C for drying until a constant weight was achieved. The dried samples were mechanically homogenized and passed through a 100-mesh sieve for measuring the total nitrogen and 15N atom percentage in the plants. After the last harvest of alfalfa, soil samples were collected layer by layer within the micro-area using a five-point sampling method with a soil auger at depths of 0–20 cm, 20–40 cm, 40–60 cm, and 60–80 cm. After collection, soil samples from the same layer were mixed uniformly, dried, and ground to be used for measuring soil 15N levels.
The total nitrogen in plant and soil samples was determined using the Kjeldahl method [19] after digestion with H2SO4-H2O2. The 15N atom percentage in the dry samples of soil and plants was measured using a Finnigan-MAT-251 isotope-ratio mass spectrometer (Finnigan, Bremen, Germany).
2.4. Data Calculation
The calculation method for crop fertilizer nitrogen-utilization efficiency (15N utilization efficiency) was as follows [20]:
where Ndff is the amount of nitrogen in alfalfa plants derived from 15N labeled urea (kg/ha), Cs is the total nitrogen content in the plant samples (kg/ha), Es is the 15N atom percentage in the plant samples (%), Ef is the 15N atom percentage of the labeled nitrogen fertilizer (%), and Mf is the 15N application amount (kg/ha).
The principle of 15N balance was that the input of 15N equals the sum of the loss of 15N and the recovery of 15N. The amount of 15N recovery was the total amount of 15N absorbed by the plants plus the total amount of 15N in the soil from 0 to 80 cm [19].
2.5. Data Analysis
Significant differences (p < 0.05) among treatments were identified through Duncan’s multiple-range test with SPSS 17.0 software.
3. Results
3.1. Impacts of Different Spacings of Drainage Pipes and Biochar Application on 15N Absorption by Alfalfa
The amount of 15N absorbed by the three cuts of alfalfa was highest in the second cut, followed by the third cut, whereas the first cut was at a relatively low level (Figure 4). The differences between treatments were evident in the first cut. Compared with the no-drainage-pipe treatment (CK), the drainage-pipe treatments significantly increased the 15N absorption in the first cut of alfalfa. The amounts of 15N absorbed under treatments S1, S2, and S3 in the first cut were 6.4, 5.7, and 4.7 kg/ha, respectively, which were 43.7%, 37.1%, and 24.0% higher than those under CK (3.6 kg/ha). Under the same drainage-pipe spacing, increasing the amount of biochar resulted in a 9.5–24.3% increase in 15N absorption in the first cut of alfalfa.
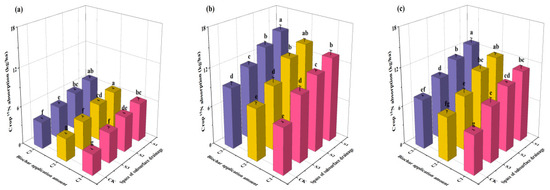
Figure 4.
Impact of different spacings of drainage pipes and biochar application on 15N absorption over three consecutive harvests (a): first cut, (b): second cut, (c): third cut. CK, S1, S2, S3 represent drainage-pipe spacing of 0 (no drainage), 6, 12, and 18 m, respectively. C1, C2, and C3 represent biochar application amounts of 5, 10, and 15 t/ha, respectively. Different letters (a–g) in the figure indicate significant differences at the 0.05 level, based on Duncan’s multiple range test, with all treatments compared together. The values in the figure represent the mean ± standard deviation.
The differences in 15N absorption in the second cut of alfalfa among treatments were more pronounced than in the first cut. Specifically, as the spacing between drainage pipes gradually decreased, the overall 15N absorption displayed a marked increase (p < 0.05); when the amount of biochar applied increased, the 15N absorption of alfalfa also increased, but this increase reached a significant (p < 0.05) level only when biochar application increased from C1 to C3. From the perspective of promoting 15N absorption by alfalfa, the drainage-pipe spacing had a greater impact on the second cut than the application of biochar. Under the drainage pipe treatments, the average 15N absorption for S1, S2, and S3 was 14.1, 12.8, and 10.6 kg/ha, respectively, higher than CK (8.2 kg/ha).
With decreased drainage-pipe spacing from S3 to S1, the 15N absorption of the third cut of alfalfa significantly (p < 0.05) increased, but when it decreased from S2 to S1, this difference was significant (p < 0.05) only at the C3 biochar application level. Compared with drainage pipes, the effect of biochar application on 15N absorption by alfalfa was relatively small, which was similar to the results observed in the second cut. In most cases, increasing the amount from C1 to C2 or from C2 to C3 did not result in a significant increase in 15N absorption by alfalfa, with a significant increase (p < 0.05) occurring only with increased biochar application from C1 to C3. The drainage pipes also promoted 15N absorption in the third cut of alfalfa, with absorption amounts of 11.9, 10.8, and 8.9 kg/ha under S1, S2, and S3, respectively, all found to be higher than those under CK (6.8 kg/ha).
A synergistic effect of drainage pipe and biochar application was observed among all 12 treatments. This synergy maximally promoted 15N absorption in all three cuts of alfalfa. Under the combination of S1 and C3, the absorption amounts of alfalfa for 15N reached their highest values of 6.8 (kg/ha) (first cut), 15.0 (kg/ha) (second cut), and 12.8 (kg/ha) (third cut). Compared with the CKC1 treatment, the 15N absorption amounts for the first, second, and third cuts of alfalfa under the S1C3 treatment increased by 116.0%, 111.9%, and 113.1%, respectively.
3.2. Impacts of Different Spacings of Drainage Pipes and Biochar Application on Soil 15N Distribution in Profile
With increased spacing of drainage pipes from S1 to S3, the total residual amount of 15N in the 0–80 cm profile significantly increased (Figure 5). Under S1 conditions, the average total residual amount in the profile was 30.2 kg/ha, whereas under S3, it increased to 40.9 kg/ha (C1), with an increase of 26.2%. However, no significant differences (p > 0.05) were observed in the total residual amount (37.3–39.5 kg/ha) among the three biochar application rates.
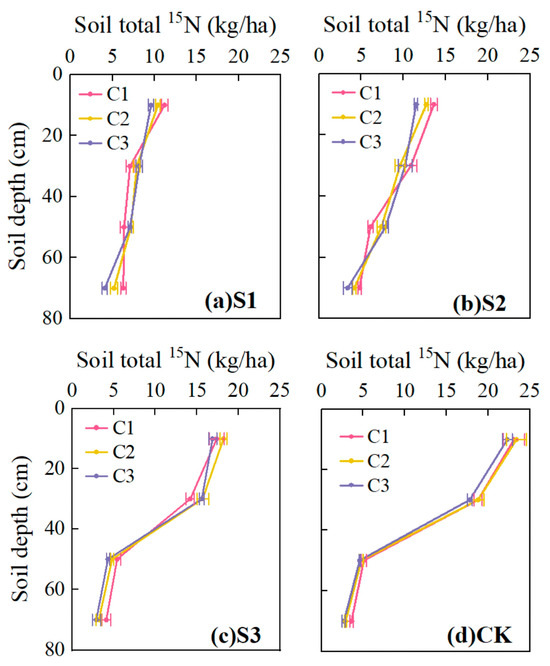
Figure 5.
Impact of different drainpipe spacings and biochar application rates on the distribution of 15N in the profile soil. (CK, S1, S2, and S3 represent drainpipe spacings of 0 m (no drainpipe), 6 m, 12 m, and 18 m, respectively; C1, C2, and C3 represent biochar application rates of 5, 10, and 15 t/ha, respectively.
The effect of drainpipe spacing on the 0–20 cm soil layer was similarly significant. The 15N residue in the 0–20 cm soil layer under the S1 treatment was only 9.6–11.2 kg/ha, whereas under the S3 spacing, the 15N residue reached 16.9–18.2 kg/ha. The 15N residue under the CK treatment was even twice as high as that under S1, indicating that installing drainpipes especially with smaller spacing reduced the 15N residue in the plow layer. The amount of biochar also affected the 15N residue in the plow layer, but the impact was much smaller than that of the drainpipe spacing. Specifically, increased biochar amount slightly decreased the 15N residue in the 0–20 cm soil layer.
For the two lower sampling layers (40–60 and 60–80 cm depth), which were beyond the main root zone of alfalfa, the effect of drainpipe spacing on the 15N residue was not significant in the 40–60 cm layer, where the S3 (4.3–5.4 kg/ha) and CK (4.6–5.1 kg/ha) treatments were slightly lower than the other two treatments. The amount of biochar also had no significant impact on the 15N residue in the 40–60 cm soil layer. In the 60–80 cm soil layer, the 15N residue increased with decreased drainpipe spacing. Under the S3 treatment, the 15N residue was 2.9–4.1 kg/ha, whereas under the S1 treatment, it increased to 4.1–6.3 kg/ha, indicating that smaller drainpipe spacing promoted the migration of 15N to deeper soil layers.
3.3. Impacts of Different Drainpipe Spacings and Biochar Application on Alfalfa 15N Utilization Efficiency
Under the S1 spacing, the 15N utilization efficiency of alfalfa plants ranged from 40.5% to 46.0%, demonstrating statistically significant (p < 0.05) elevation compared with CK (21.6% to 28.4%), with an increase of 87.7% to 113.1% (Figure 6). Similarly, under the S2 spacing, the 15N utilization efficiency of alfalfa plants (36.5% to 41.2%) was also significantly (p < 0.05) higher than that of CK, with an increase of 69.1% to 90.7%. Although the 15N utilization efficiency of alfalfa plants under the S3 spacing (31.2% to 35.0%) was also greater than that of CK, the increase was relatively smaller, ranging from 44.4% to 61.9%. Therefore, drainpipe drainage can significantly improve alfalfa’s 15N utilization efficiency, but the enhancement effect diminished as the drainpipe spacing increased.
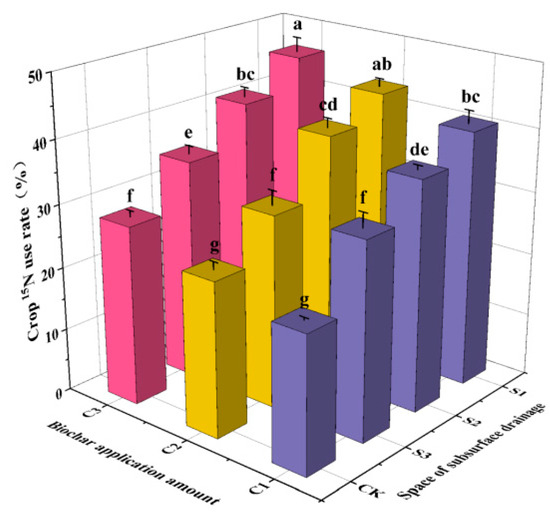
Figure 6.
Effect of different drainpipe spacings and biochar application on alfalfa 15N utilization efficiency. (CK, S1, S2, and S3 represent drainpipe spacings of 0 m (no drainpipe), 6 m, 12 m, and 18 m, respectively; C1, C2, and C3 represent biochar application rates of 5, 10, and 15 t/ha, respectively. Different letters (a–g) in the figure indicate significant differences at the 0.05 level, based on Duncan’s multiple range test, with all treatments compared together. The values in the figure represent the mean ± standard deviation.)
Under the same drainpipe spacing, the 15N utilization efficiency of alfalfa plants exhibited a positive correlation with biochar application rates. For example, under the S1 treatment, the 15N utilization efficiency of C2 and C3 treatments increased by 6.6% and 13.6%, respectively, compared with the C1 treatment. Under the S2 treatment, the 15N utilization efficiency of C2 and C3 treatments increased by 8.0% and 12.8%, respectively, compared with C1. In the S3 treatment, the C3 treatment increased by 12.1% compared with C1. Notably, the impact of biochar application on alfalfa’s 15N utilization efficiency was less significant than that of drainpipe spacing.
From the perspective of improving 15N utilization efficiency, the S1C3 treatment showed the best effect on alfalfa nitrogen-utilization efficiency. Under this treatment, the 15N utilization efficiency was 46.0%, which did not differ significantly from that under S3C2 treatment (p > 0.05), while surpassing other treatments.
The crop 15N use rate showed a negative correlation with the residual 15N content in the 0–20 and 20–40 cm soil layers (Figure 7), indicating a balance between the crop 15N uptake and the residual 15N in shallow soil layers. However, no significant correlation was observed between the crop 15N use rate and the residual 15N content in 20–40 and 40–60 cm soil layers. Additionally, a marked positive correlation was found between crop 15N use rate and 15N uptake by the three harvests of alfalfa.
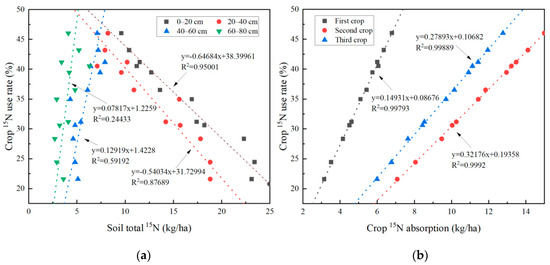
Figure 7.
Relationship between crop 15N use rate and residual 15N in different soil layers (a) and 15N uptake by three harvests of alfalfa (b).
3.4. Balance of 15N Under Different Drainpipe Space and Biochar Application
Under different drainpipe spacings and biochar application conditions, the balance of 15N (including crop absorption, soil residue, and loss) showed variations (Table 3). Compared with CK, the drainage-pipe treatment increased the absorption of 15N by alfalfa plants while reducing the 15N residue in the soil, but it also increased the 15N loss. This pattern became more pronounced as the drainpipe spacing decreased. Under the same drainpipe spacing, increasing the biochar application rate generally enhanced alfalfa’s 15N absorption while slightly reducing the 15N residue in the soil and the 15N loss.
Table 3.
15N balance under different drainpipe spacings and biochar application conditions.
Under different drainpipe spacings and biochar application rates, 21.6% to 46.0% of the exogenous 15N applied was absorbed by the crop, 38.6% to 67.5% remained in the soil, and 8.5% to 18.1% was lost through leaching, gaseous losses, or other unknown losses (Figure 8). A good treatment was considered one that can increase the crop’s 15N absorption ratio while decreasing the 15N soil residue and loss ratios. However, according to the results of this study, no treatment exhibited all these beneficial effects simultaneously.
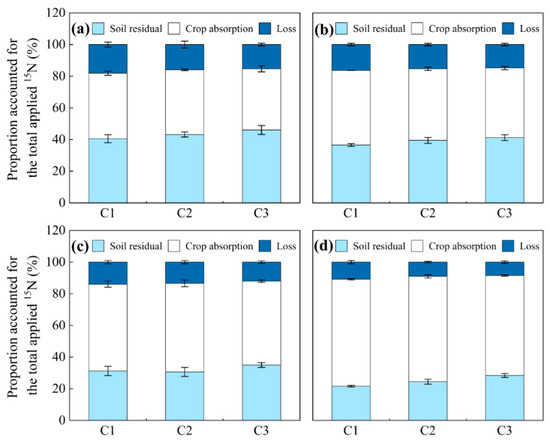
Figure 8.
Distribution proportions of 15N under different drainpipe spacings and biochar application rates as a percentage of the total applied amount (a) at 6 m, (b) at 12 m, (c) at 18 m and (d) at 0 m. C1, C2, and C3 represent biochar application rates of 5, 10, and 15 t/ha, respectively.
4. Discussion
Alfalfa is one of the suitable crops for planting in coastal saline–alkali soils. It is characterized by its salt tolerance and ease of management. After harvesting, alfalfa can serve as forage for livestock. Therefore, alfalfa yield is one of the key concerns of the local coastal agricultural industry. Similarly to other crops, alfalfa yield is closely related to nitrogen supply. This study proposed using alfalfa’s nitrogen absorption as an indicator to assess the soil’s production capacity and evaluate the effects of measures like subsurface drainage and biochar application on the improvement in coastal saline–alkali soils. Furthermore, the fate of externally applied 15N in the alfalfa–soil system under these two measures was investigated.
Our study found that increasing the amount of biochar promoted alfalfa’s absorption of 15N owing to the following reasons. (1) The abundant functional groups on the surface of biochar give it strong adsorption capacity, improving soil aggregate structure, enhancing aggregate stability, increasing soil porosity [21], and promoting root growth and development of alfalfa, thereby increasing its nutrient absorption. (2) The application of biochar increased the retention of water and 15N nutrients in the soil, thereby increasing the amount of 15N available for alfalfa absorption [22]. Xie [23] demonstrated that biochar may promote plant growth and improve nitrogen-use efficiency by increasing nutrient availability and enhancing microbial activity. (3) Coastal saline–alkali soils contain Na+, and increased biochar application reduces Na+ stress on plants [24]. Subsurface pipe drainage physically removed portion of Na+ from the plow layer through leaching effects, and its combination (with biochar) may synergistically enhance the mitigation of Na+ stress.
Notably, the promoting effect of biochar on 15N absorption weakened from the first to the third harvest. The reason may be that with the movement of soil moisture and root growth, more biochar migrated into areas outside the root zone, reducing its beneficial effects in the root zone. Conversely, drainpipe drainage continued to significantly promote alfalfa’s absorption of 15N during the second and third harvests. Some studies suggest that the installation of drainpipes promotes the decomposition and transformation of soil organic matter, increasing nutrient mineralization and thus the mineral nitrogen content in the plow layer [25], which may increase alfalfa’s absorption of 15N. However, other researchers argue that increased drainage leads to the loss of easily soluble mineral nutrients in the plow layer [26], which can reduce alfalfa’s absorption of 15N. This study leaned toward the idea that drainpipe drainage, especially with smaller spacings, helped reduce salinity in the root zone, alleviating salt stress on the crops and promoting the absorption of water, nutrients, and dry matter accumulation. An earlier study demonstrated that the 33.96–46.02% of soil salt storage changes in the 0–150 cm were drained away by subsurface pipes [27]. The process of accumulating dry matter required extracting large amounts of nitrogen, including the applied 15N, from the soil.
Our result further showed that drainpipe drainage and biochar application affected soil 15N residues. However, drainpipe drainage had a more significant effect on the 15N in the entire soil profile, whereas the effect of biochar on 15N was limited to the plow layer (Figure 5). The reason may be the direct effect of drainpipe drainage on soil 15N residues; by contrast, the effect of biochar on 15N residues was indirect. Drainpipe drainage influenced water movement throughout the entire soil profile above the pipes, with water acting as the carrier for 15N, directly affecting where 15N was ultimately retained in the soil layers. Meanwhile, biochar’s effect on 15N retention in deeper soil layers may be due to its promotion of alfalfa’s absorption of 15N (Figure 4), which led to a decrease in the amount of 15N remaining in the surface layer.
The subsurface drainage significantly improved the alfalfa plants’ efficiency in utilizing 15N. The reduced drainage-pipe spacing resulted in greater improvements in 15N use efficiency because of the alternating wet and dry conditions that formed with smaller pipe spacing. They were more conducive to the mineralization of 15N [28], thereby promoting the crop’s absorption of 15N. Additionally, subsurface drainage improved the root environment for crop absorption, such as porosity, oxygen, moisture content, and salinity [29], which may also be an important reason for the increase in 15N utilization efficiency. Our study demonstrated that the application of biochar can improve alfalfa’s 15N utilization efficiency, consistent with the findings of Yan [30] and Shi [31]. Yan showed through column-leaching simulations that biochar helps slow the release of nitrogen from ammonium sulfate in chemical fertilizers, thereby reducing nitrogen loss and increasing crop efficiency in utilizing external nitrogen. Shi [31] showed that biochar significantly improves soil bacterial communities, increasing the abundance of nitrogen conversion functional genes. In turn, fertilizer nitrogen transformed into the soil mineral nitrogen pool. From an agronomic perspective, the increased nitrogen use efficiency of crops is of paramount importance. In this study, crop nitrogen use efficiency was closely associated with soil 15N residual content and 15N losses. Taking biochar application as an example, the biochar application rate was found to have a highly significant (p < 0.01) effect on soil 15N residue. Higher biochar application rates led to greater utilization amount of current-season fertilizer nitrogen by crops, which simultaneously reduced nitrogen residue in soil and decreased the risk of 15N losses.
Our experiments revealed that the 15N residual proportion at 40–60 and 60–80 cm depths in the S1 treatment (accounting for the total 15N in the 0–80 cm soil layer) was significantly higher than those in the other two subsurface drainage treatments. The reason may be that under this spacing, water infiltration was smoother, but it can also increase the risk of 15N leaching. The higher total 15N loss in the S1 spacing (Figure 7) supported this hypothesis. Overall, the 15N residual in the 60–80 cm soil layer was relatively low, so we inferred that the total loss of 15N was primarily from gaseous losses, with less leaching to soil layers below 80 cm. We further speculated that the slight reduction in 15N loss after biochar application may be due to its control over volatilization losses.
In this study, no treatment simultaneously promoted alfalfa’s 15N absorption while reducing 15N residue or decreasing 15N losses. Therefore, although the 6 m spacing and 15 t/ha biochar application rate were satisfactory choices in terms of improving 15N utilization efficiency, in practical applications, attention should be paid to the potential loss risks of external nitrogen under this treatment. Moreover, gaseous and leaching losses were difficult to monitor in this work, leading to the estimation of losses by subtracting the soil residual 15N and crop absorbed 15N from the total 15N. Future studies should refine the observation of 15N losses.
A limitation in our study was the relatively small scale of the 15N-labeled experimental plots. The larger trial areas would yield findings more representative of actual production conditions. Practically, the coastal saline-alkali soil reclamation must prioritize cost considerations, particularly biochar expenses, due to the vast scale of coastal farmlands requiring treatment and the correspondingly massive biochar quantities needed. For countries like China that actively promote coastal saline soil cultivation as long-term arable land, inputting higher initial costs (even with short-term economic losses) was acceptable. Conversely, nations utilizing such lands only for emergency or intermittent cultivation should conduct thorough cost–benefit analyses before implementation.
5. Conclusions
Narrowing the spacing of drainage pipes and increasing the application of biochar promoted the 15N absorption in three cuts of alfalfa. The effect of drainage pipes was more persistent than that of biochar. Compared with the control (CK) treatment (3.6, 8.2, and 6.8 kg/ha), the 15N absorption by alfalfa under drainage pipe treatments (4.7–6.4, 10.6–14.1, and 8.9–11.9 kg/ha for the first, second, and third cuts, respectively) was significantly higher. Drainage pipes had a noticeable effect on the total 15N residue in the 0–80 cm soil profile, and narrower spacing of drainage pipes promoted the migration of 15N from shallow to deeper soil layers. However, biochar application had only a slight effect on the 15N residue in the 0–20 cm soil layer and no significant effect on the total 15N residue. Among all treatments, S1C3 showed the best improvement in alfalfa nitrogen-use efficiency. Under this treatment, the alfalfa 15N utilization efficiency was 46.0%, statistically comparable with that of S3C2 while demonstrating significant (p < 0.05) superiority over remaining treatments. Under the influence of different drainage-pipe spacings and biochar applications, 21.6–46.0% of the exogenous 15N was absorbed by the crops, 38.6–67.5% remained in the soil, and 8.5–18.1% was lost through leaching, gaseous emissions, or other unknown losses that were estimated rather than directly measured. Our comprehensive results indicated that drainage-pipe installation combined with biochar application had different effects on the fate of 15N. A 6 m spacing and 15 t/ha biochar application promoted the absorption of exogenous nitrogen by alfalfa and improved nitrogen-use efficiency. However, the potential risk of 15N loss should be considered in practical applications of these combined measures.
Author Contributions
Conceptualization, H.X., J.L. and Y.A.H.; methodology, H.X., S.H. and C.L.; software, Q.L. and Z.H.; validation, Y.L. and L.X.; formal analysis, H.S. and Q.S.; investigation, H.X., J.L. and S.H.; resources, Y.A.H. and Q.S.; data curation, C.L. and Z.H.; writing—original draft, H.X. and J.L.; writing—review and editing, Y.A.H. and Q.S.; visualization, Y.L. and L.X.; supervision, Y.A.H. and Q.S.; project administration, H.X.; funding acquisition, Q.S. All authors have read and agreed to the published version of the manuscript.
Funding
This research was funded by [Efficient Salt Reduction Technology Through Optimized Irrigation and Drainage Management for Saline-Alkali Farmland] by Nanjing hydraulic research institute, grant number (2022YHTDJB02-1).
Data Availability Statement
Data is contained within the article. Further inquiries can be directed to the corresponding author.
Conflicts of Interest
Authors Hong Xiong, Jinxiu Liu, Shunshen Huang, Chengzhu Li, Yaohua Li, Lieyi Xu, Zhaowang Huang, and Qiang Li were employed by the CCCC Guangzhou Dredging Co., Ltd. The remaining authors declare that this research was conducted in the absence of any commercial or financial relationships that could be construed as potential conflicts of interest.
Abbreviations
| N | nitrogen |
| CK | no-drainage-pipe treatment |
| S1 | drainage spacing of 6 m |
| S2 | drainage spacing of 12 m |
| S3 | drainage spacing of 18 m |
| C1 | biochar application rate of 5 t/ha |
| C2 | biochar application rate of 10 t/ha |
| C3 | biochar application rate of 15 t/ha |
References
- Jin, Q.; Tong, J.; Yao, Y.; Chen, C.; Wang, F.; Peng, H.; You, J.; Shaghaleh, H.; Hamoud, Y.A. Chinese Violet Cress (Orychophragmusviolaceus L.) Yield and Nitrogen Balance in Response to Coupling Effects of Water–Nitrogen Application—A Case Study Using 15N Tracing Technique. Water 2023, 15, 904. [Google Scholar] [CrossRef]
- Wang, Z.; Tian, M.; Wang, Y.; Chen, S.; Fang, H.; Hamoud, Y.A.; Hong, C.; Wang, Y.; Liu, J.; Shaghaleh, H. Vertical non-uniform distribution of soil salinity enhances nitrogen utilization efficiency and influences δ15N distribution in tomato plants. Environ. Exp. Bot. 2024, 226, 105911. [Google Scholar] [CrossRef]
- Wang, Z.; Liu, J.; Wang, Y.; Evgenios, A.; Alhaj, H.Y.; Qiu, R.; Hong, C.; Tian, M.; Hiba, S.; Guo, X. Relationships between stable isotope natural abundances (δ13C and δ15N) and water use efficiency in rice under alternate wetting and drying irrigation in soils with high clay contents. Front. Plant Sci. 2022, 13, 1077152. [Google Scholar] [CrossRef] [PubMed]
- Wang, Z.; Liu, J.; Alhaj, H.Y.; Wang, Y.; Qiu, R.; Evgenios, A.; Hong, C.; Hiba, S. Natural 15N abundance as an indicator of nitrogen utilization efficiency in rice under alternate wetting and drying irrigation in soils with high clay contents. Sci. Total Environ. 2022, 838, 156528. [Google Scholar] [CrossRef] [PubMed]
- Yuan, S.; Zhao, L.; Meng, H.; Shen, Y. The main types of biochar and their properties and expectative researches. J. Plant Nutr. Fertil. 2016, 22, 1402–1417. [Google Scholar]
- Lehmann, J.; Joseph, S. Biochar for Environmental Management: Science, Technology and Implementation; Routledge: London, UK, 2024; pp. 1–2. [Google Scholar]
- Huang, C.; Chen, Y.; Jin, L.; Yang, B. Properties of Biochars Derived from Different Straw at 500 °C Pyrolytic Temperature: Implications for Their Use to Improving Acidic Soil Water Retention. Agric. Water Manag. 2024, 301, 108953. [Google Scholar] [CrossRef]
- Sang, L.; Zhou, J.; Wu, S.; Wang, Z.; Shen, Y. Effect of Biochar on Yield, Water and Nitrogen Utilization, and Soil Nutrients of Winter Wheat in Dryland. J. Triticeae Crops 2025, 45, 1–9. [Google Scholar]
- Gu, S.; Zhang, D.; Niu, Y.; Xu, J. Functions of biochar in soil and its research progress on soil improvement. Seed Sci. Technol. 2024, 42, 133–135. [Google Scholar]
- Yao, C.; Guo, C.; Wu, J.; Qiang, W.; Qin, S.; Yang, H.; Li, H. Evaluation of Combined Open Ditch and Subsurface Drainage: Experimental Data and Optimization of Specifications in Arid Northwest China. Agric. Water Manag. 2024, 306, 109182. [Google Scholar] [CrossRef]
- Guo, C.; Yao, C.; Wu, J.; Qin, S.; Yang, H.; Li, H.; Mao, J. Field and Numerical Experiments of Subsurface Drainage Systems in Saline and Low-Permeability Interlayered Fields in Arid Regions. Agric. Water Manag. 2024, 300, 108898. [Google Scholar] [CrossRef]
- Li, D.; Yang, Y.; Zhao, Y.; Zhou, X.; Han, Q.; Liu, H.; Li, M. Optimizing Cotton Yield and Soil Salinity Management: Integrating Brackish Water Leaching and Freshwater Drip Irrigation with Subsurface Drainage. Field Crops Res. 2024, 314, 109454. [Google Scholar] [CrossRef]
- Hou, M.; Chen, J.; Yang, Q.; Lin, Z.; Jin, Q.; Zhong, F. Behavior of Coastal Greenhouse Soil Nitrogen as Influenced by Subsurface Drainage and Organic Fertilizer. Trans. Chin. Soc. Agric. Mach. 2019, 50, 259–266. [Google Scholar]
- Zhang, J.; Ye, Y.; Lu, C. Salt Leaching Efficiency of Subsurface Drainage Systems with Mass Transfer Limitations. J. Hydrol. 2024, 632, 130940. [Google Scholar] [CrossRef]
- Wang, Z.; Li, Y.; Wang, Y.; Liu, C.; Wang, Z.; Li, H.; Geng, P.; Guo, X. Effects of microbial fertilizers on tomato yield, N2O emission, and nitrogenutilization in greenhouse soils. Trans. Chin. Soc. Agric. Eng. 2025, 41, 127–136. [Google Scholar]
- Qu, S.; Li, Z.; Qiu, C.; Yang, G.; Song, X.; Chen, Z.; Liu, C. Remote sensing prediction of winter wheat grain protein content based on nitrogen nutrition index at anthesis stage. Trans. Chin. Soc. Agric. Eng. 2017, 33, 186–193. [Google Scholar]
- Liang, B.; Zhao, W.; Yang, X.; Zhou, J. Fate of Nitrogen-15 as Influenced by Soil and Nutrient Management History in a 19-Year Wheat–Maize Experiment. Field Crops Res. 2013, 144, 126–134. [Google Scholar] [CrossRef]
- Hou, M.; Tang, S.; Zhu, Q.; Chen, J.; Xiao, Y.; Jiu, Q.; Zhong, F. Long-Term Fermented Organic Fertilizer Application Reduce Urea Nitrogen-15 Loss from Plastic Shed Agricultural Soils. Ann. Agric. Sci. 2023, 68, 108–117. [Google Scholar]
- Xu, R.; Chen, J.; Lin, Z.; Chen, X.; Hou, M.; Shen, S.; Jin, Q.; Zhong, F. Fate of Urea-15N as Influenced by Different Irrigation Modes. RSC Adv. 2020, 10, 11317–11324. [Google Scholar]
- Hou, M.; Jin, Q.; Lu, X.; Li, J.; Zhong, H.; Gao, Y. Growth, Water Use, and Nitrate-15N Uptake of Greenhouse Tomato as Influenced by Different Irrigation Patterns, 15N Labeled Depths, and Transplant Times. Front. Plant Sci 2017, 8, 666. [Google Scholar] [CrossRef]
- Singh, H.; Northup, B.K.; Rice, C.W.; Prasad, P.V.V. Biochar Applications Influence Soil Physical and Chemical Properties, Microbial Diversity, and Crop Productivity: A Meta-Analysis. Biochar 2022, 4, 8. [Google Scholar] [CrossRef]
- Luo, Z.; Li, Y.; Pei, X.; Woon, K.S.; Liu, M.; Lin, X.; Hu, Z.; Li, Y.; Zhang, Z. A Potential Slow-Release Fertilizer Based on Biogas Residue Biochar: Nutrient Release Patterns and Synergistic Mechanism for Improving Soil Fertility. Environ. Res. 2024, 252, 119076. [Google Scholar] [CrossRef]
- Xie, C.; Lv, C.; Huang, B.; Chen, Z.; Ren, B. Biochar with or Without Nitrogen Fertilizer Influences Soil Microbial Carbon Utilization, Bacterial Diversity, and Nitrogen Dynamics in a Eucalyptus Plantation. J. Soil Sci. Plant Nutr. 2024, 25, 465–477. [Google Scholar] [CrossRef]
- Jaffar, M.T.; Chang, W.; Zhang, J.; Mukhtar, A.; Mushtaq, Z.; Ahmed, M.; Zahir, Z.A.; Siddique, K.H.M. Sugarcane bagasse biochar boosts maize growth and yield in salt-affected soil by improving soil enzymatic activities. J. Environ. Manag. 2024, 363, 121418. [Google Scholar] [CrossRef]
- Chen, S.; Dai, H. The effect of dark pipe drainage to transform cold soaking fields in mountainous areas. J. Zhejiang Agric. Sci. 2000, 2, 4. [Google Scholar]
- Bao, T.; Huang, W.; Chen, X.; Xu, M. The effect of subsurface drainage system on soil condition and tomato quality. J. Food Agric. Environ. 2013, 11, 331–335. [Google Scholar]
- Liu, J.; Huang, Q.; Hou, Z.; Zhu, X.; Xue, F.; Huang, G. Effects of subsurface drainage and year-round irrigation on crop water-salt stress and yield in an arid region. Agric. Water Manag. 2025, 312, 109406. [Google Scholar] [CrossRef]
- Sun, Y.; Yan, F.; Liu, F. Drying/rewetting cycles of the soil under alternate partial root-zone drying irrigation reduce carbon and nitrogen retention in the soil-plant systems of potato. Agric. Water Manag. 2013, 128, 85–91. [Google Scholar] [CrossRef]
- Mukhopadhyay, R.; Fagodiya, R.K.; Narjary, B.; Barman, A.; Prajapat, K.; Kumar, S.; Bundela, D.S.; Sharma, P.C. Restoring Soil Quality and Carbon Sequestration Potential of Waterlogged Saline Land Using Subsurface Drainage Technology to Achieve Land Degradation Neutrality in India. Sci. Total Environ. 2023, 885, 163959. [Google Scholar] [CrossRef]
- Yan, S.; Guo, T.; Han, Y.; Liu, Y.; Jiang, H.; Zhang, Y.; Yan, Q. Effect of biochar combined with ammonium sulfate on nitrogen release performance in soil. Trans. CSAE 2024, 40, 94–102. [Google Scholar]
- Shi, G.; Hou, R.; Li, T.; Fu, Q.; Chen, Q.; Xue, P.; Yang, X. Effects of Biochar on the Transformation and Utilization of Nitrogen Fertilizer in the Black Soil Region of Northeast China. Sci. Total Environ. 2024, 953, 176218. [Google Scholar] [CrossRef]
Disclaimer/Publisher’s Note: The statements, opinions and data contained in all publications are solely those of the individual author(s) and contributor(s) and not of MDPI and/or the editor(s). MDPI and/or the editor(s) disclaim responsibility for any injury to people or property resulting from any ideas, methods, instructions or products referred to in the content. |
© 2025 by the authors. Licensee MDPI, Basel, Switzerland. This article is an open access article distributed under the terms and conditions of the Creative Commons Attribution (CC BY) license (https://creativecommons.org/licenses/by/4.0/).