Article

Surface Water Runoff Estimation of a Continuously Flooded Rice Field Using a Daily Water Balance Approach—An Irrigation Assessment

1
National Institute of Agricultural Research (INIA), Treinta y Tres 33000, Uruguay
2
Department of Agricultural Systems and Cultural Landscapes, Centro Universitario Regional del Este, Universidad de la República, Treinta y Tres 33000, Uruguay
3
Hydrology, Irrigation and Drainage Unit, Department of Soils and Water, Faculty of Agronomy, Universidad de la República, Montevideo 11900, Uruguay
4
Institute of Fluid Mechanics and Environmental Engineering, Faculty of Engineering, Universidad de la República, Montevideo 11300, Uruguay
5
Department of Biometrics and Statistics, Faculty of Agronomy, Universidad de la República, Montevideo 11900, Uruguay
*
Author to whom correspondence should be addressed.
Water 2025, 17(14), 2069; https://doi.org/10.3390/w17142069
Submission received: 6 June 2025 / Revised: 8 July 2025 / Accepted: 8 July 2025 / Published: 10 July 2025
(This article belongs to the Section Water, Agriculture and Aquaculture)

Abstract

The high water demand of rice cultivation is mainly due to flood irrigation, which requires large volumes not only to meet evapotranspiration needs, but also due to losses from percolation, lateral seepage, and surface runoff. In addition to lowering water use efficiency, surface runoff may transport nutrients. This study aimed to calibrate and validate a daily water balance model to estimate surface runoff losses across three rice-growing seasons. During the first two seasons, different model components were calibrated by comparing simulated and observed water depths. In the final season, the calibrated model was validated using direct runoff measurements obtained from weirs and flowmeters. Results showed strong agreement between model estimates and direct measurements of water depth and surface runoff. Linear regression models showed good fit, with coefficients of determination (R2) above 0.80 for water depth and 0.79 for runoff. A validated daily water balance model, combined with periodic monitoring of water depth, proved to be a reliable tool for estimating surface runoff during the rice-growing season. Total runoff—from irrigation, rainfall, and final drainage—represented between 7.5% and 18% of the total water input. This approach offers a practical tool for improving irrigation water management and understanding runoff-driven nutrient transport.

1. Introduction

Agriculture faces the global challenge of increasing food and fiber production to satisfy the demands of a growing population, without compromising either human health or ecosystem integrity [1,2]. This challenge is further intensified by climate change and increasing competition for natural resources, particularly water, which is scarce in many regions of the world [3,4]. Rice (Oryza sativa), a staple food for nearly half of the global population [5], occupies just 10% of global agricultural land but consumes between 34% to 43% of irrigation water [6,7]. This high water demand stems primarily from flooding irrigation, a widely adopted system in rice production that requires great volumes of water, not only for the evapotranspiration of the crop, but also due to the losses of percolation, seepage, and water runoff [8].
Among the main agronomic benefits of continuous flooding in rice cultivation are more effective weed control [9], increased nutrient availability [10], reduced incidence of diseases [11], and protection against low temperatures during microsporogenesis [12]. The constant presence of a water layer plays a key role in weed suppression without hindering rice growth, as the crop has developed specialized structures, known as aerenchyma, which allow it to survive under aquatic conditions [13].
Nevertheless, the agronomic benefits of continuous flooding must be considered alongside its environmental impacts. One of the main adverse effects is surface runoff, which not only reduces water use efficiency but also serves as a transport pathway for nutrients and agrochemicals to surface water bodies, contributing to their degradation [14,15,16]. Researchers have identified diffuse losses of phosphorus and nitrogen from agricultural systems as one of the leading causes of eutrophication in aquatic ecosystems [15,17]. It is estimated that approximately 20% of the nutrients applied to crops may be exported to water bodies, leading to environmental deterioration [18,19]. In particular, the flood irrigation system used in rice cultivation significantly increases the risk of diffuse pollution, as it facilitates the transport of agrochemicals to both surface and groundwater [20].
In Uruguay, several studies have measured the water use in rice, reporting values ranging from 8000 to 15,000 m3 ha−1, depending on the year and region [21,22,23,24,25]. However, little is known about when and how much of that total water volume constitutes surface runoff throughout the crop cycle.
The concentration of Clomazone in the water, an herbicide widely used in Uruguayan rice crops, was reported to peak five to seven days after flooding, followed by a decrease to undetectable levels after 50 days [26]. Similar results were found by [27], who observed that glyphosate and aminomethylphosphonic acid (AMPA) reached their maximum concentration during the first week after flooding and gradually declined until becoming undetectable 60 days later.
It is likely that nutrients applied at the sowing phase could follow similar concentration patterns in the rice water as the previously mentioned agrochemicals [26,27]. Therefore, it is very important to be able to know and determine at which moments and in what quantity surface runoffs happen during a crop cycle to be able to correctly quantify the diffuse pollution to water bodies.
In South America, rice is sown mainly in dry soil and flooded 15 to 25 days after emergence, when the plants have between three and five leaves (V3–V5, according to [28]). From that stage onwards, the crop is maintained under a water layer 5–10 cm deep until approximately 20 days before harvest [29].
Throughout the growing season, surface runoff occurs mainly under two conditions: (1) during precipitation events, when accumulated water exceeds the maximum height defined by the contour levees and overflows, and (2) during irrigation intended to maintain the flood layer, when the volume of water applied surpasses the capacity of the levees, leading to excess water that also contributes to surface runoff.
The direct measurement of surface runoff presents technical challenges due to the wide range of flow rates, which complicates the installation of systems capable of accurately measuring these flows. As a result, various methodologies are often required, many of which are costly to implement [30]. Therefore, it is essential to explore alternative approaches that enable the accurate estimation of surface runoff.
A commonly used approach to estimate water outflows in agricultural systems is the water balance model, which integrates input components (irrigation and precipitation) and output components (evapotranspiration, percolation, lateral losses, and surface runoff). This approach is based on the principle that, for any given day, the sum of inputs must equal the sum of outputs [31,32,33,34,35]. The different components of the balance can be determined through direct measurements, estimates, or as residual terms of the model. This method not only optimizes resource use but also offers a flexible and scalable framework applicable to a wide range of conditions and study scales.
Several authors have employed daily water balance models to estimate surface runoff and assess water productivity in flooded rice systems. For example, [33] applied this approach to compare dry-seeded and puddled transplanted systems, evaluating percolation, runoff, and irrigation performance. The study in [35] used an in situ water balance method to estimate water and nutrient losses in paddy fields in the Taihu Lake Basin, finding that runoff accounted for between 6% and 42% of total water input, depending on hydrometeorological conditions. These studies demonstrate the usefulness of the water balance approach in a variety of agronomic and climatic settings.
However, most of these efforts have been conducted in Asian environments, with soil properties, irrigation infrastructure, and rainfall patterns that differ from those of southern South America. In particular, there is a lack of empirical studies validating daily water balance models using direct surface runoff measurements in flooded rice systems of this region. The main innovation of this study lies in the use of direct surface runoff measurements—obtained through flowmeters and weirs—as the basis for model validation. This empirical approach provides robust evidence of the model’s accuracy, strengthening its applicability to water management.
In this context, the aim of this study was to calibrate and validate a methodology for estimating surface runoff using a daily water balance model. Specifically, the objectives were: to (i) calibrate the model using field-measured data on water depth, irrigation, and precipitation over two rice-growing seasons; (ii) validate the model using direct surface runoff measurements during a third season; and (iii) analyze the behavior of the main components of the water balance in flooded rice systems.

2. Materials and Methods

2.1. Experimental Site

The study site was in eastern Uruguay (33°16′22.21″ S, 54°10′23.10″ W), as shown in Figure 1, and was in the temperate grassland terrestrial ecoregion [36]. The climate is humid and mesothermic, with a mean temperature of 22.3 ± 0.85 °C during the summer and 11.5 ± 0.82 °C in the winter. The dominant soils are Argialboll, according to USDA Soil Taxonomy [37], with 0.5% slopes. The average annual precipitation is 1360 ± 315 mm, showing significant variation within and between years; the total annual potential evapotranspiration is 1138 ± 177 mm [38].
The work was conducted in a long-term experiment in Uruguay initiated in 2012, with plot sizes of 20 m wide and 60 m long (experimental unit), as shown in Figure 1, which were bordered by contour levees, which were trapezoidal in sections with a 1 m base, had a 0.40 m top, and had a height of 0.15–0.2 m. Each plot was designed as an autonomous unit, with an independent irrigation inlet and surface water outlet. Basic physicochemical properties of the soil in the experimental plots are summarized in Table 1.
Meteorological variables (precipitation, evapotranspiration, and Class A Evaporation Pan “Tank A”) were obtained from the weather station at the same site where the experiment was conducted, as shown in Figure 1 and Table 2.
This study was carried out over three growing seasons: 2020–21, 2021–22, and 2022–23. For each season, four units were selected from two different rotations: two represented the first year of rice in a Rice–Pasture (Ri-Pa) rotation, which consisted of two years of rice followed by four years of pasture, and the other two represented continuous rice (Ri-Ri), which involved planting rice every year. The latter system was not applied in Uruguay but was studied to explore potential differences in crop intensity.
Rice was dry-seeded in early November, and harvesting took place between March and April, depending on the season. Each growing season spanned part of two calendar years. For the purposes of this study, each growing season refers to the year in which the harvest was conducted: 2021, 2022, or 2023.
The flooding period began in late November with the first irrigation and ended in March or early April. The local recommendation [21] states that in order to harvest with dry soil conditions, irrigations should stop 20–25 days in advance to allow the water layer to dissipate. Precipitation may occur during this final phase of the crop, potentially impeding this process, therefore necessitating a final drainage. This constitutes an additional water outflow that, unlike surface runoff, does not occur from water overflowing the levees but rather through intentional cuts in the contour levees to facilitate drainage.

2.2. Water Balance

2.2.1. Water Input

Irrigation (I): Irrigation was measured at the entrance of each plot using digital ultrasonic water meters, similar to those used by [34], specifically the DIEHL HYDRUS model (Diehl Metering, Ansbach, Germany). Irrigation was applied based on observed water levels within each plot, preventing levels from falling below 35–40 mm and replenishing them up to approximately 80–85 mm. In the absence of rainfall, irrigation intervals averaged twice per week.
Precipitation (R): The volume of precipitation was calculated considering the effective precipitation, estimated as 90% of the precipitation for Kc values greater than 1, based on studies by [39].

2.2.2. Water Output

Seepage (S) represents water that laterally infiltrates the soil, moving out of the crop field through the levees. A reference value of 0.3 mm day-1 was considered following the procedure in [40].
Percolation (Pe) refers to water that vertically infiltrates through the soil profile, beyond the crop’s root zone, entering deeper into the soil layers or groundwater. A percolation value of 1 mm day-1 was used based on previous work at this site [41,42].
It should be acknowledged that using fixed values for percolation and seepage may affect the predictive accuracy of the model due to the spatial variability of the soil and temporal variability of hydrological processes under different conditions within a single field.
To assess the impact of this simplification in our study, a sensitivity analysis was performed following the methodology of [43], with the results presented in Table S1. The analysis showed low sensitivity for both parameters within a ±50% variation range, indicating that their influence on runoff estimation was limited under the conditions evaluated.
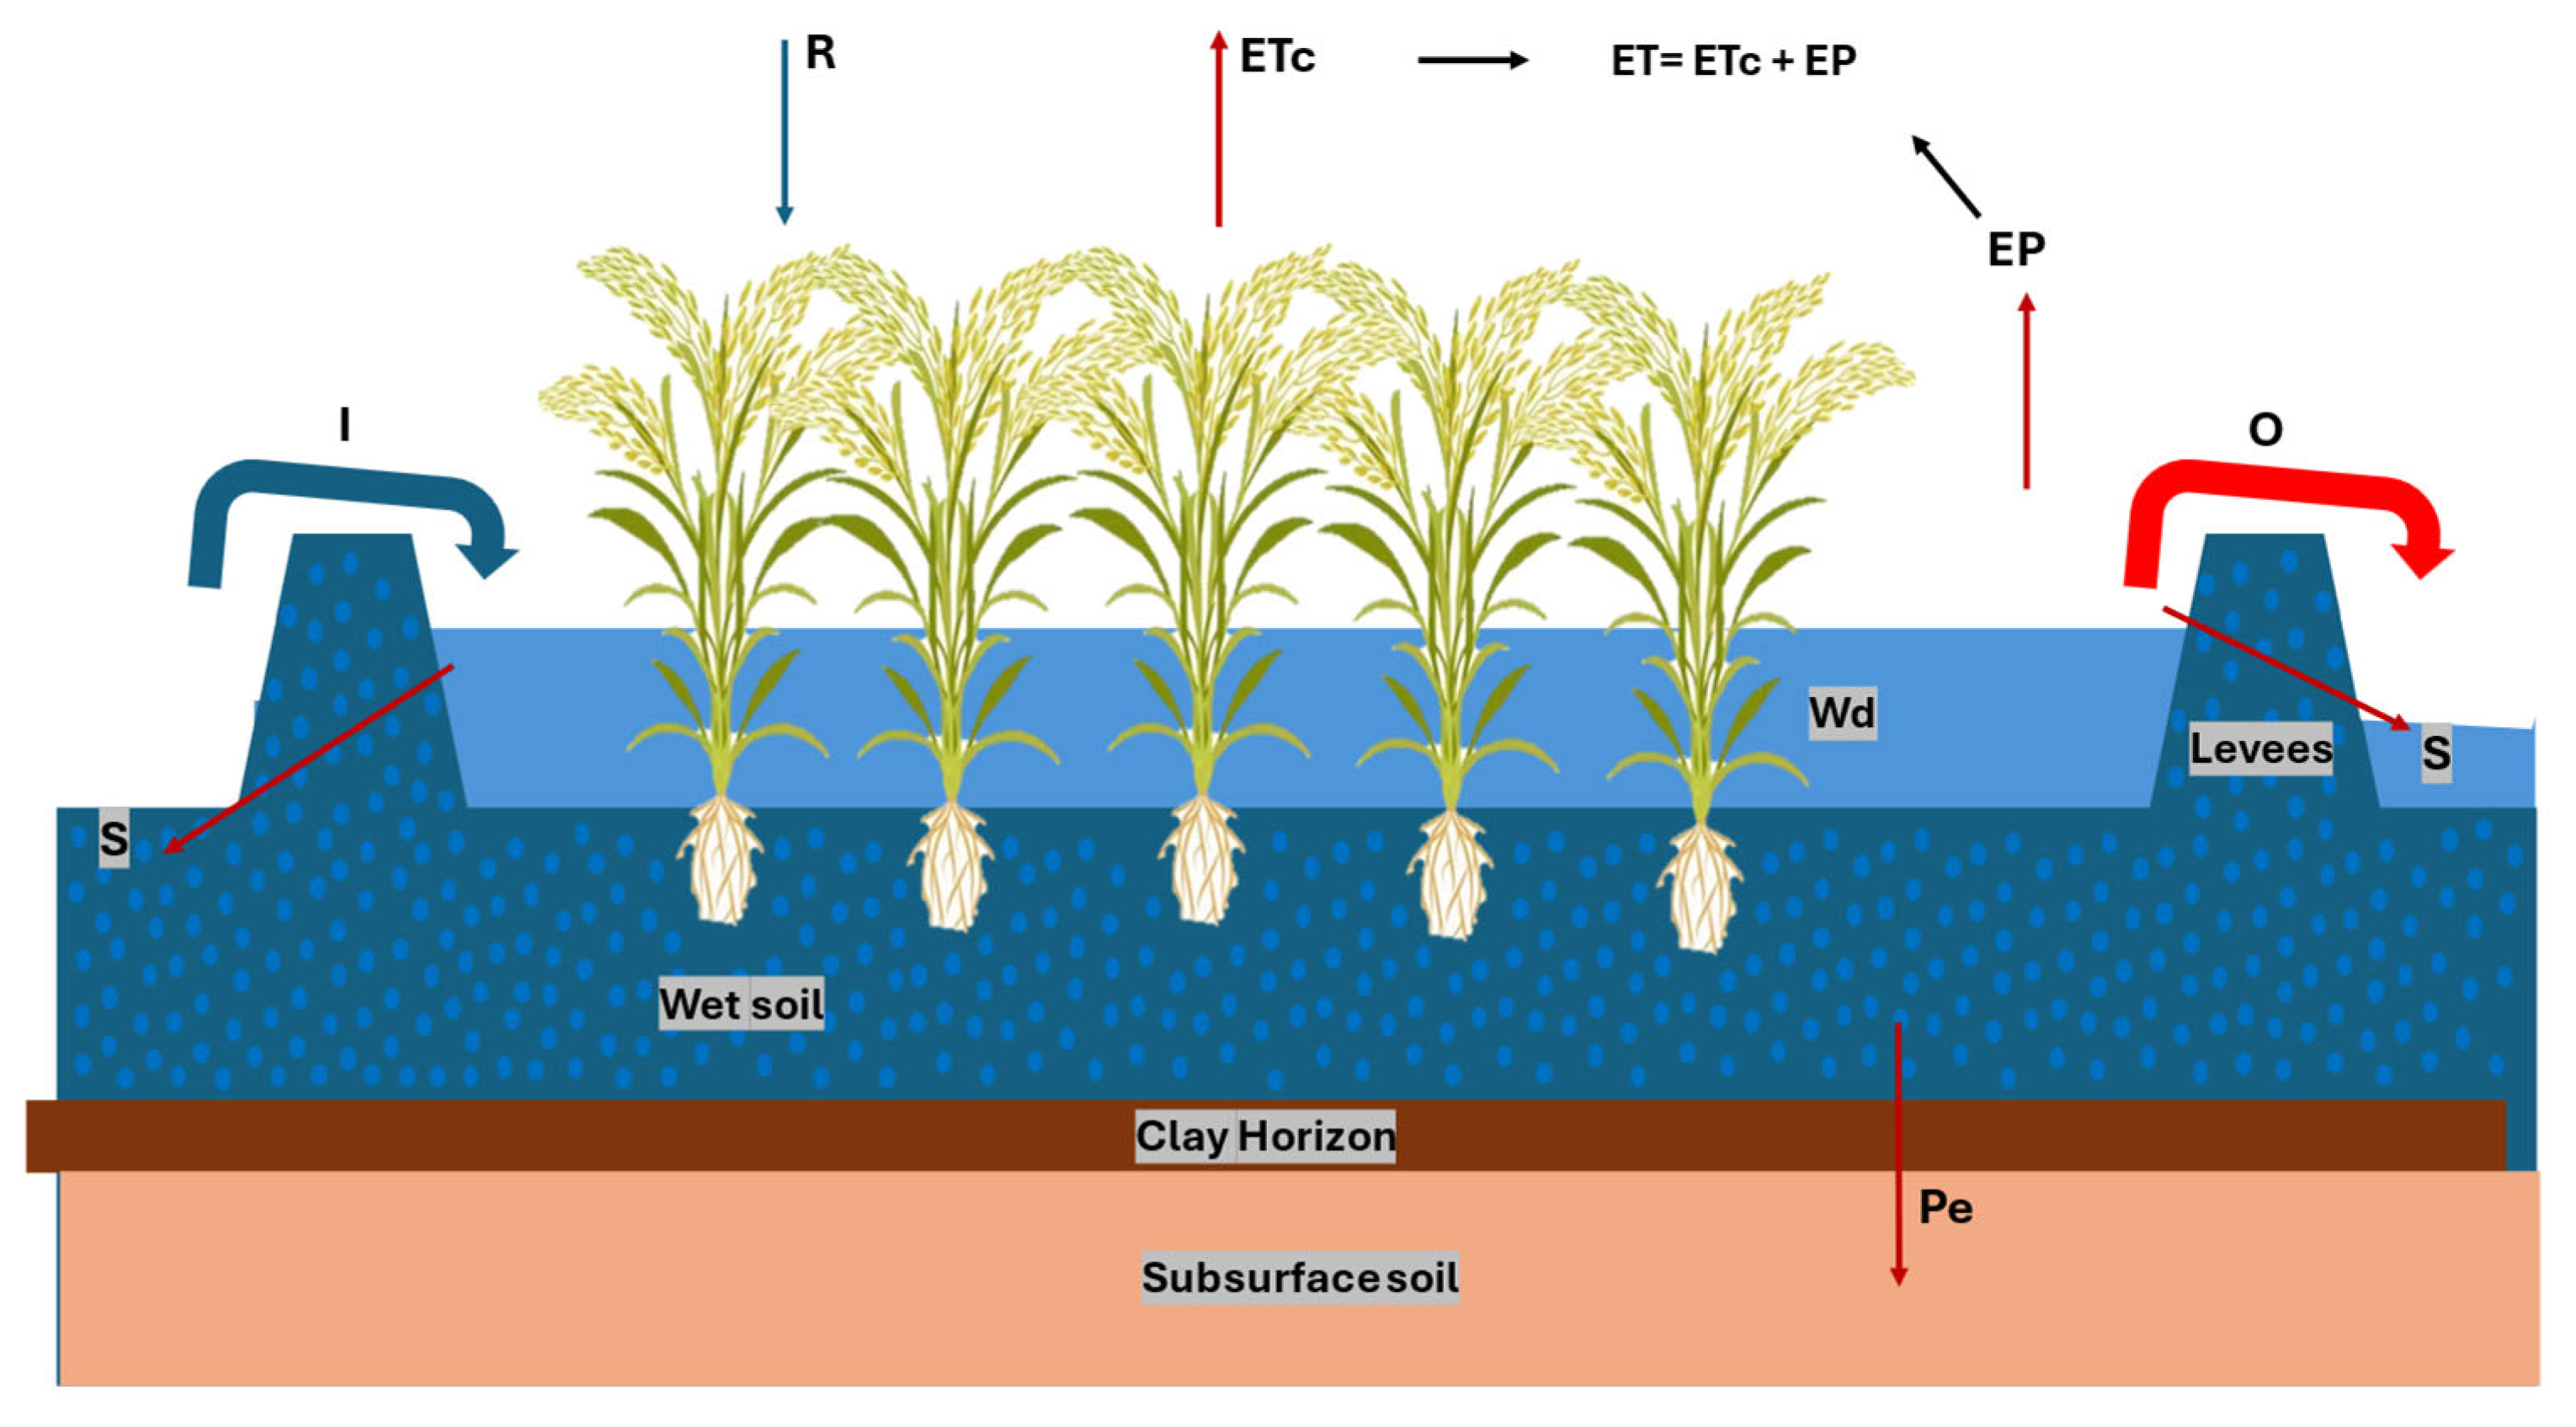
Evapotranspiration (ETc): Crop evapotranspiration (ETc), as defined in Equation (1), was estimated using reference evapotranspiration (ETo), calculated with the Penman–Monteith model, and multiplied by the crop coefficient (Kc). Reference Kc values were taken from FAO56 [44], and a daily Kc curve was constructed based on the duration of each phenological stage of the crop, variety “INIA Merín”. An additional component of direct evaporation was added to the ETc estimate to account for inundated, uncropped areas in each plot (9–10%), located mainly along the perimeter of the plots (EP). EP was estimated using the daily evaporation values recorded in “Tank A” and was integrated into the total evapotranspiration calculation in Equation (1). The addition of ETc and EP was considered the total plot evaporation (ET), as shown by Equation (2) and Figure 2.
ETc = ETo × Kc
where ETc is the estimated crop evapotranspiration, ETo is the reference evapotranspiration calculated using the Penman–Monteith method, and Kc is the crop coefficient.
ET = ETc + EP
where ET is the total plot evapotranspiration, and EP is the evaporation from the inundated, uncropped perimeter.
Soil moisture variation (ΔS) represents the change in soil water content during the considered water balance period. It was quantified using the gravimetric method by taking a soil sample from the top 150 mm before the first irrigation and at the end of the water balance period (initial moisture minus final moisture).
Surface runoff (O) refers to water that is not retained in the system due to excessive irrigation or precipitation, flowing out of the plot over the contour levees when the water layer exceeds 100 mm. Surface runoff was estimated based on the daily water depth inferred from the water balance model.
A detailed mapping of the microtopography within each plot was conducted to accurately determine the water volume that could be stored at different water layer depths. This survey was carried out using a GPS device with real-time kinematic (RTK) correction, as shown in Figure S1. Based on this information, it was possible to estimate the storage volume of each plot across the range of 0 to 100 mm of water depth.
The water layer depth was recorded in two ways: (A) Manually: The depth was recorded at least twice a week and before each irrigation event. In each plot, water depth was measured using a custom-built device composed of a vertical PVC tube mounted on a floating buoy. At the top end of the tube, an inverted ruler was fixed. This inner tube floated freely inside a second, wider PVC pipe, which remained stationary and was secured to a firmly anchored wooden post using metal brackets. As the water level in the plot changed, the floating tube rose or fell accordingly. Water depth was read by observing the point on the inverted ruler that aligned with the top edge of the stationary outer tube, which served as a fixed reference point. (B) Remotely: The depth was recorded every 20 min using ultrasonic sensors capable of measuring the distance between themselves and an object, with temperature compensation. The data was transmitted wirelessly to Gateway, which collected the information and forwarded it to a web platform [45].
The complete water balance for each plot is represented in Figure 2 and Equation (3) [46], where the sum of water inputs equaled the sum of outputs. During the first two years, the various components of the daily water balance model were adjusted in periods of absence of runoff by comparing water depth estimates, as shown in Equation (4), with direct measurements using a ruler and remotely sensed data. To estimate surface runoff from irrigation or precipitation, as shown in Equation (5), it was assumed that water would be retained within the plot, even though, in practice, water overflow occurred once the water level exceeded 100 mm. This approach allowed the estimation of the excess water volume attributable to irrigation or precipitation. In the third year, surface runoff was directly measured in each plot, allowing the validation of the adjusted model using flow measurement structures and flowmeters.
I + R = O + S +Pe + ET + ΔS
where R is the precipitation, I is the irrigation, O is the surface runoff (the variable of interest), S is the seepage, Pe is the percolation, ET is the total plot evapotranspiration, and ΔS is the variation in soil moisture.
Wd(t) = Wd(t − 1) + (I(t) + R(t)) − (S(t) + Pe(t) + ET(t)); if O(t) = 0
O t = W d t 100   m m , i f     W d ( t ) > 100   m m 0 , i f     W d t 100   m m
where Wd is the water depth, and (t) is the time in days.

2.3. Measurement of Surface Water Outflow

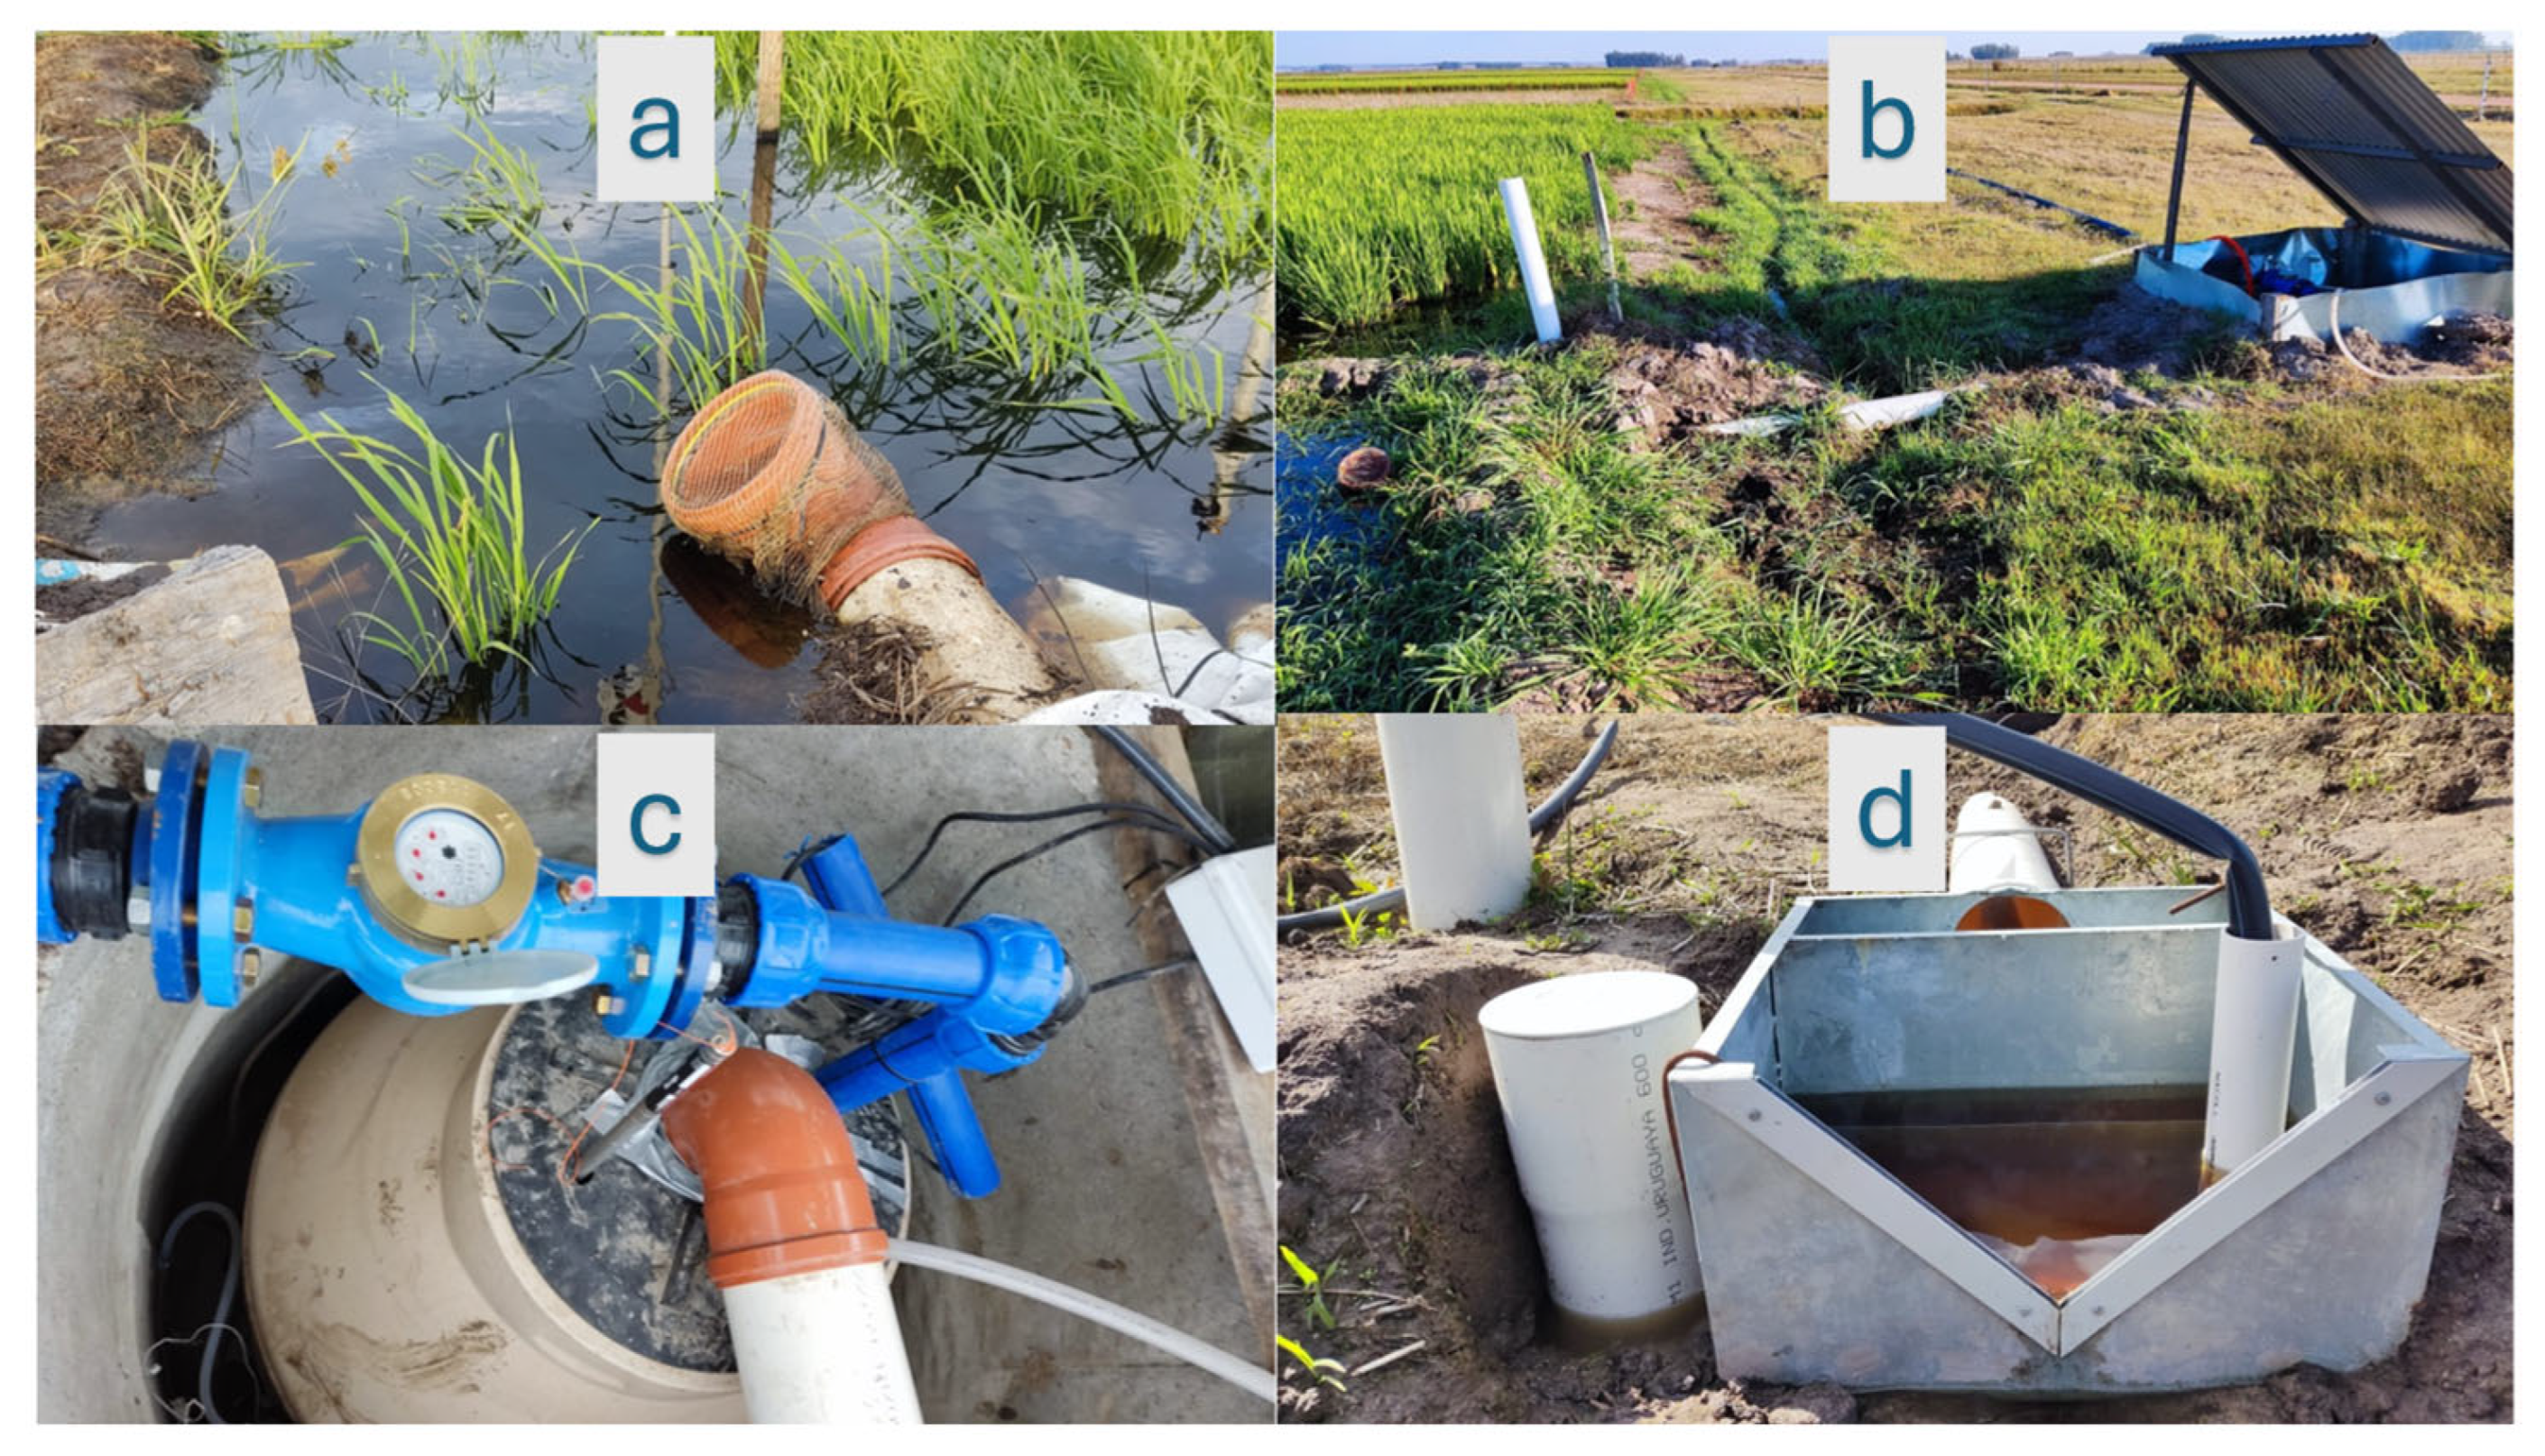
To measure surface water outflow, a continuous monitoring program was implemented from the start to the end of rice irrigation (November to March) during the 2023 growing season. At the lowest point of the perimeter of each plot, a 200 mm diameter PVC elbow was installed as a discharge structure, with its upper edge positioned 100 mm above ground level (the maximum water depth in the plot). This setup ensured that, during rainfall or excessive irrigation events, water would not overflow the contour levees but would exit through this system, as shown in Figure 3a.
In three of the four plots, surface runoff was directed into a sealed box measuring 0.8 × 0.5 × 0.3 m (length, width, and height, respectively), equipped with a 90° triangular weir transverse spillway for frontal discharge and fitted with an (INTECH Instrments Ltd.a., Auckland, New Zealand) water level and temperature data logger (0~0.5 m), similar to those used by [34], as shown in Figure 3d. The data logger recorded the water level inside the weir every two minutes, and using Equation (6), the generated flow rate was estimated based on the contributing area. The weirs and the data loggers were initially calibrated in the laboratory of the Institute of Fluid Mechanics and Environmental Engineering of the Faculty of Engineering of Uruguay and later recalibrated in the field, which allowed for the adjustment and validation of Equation (6).
In the fourth plot, due to insufficient slope for installing spillways, surface runoff was measured using a buried storage tank with a 500 L capacity, emptied via an automated pumping system, recording the water volume flowing out of the tank using a propeller-type flow meter, as shown in Figure 3b,c, and the water level inside the tank was monitored with a water level data logger (0~1.0 m) for a double-check of the emptying system’s functionality.
Although the primary objective of this study was not to compare different runoff measurement techniques—and the original project design involved only the installation of weirs—the installation of the more “precise” system in Plot 4, Figure 3b,c, allowed us to use this plot as a reference. Based on these comparisons, we concluded that the weir-based systems performed very well.
Q = 1000 × 1.692 (H × 0.0737)(5/2)
where Q is the flow rate (L s−1), and H is the water height over the weir (m).

2.4. Calibration and Validation

For model calibration during 2021 and 2022, the observed water depth was compared with the simulated values from the daily water balance model, given by Equation (4). During these years, the estimation of surface water outflow, given by Equation (5), was based on water depth as an indicator of surface runoff.
In 2023, specific equipment was installed for the direct measurement of surface runoff, as shown in Figure 3, to validate the previously adjusted model. These instruments provided more precise data on the volume of water flowing out of the plots due to surface runoff, which was crucial for assessing the accuracy and validation of the water balance model developed in previous years. The validation process involved comparing the surface runoff estimates obtained through the water balance model with the direct measurements recorded in that year.

2.5. Statistical Analysis

To evaluate the relationship between the water layer height predicted by the water balance model and the observed water layer height (measured with a ruler), a scatter plot was created. Simple linear regression models were fitted for each treatment and year combination, and the coefficient of determination (R2) was calculated as a measure of model fit. A fitted regression line was included, along with an identity line (y = x), to visually compare the model predictions with the observed values.
A comparative analysis was conducted between the surface runoff estimated by the water balance model and the measured runoff. A scatter plot was constructed to visualize the relationship between measured and estimated runoffs. A simple linear regression model was fitted, and R2 was calculated as an indicator of model fit.
To evaluate the effects of the Ri-Ri and Ri-Pa treatments on the runoff estimated using the water balance model, a scatter plot was generated for each runoff event under both treatments throughout all study years, including an identity line. Simple linear regression models were fitted, and the coefficient of determination (R2) was calculated. To determine whether significant differences existed, an analysis of variance (ANOVA) was performed. The assumptions of normality and homogeneity of variances were tested using the Shapiro–Wilk and Levene tests, respectively. Pairwise comparisons were performed using Tukey’s adjustment, with a significance level of p < 0.05.
The analyses were conducted using the dplyr, tidyr, and ggplot2 packages [47] in the R software (version 4.5.0; R Core Team, Vienna, Austria) [48].

3. Results

3.1. Observed vs. Estimated Water Layer Depth

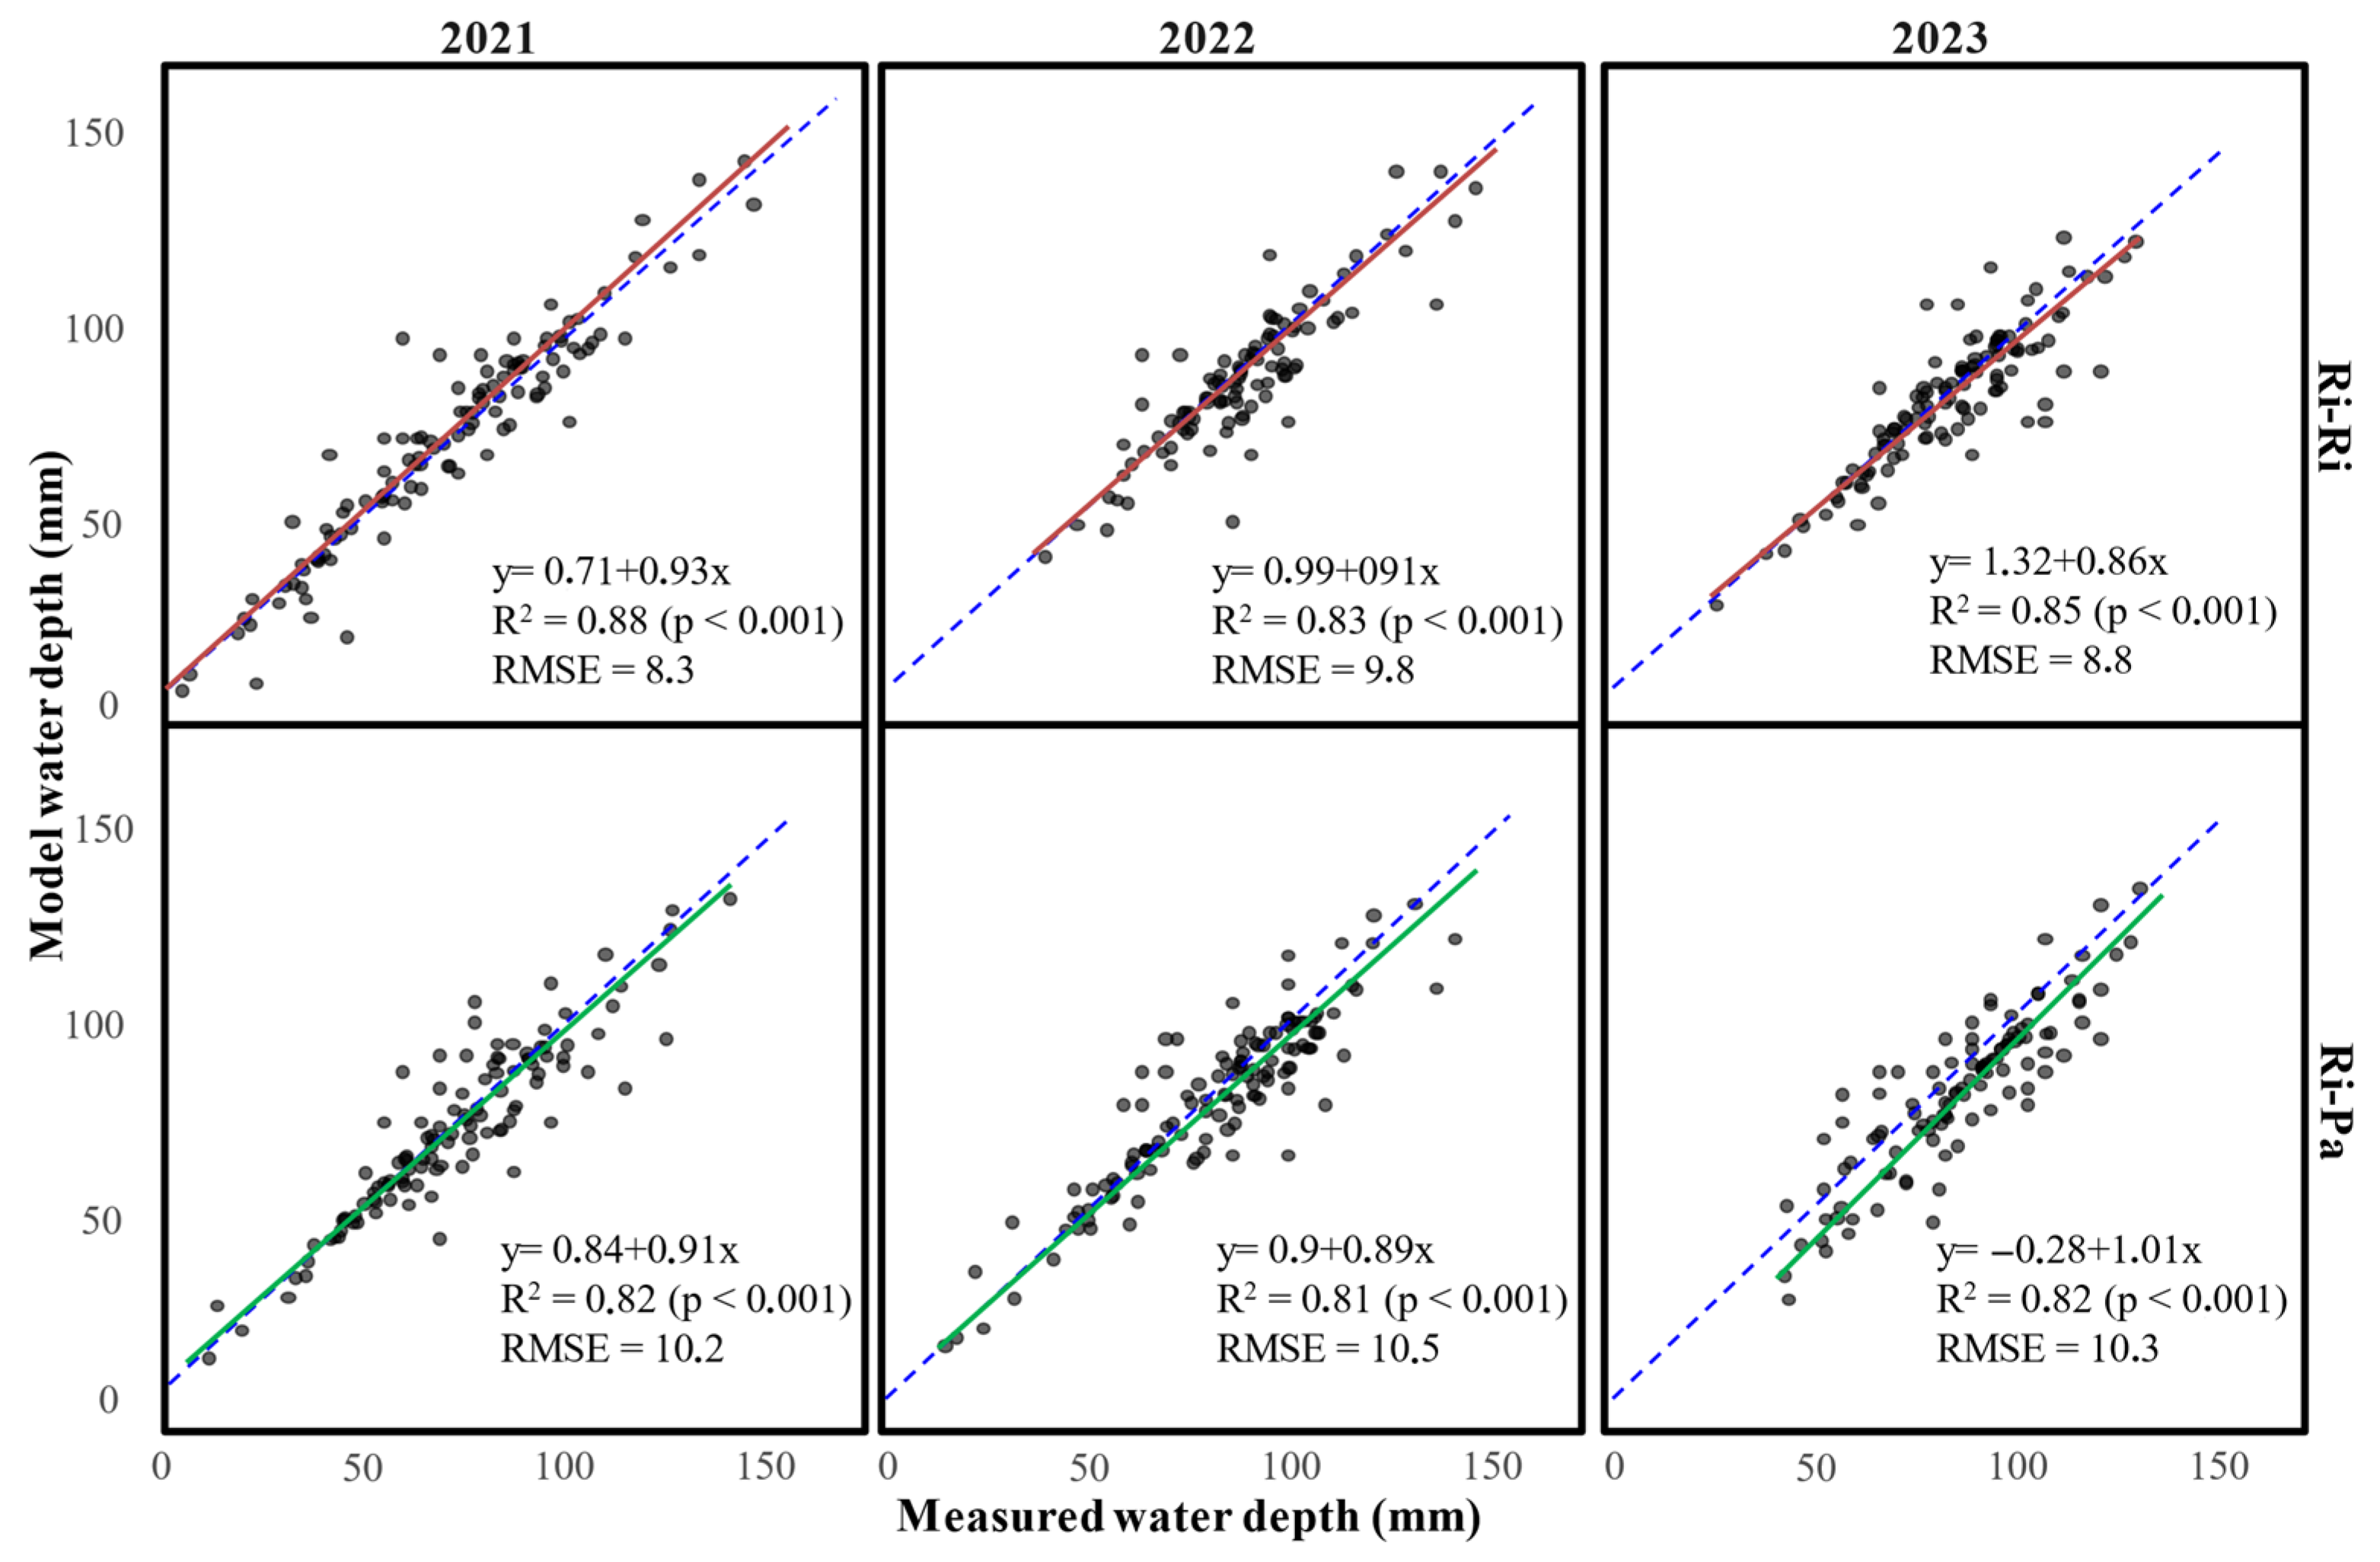
Water depth is a key variable for evaluating the overall performance of the water balance model, as its behavior results from the calculation of all daily input and output components of the system, given by Equation (4). To assess the predictive capacity of the calibrated model, simple linear regression models were fitted between the simulated water depth and the field measurements, both manual (using a ruler) and via ultrasonic sensors, as shown in Figure 4. In all years and treatments, the model showed high coefficients of determination (R2 > 0.8) and statistically significant relationships (p-value < 0.05). The model demonstrated excellent predictive performance, with a Nash–Sutcliffe efficiency (NSE) coefficient greater than 0.78.

3.2. Estimation of Runoff Using the Water Balance Model

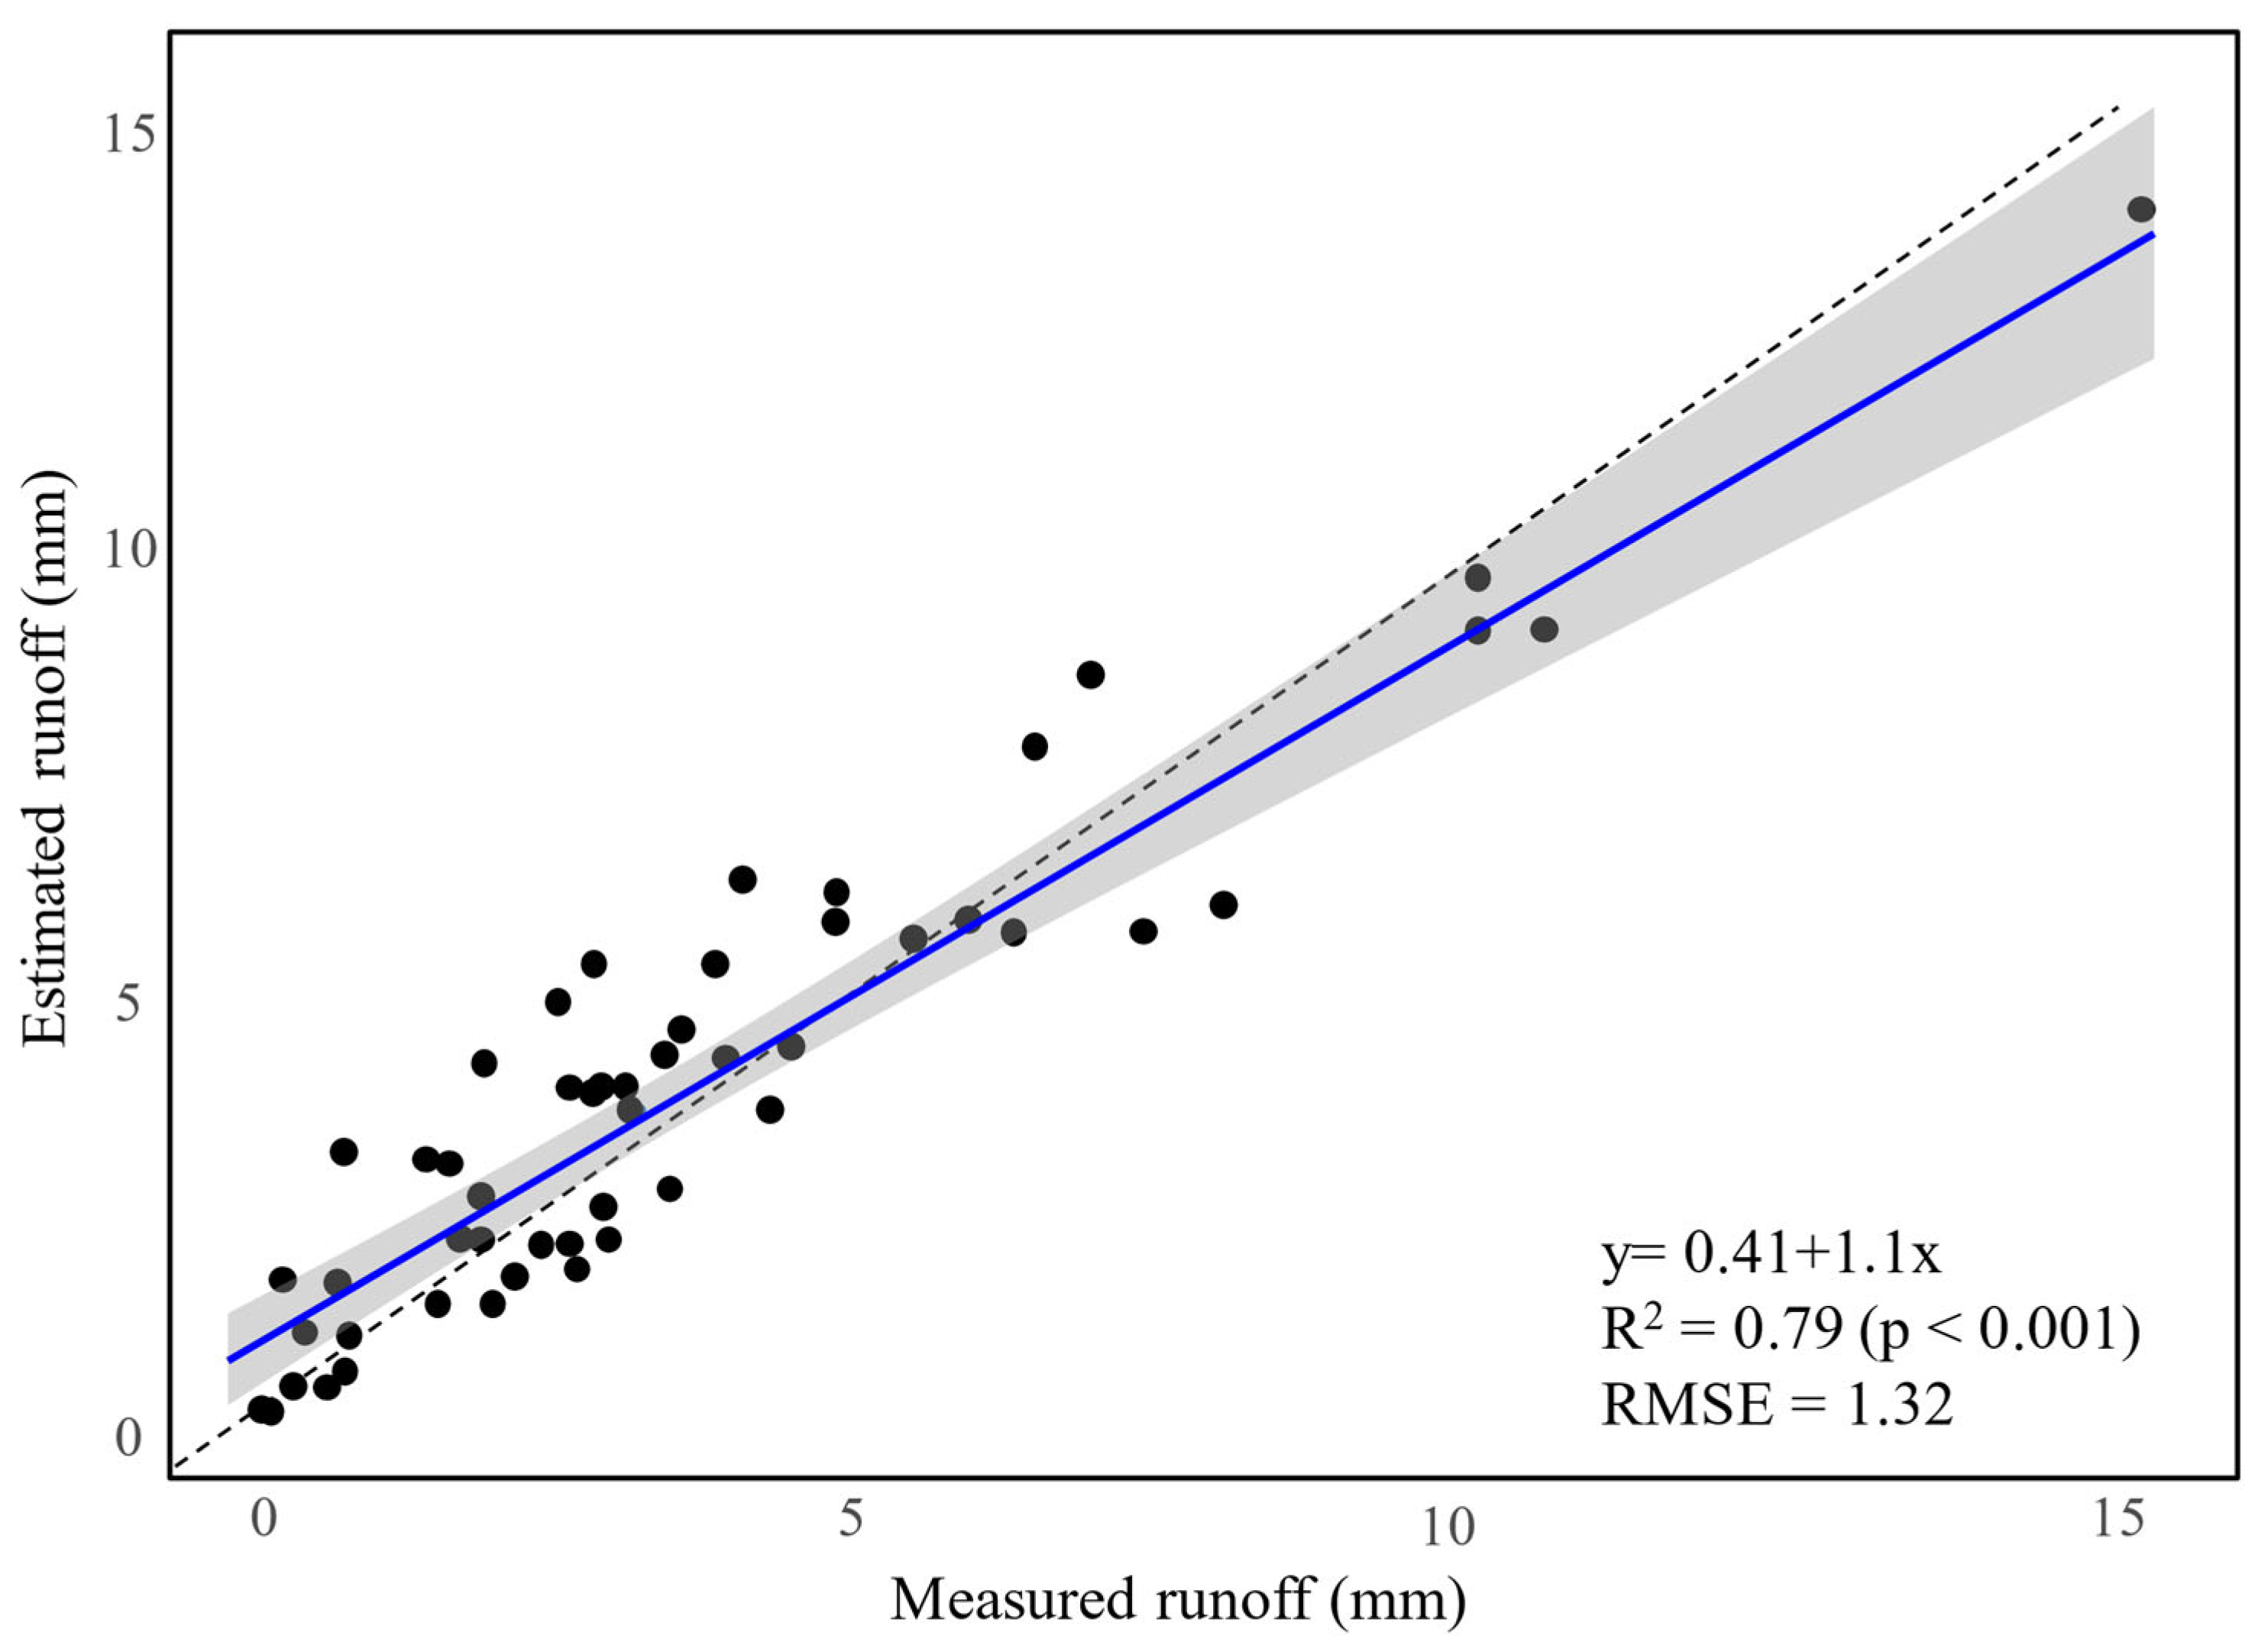
Since the performance of the calibrated water balance model, shown by Equation (7), was satisfactory in replicating water layer behavior, it was used to estimate surface runoff in 2023, when this variable was measured. To evaluate its predictive ability, a simple linear regression was fitted between the model-estimated and field-measured runoff values. The model demonstrated good explanatory power, with a coefficient of determination (R2) of 0.79, as shown in Figure 5, indicating adequate performance in estimating surface runoff. The fitness was statistically significant (p < 0.001).
O ( t ) = W d t 1 + I t + R t 0.3 t + 1 t + E T t , i f     W d ( t ) > 100   m m 0 , i f     W d t 100   m m
where O is the surface runoff, Wd is the water depth, I is the irrigation, R is the precipitation, 0.3 is the seepage, 1 is the percolation, and ET is the total plot evapotranspiration. All variables were expressed in millimeters (mm). (t) is time in days.

3.3. Analysis of Water Balance Components

To further explore the surface runoff results, an analysis was conducted on the relative importance of each component of the water balance in terms of inputs and outputs.
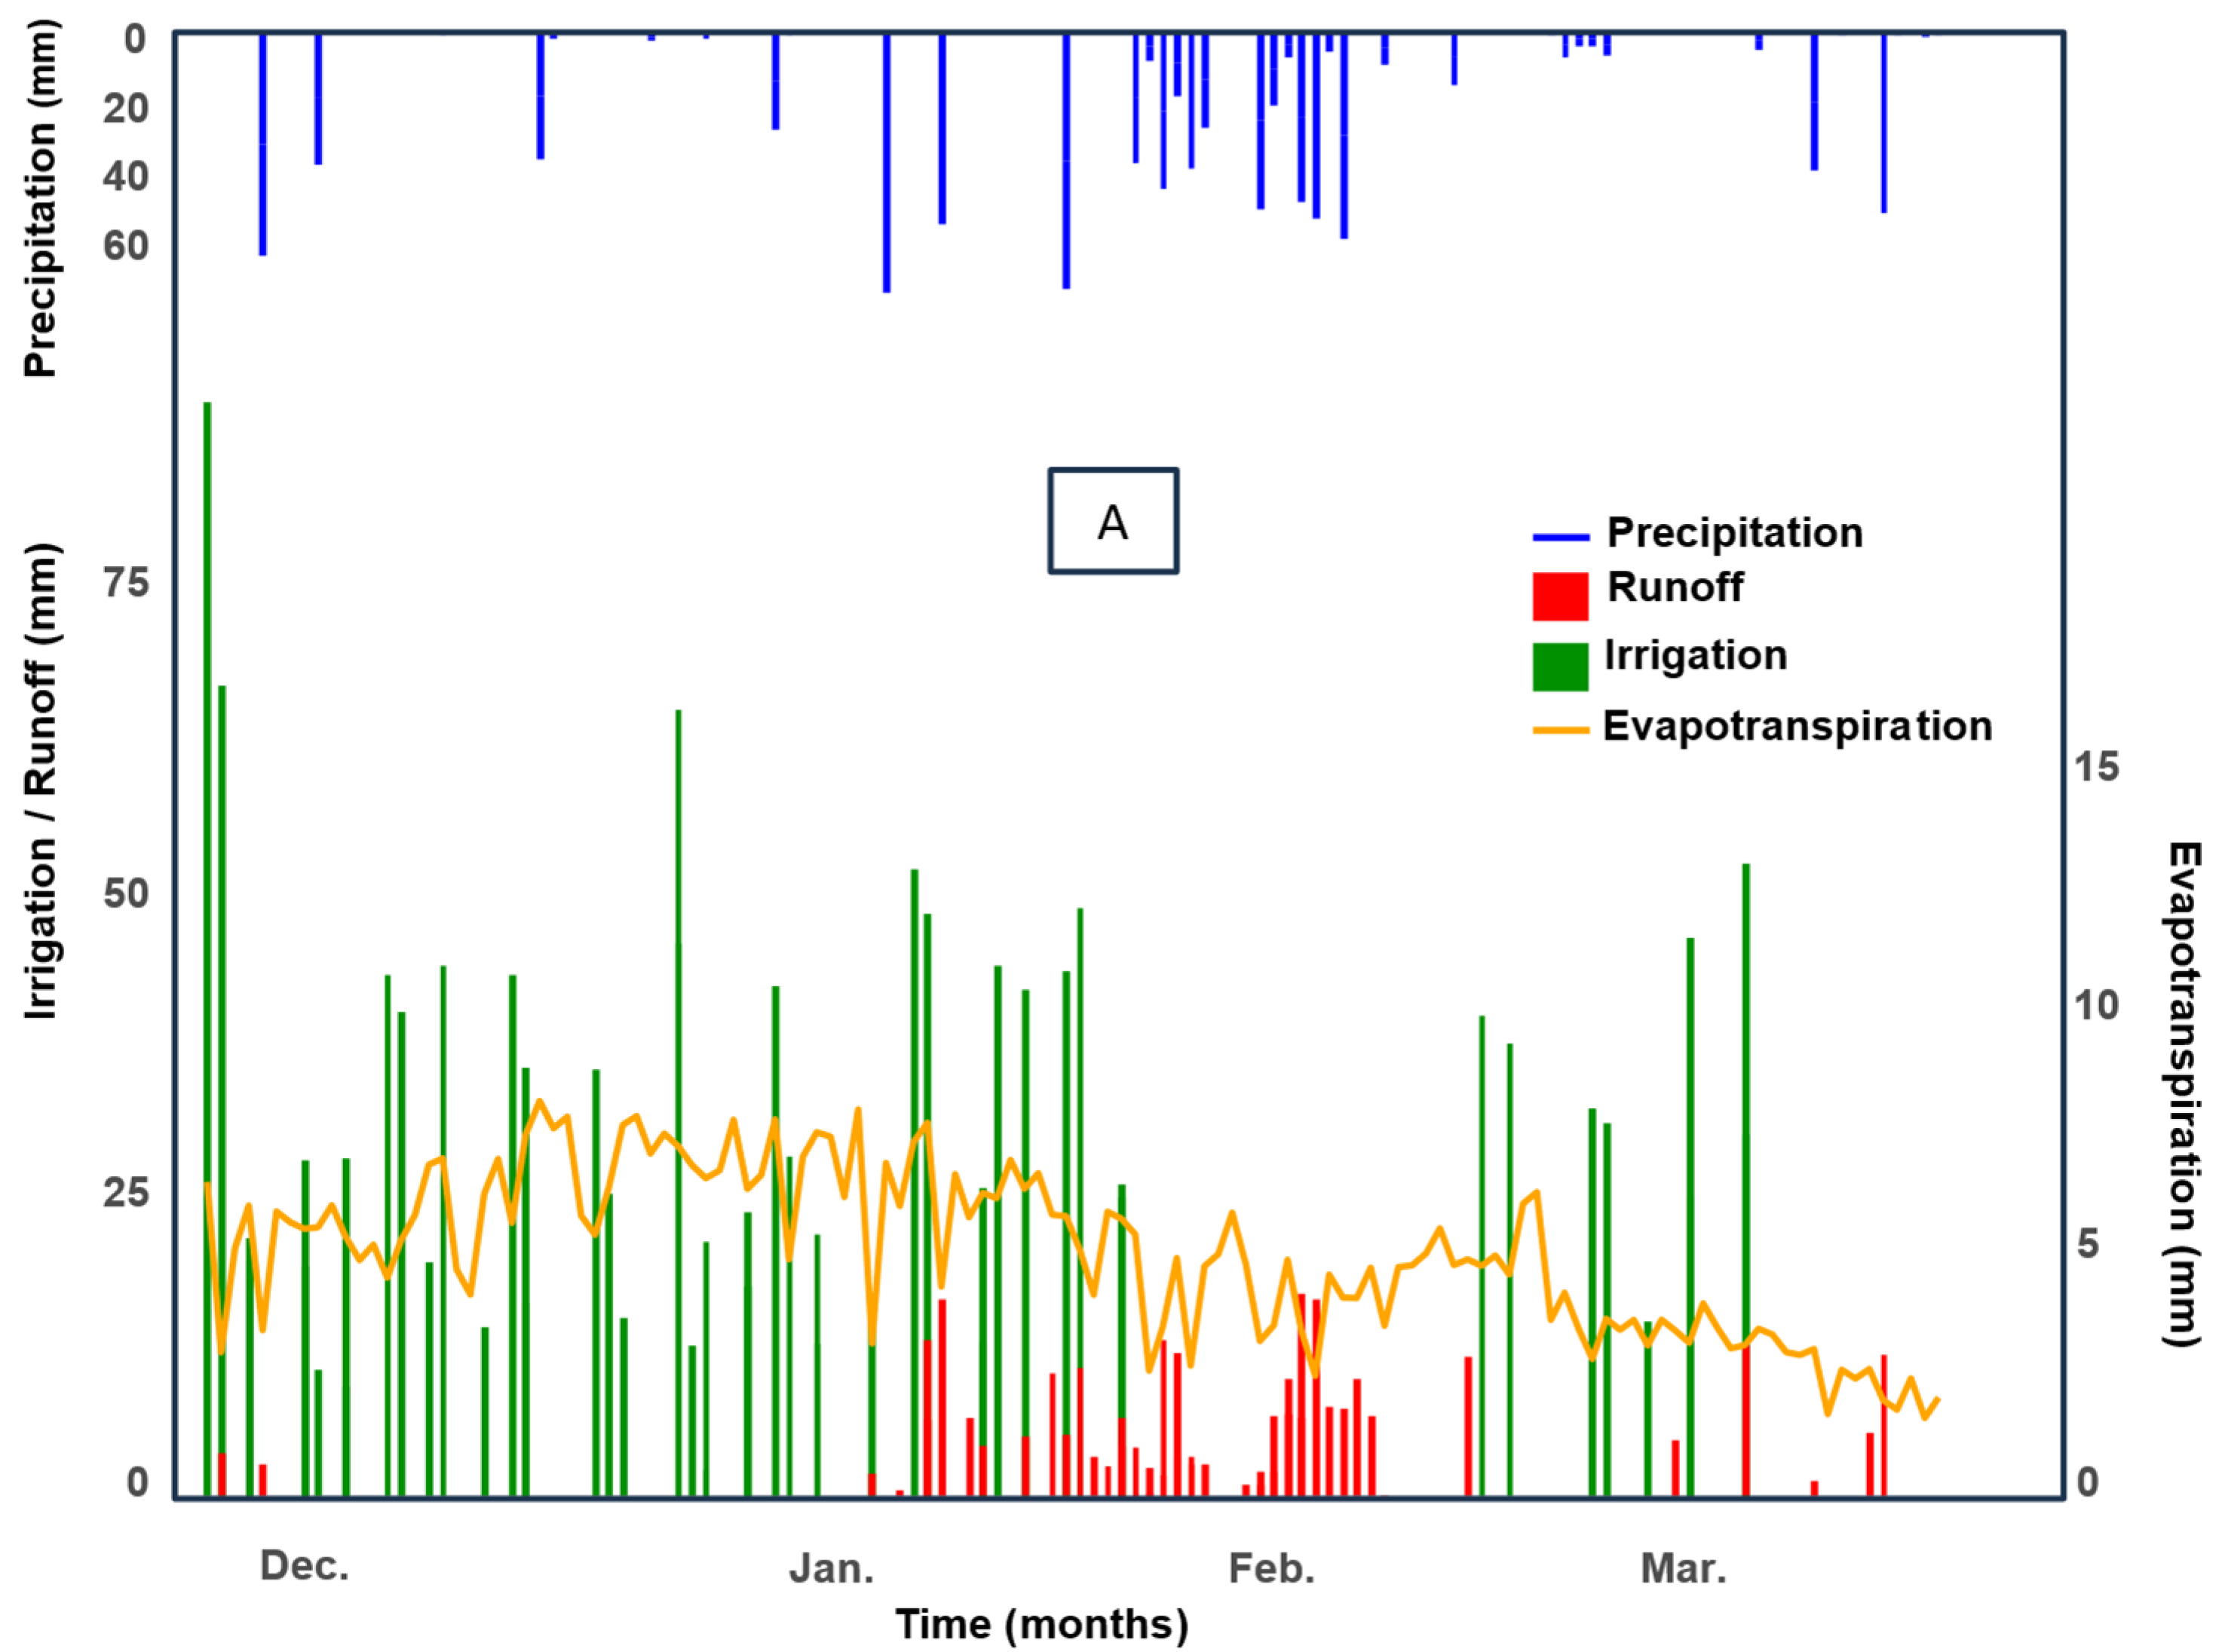
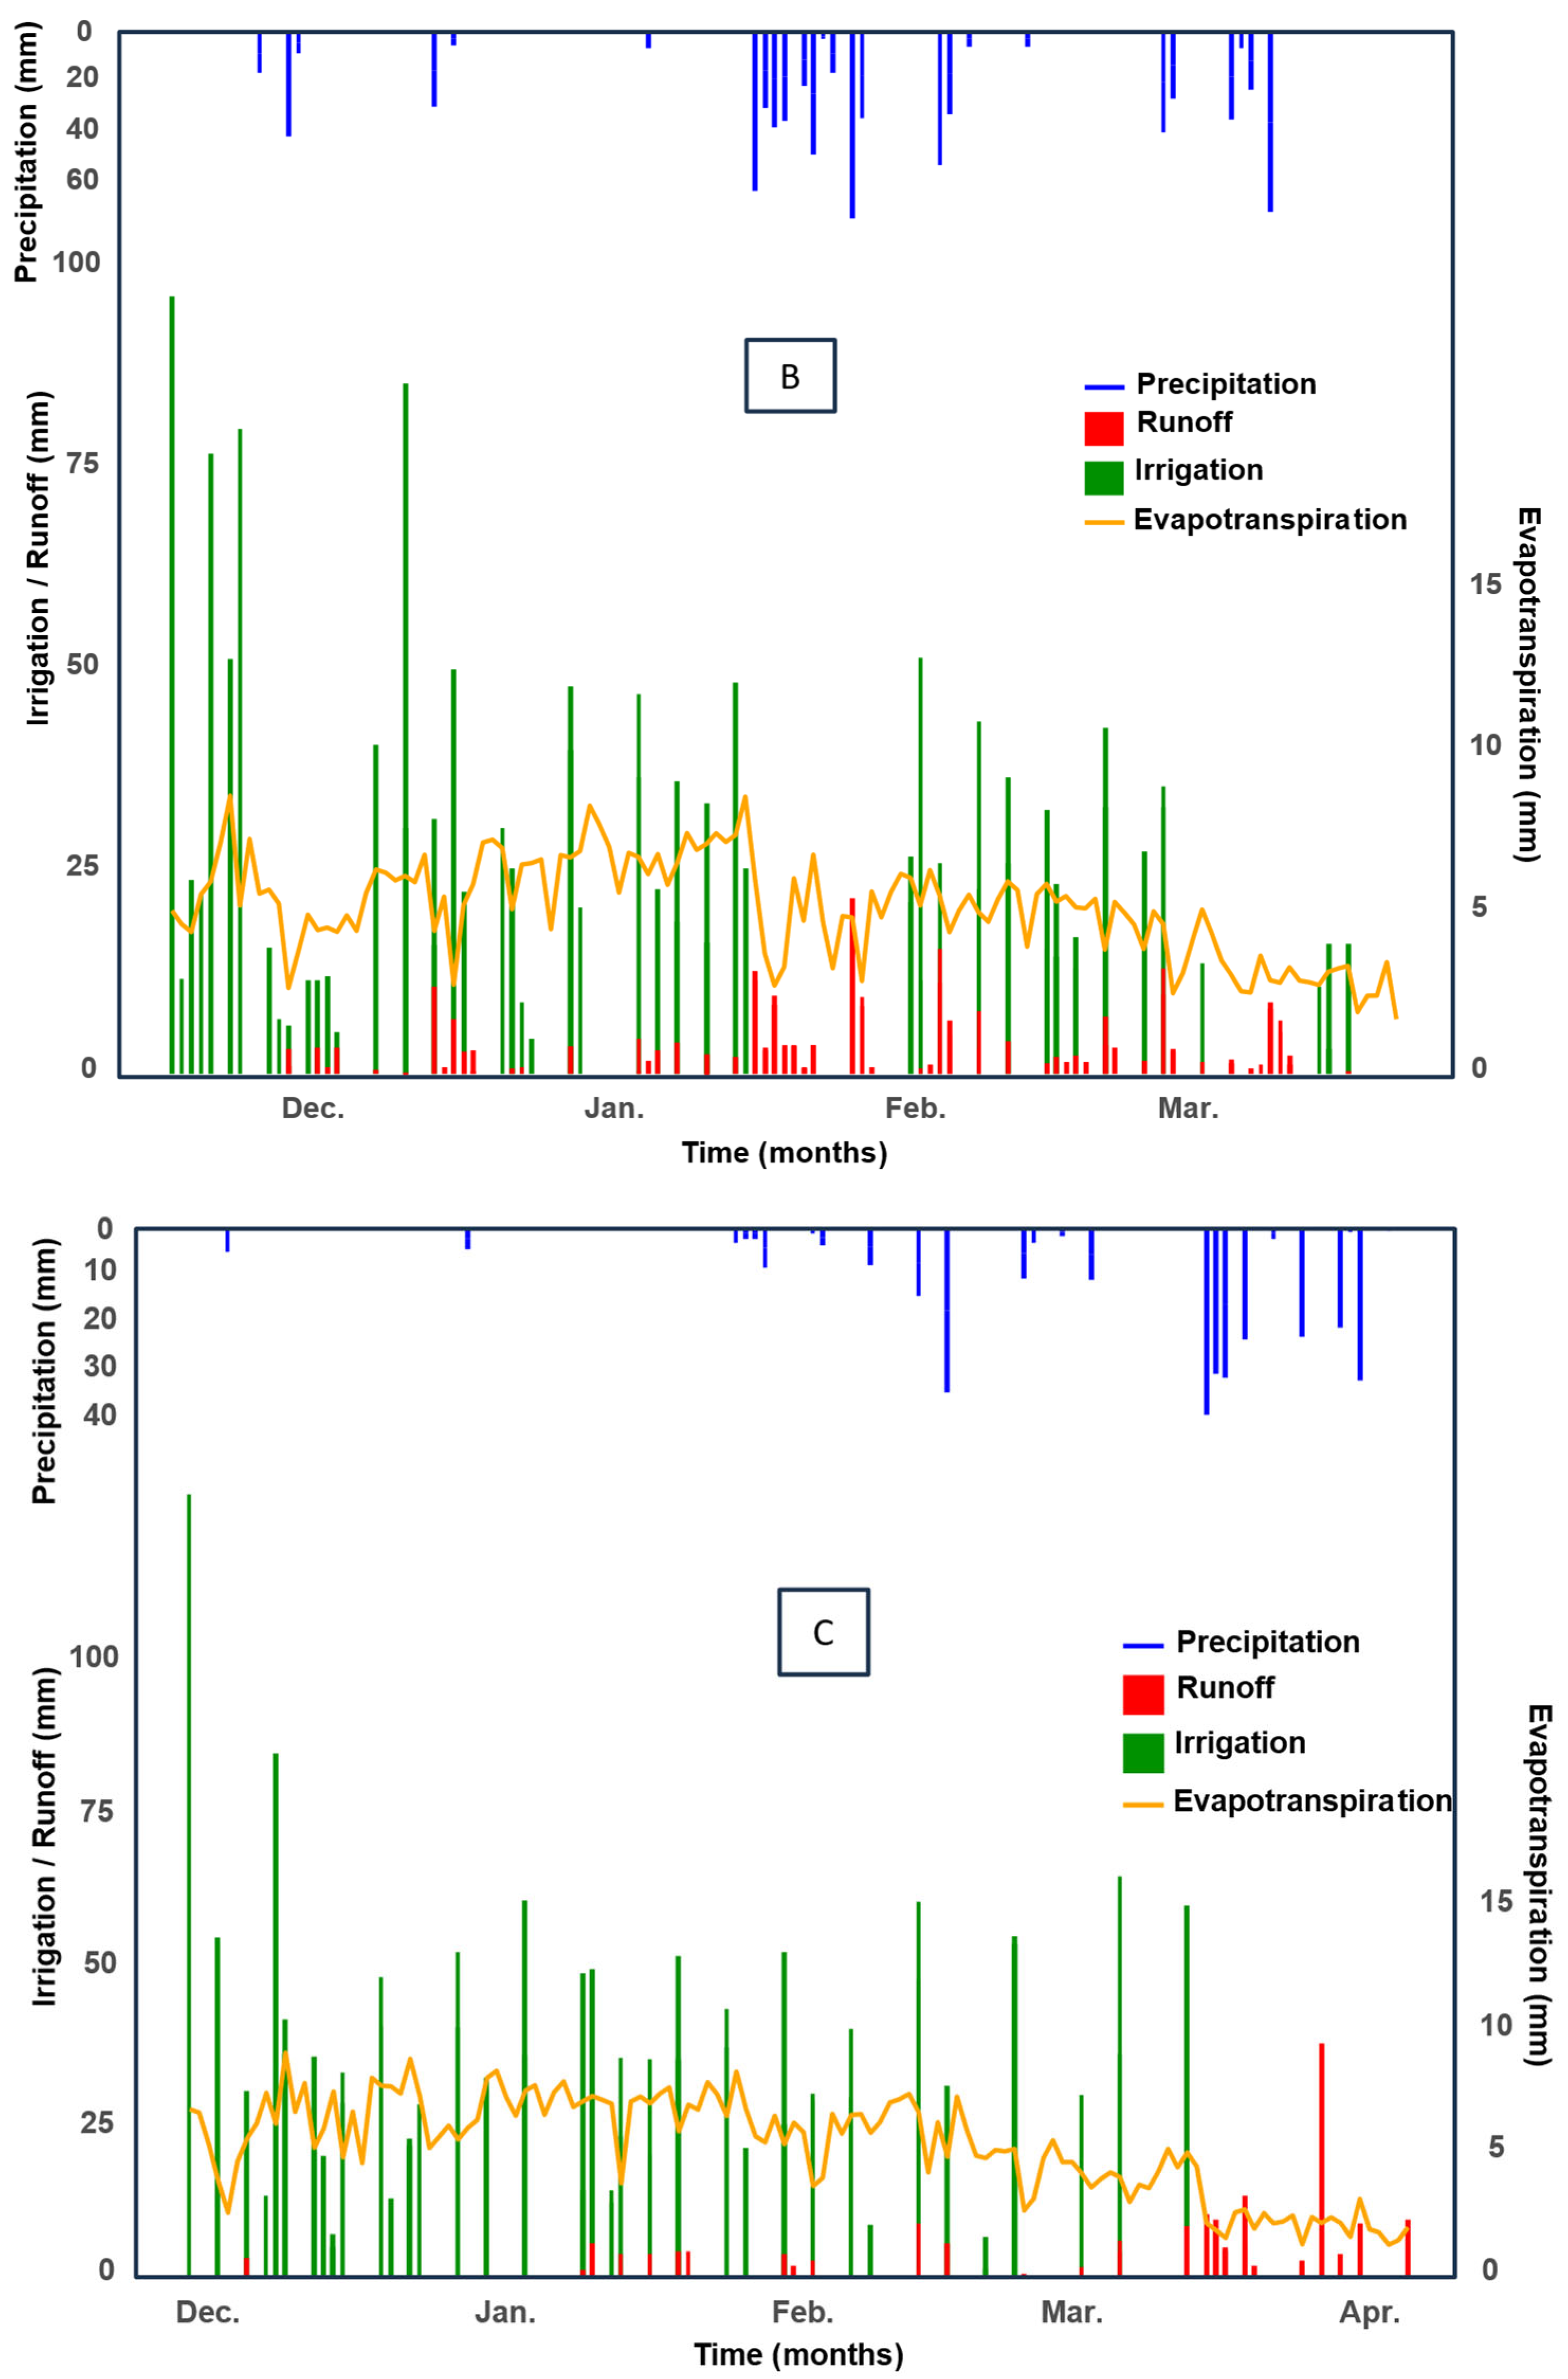
The average total water input, resulting from the combination of irrigation and precipitation, was 1327 ± 72 mm over the three years evaluated, as shown in Table 3. Both the distribution and magnitude of rainfall varied significantly across years, influencing surface runoff and irrigation demand. In this regard, precipitation ranged from 556 mm in 2021 to 190 mm in 2023, with a standard deviation of 187 mm between years, as shown in Table 3. In 2021, rainfall was 20% higher than the historical average of 554 mm, estimated from over 50 years of meteorological station data [49], and was more evenly distributed throughout the crop cycle. This pattern allowed for a balanced water supply, with precipitation contributing 43% and irrigation 57% of the total water input, as shown in Table 3 and Figure 6. In contrast, in 2023, there was a 50% reduction in precipitation, compared to the historical average, with rainfall accounting for only 15% of total water input and occurring mainly toward the end of the crop cycle, as shown in Figure 6.
Throughout the three years, evapotranspiration (ET) remained close to 650 mm, representing approximately 47% of total water input, with an average of 5.3 mm/day from the beginning to the end of the irrigation period—values similar to those reported by [29] for eastern Uruguay.
Surface runoff, excluding final drainage, represented approximately 11% of total water input in 2021 and 2022, while in 2023, it was 5% (67 mm), as shown in Table 3, consistent with the 43% reduction in rainfall compared to 2022 and 34% compared to 2021.
When the volume of final drainage—carried out to allow for dry harvesting—was included, the percentage of surface runoff relative to total water input increased considerably to 7% in 2023, 15% in 2022, and 18% in 2021, highlighting the relative importance of this event. This drainage, which occurred at a single point in the crop cycle, could account for a significant share of the total runoff volume, ranging from 29% to 42% of the total surface water loss.

3.4. Water Output by Runoff in the Different Rotations

In order to analyze the effect of rotations (Ri-Pa, Ri-Ri) in surface runoff, simple linear regression models were fitted, and the coefficient of determination (R2) was calculated. A strong and significant correlation was observed between the surface runoff estimated by the water balance for the Ri-Pa and Ri-Ri treatments across the three cropping cycles studied, as shown in Figure S2. This result suggests that both rotations exhibited similar runoff magnitudes during the various events analyzed, indicating consistent hydrological behavior, regardless of the treatment applied.

4. Discussion

4.1. Estimation of Runoff Using the Water Balance Model

The objectives of this study were to calibrate and validate a daily water balance model to estimate surface runoff. Local parameters for percolation and lateral losses were adjusted, the crop evapotranspiration equation (Equation (1)) and perimeter evaporation (EP) were integrated (Equation (2)), and periodic measurements of water depth—both manually and remotely—were taken, along with irrigation and precipitation data. Using this information, the daily water balance model, shown in Equation (7), was run and validated with direct surface runoff measurements. The calibrated model proved to be an effective tool for estimating surface runoff, as evidenced by the high coefficients of determination obtained both in the comparison between simulated and observed water depths, shown in Figure 4, and between estimated and field-measured surface runoff, shown in Figure 5.
Compared to previous studies [35,40,50], the main strength of this work lies in its empirical validation based on direct surface runoff measurements, which adds methodological robustness to the results. Furthermore, it stands out for its applicability in operational contexts, where simplified yet reliable modeling approaches are needed for irrigation management and water loss assessment.
The calibrated water balance model is particularly valuable in contexts where infrastructure for direct water loss measurements is lacking. It would allow for anticipating runoff events caused by irrigation excess or rainfall, enabling more precise decisions regarding irrigation timing and applied volumes. Reducing surface runoff is one of the most impactful factors in decreasing nutrient loads to water bodies, as reported by [51,52].

4.2. Rainfall Runoff

Rainfall exhibited marked interannual variability, consistent with the findings of [38]. However, the total water input (irrigation plus precipitation) showed moderate interannual variation, less than 6% relative to the three-year average of 1327 mm, which is similar to the consumption reported by [29] for eastern Uruguay. The low variability in total water input was attributed to the compensatory role of irrigation in response to rainfall fluctuations. Irrigation volumes varied each year, from 752 mm in 2021 to 967 mm in 2022 and 1076 mm in 2023, with an average of 932 mm, as shown in Table 3.
Surface runoff showed a strong dependence, not only on the amount but also on the temporal distribution of rainfall, consistent with the findings of [35,53]. For example, although rainfall was lower in 2022 than in 2021, its less uniform distribution throughout the crop cycle resulted in a greater runoff than in 2021. In 2023, although rainfall was very low, it was concentrated at the end of the crop cycle, causing most of the runoff for that year, as shown in Figure 6. The volume of surface runoff in relation to rainfall ranged from 24% in 2021 to 35% in both 2022 and 2023.

4.3. Surface Runoff Analysis

Total surface runoff (including runoff and final drainage) was 234 mm in 2021, 214 mm in 2022, and 96 mm in 2023. These values represented 18% of the total water input in 2021, 15% in 2022, and 7.5% in 2023. Table 4 differentiates the contributions of various runoff sources to total surface runoff. The average data from the three years showed that 35.3% of the surface runoff was caused by rainfall, 34% by final drainage, and 30.7% by irrigation. Rainfall and final drainage accounted for the majority of surface runoff, consistent with the findings of [35] in a paddy field in the Taihu Lake Basin, which reported that 47.3% of runoff was caused by rainfall, 29.8% by drainage, and 22.9% by irrigation.
Disaggregating the sources of runoff, Table 4 reveals results with important implications for water management. First, the high contribution of final drainage to total runoff stood out. Final drainage occurred as a single event when contour dikes were opened in situations where the soil drying period (20 to 25 days after the last irrigation) was not sufficient to allow harvesting under dry soil conditions. This event can have relevant environmental implications due to the large volumes of water released in a short period of time. This highlights the importance of strictly following the recommendation of suppressing irrigation before 20–25 days before the estimated harvesting date.
Second, the significant contribution of irrigation to surface runoff was noteworthy, representing, on average, approximately one third of the total runoff over the three years evaluated, even under the controlled management conditions of this study. This result suggests a considerable opportunity for improving irrigation efficiency, especially when extrapolated to field-scale production conditions, where irrigation control is likely to be lower.
Third, although precipitation-induced runoff and irrigation-induced runoff contributed similarly to total surface runoff, they differed significantly in runoff volume per event. In this regard, runoff events triggered by precipitation tended to be less frequent but of greater magnitude, making them more difficult to prevent. In contrast, irrigation-induced runoff events occurred more frequently but involved smaller volumes, as shown in Figure 7.

4.4. Water Output by Runoff in the Different Rotations

The absence of differences in runoff between treatments may indicate that the years of land use changes in the long-term experimental platform at the time of this study (9–11 years) have not significantly affected soil hydraulic properties. This observation is consistent with [54], who reported limited changes in saturated hydraulic conductivity across different land uses, highlighting rainfall intensity and vegetation cover as the dominant factors influencing runoff.

5. Conclusions

The daily water balance model adjusted and validated in this study proved to be a reliable and practical tool for estimating surface runoff. The combination of a locally calibrated water balance model with the integration of climatic data, irrigation water measurements, and periodic monitoring of water depth proved effective for estimating the timing and volume of surface water runoff throughout the crop cycle.
This methodological development constitutes an innovative tool for the region, opening new possibilities for the improved estimation of surface runoff in flooded rice cultivation. In doing so, it contributes to the understanding of the importance of this component as a potential vehicle for transporting nutrients and/or agrochemicals to water bodies.
The accuracy of the model was demonstrated by its ability to explain the observed variability in direct measurements of surface runoff and water depth through simple linear regression models. The good fit between simulated and observed values showed that the model adequately represents the dynamics of water inputs and outputs in the system, thereby validating its predictive capacity and practical utility.
The results indicated that total surface runoff represented between 7.5% and 18% of the total water input to the system. This finding highlights opportunities for improvement in water management, particularly in irrigation-induced runoff, which was more frequent but of a smaller magnitude and could be reduced through refined water management practices. In contrast, precipitation events generated more pronounced runoff peaks, posing a greater challenge for water management and the prevention of surface water contamination.
For future research, it would be valuable to obtain local measurements of percolation and seepage. This would enhance its accuracy and adaptability under diverse conditions.

Supplementary Materials

The following supporting information can be downloaded at: https://www.mdpi.com/article/10.3390/w17142069/s1, Table S1. Normalized sensitivity analysis for the 4 plots over the three years of the study. Figure S1: Micro-topographic survey of each study plot. Figure S2: Correlation of estimated runoff from the water balance between treatments Ri-Pa (green circles) and Ri-Ri (red circles) for the three studied cropping years: 2021 (a), 2022 (b), and 2023 (c).

Author Contributions

Conceptualization, D.R., G.C. and Á.R.; methodology, D.R., G.C., R.H., J.A., A.M. and P.G.-B.; data curation, D.R., M.O. and P.G.-B.; formal analysis, D.R. and Á.R.; investigation, D.R., G.C. and Á.R.; writing—original draft preparation, D.R., G.C., R.H., J.A., A.M. and P.G.-B.; writing—review and editing, D.R., G.C. and Á.R.; supervision. All authors have read and agreed to the published version of the manuscript.

Funding

This research was funded by the Agencia Nacional de Investigación e Inovación (ANII) through a scholarship for the master’s program in Agricultural Sciences (POS_NAC_2021_1_171137) and by the Instituto Nacional de Investigación Agropecuaria, Uruguay (INIA). Additional financial support was provided by the Agricultural Technology Promotion Fund (INIA-FPTA 363) and the ANII-INNOVAGRO project (FSA_PP_2018_1_148336 and FSA_PI_2018_1_148442).

Data Availability Statement

The datasets presented in this article are available upon request.

Acknowledgments

We gratefully acknowledge the Agencia Nacional de Investigación e Inovación (ANII) and the Instituto Nacional de Investigación Agropecuaria, Uruguay (INIA) for the academic scholarship. We also acknowledge Tobias Choyt for his grammatical contribution.

Conflicts of Interest

The authors declare no conflicts of interest. The funders had no role in the design of the study; in the collection, analyses, or interpretation of data; in the writing of the manuscript; or in the decision to publish the results.

References

  1. Aktar, W.; Sengupta, D.; Chowdhury, A. Impact of Pesticides Use in Agriculture: Their Benefits and Hazards. Interdiscip. Toxicol. 2009, 2, 1–12. [Google Scholar] [CrossRef]
  2. Beketov, M.A.; Kefford, B.J.; Schäfer, R.B.; Liess, M. Pesticides Reduce Regional Biodiversity of Stream Invertebrates. Proc. Natl. Acad. Sci. USA 2013, 110, 11039–11043. [Google Scholar] [CrossRef] [PubMed]
  3. Tuong, T.P.; Bouman, B.A.M. Rice Production in Water-Scarce Environments. In Water Productivity in Agriculture: Limits and Opportunities for Improvement; Kijne, J.W., Barker, R., Molden, D., Eds.; CABI Publishing: Wallingford, UK, 2003; pp. 53–67. [Google Scholar] [CrossRef]
  4. Mekonnen, M.M.; Hoekstra, A.Y. Four Billion People Facing Severe Water Scarcity. Sci. Adv. 2016, 2, e1500323. [Google Scholar] [CrossRef] [PubMed]
  5. Prasad, R.; Shivay, Y.S.; Kumar, D. Current Status, Challenges, and Opportunities in Rice Production. In Rice Production Worldwide; Chauhan, B.S., Jabran, K., Mahajan, G., Eds.; Springer International Publishing: Cham, Switzerland, 2017; pp. 1–32. [Google Scholar] [CrossRef]
  6. Bouman, B.A.M.; Lampayan, R.M.; Tuong, T.P. Water Management in Irrigated Rice: Coping with Water Scarcity; International Rice Research Institute: Los Baños, Philippines, 2007. [Google Scholar]
  7. Mekonnen, M.M.; Hoekstra, A.Y. The Green, Blue and Grey Water Footprint of Crops and Derived Crop Products. Hydrol. Earth Syst. Sci. 2011, 15, 1577–1600. [Google Scholar] [CrossRef]
  8. Bouman, B.A.M.; Feng, L.; Tuong, T.P.; Lu, G.; Wang, H.; Feng, Y. Exploring Options to Grow Rice Using Less Water in Northern China Using a Modelling Approach: II. Quantifying Yield, Water Balance Components, and Water Productivity. Agric. Water Manag. 2007, 88, 23–33. [Google Scholar] [CrossRef]
  9. Marchesi, C.; Chauhan, B.S. The Efficacy of Chemical Options to Control Echinochloa Crus-Galli in Dry-Seeded Rice under Alternative Irrigation Management and Field Layout. Crop Prot. 2019, 118, 72–78. [Google Scholar] [CrossRef]
  10. Dunn, B.W.; Gaydon, D.S. Rice Growth, Yield and Water Productivity Responses to Irrigation Scheduling Prior to the Delayed Application of Continuous Flooding in South-East Australia. Agric. Water Manag. 2011, 98, 1799–1807. [Google Scholar] [CrossRef]
  11. Wamishe, Y.; Cartwright, R.; Lee, F. Management of Rice Diseases. In Arkansas Rice Production Handbook; University of Arkansas: Little Rock, AR, USA, 2013; pp. 126–133. [Google Scholar]
  12. Williams, R.L.; Angus, J.F. Deep Floodwater Protects High-Nitrogen Rice Crops from Low-Temperature Damage. Aust. J. Exp. Agric. 1994, 34, 927–932. [Google Scholar] [CrossRef]
  13. Nishiuchi, S.; Yamauchi, T.; Takahashi, H.; Kotula, L.; Nakazono, M. Mechanisms for Coping with Submergence and Waterlogging in Rice. Rice 2012, 5, 2. [Google Scholar] [CrossRef]
  14. Carpenter, S.R.; Stanley, E.H.; Zanden, M.J.V. State of the World’s Freshwater Ecosystems: Physical, Chemical, and Biological Changes. Annu. Rev. Environ. Resour. 2011, 36, 75–99. [Google Scholar] [CrossRef]
  15. Sharpley, A. Managing Agricultural Phosphorus to Minimize Water Quality Impacts. Sci. Agric. 2016, 73, 1–8. [Google Scholar] [CrossRef]
  16. Smith, D.R.; Huang, C.; Haney, R.L. Phosphorus Fertilization, Soil Stratification, and Potential Water Quality Impacts. J. Soil Water Conserv. 2017, 72, 417–424. [Google Scholar] [CrossRef]
  17. Carpenter, S.R.; Caraco, N.F.; Correll, D.L.; Howarth, R.W.; Sharpley, A.N.; Smith, V.H. Nonpoint Pollution of Surface Waters with Phosphorus and Nitrogen. Ecol. Appl. 1998, 8, 559–568. [Google Scholar] [CrossRef]
  18. Oesterheld, M. Impacto de La Agricultura Sobre Los Ecosistemas: Fundamentos Ecológicos y Problemas Más Relevantes. Ecol. Austral. 2008, 18, 337–346. [Google Scholar]
  19. Khoramdel, S.; Shabahang, J.; Amin Ghafouri, A. Evaluation of Environmental Impacts for Rice Agroecosystems Using Life Cycle Assessment (LCA). Iran. J. Appl. Ecol. 2017, 5, 1–14. [Google Scholar] [CrossRef]
  20. Rasmussen, J.J.; Reiler, E.M.; Carazo, E.; Matarrita, J.; Muñoz, A.; Cedergreen, N. Influence of Rice Field Agrochemicals on the Ecological Status of a Tropical Stream. Sci. Total Environ. 2016, 542, 12–21. [Google Scholar] [CrossRef]
  21. Battello, C.; Uraga, R.; Gonnet, D.; Hill, M.; Roel, A. Guía de Buenas Prácticas En El Cultivo de Arroz En Uruguay. Guía de Buenas Prácticas en el Cultivo de Arroz en Uruguay; Asociación Cultivadores de Arroz (ACA), Gremial de Molinos Arroceros (GMA), Universidad de la República–Facultad de Agronomía (UDELAR), Instituto Nacional de Investi-gación Agropecuaria (INIA), Laboratorio Tecnológico del Uruguay (LATU): Montevideo, Uruguay, 2009; pp. 1–32. [Google Scholar]
  22. Böcking, B.; Bandeira, S.; Carnelli, J.P.; García, C.; Marella, M.; Marco, M.; Moor, J.C.; Henderson, P.; Gusonni, A.; Lavecchia, A. Riego Intermitente una Alternativa que Debemos ir Incorporando en Nuestros Sistemas de Riego. Resumen de Tres Años de Trabajos Sobre el Tema. Resultados Experimentales Arroz Zafra 2007–2008; (INIA Serie Actividades de Difusión; 543); INIA: Tacuarembó, Uruguay, 2008; pp. 73–96. [Google Scholar]
  23. Roel, A.; Cantou, G.; Martinez, S.; Casales, L.; Campos, F.; Falero, I. Manejo Del Riego: Productividad Del Agua. INIA. Treinta y Tres. Arroz: Resultados Experimentales 2010–2011; (INIA Serie Actividades de Difusión; 651); INIA: Treinta y Tres, Uruguay, 2011; pp. 1–9. [Google Scholar]
  24. Lavecchia, A.; Marchesi, C.; CAsanova, S. Manejo Del Cultivo: Riego. Resultados Experimentales de Arooz Zafra 2010–2011; (INIA Serie Actividades de Difusión; 652); INIA: Artigas/Tacuarembó, Uruguay, 2011; pp. 1–7. [Google Scholar]
  25. Riccetto, S.; Capurro, M.C.; Roel, Á. Estrategias para minimizar el consumo de agua del cultivo de arroz en Uruguay manteniendo su productividad. Agrociencia Urug. 2017, 21, 109–119. [Google Scholar] [CrossRef]
  26. Carlomagno, M.; Mathó, C.; Cantou, G.; Sanborn, J.R.; Last, J.A.; Hammock, B.D.; Roel, A.; González, D.; González-Sapienza, G. A Clomazone Immunoassay To Study the Environmental Fate of the Herbicide in Rice (Oryza sativa) Agriculture. J. Agric. Food Chem. 2010, 58, 4367–4371. [Google Scholar] [CrossRef][Green Version]
  27. Gonzales, B.; Santos, I.; Pareja, L.; Roel, A.; Cantou, G.; Perez-Parada, A. Surface Runoff and Decay of Glyphosate in Experimental Rice Fields. In Proceedings of the Society of Environmental Toxicology and Chemistry (SETAC) Latin America 15th Biennial Meeting, Montevideo, Uruguay, 17–20 September 2023; p. 384. [Google Scholar]
  28. Counce, P.A.; Keisling, T.C.; Mitchell, A.J. A Uniform, Objective, and Adaptive System for Expressing Rice Development. Crop Sci. 2000, 40, 436–443. [Google Scholar] [CrossRef]
  29. Carracelas, G.; Hornbuckle, J.; Rosas, J.; Roel, A. Irrigation Management Strategies to Increase Water Productivity in Oryza sativa (Rice) in Uruguay. Agric. Water Manag. 2019, 222, 161–172. [Google Scholar] [CrossRef]
  30. Zhao, Y.; De Maio, M.; Vidotto, F.; Sacco, D. Influence of Wet-Dry Cycles on the Temporal Infiltration Dynamic in Temperate Rice Paddies. Soil Tillage Res. 2015, 154, 14–21. [Google Scholar] [CrossRef]
  31. Belder, P.; Bouman, B.A.M.; Cabangon, R.; Guoan, L.; Quilang, E.J.P.; Yuanhua, L.; Spiertz, J.H.J.; Tuong, T.P. Effect of Water-Saving Irrigation on Rice Yield and Water Use in Typical Lowland Conditions in Asia. Agric. Water Manag. 2004, 65, 193–210. [Google Scholar] [CrossRef]
  32. Bouman, B.A.M.; Peng, S.; Castañeda, A.R.; Visperas, R.M. Yield and Water Use of Irrigated Tropical Aerobic Rice Systems. Agric. Water Manag. 2005, 74, 87–105. [Google Scholar] [CrossRef]
  33. Sudhir-Yadav; Humphreys, E.; Kukal, S.S.; Gill, G.; Rangarajan, R. Effect of Water Management on Dry Seeded and Puddled Transplanted Rice: Part 2: Water Balance and Water Productivity. Field Crops Res. 2011, 120, 123–132. [Google Scholar] [CrossRef]
  34. Linquist, B.; Snyder, R.; Anderson, F.; Espino, L.; Inglese, G.; Marras, S.; Moratiel, R.; Mutters, R.; Nicolosi, P.; Rejmanek, H.; et al. Water Balances and Evapotranspiration in Water- and Dry-Seeded Rice Systems. Irrig. Sci. 2015, 33, 375–385. [Google Scholar] [CrossRef]
  35. Xu, Y.; Su, B.; Wang, H.; He, J.; Yang, Y. Analysis of the Water Balance and the Nitrogen and Phosphorus Runoff Pollution of a Paddy Field in Situ in the Taihu Lake Basin. Paddy Water Environ. 2020, 18, 385–398. [Google Scholar] [CrossRef]
  36. Olson, D.M.; Dinerstein, E.; Wikramanayake, E.D.; Burgess, N.D.; Powell, G.V.N.; Underwood, E.C.; D’amico, J.A.; Itoua, I.; Strand, H.E.; Morrison, J.C.; et al. Terrestrial Ecoregions of the World: A New Map of Life on Earth: A New Global Map of Terrestrial Ecoregions Provides an Innovative Tool for Conserving Biodiversity. BioScience 2001, 51, 933–938. [Google Scholar] [CrossRef]
  37. Durán, A.; Califra, A.; Molfino, J.; Lynn, W. Keys to Soil Taxonomy for Uruguay; USDA Natural Resources Conservation Service: Washington, DC, USA, 2006. [Google Scholar]
  38. Macedo, I.; Roel, A.; Velazco, J.I.; Bordagorri, A.; Terra, J.A.; Pittelkow, C.M. Intensification of Rice-Pasture Rotations with Annual Crops Reduces the Stability of Sustainability across Productivity, Economic, and Environmental Indicators. Agric. Syst. 2022, 202, 103488. [Google Scholar] [CrossRef]
  39. Wang, J.; Liu, Y.; Li, B.; Li, Z.; Zhang, Y.; Zhang, S.; Pan, Y.; Zhang, F. The Throughfall, Stemflow, and Canopy Interception Loss in Corn and Soybean Fields in Northeast China. Water 2024, 16, 253. [Google Scholar] [CrossRef]
  40. Massey, J.H.; Smith, M.C.; Vieira, D.A.N.; Adviento-Borbe, M.A.; Reba, M.L.; Vories, E.D. Expected Irrigation Reductions Using Multiple-Inlet Rice Irrigation under Rainfall Conditions of the Lower Mississippi River Valley. J. Irrig. Drain. Eng. 2018, 144, 04018016. [Google Scholar] [CrossRef]
  41. Blanco, F.; Chebataroff, N.; Deambrosi, E.; Blanco, P.; Ávila, S.; Lavecchia, A.; Yang, C.; Wang, W. Riego. In Arroz-Soja: Resultados de La Experimentación Regional En Cultivos. 1983–1984; CIAAB, EEE: Treinta y Tres, Uruguay, 1984; pp. 111–116. [Google Scholar]
  42. Koolhaas, M. Embalses agrícolas. Diseño y Construcción; Editorial Hemisferio Sur: Buenos Aires, Argentina, 2003. [Google Scholar]
  43. Hamby, D.M. A Review of Techniques for Parameter Sensitivity Analysis of Environmental Models. Environ. Monit. Assess. 1994, 32, 135–154. [Google Scholar] [CrossRef] [PubMed]
  44. Allen, R.; Pereira, L.; Raes, D.; Smith, M. Crop Evapotranspiration—Guidelines for Computing Crop Water Requirements—FAO Irrigation and Drainage Paper 56; FAO Irrigation and Drainage Paper; FAO: Rome, Italy, 1998; p. 333. [Google Scholar]
  45. Indata. Home—INDATA URUGUAY. Available online: https://indata.uy/ (accessed on 4 June 2025).
  46. Khepar, S.D.; Yadav, A.K.; Sondhi, S.K.; Siag, M. Water Balance Model for Paddy Fields under Intermittent Irrigation Practices. Irrig. Sci. 2000, 19, 199–208. [Google Scholar] [CrossRef]
  47. Wickham, H.; Grolemund, G. R for Data Science: Import, Tidy, Transform, Visualize, and Model Data, 1st ed.; O’Reilly Media, Inc.: Sebastopol, Australia, 2016. [Google Scholar]
  48. R Core Team. R: A Language and Environment for Statistical Computing. Available online: http://www.R-project.org/ (accessed on 3 March 2025).
  49. GRAS INIA. GRAS- Banco de Datos Agroclimáticos|INIA. Available online: http://www.inia.uy/gras/Clima/Banco-datos-agroclimatico (accessed on 4 March 2025).
  50. Odhiambo, L.O.; Murty, V.V.N. Modeling Water Balance Components in Relation to Field Layout in Lowland Paddy Fields. I. Model Development. Agric. Water Manag. 1996, 30, 185–199. [Google Scholar] [CrossRef]
  51. Jeon, J.-H.; Yoon, G.; Ham, H.; Jung, W. Model Development for Nutrient Loading Estimates from Paddy Rice Fields in Korea. J. Environ. Sci. Health Part B 2004, 39, 845–860. [Google Scholar] [CrossRef]
  52. Yoshinaga, I.; Miura, A.; Hitomi, T.; Hamada, K.; Shiratani, E. Runoff Nitrogen from a Large Sized Paddy Field during a Crop Period. Agric. Water Manag. 2007, 87, 217–222. [Google Scholar] [CrossRef]
  53. Zhao, X.; Xie, Y.; Xiong, Z.; Yan, X.; Xing, G.; Zhu, Z. Nitrogen Fate and Environmental Consequence in Paddy Soil under Rice-Wheat Rotation in the Taihu Lake Region, China. Plant Soil 2009, 319, 225–234. [Google Scholar] [CrossRef]
  54. Zimmermann, B.; Elsenbeer, H.; De Moraes, J.M. The Influence of Land-Use Changes on Soil Hydraulic Properties: Implications for Runoff Generation. For. Ecol. Manag. 2006, 222, 29–38. [Google Scholar] [CrossRef]
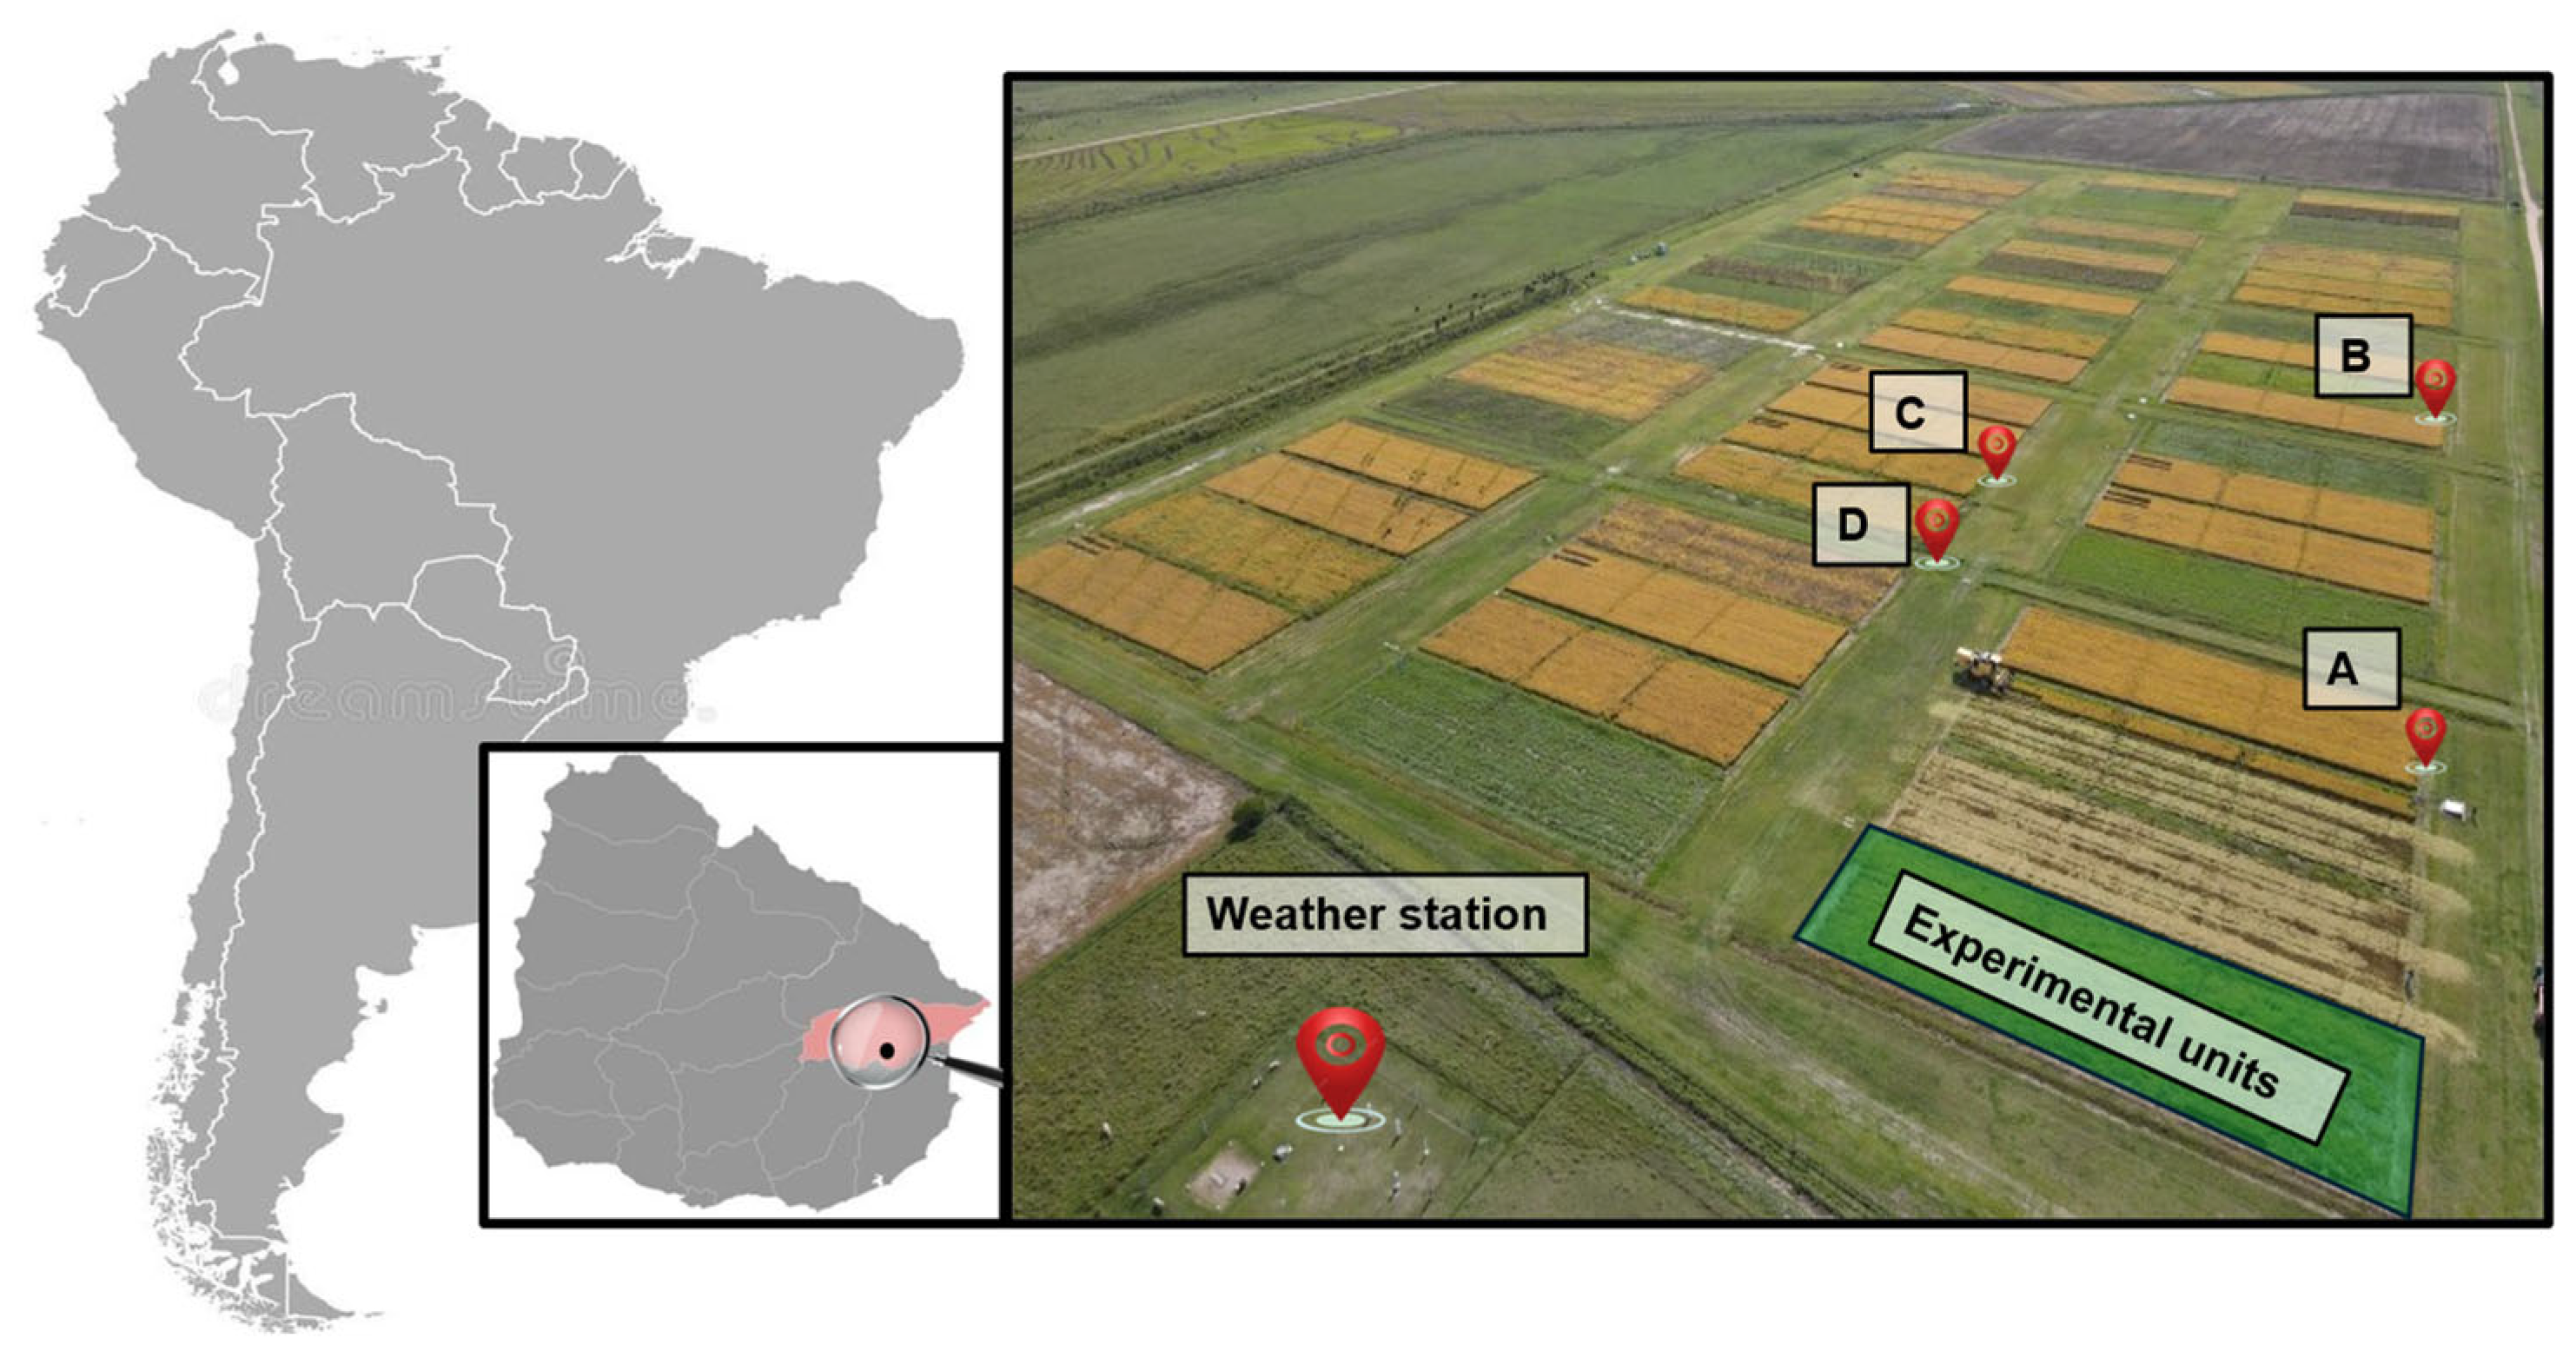
Figure 1. Location of the experimental site at the National Institute of Agricultural Research (INIA) Uruguay, weather station, and experimental units. A, B, C, and D indicate the locations of the various units.
Water 17 02069 g001
Figure 2. Water balance in rice cultivation (modified from [8]). ETc = evapotranspiration, EP = inundated uncropped perimeter evaporation, I = irrigation, O = surface runoff, Pe = percolation, R = precipitation, S = seepage, Wd = water depth, and ET = total plot evapotranspiration.
Water 17 02069 g002
Figure 3. Equipment used for measuring surface water output: (a) PVC elbow, (b) and (c) buried storage tank for water collection and propeller flow meter for emptying, and (d) 90° triangular weir transverse spillway.
Water 17 02069 g003
Figure 4. Regression between measured and simulated water layer depths across three rice-growing cycles (2021, 2022, and 2023) for the Ri-Ri (top row) and Ri-Pa (bottom row) treatments. The dashed blue lines represent the identity line (y = x).
Water 17 02069 g004
Figure 5. Relationship between estimated and measured runoffs. The black dashed line represents the identity line (y = x).
Water 17 02069 g005
Figure 6. Daily temporal evolution of different components of the water balance in rice cultivation during the irrigation months for the years 2021 (A), 2022 (B), and 2023 (C). The values represent the average of the four plots.
Water 17 02069 g006aWater 17 02069 g006b
Figure 7. Comparison of the distribution of runoff generated by irrigation and precipitation during the years 2021, 2022, and 2023. The box-and-whisker plot shows the median (black line within each box), the interquartile range (height of the box), the extreme values (whiskers), and the outliers (points).
Water 17 02069 g007
Table 1. Physicochemical soil parameters (average of the four plots studied).
ParameterValue
Sand 1 (%)18
Silt 1 (%)49
Clay 1 (%)33
Textural classSilty clay
Bulk density 2 (g cm−3)1.5
pH6.2
Organic carbon (%)1.6
N (%)0.14
P Bray 1 (µg P/g) 37.8
K (meq/100 gr)0.17
Notes: 1 Sample depth: 0–15 cm. 2 Sample depth: 0–30 cm. 3 Phosphorus determined by the Bray I method.
Table 2. Average values with their standard deviations of meteorological variables for the months of November to March, recorded at the weather station located at the experimental site.
202120222023
Solar Radiation (KJ m−2 d−1)20,630 ± 5188 20,355 ± 532020,501 ± 5062
Minimum temperature (degrees Celsius)15.5 ± 3.915.7 ± 4.116.2 ± 4.2
Maximum temperature (degrees Celsius)27.8 ± 3.328.1 ± 4.030.2 ± 4.1
Medium temperature (degrees Celsius)21.1 ± 2.621.5 ± 3.022.5 ± 3.1
Total Precipitation (mm)667556282
Class A Evaporation Pan “Tank A” (mm d−1)6.4 ± 2.76.5 ± 2.97.5 ± 3.1
Eto Penman–Monteith (mm d−1)4.2 ± 1.24.1 ± 1.14.6 ± 1.2
Wind speed (m s−1)2.3 ± 1.12.1 ± 0.92.4 ± 1.1
Table 3. Components of water input and output in the water balance, averaged across plots with their standard deviations, during the flooding stage of rice cultivation for the years 2021, 2022, and 2023. All variables are expressed in millimeters (mm).
202120222023
Irrigation752 ± 96967 ± 1251076 ± 48
Effective precipitation556440190
Evapotranspiration646 ± 1.7653 ± 1.5654 ± 1.9
Runoff135 ± 9.3153 ± 6.267 ± 2.7
Final drainage99 ± 1661 ± 1429 ± 16
Percolation127128119
Soil moisture variation *−60−62−65
Seepage383836
Note: * A negative change in soil moisture was used to indicate that the soil was initially drier than at the end of the measurements.
Table 4. Total runoff for the three evaluated years (2021, 2022, and 2023), broken down by runoff induced by irrigation, precipitation events, and final drainage.
202120222023Average
Total runoff (mm)23421496181
Runoff from irrigation (%)22373331
Runoff from precipitation (%)35343735
Final drainage (%)43293034
Disclaimer/Publisher’s Note: The statements, opinions and data contained in all publications are solely those of the individual author(s) and contributor(s) and not of MDPI and/or the editor(s). MDPI and/or the editor(s) disclaim responsibility for any injury to people or property resulting from any ideas, methods, instructions or products referred to in the content.