Article

Waterway Regulation Effects on River Hydrodynamics and Hydrological Regimes: A Numerical Investigation

by
Chuanjie Quan
1,†,
Dasheng Wang
2,†,
Xian Li
1,*,
Zhenxing Yao
2,
Panpan Guo
1,*,
Chen Jiang
1,
Haodong Xing
1,
Jianyang Ren
1,
Fang Tong
1 and
Yixian Wang
1
1
School of Civil Engineering, Hefei University of Technology, Hefei 230009, China
2
Anhui Transportation Survey and Design Institute Co., Ltd., Hefei 230011, China
*
Authors to whom correspondence should be addressed.
These authors contributed equally to this work.
Water 2025, 17(9), 1261; https://doi.org/10.3390/w17091261
Submission received: 26 March 2025 / Revised: 19 April 2025 / Accepted: 22 April 2025 / Published: 23 April 2025
(This article belongs to the Special Issue Advances in Surface Water and Groundwater Simulation in River Basin)

Abstract

:
As a critical intervention for enhancing inland navigation efficiency, waterway regulation projects profoundly modify riverine hydrodynamic conditions while optimizing navigability. This study employs the MIKE21 hydrodynamic model to establish a two-dimensional numerical framework for assessing hydrological alterations induced by channel regulation in the Hui River, China. Through comparative simulations of pre- and post-project scenarios across dry, normal, and wet hydrological years, the research quantifies impacts on water levels, flow velocity distribution, and geomorphic stability. Results reveal that channel dredging and realignment reduced upstream water levels by up to 0.26 m during drought conditions, while concentrating flow velocities in the main channel by 0.5 m/s. However, localized hydrodynamic restructuring triggered bank erosion risks at cut-off bends and sedimentation in anchorage basins. The integrated analysis demonstrates that although regulation measures enhance flood conveyance and navigation capacity, they disrupt sediment transport equilibrium, destabilize riparian ecosystems, and compromise hydrological monitoring consistency. To mitigate these trade-offs, the study proposes design optimizations—including ecological revetments and adaptive dredging strategies—coupled with enhanced hydrodynamic monitoring and riparian habitat restoration. These findings provide a scientific foundation for balancing navigation improvements with the sustainable management of fluvial systems.

1. Introduction

With the rapid development of inland water transport and the implementation of the Belt and Road Initiative, waterway regulation projects have emerged as crucial measures for enhancing shipping capacity and promoting regional economic development. However, these projects have exerted significant influences on river hydrological characteristics, including water level, flow velocity, sediment transport, and riverbed evolution [1,2,3,4]. Such impacts may induce secondary disasters in river channels (exacerbated scouring or siltation), compromise hydrological monitoring accuracy, and even cause alterations in the river’s ecological environment (affecting aquatic habitats) [5,6,7,8].
Recently, systematic research has been conducted by domestic and international scholars on the hydrological impacts of waterway regulation projects, primarily focusing on the comprehensive effects of engineering measures such as spur dikes, submerged dams, and dredging on river hydrodynamic characteristics and riverbed evolution [9,10,11,12]. Relevant studies demonstrate that these regulation projects significantly alter river flow boundary conditions, thereby affecting river water levels, flow velocity distributions, and sediment transport patterns [13,14]. These changes ultimately trigger adjustments in riverbed scour-siltation dynamics [15,16]. Dimensionless equations constructed based on optimization theory demonstrate that natural rivers possess self-regulatory capacities tending toward dynamic equilibrium states [17]. Long-term monitoring of the North River in South China revealed that after waterway dredging, the riverbed exhibited a spatial differentiation pattern characterized by “intensified local scouring and significant downstream deposition” [18]. Flume experiments simulating curved anabranching channels have identified newly excavated navigation channels as primary sediment transport pathways during high-discharge events, highlighting the directional regulation mechanisms of waterway engineering on fluvial geomorphological evolution [19]. Hydrodynamic analyses of the revetment project indicated their capacity to maintain channel morphological stability by reducing bank slope erosion rates by over 40% [20]. Sediment dynamic investigations in estuarine navigation channels revealed that siltation generally occurred after channel dredging, mainly due to differences in tidal flow velocities, input of high sediment concentration water bodies, and changes in local sediment and water dynamics conditions [21]. Such engineering interventions are prone to disrupt the hydrodynamic and regional sediment transport balance of the rivers. Therefore, conducting research on the hydrological impacts of waterway regulation holds substantial theoretical and practical significance.
Furthermore, mathematical models of river flow have been established to quantify the long-term hydrological effects of waterway regulation on rivers. Numerical simulation tools such as MIKE21 (v.2024) are widely used to simulate the post-project flow dynamics and sediment transport processes, offering unparalleled capabilities in hydrodynamic modeling, sediment transport prediction, morphological change analysis, water quality assessment, flood risk evaluation, and ecosystem impact studies with supporting engineering design and management decisions related to river systems [22,23,24]. MIKE21 has significantly improved the accuracy of predictions related to river hydrodynamics and sediment transport [25,26,27,28]. Its advanced numerical schemes and comprehensive physical representation enable more reliable forecasts compared to simpler models or empirical methods [29,30,31]. Its contributions extend across scientific research, engineering practice, and environmental management, making it an indispensable tool for professionals and researchers working with river systems worldwide. These simulations have been integrated with field measurements to establish a comprehensive evaluation framework that encompasses water level fluctuations, scour-siltation intensity, as well as ecological risks [32,33,34].
This research focuses on the Hui River waterway in the middle of China, employing MIKE21 to construct a river hydrodynamic model. By conducting a comparative analysis of the hydrological characteristics pre- and post-regulation, the study comprehensively evaluated the impacts of waterway regulation projects on the river hydrodynamics, and further targeted mitigation and protection measures were proposed to address the observed impacts. Through investigating the hydrological changes induced by navigation improvement projects, this research aimed to provide quantitative decision-making support for optimization strategies for waterway rehabilitation schemes and the sustainable management of riverine water resources.

2. Materials and Methods

2.1. Study Area

The Hui River, a major tributary of the Huai River in the middle of China, originates in Henan Province, flowing through Henan Province and Anhui Province. The total basin area of the river is 4850 km2, with 2930 km2 in Anhui Province. The river basin is narrow and elongated, with higher terrain in the northwest and lower terrain in the southeast. The river is distinguished by its typical plain alluvial channel, featuring a natural slope from 1/7500 to 1/10,000. The upper and middle reaches of the river exhibit steep gradients with deep, narrow channels, while the lower reach transitions to gentle slopes and broad, shallow cross-sections. Rapid runoff concentration in the upper and middle reaches leads to abrupt flood surges, whereas the slow drainage in the lower reach, especially during flood seasons, results in backwater effects that exacerbate flood hazards. Historically serving as a natural waterway, this channel has subpar navigational conditions due to locally narrow widths, inadequate water depth, and restrictive bend radii (minimum 220 m), rendering it non-compliant with Class IV waterway standards. In recent years, there has been an accelerated growth in shipping volumes with an annual increase of over 12% and a scaling up of vessel sizes, with maximum tonnage reaching 500 tons, necessitating urgent regulatory work to ensure navigational safety and accommodate evolving transport demands.
The waterway development project, with a length of 118.85 km, is designed in compliance with Class IV inland navigation standards, integrating both natural riverine characteristics and engineered channelization. The hydraulic design framework establishes navigable water levels between the 10-year flood recurrence stage and 95% duration reliability level, with flood protection engineered for 20-year recurrence events. Currently, two operational 500-tonnage ship locks are in service, supplemented by one under-construction 500-tonnage lock and an additional duplicate ship lock of equivalent capacity. Engineering interventions encompass channel dredging (totaling 11.734 million m3 along the entire 118.85 km length), strategic bank cutting and channel realignment, anchorage basin development, and 12.9 km of riprap revetments for bank stabilization, complemented by intelligent navigation systems and bridge hydraulic retrofitting. The channel alignment thoughtfully preserves natural thalweg configurations, while performing targeted excavations to ensure minimum widths of 40 m. It involves realigning substandard bends (with radii less than 320 m) through controlled cutoffs and installing composite bank protection to maintain sediment continuity. This approach meets the operational requirements of modern barge convoys. The geographical location of the waterway regulation project is shown in Figure 1.

2.2. Modeling of River Flow Dynamics

2.2.1. Mathematical Model of River Flow Dynamics

This study investigates river flow dynamics by developing a two-dimensional mathematical model of the river. The mathematical framework is formulated using fundamental conservation principles, primarily comprising the continuity equation and momentum conservation equations. For numerical computation, the model adopts an unstructured grid-based finite volume method (FVM), which demonstrates notable advantages in computational efficiency and geometric adaptability. This numerical approach ensures rigorous mass flux conservation while effectively accommodating complex bathymetric configurations. The governing equation system can be expressed as follows [35]:
h t + h u ¯ x + h v ¯ y = h S
h u ¯ t + h u ¯ x 2 + h v u ¯ y = f v ¯ h g h η x h ρ 0 P a x g h 2 2 ρ 0 ρ x + τ s x ρ 0 τ b x ρ 0 1 ρ S xx x + S x y x + ( h T x x ) x + ( h T x y ) y + h u s S
h v ¯ t + h v ¯ y 2 + h u v ¯ x = f u ¯ h g h η y h ρ 0 P a y g h 2 2 ρ 0 ρ y + τ s y ρ 0 τ b y ρ 0 1 ρ 0 S y x y + S y y x + ( h T x y ) x + ( h T y y ) y + h v s S
In the equations, t represents time; x , y are the right-handed Cartesian coordinates; η denotes the water surface elevation relative to the undisturbed water level (commonly referred to as the water level); h is the still water depth; u , v are the velocity components in the x and y directions, respectively; ρ is the local atmospheric pressure; ρ o is the water density; f is the Coriolis parameter; f v ¯ , f u ¯ are the accelerations induced by Earth’s rotation; S x x , S x y , S y x , S y y are the radiation stress components; T x x , T x y , T y x , T y y are the horizontal viscous stress terms; S is the source/sink term; ( u s , v s ) are the flow velocity components of the source/sink term.

2.2.2. Establishment of a Two-Dimensional Numerical Model of River Flow

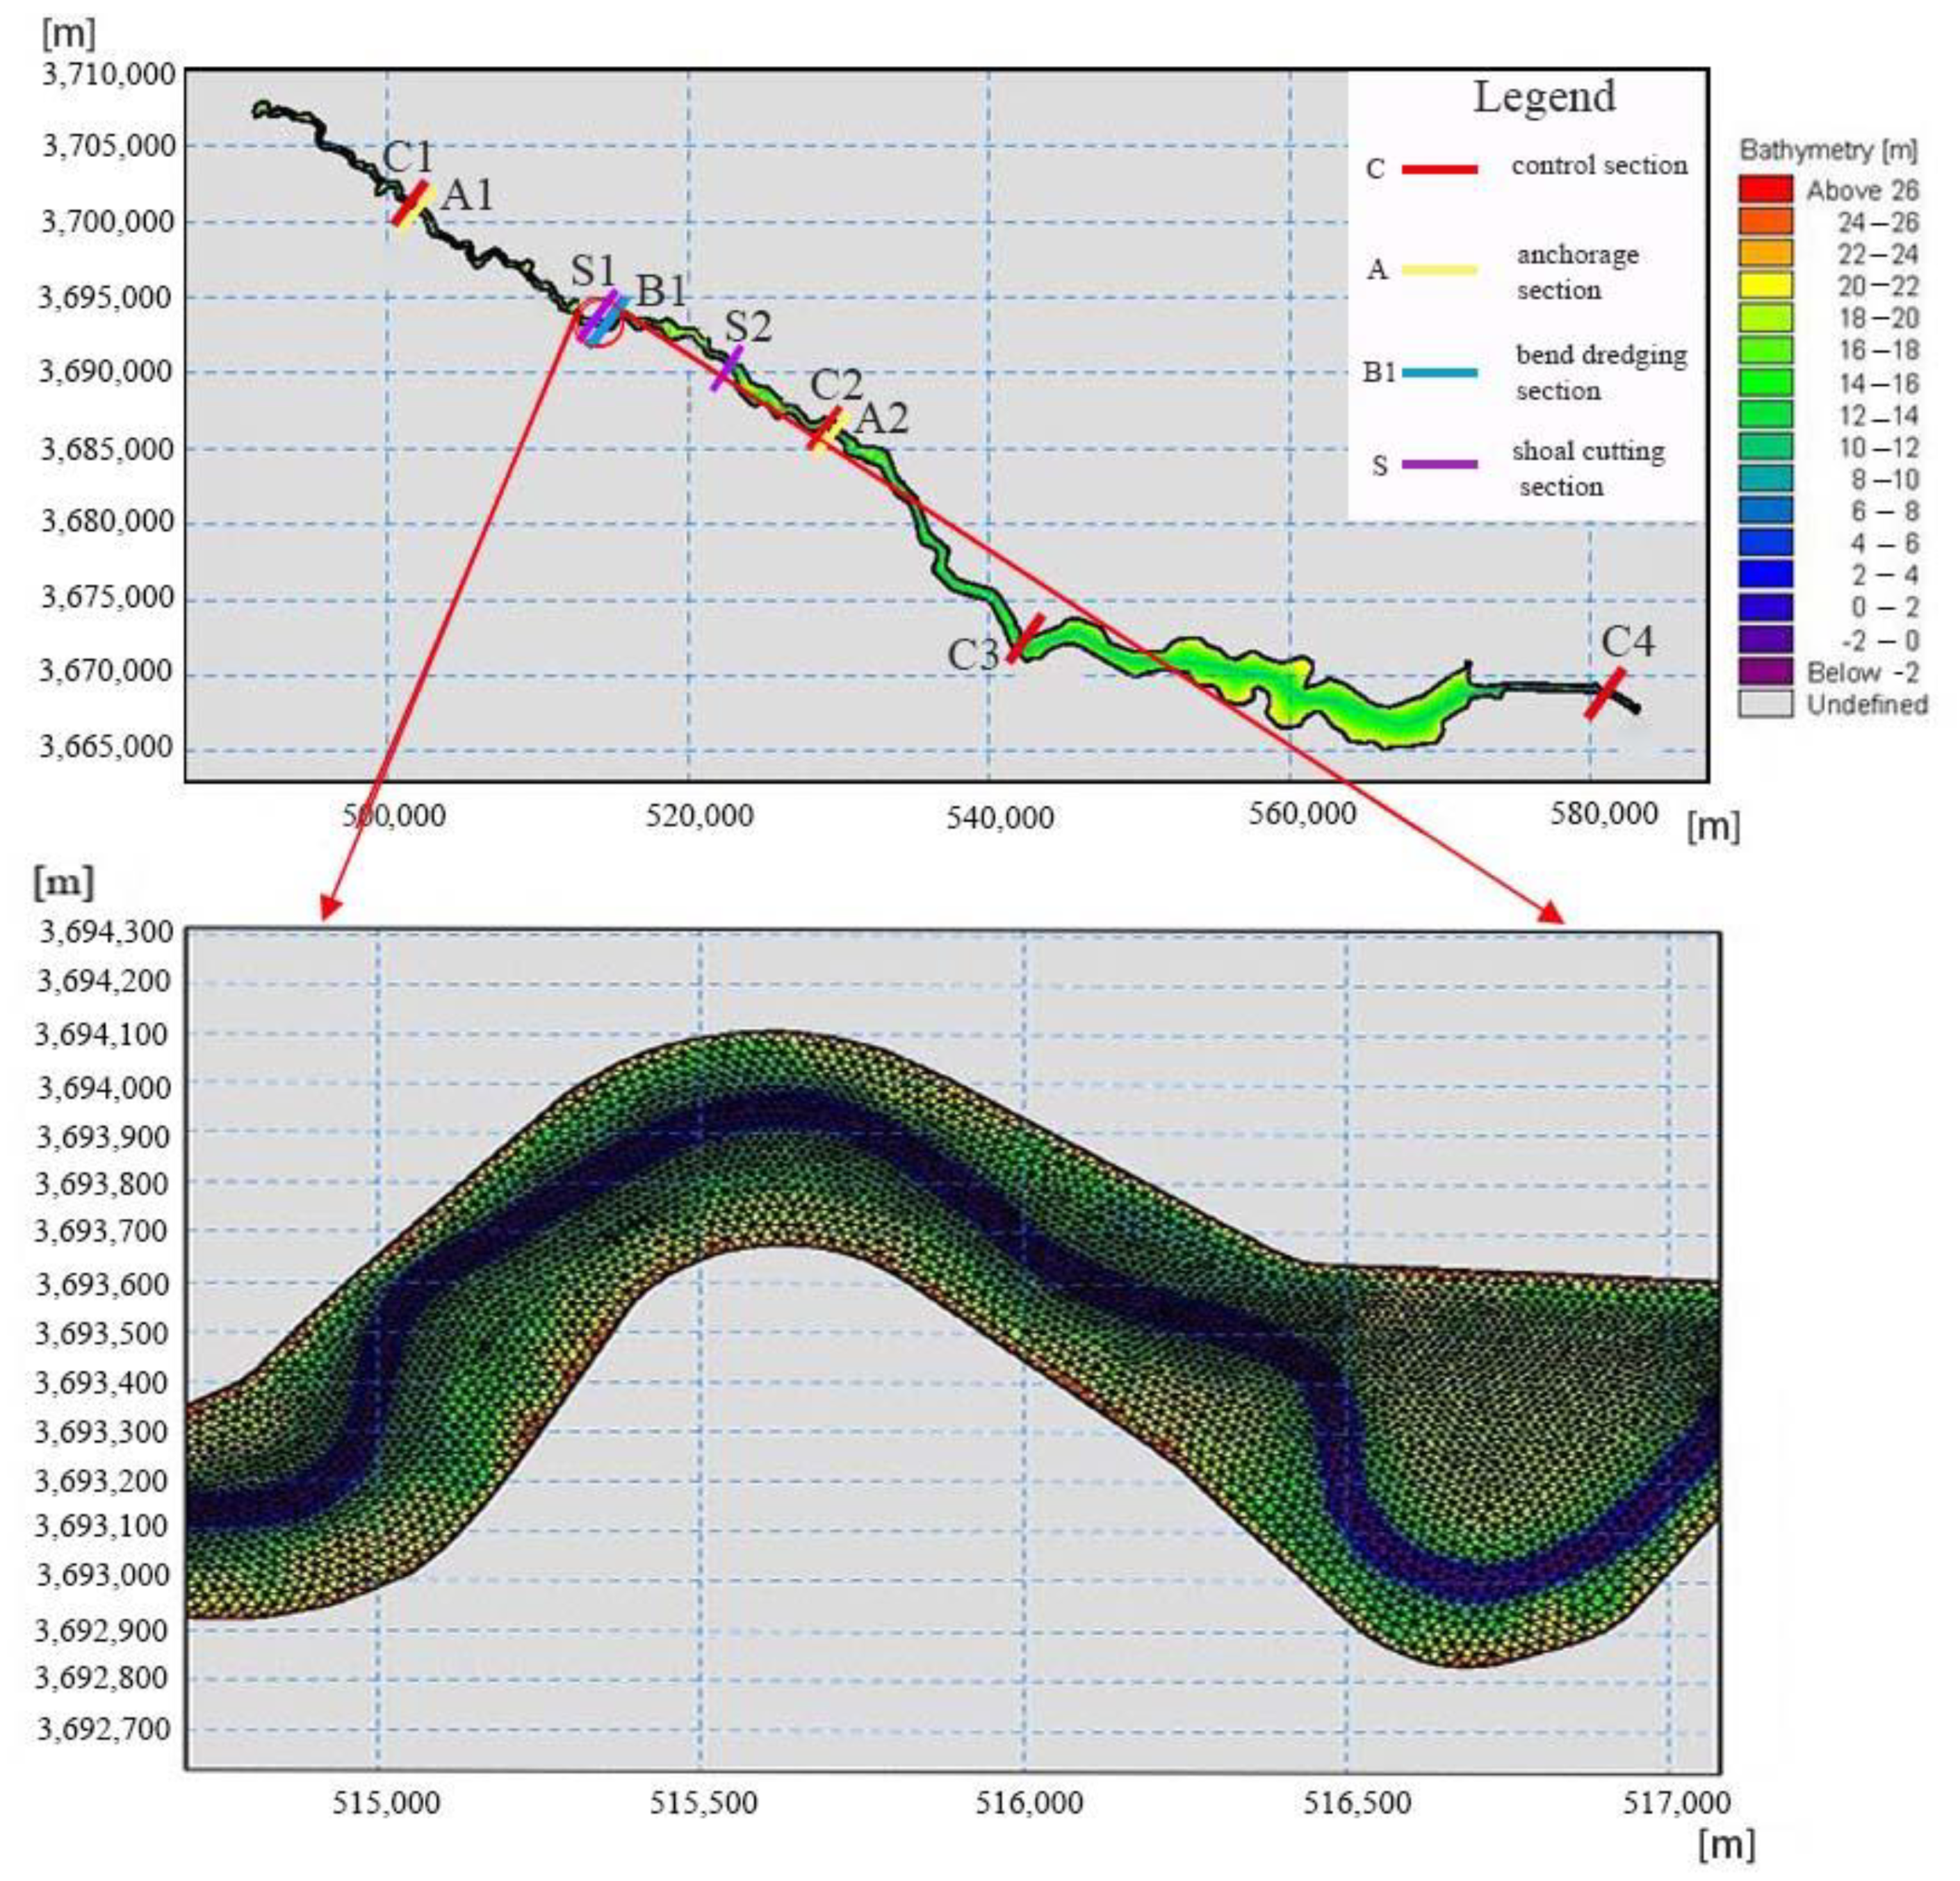
The numerical model employs triangular meshes with varying spatial resolutions and grid sizes adapted to the hydrodynamic conditions and computational requirements of different river reaches. The main channel was discretized with grids ranging from 25 to 30 m, while the navigation channel was refined to scales of 15 to 20 m. Localized grid refinement was implemented in critical areas, including anchorage layouts, bank cut-offs, and bend dredging sections. The total number of mesh elements amounted to 401,464, accompanied by an equal number of discrete nodes (Figure 2). As illustrated in Figure 2, there were four representative control sections delineated for comprehensive analysis. The red-lined C sections served as the water level control sections, meticulously employed to scrutinize the fluctuation characteristics of river water levels along the longitudinal course of the waterway. These sections, from upstream to downstream, were designated as C1, C2, C3, and C4, respectively. The yellow-highlighted A sections represented the anchorage projects integral to the waterway regulation scheme, simply referred to as A1 and A2. Meanwhile, the bend dredging operations had their control sections marked in blue (B1 lines), which facilitated an in-depth examination of the hydrological attributes post-dredging within the curved segments. Lastly, S1 and S2 stood as a pivotal control section for the artificial beach cutting endeavor, where the unique hydrological traits of a river segment characterized by a narrow main channel and an inadequate bend radius were meticulously analyzed.
The initial water levels were determined through linear interpolation between upstream and downstream stage data across cross-sectional intervals. For extended computational domains, water surface profile analysis was conducted to establish stage values at key cross-sections, followed by segmented linear interpolation. The initial velocity field was configured with zero transverse velocity components (v = 0 in the y direction), while longitudinal velocities (u in the x direction) were computed using the Manning formula, subsequently verified for discharge consistency at control sections. Given the complexity of distributed tributary inflows along this multi-confluence river reach, strategic simplification was adopted to enhance model feasibility. The original 23 tributaries were rationally aggregated into 5 representative inflow nodes, with discharge hydrographs calibrated under varying hydrological scenarios (the dry, normal, and wet conditions). This study is based on the complete hydrological measured data from a hydrological station on the Hui River. According to the annual runoff data from 1960 to 2020 at the hydrological station, a computational frequency series of the P-III probability density distribution was established. Through the computational frequency series of runoff, the classification criteria for annual runoff in wet, normal, and dry years were determined. The long-term average annual runoff was determined as 8.178 × 10⁸ m3. The annual runoff volumes for wet years (p = 25%), normal years (p = 50%), and dry years (p = 75%) were 9.208 × 10⁸ m3, 8.011 × 10⁸ m3, and 7.231 × 10⁸ m3, respectively.

2.2.3. Calibration and Validation of Parameters

The channel roughness coefficient, as a comprehensive parameter reflecting river resistance, plays a decisive role in the accuracy of mathematical calculations, where the validity of results hinges critically on the appropriate selection of roughness parameters. Due to the extensive length of the modeled river reach, precise calibration of the roughness coefficient proved challenging. For this calculation, the roughness coefficient values were directly adopted from the “Feasibility Study Report for the Preliminary Regulation Project of the Hui River” and applied to validate the existing water level conditions. Furthermore, to evaluate the accuracy of the model simulation results, the study employed relative error and root mean square error (RMSE) analyses to assess the correlation and agreement between the simulated and measured values.
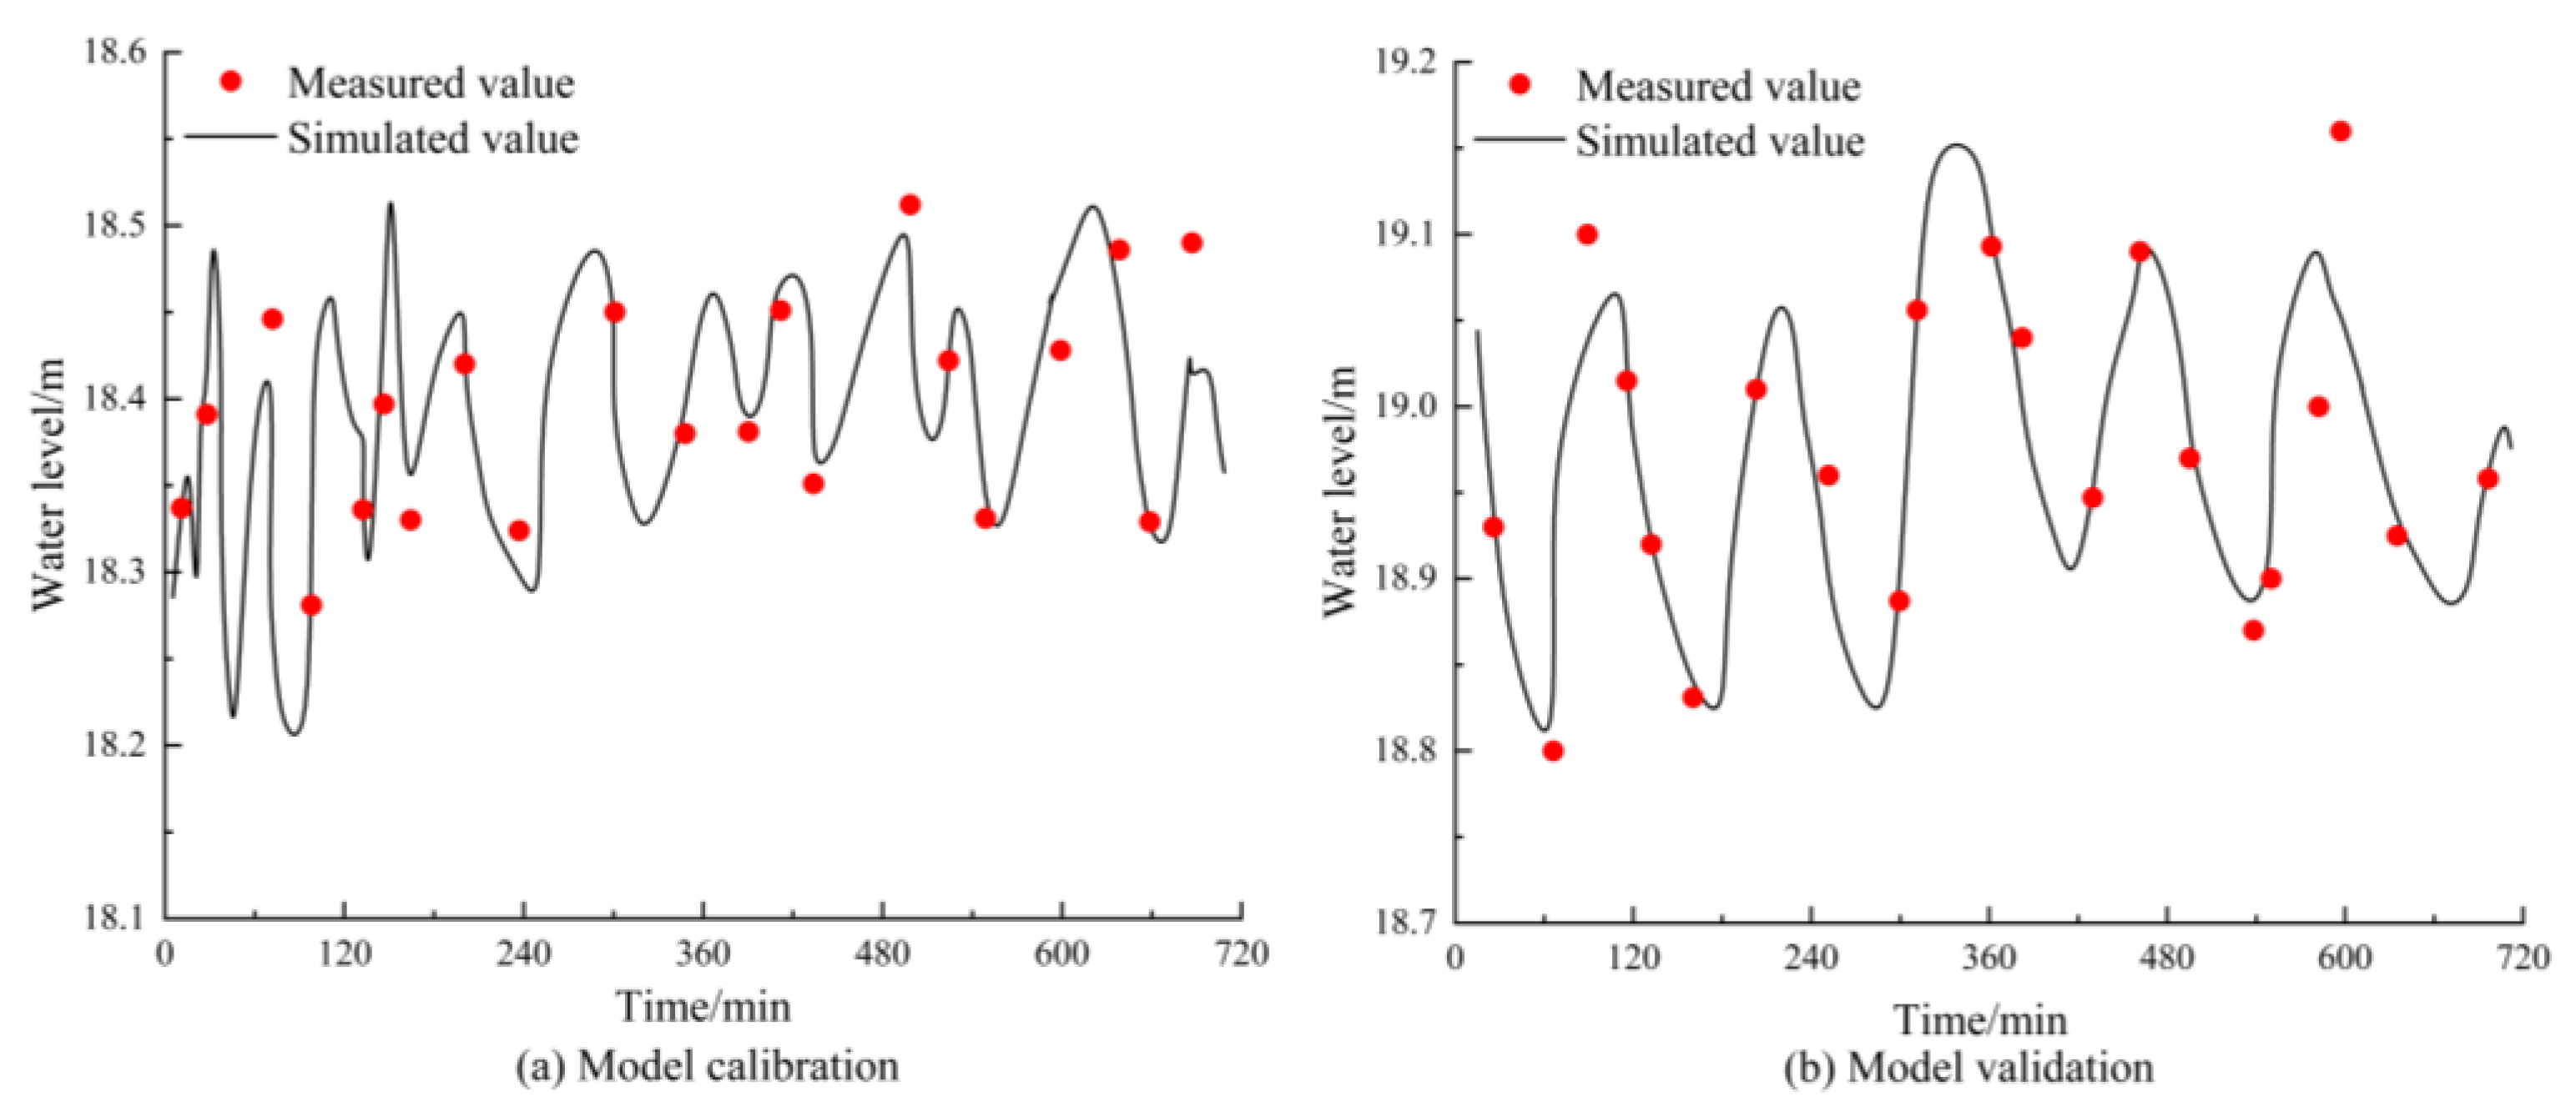
This study calibrated the riverbed roughness coefficient using measured water level data from 08:00 to 20:00 on 3 July 2007. The simulation was configured with a 60 s time step, and the C2 control point was selected for water level validation. During the calibration period, the simulated water levels showed minimal discrepancies from the measured values, with a relative error of 2.69% and RMSE of 0.0311. To ensure the scientific rigor of the study, further validation was conducted using measured data from 5 July 2003 (8:00 AM to 8:00 PM). As shown in Figure 3, the simulated water levels during validation demonstrated good agreement with the measured values, yielding a relative error of 3.79% and an RMSE of 0.0368. Overall, the constructed model exhibited satisfactory performance. Based on these results, the roughness coefficients were finalized as 0.025 for the main channel and 0.035 for the floodplain areas.

3. Results and Analysis

3.1. Analysis of the Impacts of the Waterway Project on River Water Levels

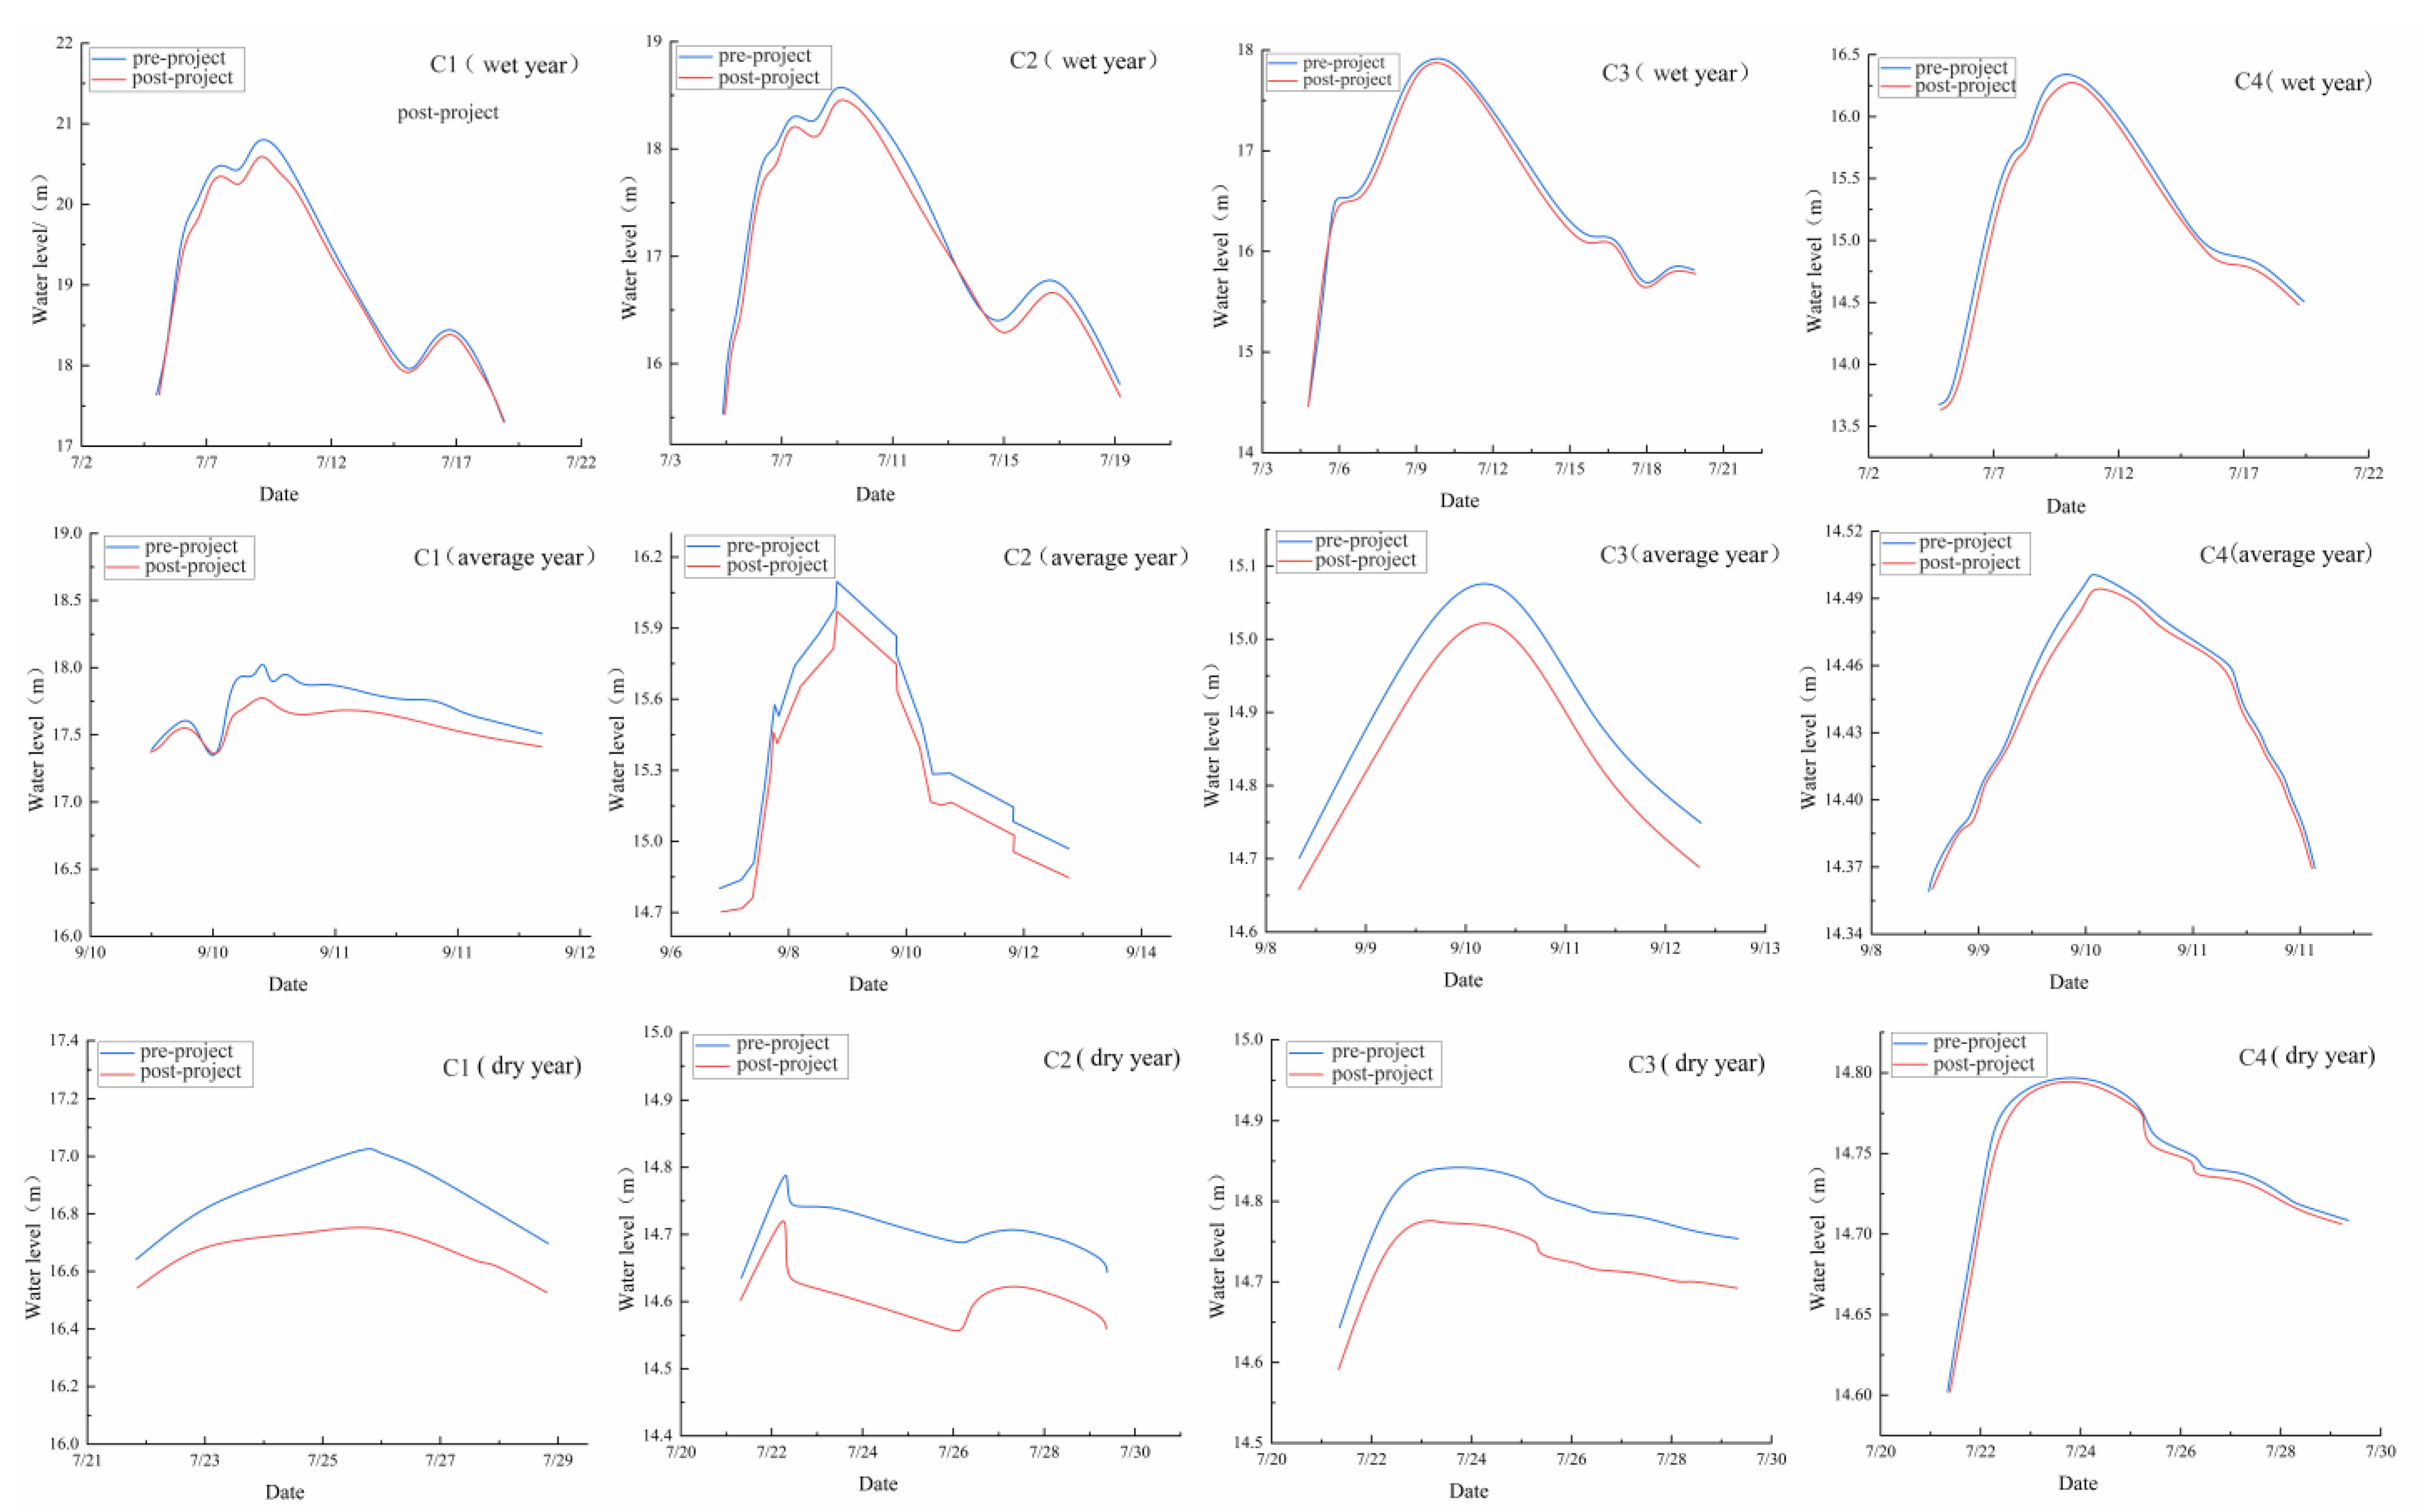
To systematically evaluate the impacts of the waterway regulation project on river water level variations, this study employed the aforementioned hydrodynamic model to simulate the pre-engineering and post-engineering river water level changes under three hydrological years: a wet year (2007), a normal year (2010), and a drought year (2013). Four representative control river cross-sections (C1–C4, seen from Figure 2) were analyzed to comparatively assess water level variations of pre- and post-project implementation under different hydrological scenarios. The simulation results (Table 1, Figure 4) revealed significant water level reductions at the control cross-sections, with the maximum drawdown of 0.26 m observed at the upstream section C1 during the drought conditions. Conversely, the minimal reduction of 0.001 m occurred at the downstream section C4 under high-flow scenarios. The regulatory effects on water levels exhibited hydrological condition-dependent characteristics, as the variations in river water level in low-flow years showed markedly greater reductions compared to the water level variations in other flow conditions, with diminishing impacts progressing downstream. These hydrodynamic responses suggested that channel geometry modifications through dredging and cross-section expansion effectively increased the hydraulic conveyance capacity, particularly enhancing flood-plain connectivity during high-flow events.

3.2. Analysis of Flow Velocity Impacts Pre- and Post-Implementation of the Navigation Channel Project

The waterway regulation project alters the channel’s velocity attributes through dredging and optimizing its cross-section, with the velocity increasing significantly in wet years. To assess the impact of this project on river flow velocity variations, this present study utilized the hydrodynamic model to simulate the pre-engineering and post-engineering river water velocity changes under a 20-year flood recurrence condition. The main channel exhibits substantially enhanced flow velocities during high-water periods, accompanied by increased velocity variability and moderated near-bank flows. Geometric improvements in channel morphology, including optimized width-depth ratios and reduced bed roughness, had effectively concentrated flow pathways. Nevertheless, localized channel widening and modifications to longitudinal gradients had led to diminished flow energy in specific zones. These spatially heterogeneous flow patterns imposed dualistic impacts on navigation, which enhanced main channel navigability coexisting with elevated sedimentation risks along bank slopes, necessitating integrated maintenance strategies combining periodic dredging and ecological bank protection. Further investigations will focus on the hydrodynamic impacts of anchorage engineering, bend dredging engineering, and beach cutting engineering as follows.

3.2.1. Impact Analysis of Anchorage Projects on River Hydrological Characteristics

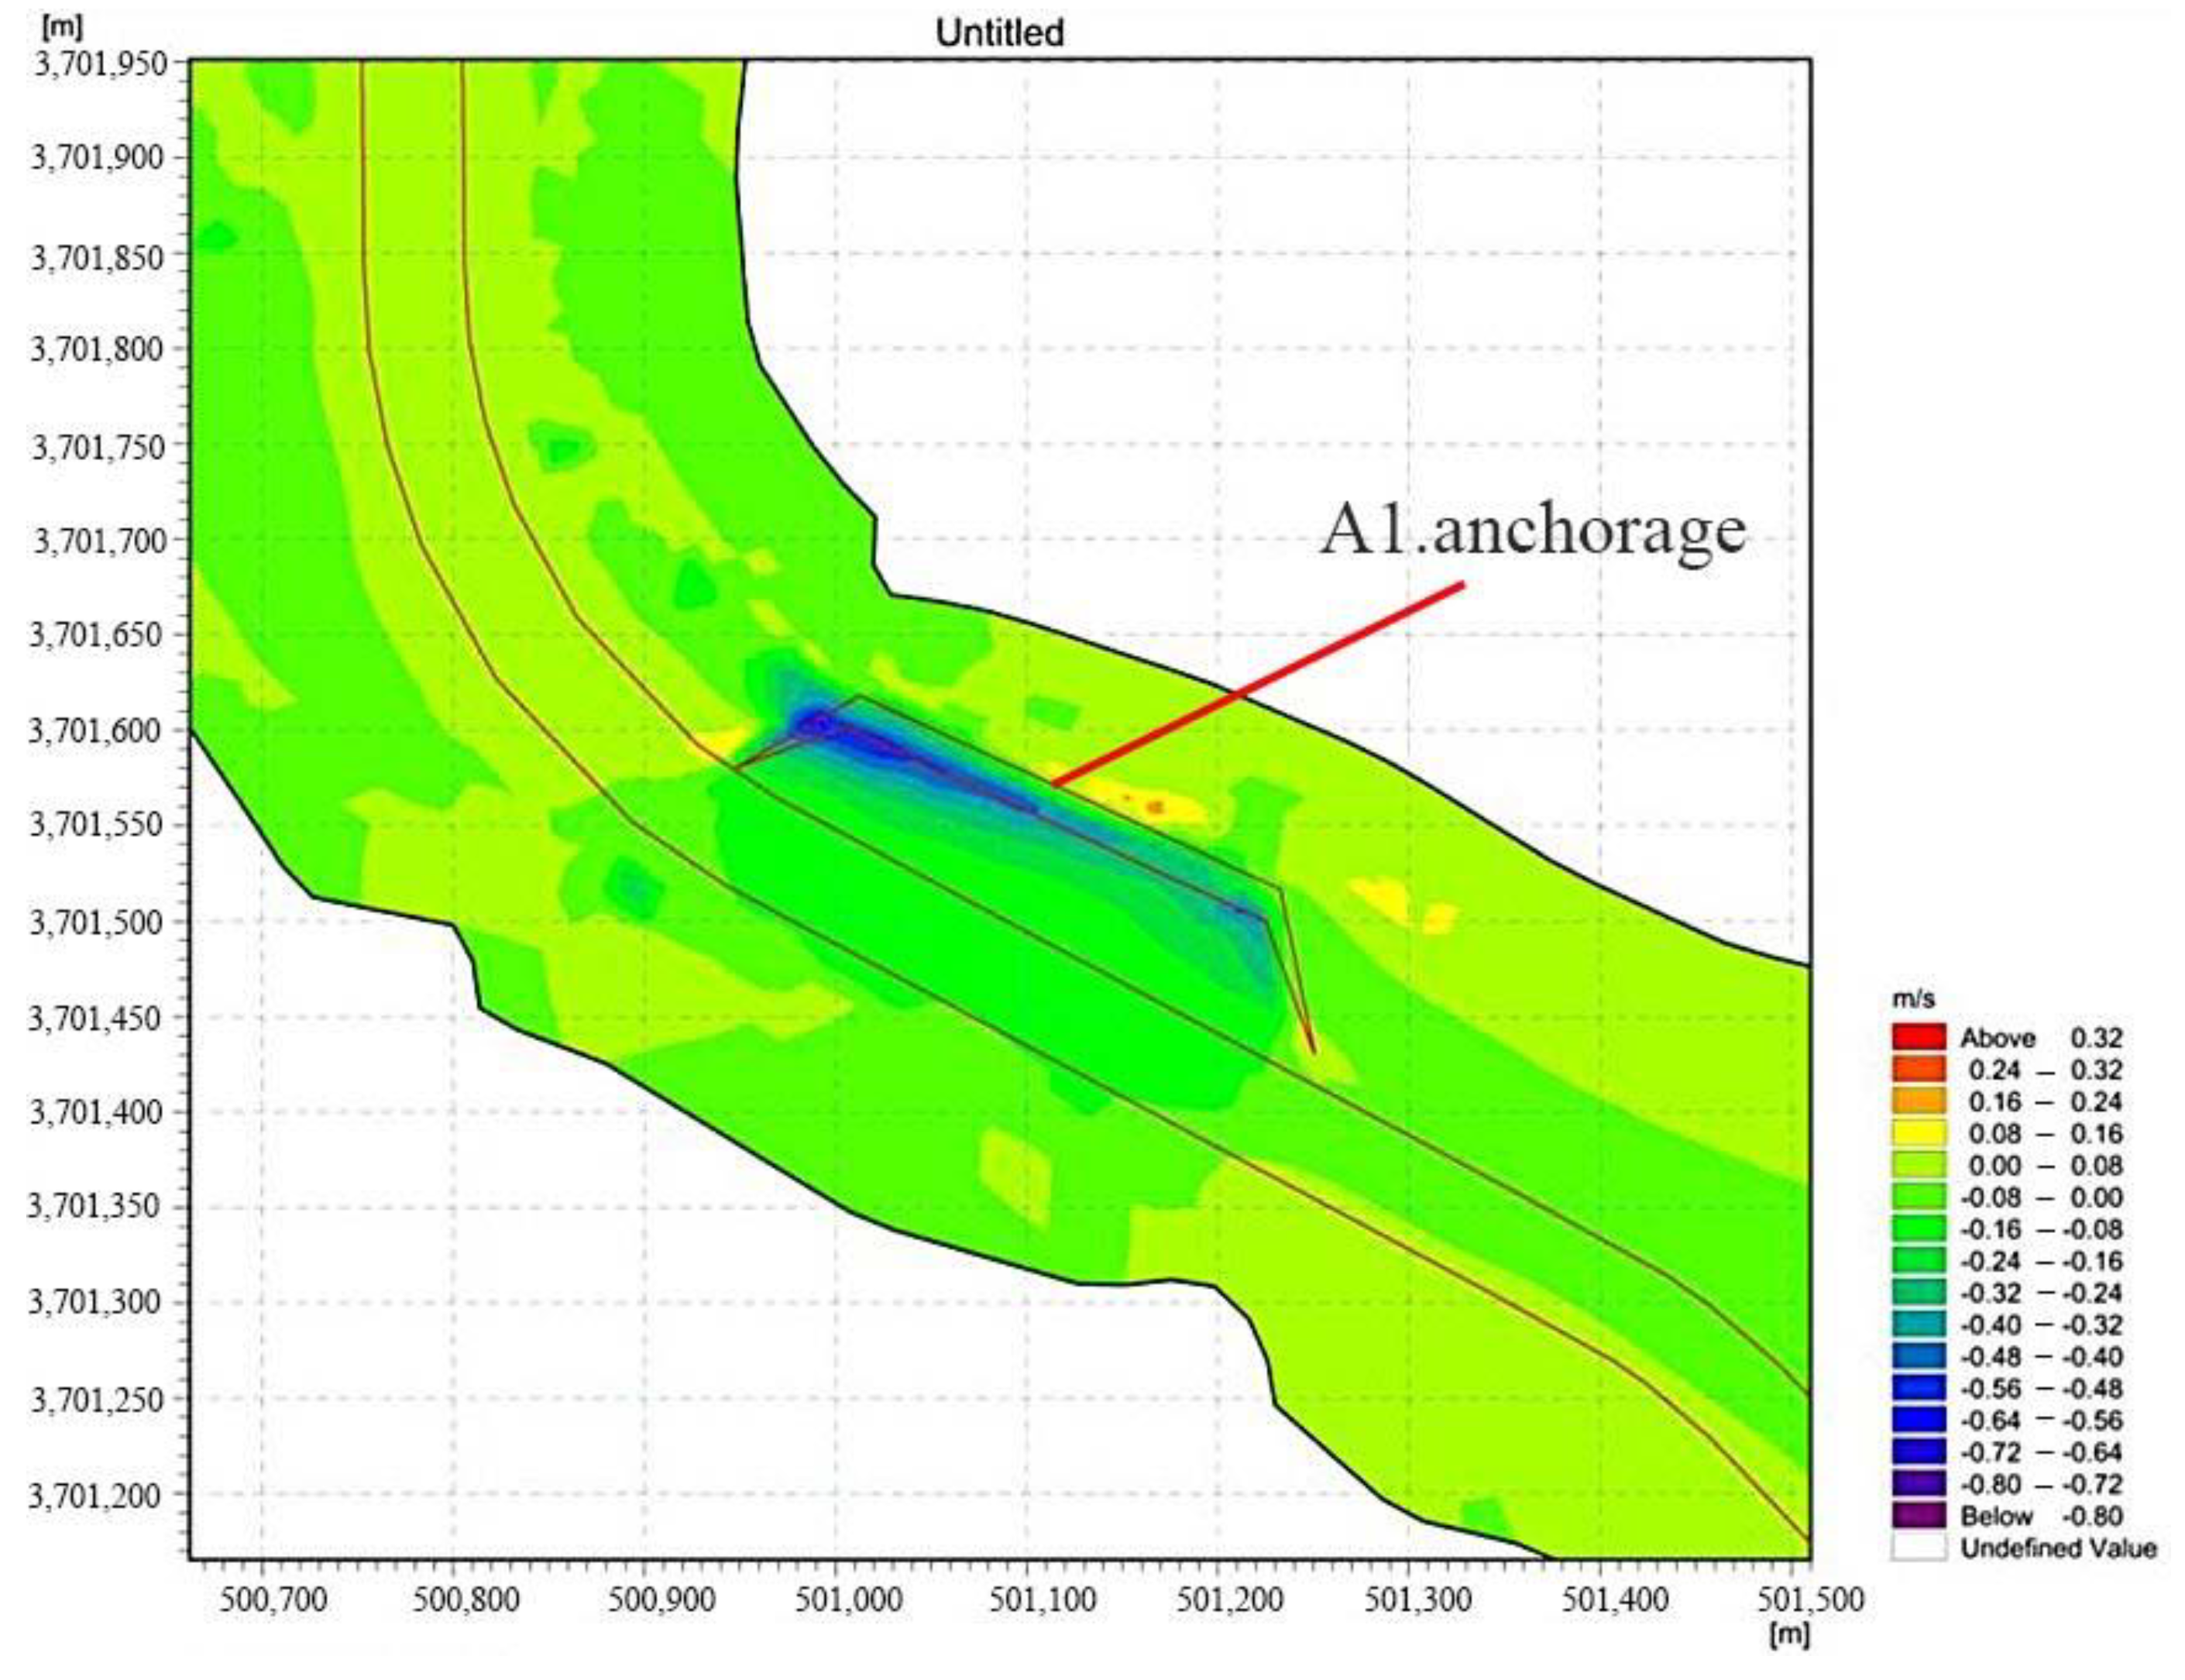
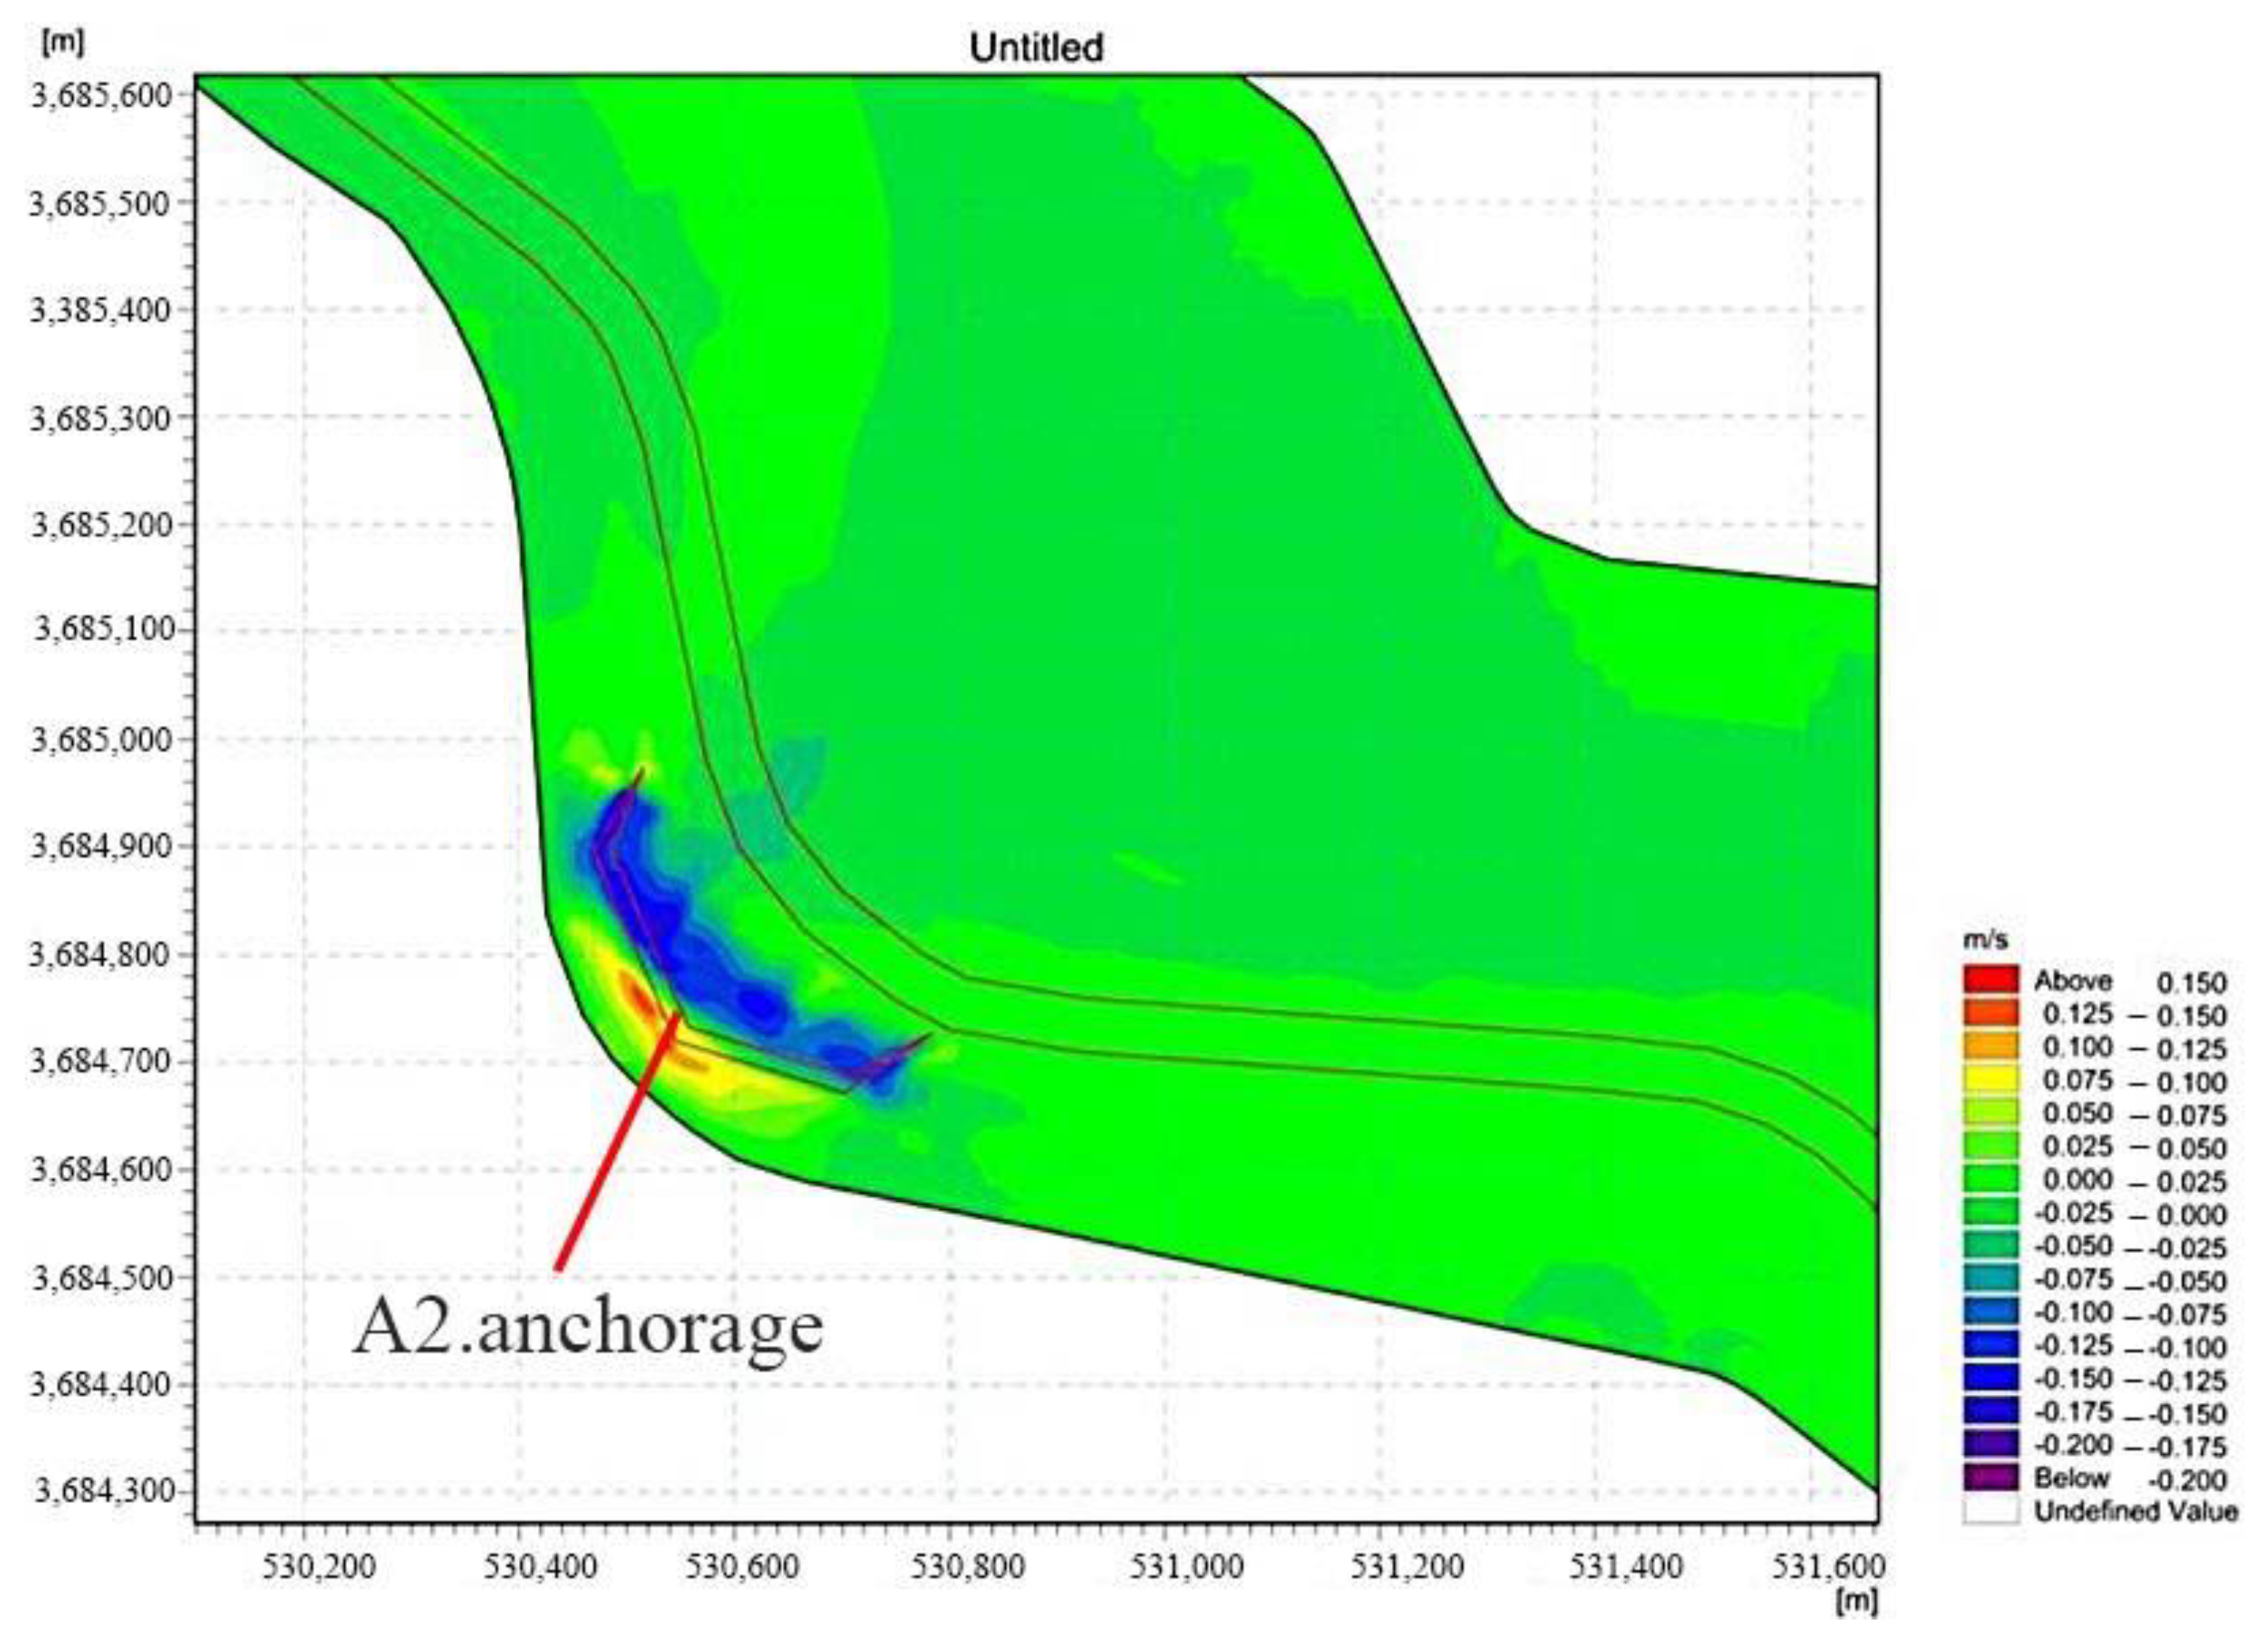
In waterway regulation projects, the scientific design and safe operation of anchorage areas require systematic consideration of multiple factors, including hydrodynamic conditions, vessel operation requirements, and navigation channel functional positioning. Quantitative simulations were carried out to assess flow velocity distributions both prior to and following the execution of the anchorage project (depicted in Figure 5 and Figure 6). The research focused on two representative control sections (A1 and A2) with the objective of elucidating the influence of anchorage engineering on altering local hydrodynamic environments.
The A1 section maintains natural fluvial characteristics within its anchorage zone, retaining its original river channel morphology without artificial embankment modifications. Numerical simulations demonstrate that the implemented anchorage engineering works have induced significant hydrodynamic alterations, particularly through the creation of distinct spatial gradients in flow velocity distribution. Post-construction analysis revealed measurable changes in flow dynamics that the main channel experienced the maximum velocity increments of 0.16 m/s, while concurrent flow reductions of 0.72 m/s were observed in the anchorage basin (Figure 5). This velocity attenuation in the basin area is attributed to localized bathymetric changes, specifically the engineered deepening of water depth that modified the cross-sectional flow geometry and energy dissipation patterns. This velocity attenuation in the basin area is attributed to localized bathymetric changes, specifically the engineered deepening of water depth that modified the cross-sectional flow geometry and energy dissipation patterns.
The A2 control section anchorage is located in a regulated river reach between both bank embankments, featuring typical asymmetric topographic characteristics of 390–700 m and 65–105 m wide floodplains on the left and right banks, respectively. The model results revealed that the flow velocities in the main channel of the anchorage section increased by 0.025–0.050 m/s, whereas the deepened harbor basin experienced velocity decreases of 0.125–0.175 m/s. Compared with the A1 area, the A2 control section exhibited more pronounced spatial heterogeneity in hydraulic parameter adjustments due to embankment constraints, though all variations remain within the permissible range of engineering design specifications. The A2 control section anchorage occupies a regulated river reach constrained by 980 m between both bank embankments, featuring typical asymmetric topographic characteristics of 390–700 m and 65–105 m wide floodplains on the left and right banks, respectively. Hydraulic modeling revealed similar adjustment patterns that flow velocities in the main channel of the anchorage section increased by 0.025–0.050 m/s, whereas the deepened harbor basin experienced velocity decreases of 0.125–0.175 m/s.
Integrated hydrodynamic numerical simulations of sections A1 and A2 revealed that anchorage projects primarily influence local hydrodynamic environments through bathymetric alterations from harbor basin excavation. The research confirmed that the predictive guidance from a two-dimensional hydrodynamic model can effectively regulate flow velocities. Monitoring data indicate that variations in hydraulic parameters at both anchorage sites remain within flood control safety thresholds, and the redistribution of flow velocity fields enhances vessel berthing stability, thereby fully validating the scientific rigor and safety of the engineering design. This study provides a reference analytical framework for hydrological impact assessments of similar river regulation projects.

3.2.2. Impact Analysis of Left Branch Dredging in a Curved River Section on the Hydrological Characteristics

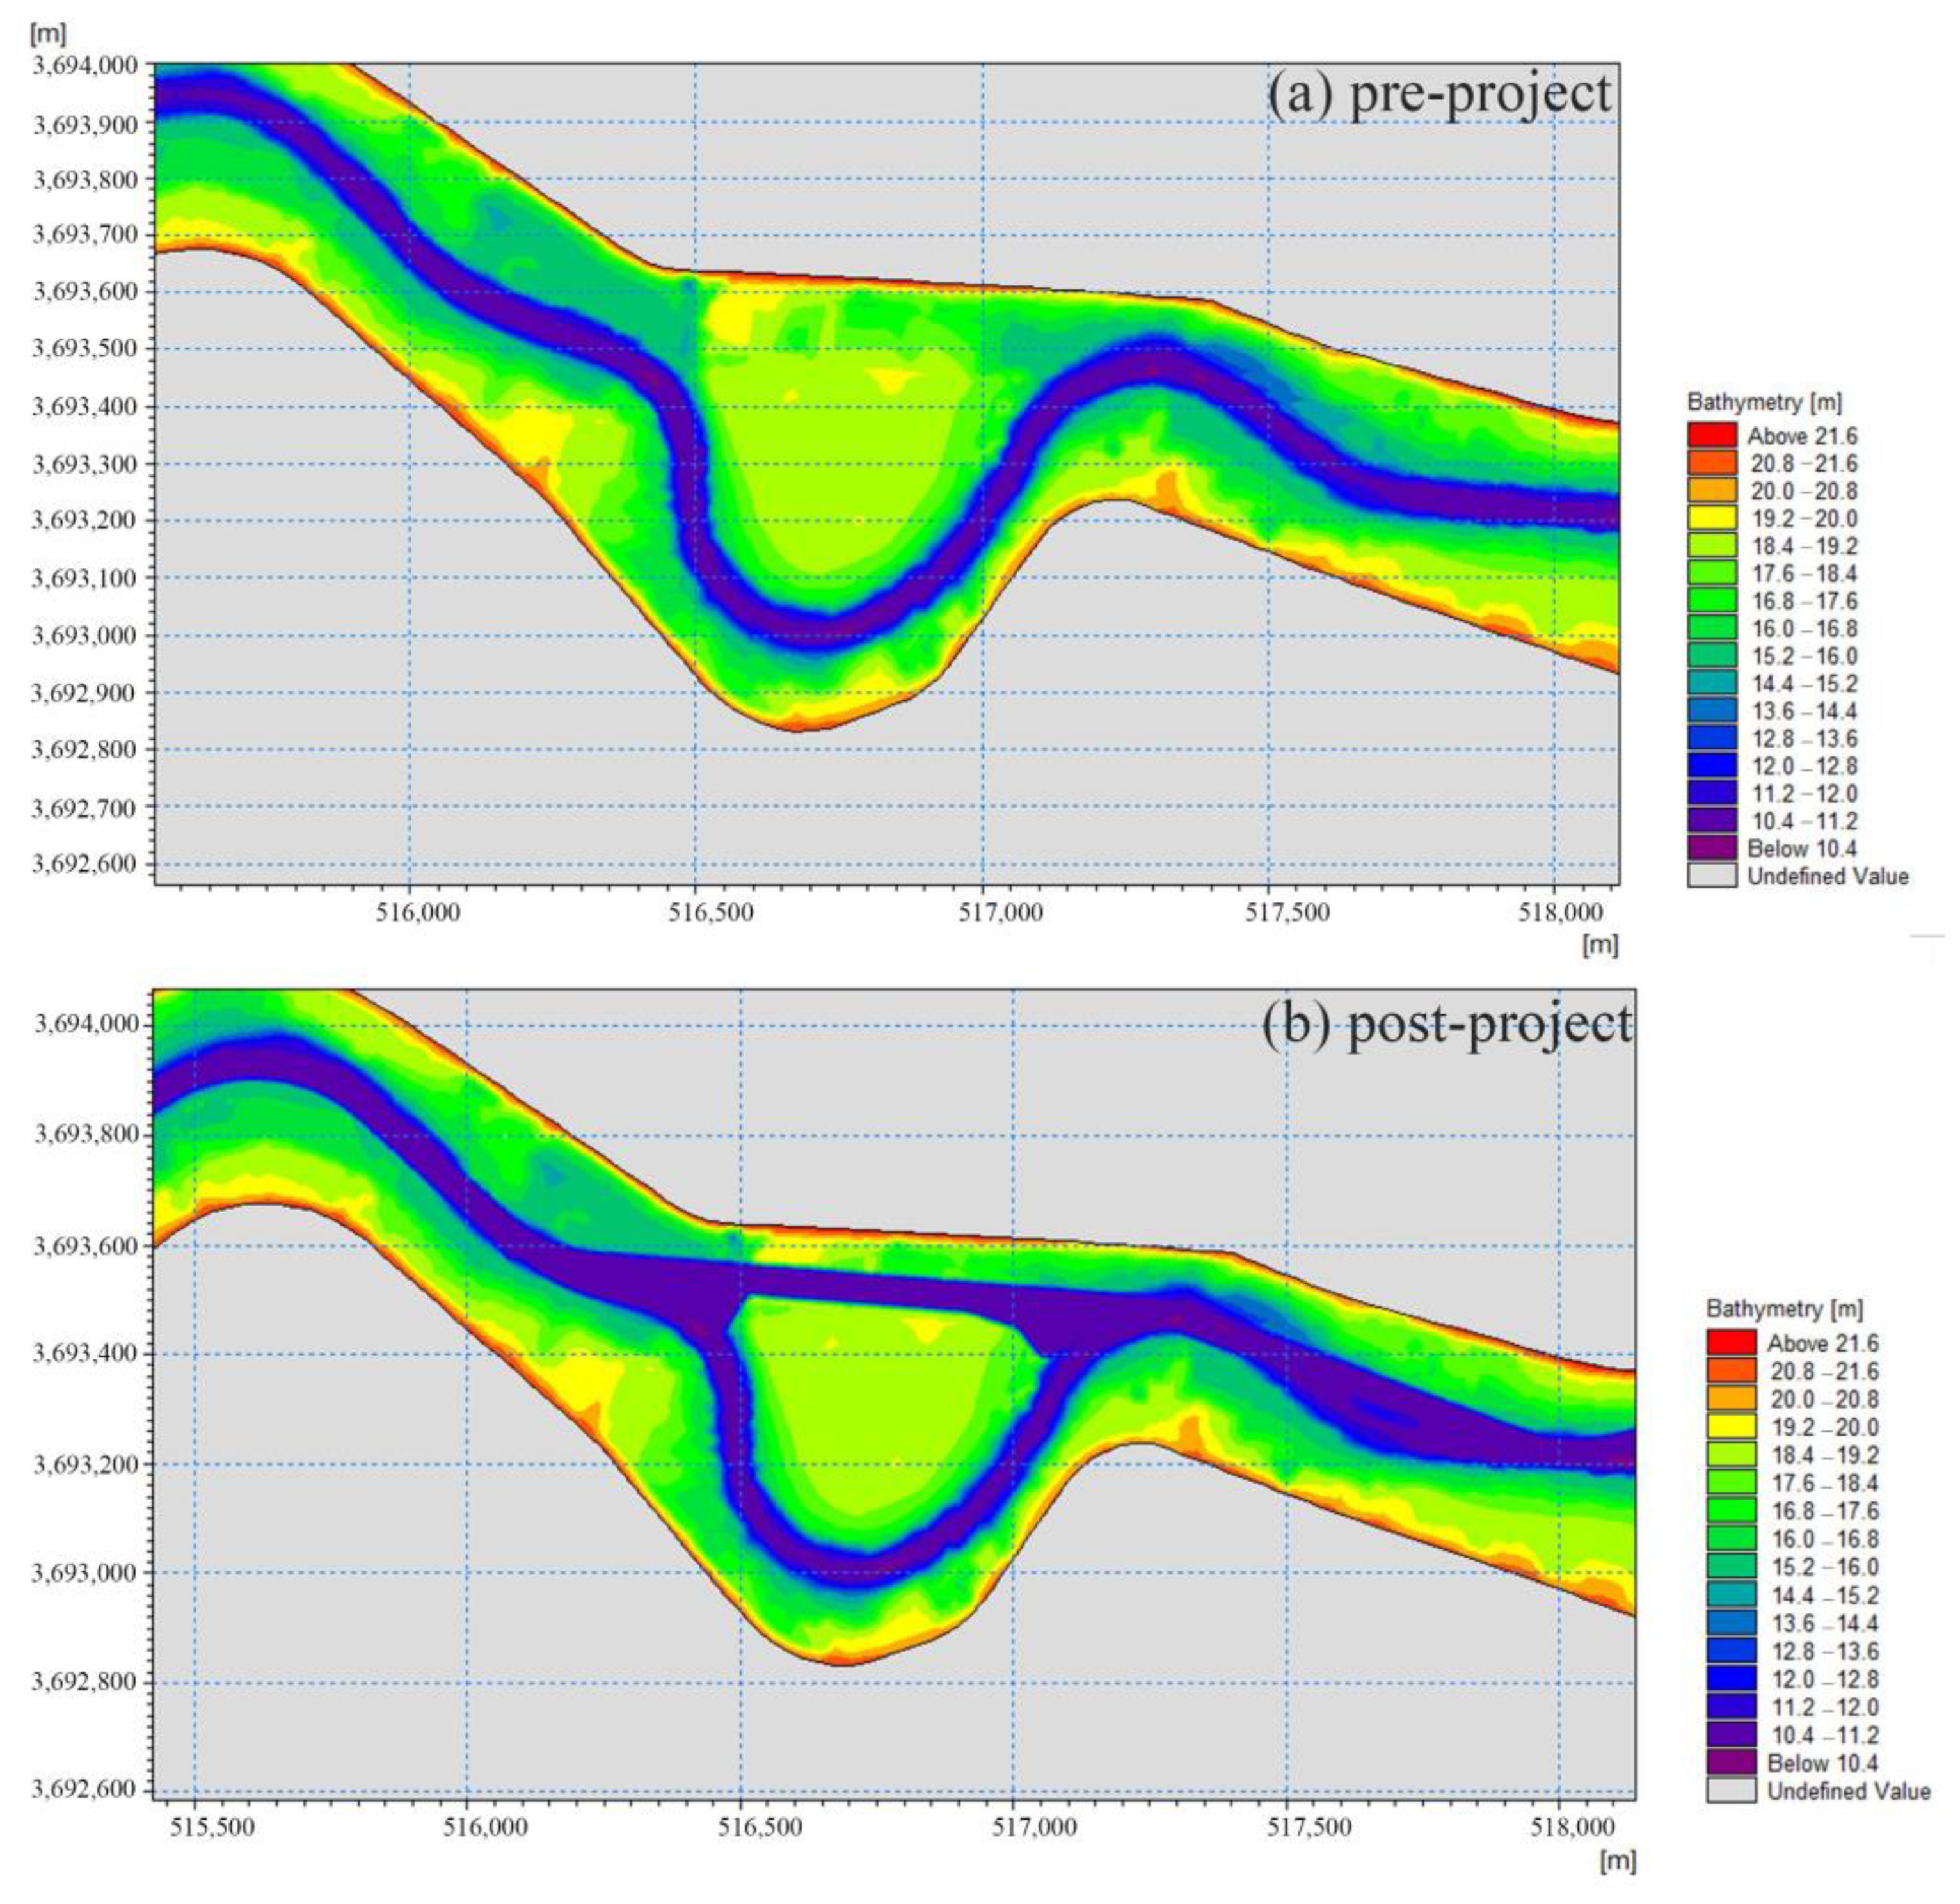
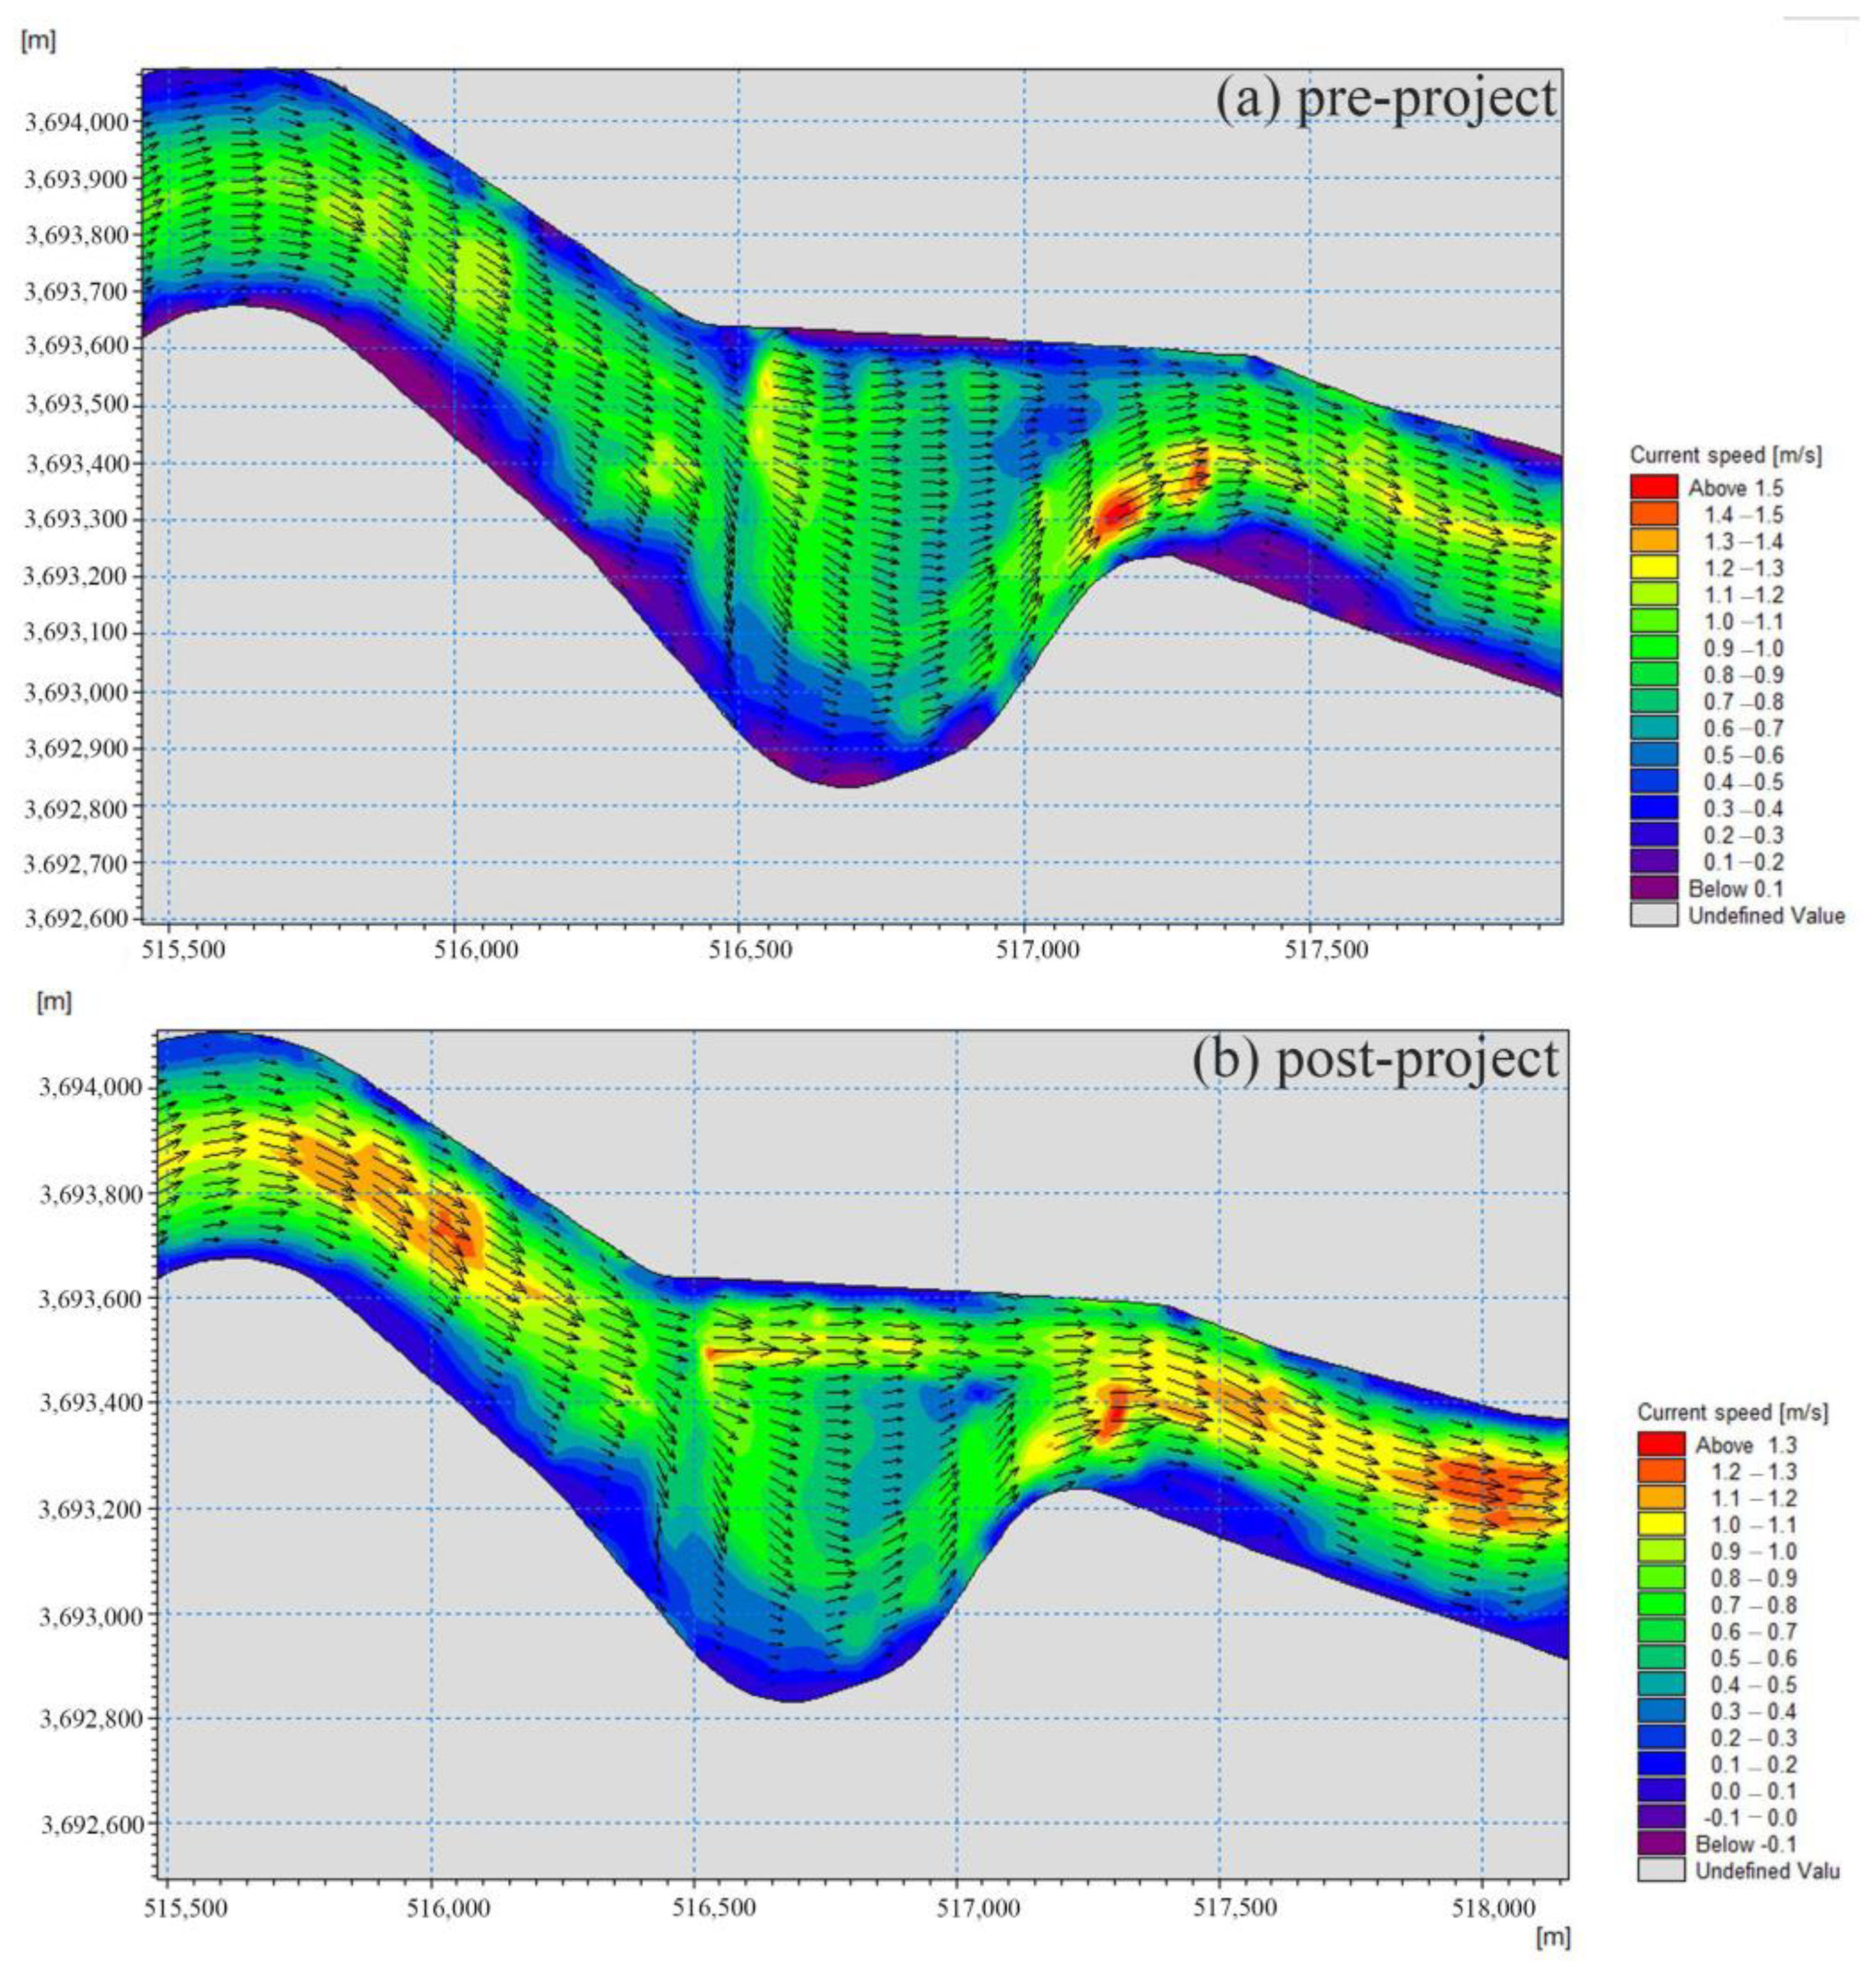
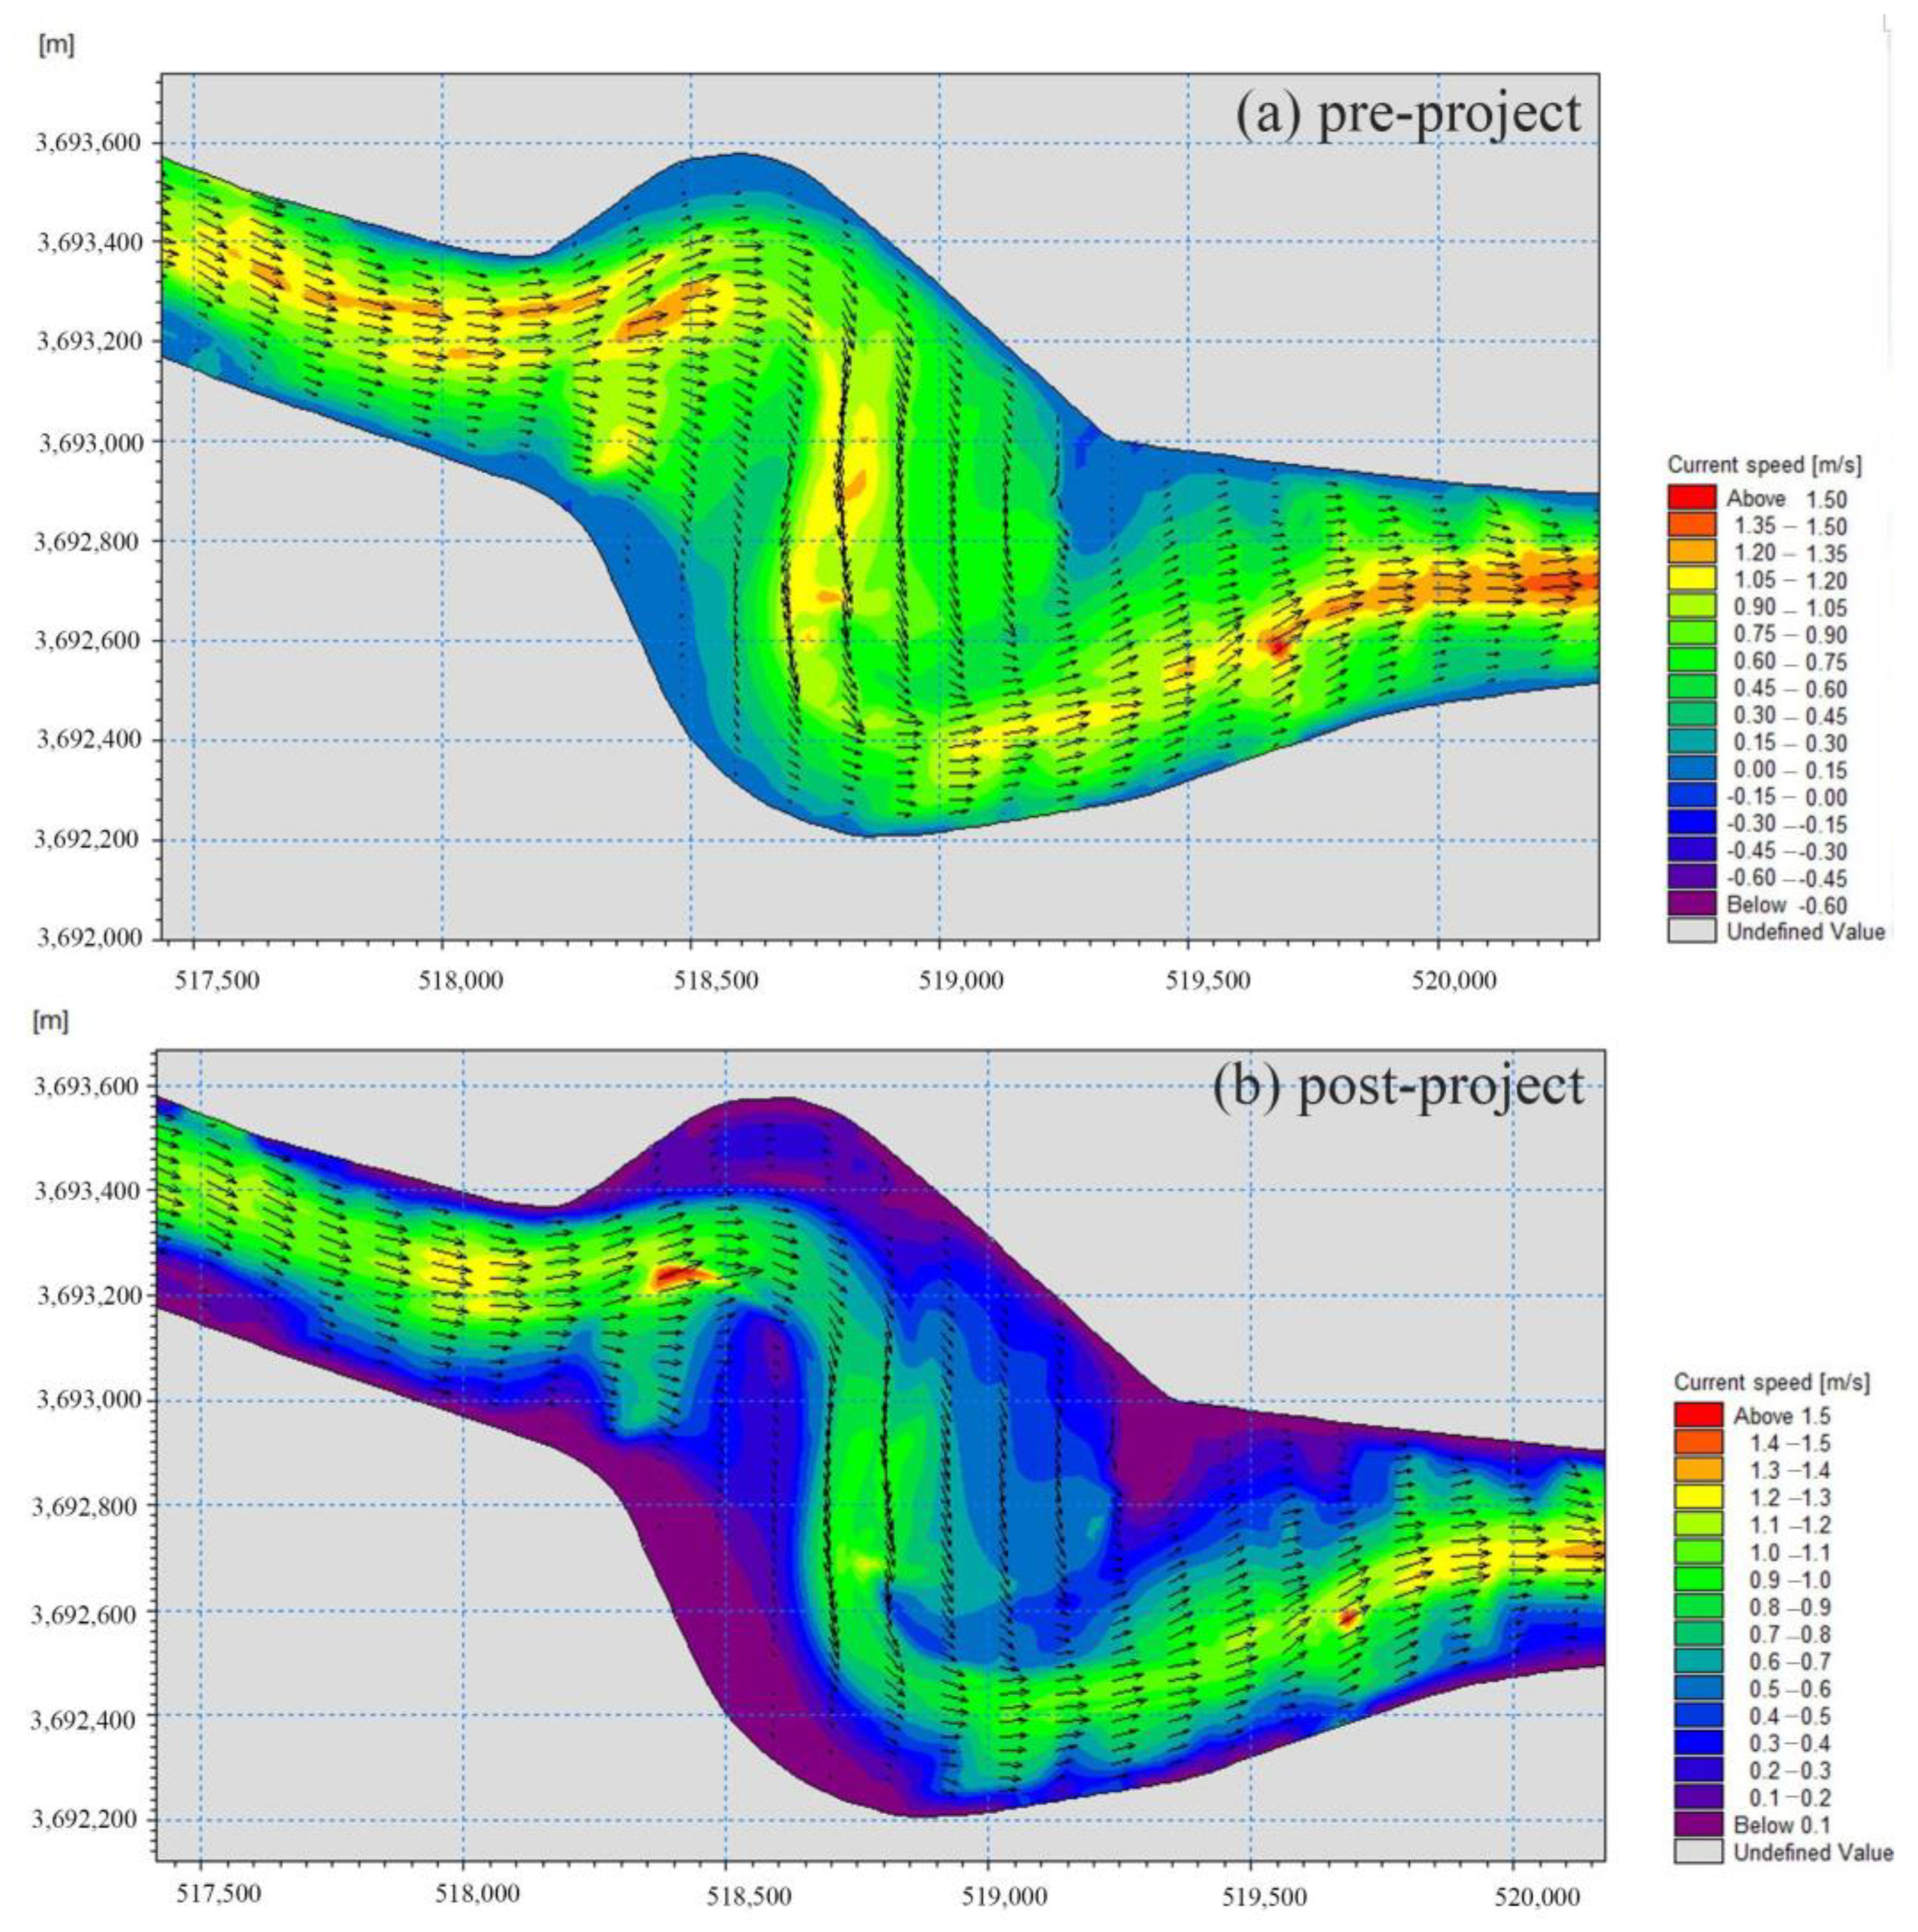
Dredging operations serve as a pivotal technical approach for enhancing navigational capacity and optimizing fluvial morphology. This study focuses on the severely silted left branch at the control section B1, implementing a main channel dredging and widening scheme (Figure 7). Post-dredging configuration formed a 450 m-wide central bar between the left and right branches, preserving a 20 m ecological floodplain along the left bank while utilizing dredged material for ecologically enhanced embankment reinforcement. Hydrodynamic modeling was conducted to analyze pre- and post-project flow velocity distributions, with particular emphasis on quantifying fluvial differentiation effects and bank slope stability risks (Figure 8).
Pre-project numerical modeling identified severe flow asymmetry at the bifurcation node, with the flow distribution ratio between the left and right branches of 0.3:1.0. The right branch served as the main flood discharge channel with the flow velocity of 0.8–1.3 m/s, while the left branch exhibited severely constrained flow capacity. Following implementation, the optimized bed elevation of the left branch became comparable to the right branch, with enhanced cross-sectional regularity, resulting in a revised flow distribution ratio of 0.93:1.0. This alteration propelled the left branch to the forefront as the primary flood discharge channel, accompanied by a substantial 32.6% reduction in the discharge of the right branch. The velocity field exhibited pronounced spatial differentiation, with the velocities of the left branch channel were accelerated from 0.9 to 1.3 m/s (maximum increase of 0.5 m/s), while transverse velocities were increased by 0.24 m/s, intensifying shear stress on the left bank slope. In the right branch, the 60° angular deviation between the bifurcation inlet and the main flow caused a maximum velocity reduction of 0.3 m/s, inducing localized sedimentation risks. Furthermore, the project exerted a profound influence on flood propagation attributes. The realigned channel post-dredging in the left branch reduced flood transit durations, amplified water surface gradient, and triggered a velocity surge of 0.2–0.3 m/s at the bend’s outlet, creating new scouring hotspots. The research substantiated that the dredging project effectively optimized the river’s flow distribution pattern by reshaping bed morphology, elevating the left branch’s flow ratio, and instigating a dual primary channel flood discharge system, thereby enhancing regional flood control capacity. However, long-term monitoring is required to address emerging challenges, including bank erosion trends induced by velocity field restructuring, functional degradation of the right branch, and stability concerns of mid-channel bars.

3.2.3. Impact Analysis of the Shoal Cutting Project on the Hydrological Characteristics

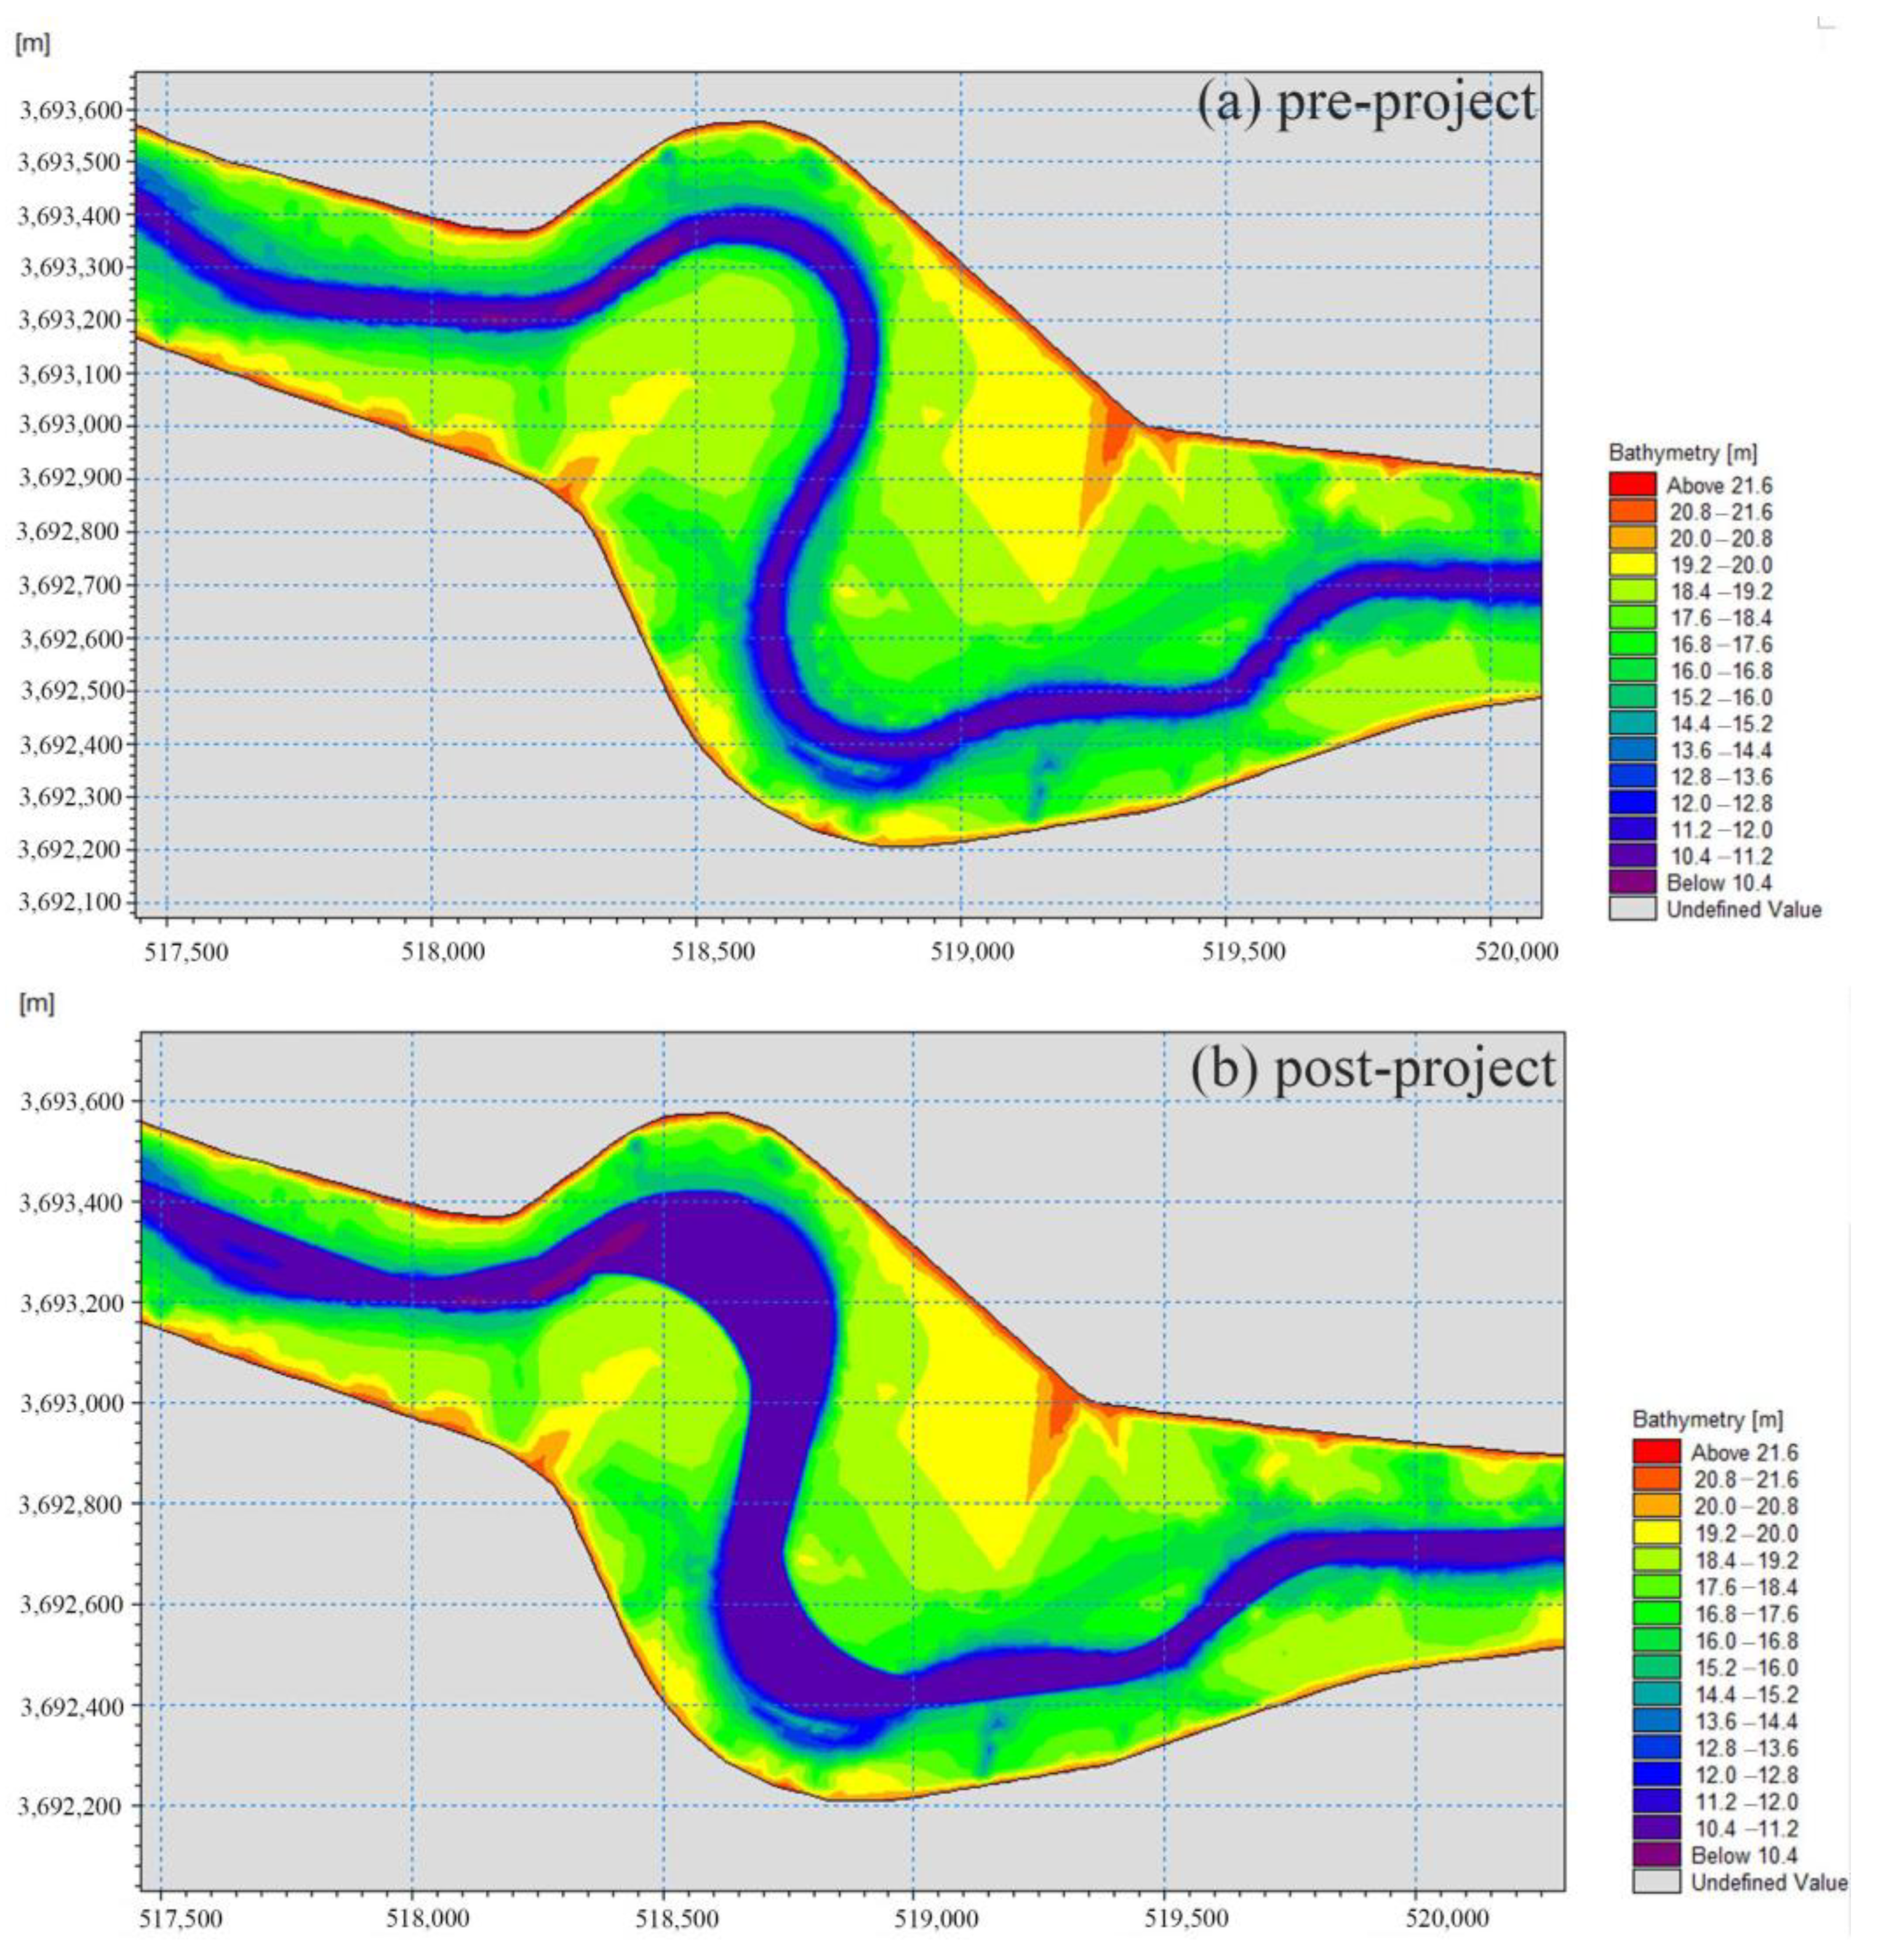
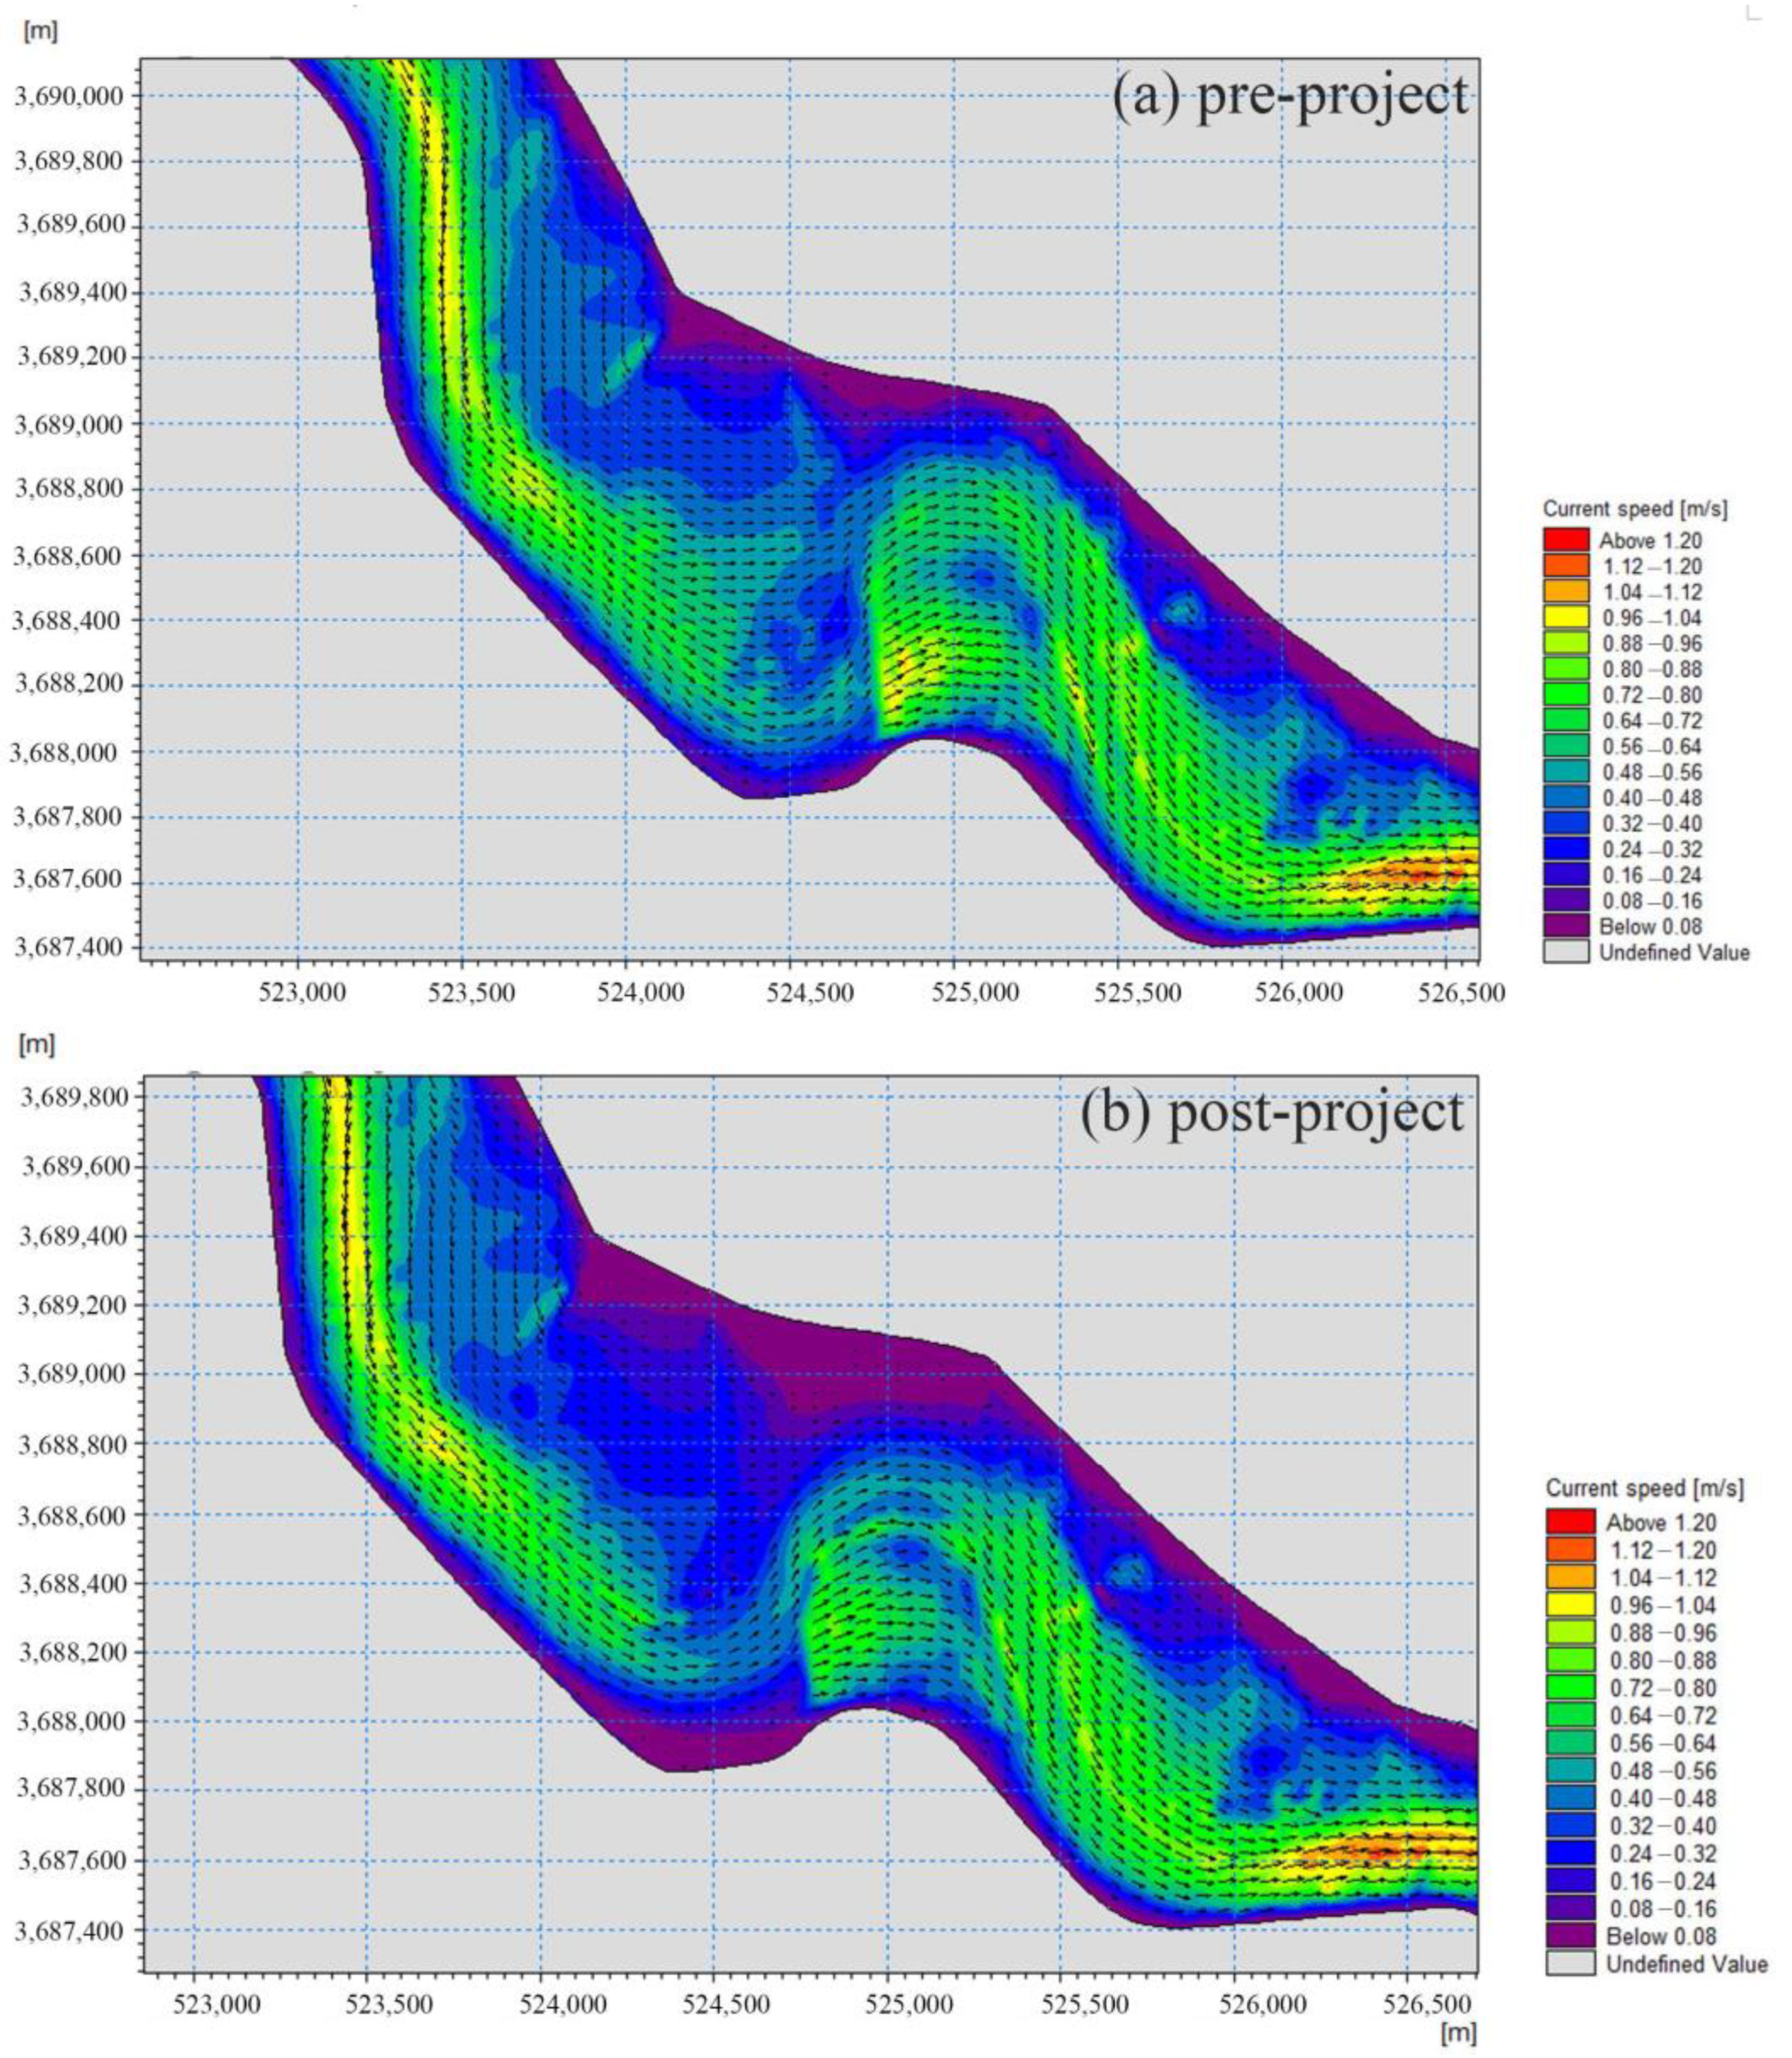
Shoal cutting projects stand as pivotal technical measures for optimizing river regime patterns and enhancing navigation standards. This study focused on two typical river reaches characterized by narrow main channels and insufficient bend radius, implementing a shoal cutting and widening project. By removing convex bank shoals to expand the flood discharge cross-section, the planar morphology and cross-sectional structure of the channel were optimized. The project adopted precision cutting schemes to optimize cross-sectional configurations at two S-shaped bends (S1 and S2), preserving ecological shoal widths while incorporating geotextile concrete revetments (Figure 9 and Figure 10). By hydrodynamic numerical simulations, the study systematically revealed the underlying mechanisms by which shoal cutting modulates flow velocity field restructuring, flow impingement effects, and sediment transport equilibrium (Figure 11 and Figure 12).
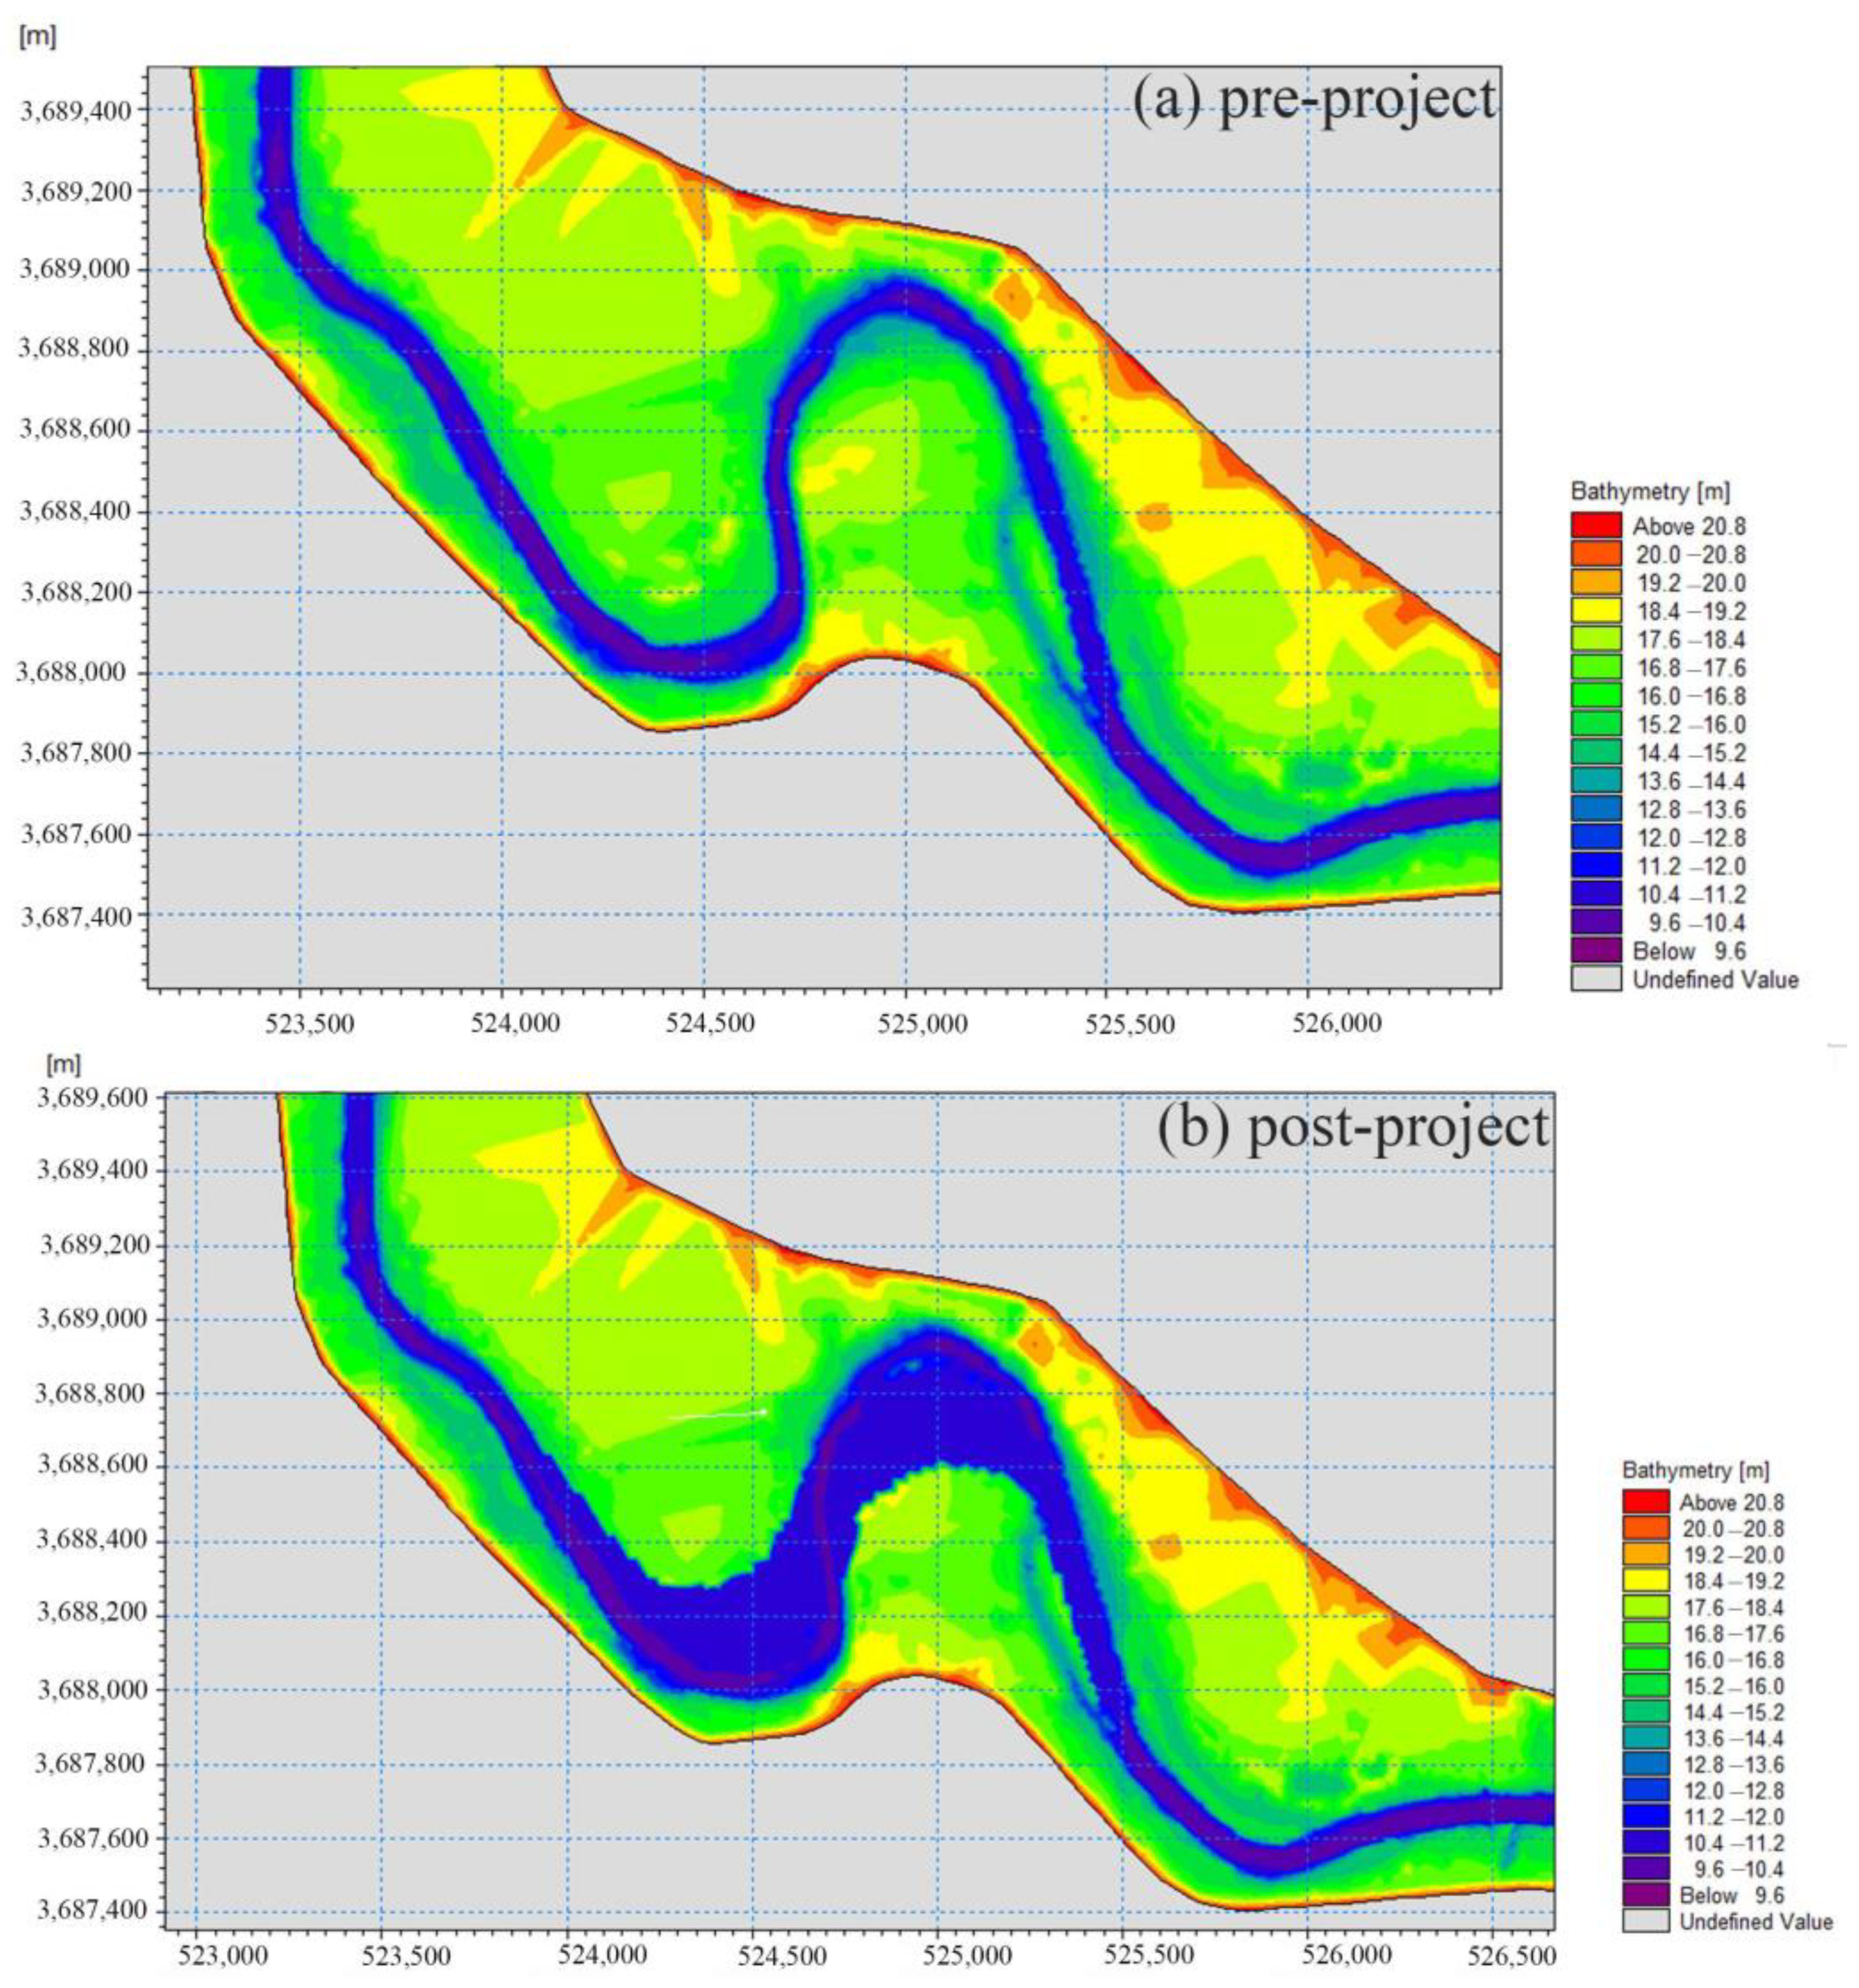
The implementation of shoal cutoff engineering has significantly optimized the hydrodynamic regime of the river channel. Pre-project velocity analysis of the S1 reach demonstrated that main channel velocities ranged between 0.7 and 1.3 m/s, with impact velocities on the concave bank reaching up to 0.7 m/s. These conditions characterized by pronounced lateral velocity gradients generated significant risks of erosion to the bank slopes. However, following the project’s completion, the enlargement of the flood discharge cross-section led to a reduction in main channel velocities to a range of 0.6–1.2 m/s, marking a notable decrease of up to 0.4 m/s in inflow velocities adjacent to the embankment on the concave side. This effectively mitigates the adverse effect of flow impact. Numerical simulations further illuminated these improvements, demonstrating a shift in the mainstream axis toward the convex bank, thereby establishing a new dynamic equilibrium. Consequently, peak shear stresses at the concave bank were significantly diminished. Pre-project simulation of the S2 reach indicated the main channel velocities of 0.6–1.2 m/s with floodplain velocities of 0–0.6 m/s, while the post-project velocities decreased to 0.5–1.04 m/s in the main channel and 0–0.5 m/s on floodplains, with a maximum reduction of 0.2 m/s observed near the concave bank dike. A key aspect of the project involved increasing the bend radius from 210 m to 330 m. This adjustment not only curtailed the time required for floodwaters to traverse the bend but also lessened the water surface gradient and further mitigated the scouring potential induced by rapid flows along bendway sections, thereby safeguarding the integrity of riverbank slopes.
The project concurrently induced hydrological adjustments with cross-sectional average velocities decreased by 12–15%, thereby reducing sediment transport capacity. However, given the low sediment load of the Hui River, bed deposition thickness remains well within manageable limits. Notably, the preservation of floodplain widths on the convex bank had formed natural energy dissipation zones, which had steadily improved bank stability coefficients, coupled with 1:3.5 ecological slope protection measures. The research confirmed that the cut-off projects achieved the synergistic enhancements in sediment regulation and bank stability through cross-sectional expansion, flow alignment optimization, and bank reinforcement. The concave bank erosion risks were reduced by the shoal cutting project of the S1 and S2 reaches. This validates the effectiveness of the “convex bank cutting, concave bank stabilization” governance model. Although velocity reductions may induce localized sedimentation, the river’s low-sediment characteristics ensure that any resultant scour-deposition adjustments remain manageable.

4. Discussion

The impacts of the channel regulation project on the hydrological characteristics of the river were systematically evaluated using the two-dimensional river flow numerical model, revealing multi-dimensional alterations to fluvial processes across five critical domains as follows.
(1)
Impact on the river water level
The simulation results indicated a generalized water level reduction of 1–3 cm along the entire waterway, with the maximum drop in water levels reaching 26 cm at each control section. The water levels in dry years exhibited higher elevations compared to wet-year conditions, while the reduction gradients decreased progressively from upstream to downstream. River excavation and dredging enhanced floodway capacity, effectively lowering waterlogging stages. However, the reduction in water levels may negatively impact river level monitoring accuracy, particularly during low-flow periods.
(2)
Impact on river water flow velocity
Comparing the results of pre- and post-project, the average channel velocity decreased with noticeable increases in certain areas and significant changes in the velocity distribution of measurement sections at some stations. Although the dredging project optimized overall navigation conditions, it also substantially altered the velocity distribution in local reaches, leading to an increase in main channel velocities post-dredging, but with the erosion risk on local bank slopes. The river flow velocities near the anchorage had been significantly decreased, necessitating attention to siltation in this section. Furthermore, changes in river velocity affect the monitoring environment for river velocity.
(3)
Impact on river regime
The channel regulation project’s dredging primarily followed the existing deep channel of the river, only dredging beaches and the left branch where local bend sections do not meet requirements. The construction had minimal influence on the river regime of the entire river section but significantly impacts the dredging curved river section and shoal cutting sections. The results revealed post-construction flow attenuation in the original main channel along the shoal cutting section, with decreasing discharge and velocity. This hydraulic adjustment triggered a new stable state in the local channel trend and shape.
(4)
Influence on sediment movement
Although sediment movement had not been simulated in the research, the simulation results suggested that changes in water flow altered the sediment transport balance of rivers. Dredging projects directly remove bed sediment, causing washing or silting downstream due to velocity changes. The anchorage construction and beach cutting project resulted in lower riverbed cutting, possibly leading to siltation upstream.
(5)
Impact on the river ecological environment
Changes in flow velocity and water depth caused by the regulation project may affect the migration and spawning environments of river fish, while alterations in sediment movement disrupt the habitats of benthic organisms. Additionally, hardened bank protection projects reduce waterfront vegetation and weaken ecological corridor functions.
In response to these aforementioned impacts, a series of preventive and remedial measures are proposed, including:
(1)
Optimizing engineering design
In order to balance the flow and sediment distribution and reduce local erosion or siltation, the layout of engineering facilities needs to be further optimized, and the dredging area needs to be properly planned based on numerical simulation results. The natural meandering path of the river should be maintained to avoid over-channelization. Ecological revetment techniques, such as vegetated slopes and gabion meshes combined with pebbles, should replace traditional rigid revetments to enhance the permeability of riverbanks. Ecological buffer zones and constructed wetlands should be integrated with revetment projects to enhance the self-purification capacity of water bodies. Additionally, a composite model for long river reaches can be adopted, integrating physical and mathematical models to address complex three-dimensional water-sediment problems.
(2)
Improving hydrological dynamic monitoring conditions
The simulation results showed that the flow characteristics had been inevitably changed due to the waterway regulation project. Therefore, it is necessary to further strengthen the monitoring of water level, flow rate, sediment, and ecology to ensure continuous monitoring of the river. In response to the significant impact of project implementation on water level monitoring, adjustments to the water level monitoring plan are required. During both the construction period and post-project period, the monitoring frequency needs to be increased from the original once-daily manual observation to three daily manual water level readings and calibrated with self-recording water levels. A smart waterway system can also be constructed by integrating IoT sensors to monitor water level, flow velocity, sediment, and other data in real time, leveraging big data analysis to optimize scheduling. Additionally, smart water quality monitoring devices can be adopted to detect parameters such as pH levels, dissolved oxygen, and turbidity in real time and support pollutant source tracing analysis.
(3)
Ecological protection and restoration
During the waterway construction process, it is inevitable to exert certain impacts on the ecological environment, and relevant ecological restoration measures need to be implemented to mitigate and compensate for the associated impacts. First, the slope must be thoroughly cleaned, and the surface soil and vegetation should be restored. The spray seeding method can be employed for large-scale vegetation rehabilitation. It is crucial to select diverse native species from the local ecosystem to prevent low survival rates caused by excessive species uniformity. Considering the impacts of engineering projects on fish spawning, artificial fish nests can be deployed in shallow water areas to create breeding conditions. By utilizing floating frames that adapt to water level fluctuations, these structures provide spawning habitats, thereby achieving the goal of supporting aquatic species reproduction. Additionally, historical data can be integrated to analyze the evolutionary patterns of regional aquatic organisms. By creating suitable habitats for aquatic species in key river sections, this method accelerates fish stock recovery and promotes the restoration of benthic communities.
This study primarily conducted holistic hydrodynamic numerical simulations of the Hui River navigation channel before and after its regulation, analyzing changes in hydrodynamic effects post-project implementation. However, localized impacts of riverine structures such as bridges and tunnels on flow dynamics were not considered. Due to a lack of sediment data, a qualitative analysis of sediment erosion and deposition was conducted based on flow velocity variations, which may lack support from quantitative sediment simulation data. While the two-dimensional hydrodynamic model—widely adopted for its high precision, short computation time, and low cost—provides practical advantages, it inherently struggles to fully replicate real-world topography and flow dynamics. Furthermore, the selection of computational parameters may introduce certain errors. Future work will integrate a sediment transport module to explore causal relationships between flow velocity changes and sediment responses and combine machine learning with physical experiments to conduct a more comprehensive investigation into the impacts of the river regulation project.

5. Conclusions

In this study, a two-dimensional hydrodynamic numerical model was established to simulate the influence of waterway regulation engineering on the hydrological characteristics of river channels. The numerical model proficiently simulated the alterations in river hydrological characteristics post-implementation of the project, showcasing remarkable strengths in hydrological research. Numerical simulation results indicated that the waterway regulation project, through measures such as anchorage zone construction, dredging, and bank cutting, had achieved multiple objectives, including expanding the flood discharge cross-section, lowering river water levels, as well as optimizing flow velocity distribution and channel alignment. These interventions concentrated flow velocity in the main channel, aligned the dominant current with the designed waterway, reduced hydraulic resistance, and enhanced both flood conveyance capacity and long-term channel stability. However, the project had also induced localized scouring and sedimentation issues. The bank cutting project posed erosion risks and potential bank slope instability due to intensified scouring on opposite banks. Concurrently, alterations in water levels and flow patterns had perturbed the benthic habitat environment and necessitated improvements to existing hydrological monitoring conditions. To mitigate the adverse impacts caused by the aforementioned project, it is possible to further rationally plan the dredging scope to avoid excessive canalization, improve the hydrological monitoring networks for water levels, flow velocities, and sediments dynamic, and also implement ecological restoration measures such as nature-based revetments, riparian wetland reconstruction, and fish passage installations to safeguard aquatic habitats.
In conclusion, while the waterway regulation project effectively improved navigational conditions, it concurrently triggered localized hydrological and ecological problems. By optimizing the design of the regulation project, improving hydrological monitoring conditions, and enhancing ecological conservation, these adverse impacts can be effectively prevented and mitigated, thereby achieving sustainable development in river management. Fundamentally, this research elucidated how natural systems respond to anthropogenic interventions, providing theoretical foundations for balancing engineering benefits with the dynamic equilibrium of river ecosystems.

Author Contributions

Conceptualization, X.L. and P.G.; methodology, C.Q.; software, D.W.; validation, Z.Y., C.J. and H.X.; formal analysis, J.R.; investigation, F.T.; resources, Y.W.; data curation, C.Q.; writing—original draft preparation, D.W.; writing—review and editing, X.L., J.R., P.G. and F.T.; visualization, Z.Y.; supervision, P.G. and Y.W.; project administration, C.J. and H.X.; funding acquisition, X.L., P.G. and Y.W. All authors have read and agreed to the published version of the manuscript.

Funding

This research was funded by the National Natural Science Foundation of China (42107082), the Fundamental Research Funds for the Central Universities (JZ2023HGQA0094; JZ2023HGTA0193), and the Anhui Provincial Natural Science Foundation (2308085QE190; 2108085QD166).

Data Availability Statement

Data will be made available upon request.

Conflicts of Interest

Authors Dasheng Wang and Zhenxing Yao were employed by the company Anhui Transportation Survey and Design Institute Co., Ltd. The remaining authors declare that the research was conducted in the absence of any commercial or financial relationships that could be construed as a potential conflict of interest.

References

  1. Geoffrey, E.P.; Angela, M.G. Dams and geomorphology: Research progress and future directions. Geomorphology 2004, 71, 27–47. [Google Scholar]
  2. Ibisate, A.; Díaz, E.; Ollero, A.; Acín, V.; Granado, D. Channel response to multiple damming in a meandering river, middle and lower Aragón River (Spain). Hydrobiologia 2013, 712, 5–23. [Google Scholar] [CrossRef]
  3. Yuan, W.H.; Yin, D.W.; Finlayson, B.; Chen, Z.Y. Assessing the potential for change in the middle Yangtze River channel following impoundment of the Three Gorges Dam. Geomorphology 2012, 147, 27–34. [Google Scholar] [CrossRef]
  4. Lee, J.S.; Julien, P.Y. Downstream Hydraulic Geometry of Alluvial Channels. J. Hydraul. Eng. 2006, 132, 1347–1352. [Google Scholar] [CrossRef]
  5. Zhou, R.S.; Huang, Z.X.; Wang, T. Comparison of Channel Improvement Schemes for the Mangniushao Shoal Reach of the Songhua River. Port Waterw. Eng. 2024, 4, 119–125+182. [Google Scholar]
  6. Liang, W.; Wang, J.; Leung, C.; Goh, S.; Sang, S. Opportunities and challenges for gas coproduction from coal measure gas reservoirs with coal-shale-tight sandstone layers: A review. Deep Undergr. Sci. Eng. 2025, 4, 83–104. [Google Scholar] [CrossRef]
  7. Pannone, M.; De Vincenzo, A. On the Prediction of the Characteristic Times of River Meander Cutoff Sequence: Theoretical Model and Comparison with Laboratory and Field Observations. Water Resour. Res. 2022, 58, e2021WR031661. [Google Scholar] [CrossRef]
  8. Yang, Y.P.; Li, M.; Liu, W.L. Relationship between the Evolution of Bars and Channels in the Jingjiang Reach of the Yangtze River and the Improvement of Navigation Depth Resources. Adv. Water Sci. 2022, 33, 240–252. [Google Scholar]
  9. Korpak, J. Assessment of Changes in Channel Morphology in a Mountain River Regulated Using Grade Control Structures. J. Ecol. Eng. 2020, 21, 163–176. [Google Scholar] [CrossRef]
  10. Han, Z.; Xie, H.; Li, H.; Li, W.; Wen, X.; Xie, M. Morphological Evolution of the Lingding Channel in the Pearl River Estuary over the Last Decades. J. Coast. Res. 2020, 37, 104–112. [Google Scholar] [CrossRef]
  11. Shiono, K.; Chan, T.L.; Spooner, J.; Rameshwaran, P.; Chandler, J.H. The effect of floodplain roughness on flow structures, bedforms and sediment transport rates in meandering channels with overbank flows: Part II. J. Hydraul. Res. 2009, 47, 20–28. [Google Scholar] [CrossRef]
  12. Rui, S.; Zhang, H.; Xu, H.; Zha, X.; Xu, M.; Shen, K. Seabed structures and foundations related to deep-sea resource development: A review based on design and research. Deep Undergr. Sci. Eng. 2024, 3, 131–148. [Google Scholar] [CrossRef]
  13. Li, S.X. Channel regulation engineering plan for Reach in Xijiang River. IOP Conf. Ser. Earth Environ. Sci. 2021, 643, 012119. [Google Scholar] [CrossRef]
  14. Czajka, A.; Nádudvari, Á. Anthropogenic influences on the morphodynamics of the upper Odra channel. Environ. Socio-Econ. Stud. 2016, 4, 43–52. [Google Scholar] [CrossRef]
  15. Xia, J.Q.; Zong, Q.L.; Deng, S.S.; Xu, Q.X.; Lu, J.Y. Seasonal variations in composite riverbank stability in the Lower Jingjiang Reach, China. J. Hydrol. 2014, 519, 3664–3673. [Google Scholar] [CrossRef]
  16. Zhong, Y.Z.; Tong, R. Research on the Construction of a Three-Dimensional Hydrodynamic Model for Complex Mountainous River Channels and Estimation of Flash Flood Discharge. Water Resour. Hydropower Eng. 2024, 55, 497–501. [Google Scholar]
  17. Millar, R.G. Theoretical regime equations for mobile gravel-bed rivers with stable banks. Geomorphology 2004, 64, 207–220. [Google Scholar] [CrossRef]
  18. Xu, F. Research on Waterway Regulation Technology—Taking the Channel Regulation of the Downstream Section of Baishi kiln in Beijiang River as an Example. Master’s Thesis, Hubei University of Technology, Wuhan, China, 2017. [Google Scholar]
  19. Huang, Y.; Zhang, J.B.; Zhou, Q.; Hou, J. Effect of newly-developed channel on water and sediment transport in curved and branched rivers in mountainous areas. Port Waterw. Eng. 2021, 9, 93–100. [Google Scholar]
  20. Wang, H.F. Gabion Riprap Technology for Bank Protection Construction of Important Flood Storage Area in Huai River Basin. Henan Water Conserv. S.-N. Water Divers. 2024, 53, 32–33. [Google Scholar]
  21. Chen, K.F.; Lu, P.D.; Wang, N.R. Characteristics and Causes of Re-siltation of Estuarine Bar Channels Under the Influence of Channel Improvement Projects: A Case Study of the Sheyang Port Channel. Adv. Water Sci. 2017, 28, 240–248. [Google Scholar]
  22. Banasiak, R. Large-Scale Two-Dimensional Cascade Modeling of the Odra River for Flood Hazard Management. Water 2024, 16, 20. [Google Scholar] [CrossRef]
  23. Kaczmarek, L.M.; Sawczynski, S.Z.; Biegowski, J. An Equilibrium Transport Formula for Modeling Sedimenta-tion of Dredged Channels. Coast. Eng. J. 2017, 59, 1–35. [Google Scholar] [CrossRef]
  24. Leedertse, J.J.; Gritton, E.C.; Liu, S.K. A water-quality simulation model for well-mixed estuaries and coastal seas. In The Rand Corporation Technical Report R-708-NYC; RAND: Santa Monica, CA, USA, 1971; Volume 2, p. 43. [Google Scholar]
  25. Syed, Z.H.; Choi, G.; Byeon, S. A Numerical Approach to Predict Water Levels in Ungauged Regions—Case Study of the Meghna River Estuary, Bangladesh. Water 2018, 10, 110. [Google Scholar] [CrossRef]
  26. Salman, S.; Abolfazl, S.; Bahram, S.; Sayed, M.B. Modeling Spatial Pattern of Salinity Using MIKE21 and Prin-cipal Component Analysis Technique in Urmia Lake. Curr. World Environ. 2015, 10, 626–633. [Google Scholar]
  27. De, S.G.; Therrien, R.; Refsgaard, J.C. Simulating seasonal variations of tile drainage discharge in an agricultural catchment. Water Resour. Res. 2017, 53, 3896–3920. [Google Scholar]
  28. Gao, Y.; Li, F.P.; Mao, L.C.; Yan, N.X.; Peng, C.K.; Tao, H. Simulation on water quality of reservoir at con-struction phase by pollutant release from oxidation of waste rocks rich S and Fe. Environ. Technol. Innov. 2022, 28, 102860. [Google Scholar] [CrossRef]
  29. Li, G.; Zhu, H.J.; Hong, F.Z.; Wei, W.; Jiang, S.; Zhang, K.Y.; Si, Y.H.; Hui, M. A combined hydrodynamic model and deep learning method to predict water level in ungauged rivers. J. Hydrol. 2023, 625, 130025. [Google Scholar] [CrossRef]
  30. Zhang, K.C.; Li, Q.J.; Zhang, J.; Shi, H.Y.; Yu, J.; Guo, X.C.; Du, Y.G. Simulation and Analysis of Back Siltation in a Navigation Channel Using MIKE 21. J. Ocean. Univ. China 2022, 21, 893–902. [Google Scholar] [CrossRef]
  31. Ramos, H.C.; Besharat, M.C. Urban flood risk and economic viability analyses of a smart sustainable drainage system. Sustainability 2021, 13, 13889. [Google Scholar] [CrossRef]
  32. Wang, M. Research on Remediation Technology of Hekuantan Rapids Group in Lancang River. Master’s Thesis, Chongqing Jiaotong University, Chongqing, China, 2019. [Google Scholar]
  33. Ni, Z.H.; Kong, X.Y.; Zhang, X.J. Calculation and analysis of channel improvement scheme in Zhushitan reservoir area of Minjiang river. Port Waterw. Eng. 2015, 9, 112–116+137. [Google Scholar]
  34. Surendra, K.M.; Vijay, P.S. Role of dimensionless numbers in wave analysis. Hydrol. Process. 2003, 17, 651–669. [Google Scholar]
  35. Dong, X.J.; Liu, X.; Dong, Z. Numerical Simulation of Rainfall Runoff in the Tai-Dong River Basin. Yangtze River 2021, 52, 77–80. [Google Scholar]
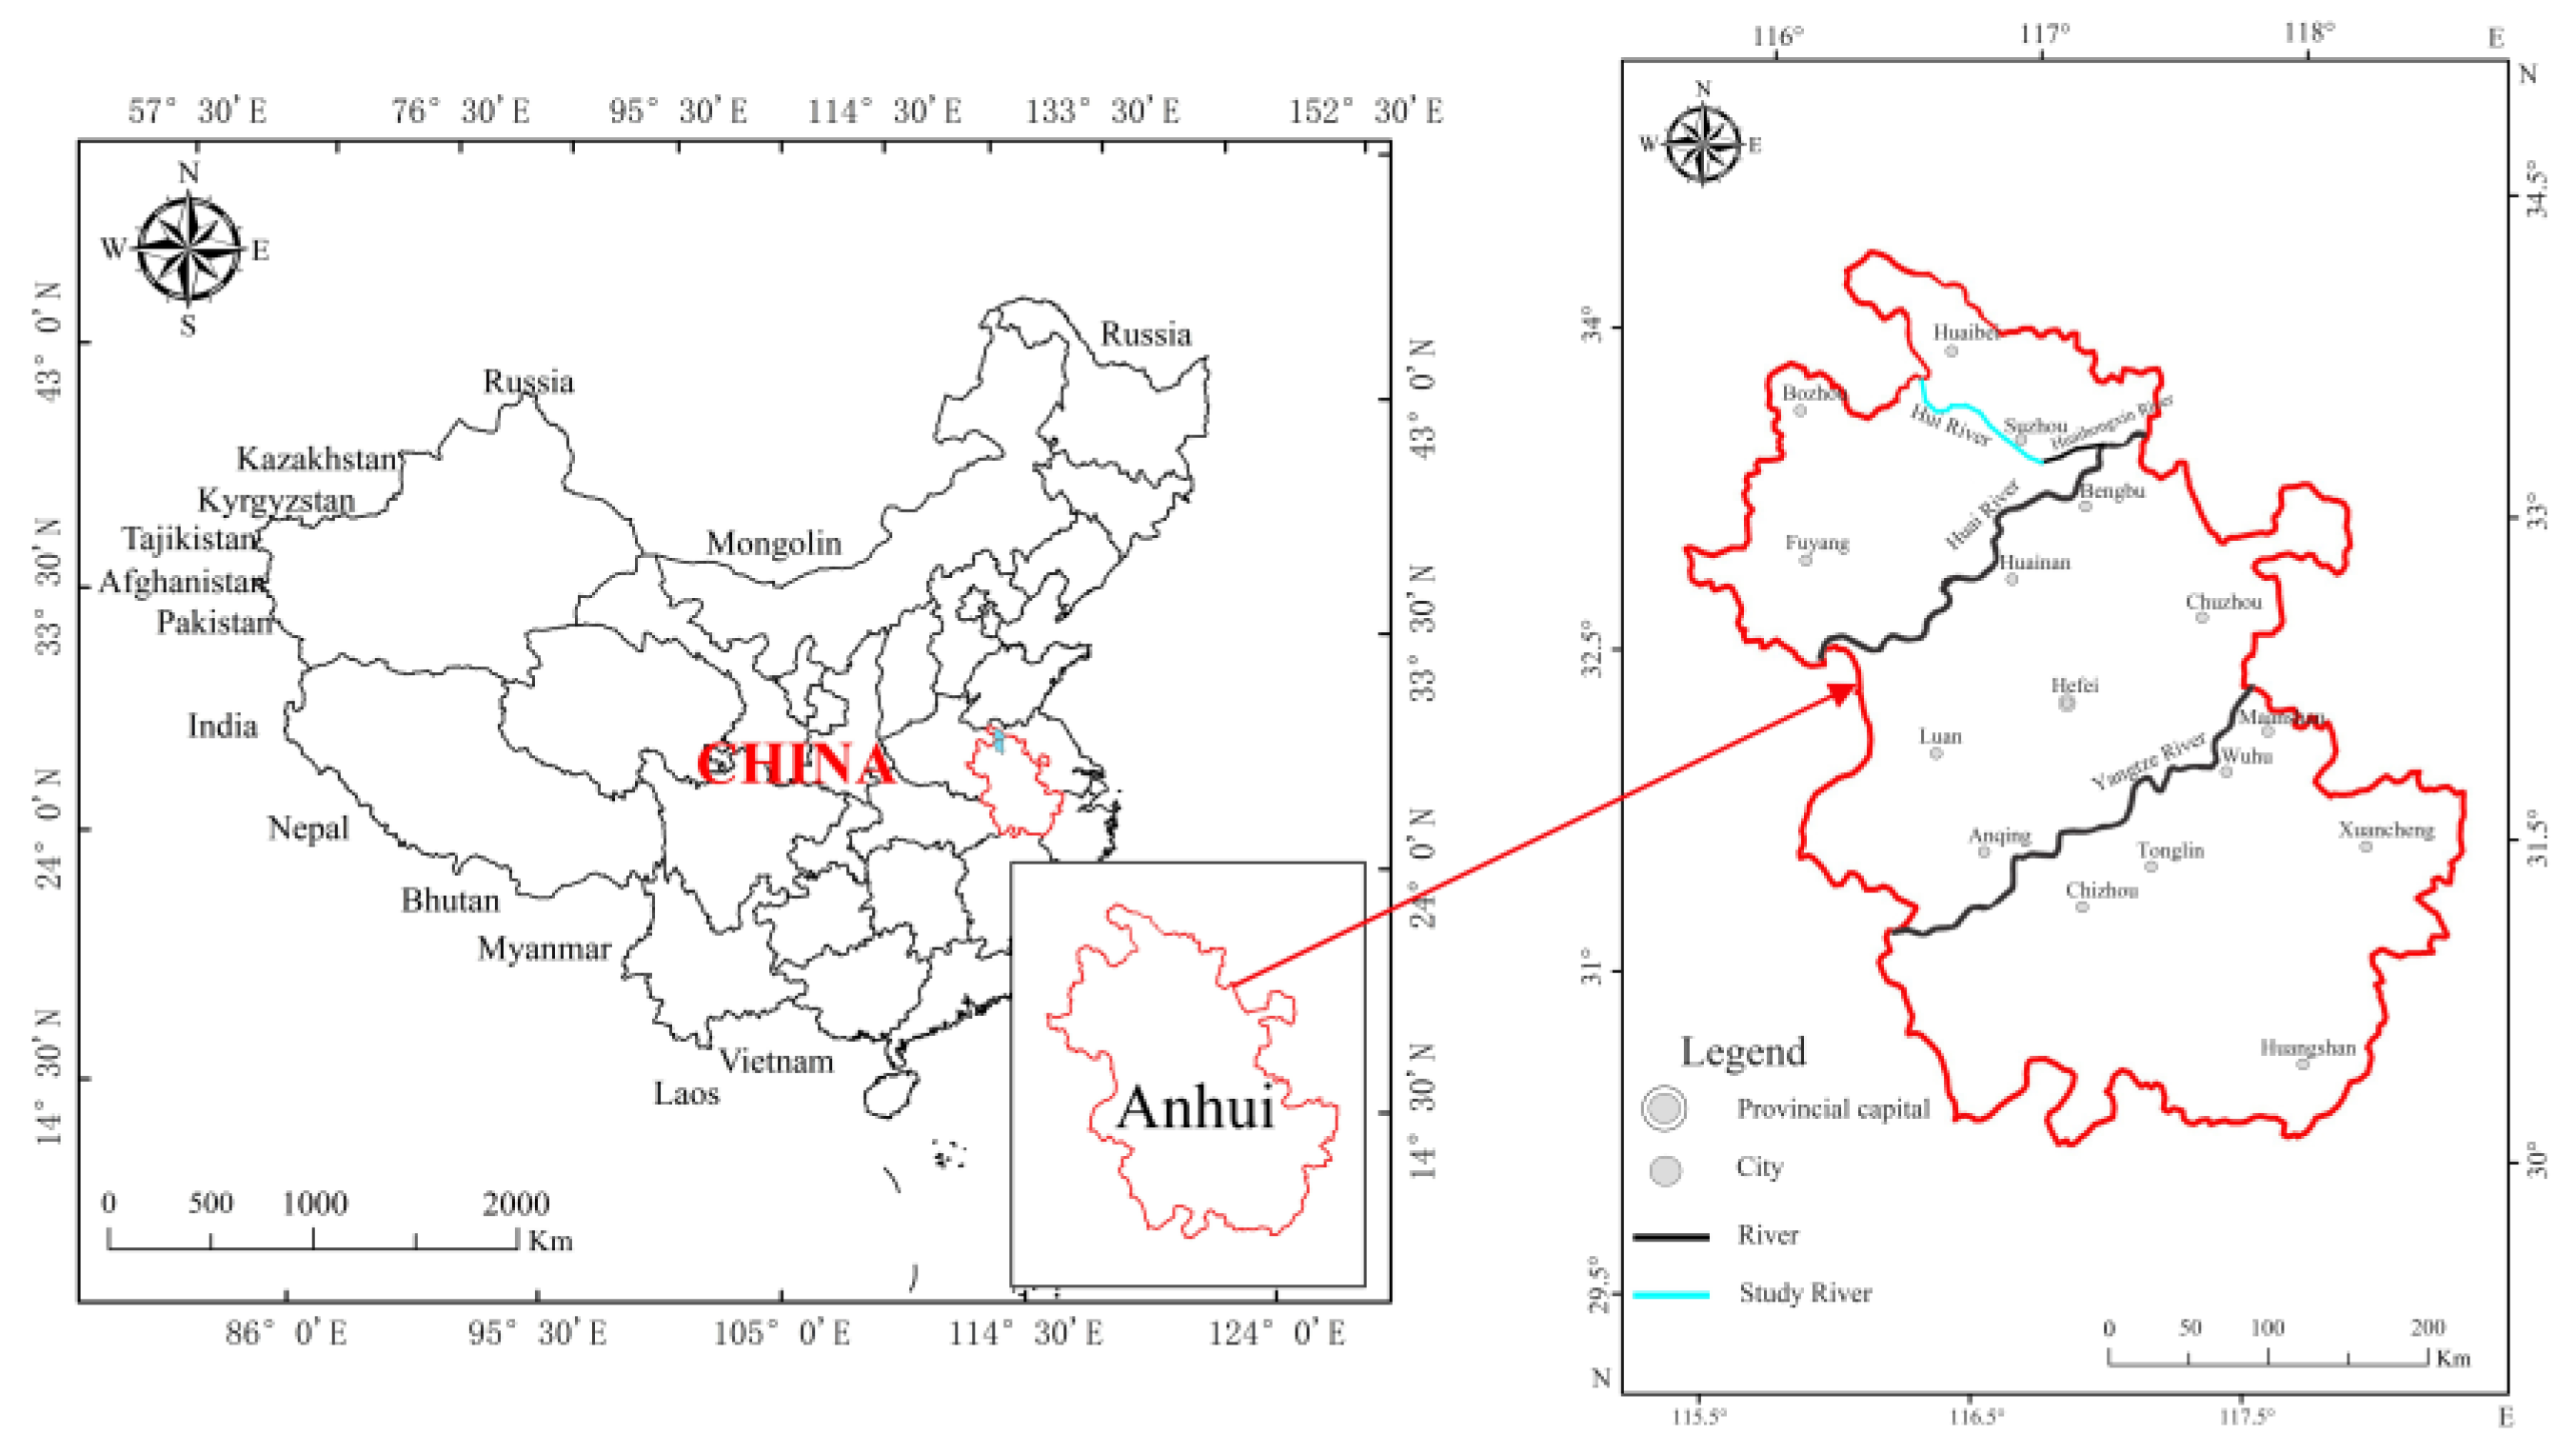
Figure 1. Geographical location map of the waterway regulation project.
Water 17 01261 g001
Figure 2. Schematic representation of a two-dimensional numerical model grid and locally enlarged grid configuration.
Water 17 01261 g002
Figure 3. Model water level calibration and validation results.
Water 17 01261 g003
Figure 4. Comparison of river water levels at different control sections in different hydrologic years.
Water 17 01261 g004
Figure 5. Flow velocity differences at D1 control section pre- and post-anchorage project (post-project flow velocity–pre-project flow velocity).
Water 17 01261 g005
Figure 6. Flow velocity differences at D2 control section pre- and post-anchorage project (post-project flow velocity–pre-project flow velocity).
Water 17 01261 g006
Figure 7. Topography of the left branch before and after the dredging project.
Water 17 01261 g007
Figure 8. Flow velocity distribution before and after the left branch dredging project.
Water 17 01261 g008
Figure 9. Topography of the S1 section before and after shoal cutting.
Water 17 01261 g009
Figure 10. Topography of the S2 section before and after shoal cutting.
Water 17 01261 g010
Figure 11. Flow velocity distribution at the S1 section before and after shoal cutting.
Water 17 01261 g011
Figure 12. Flow velocity distribution at the S2 section before and after shoal cutting.
Water 17 01261 g012
Table 1. River water level variations at control sections under different hydrological conditions before and after the project implementation.
Control SectionsThe Maximum Water Level Drawdown Before and After the Project in a Wet Year (m)The Maximum Water Level Drawdown Before and After the Project in a Normal Water Year (m)The Maximum Water Level Drawdown Before and After the Project in a Dry Year (m)
C10.210.230.26
C20.110.120.13
C30.050.060.07
C40.0010.0020.002
Disclaimer/Publisher’s Note: The statements, opinions and data contained in all publications are solely those of the individual author(s) and contributor(s) and not of MDPI and/or the editor(s). MDPI and/or the editor(s) disclaim responsibility for any injury to people or property resulting from any ideas, methods, instructions or products referred to in the content.