Article

Contribution to Distribution and Toxicity Prediction of Organic Pollutants in Receiving Waters from Wastewater Plant Tailwater: A Case Study of the Yitong River, China

Key Laboratory of Songliao Aquatic Environment, Ministry of Education, Jilin Jianzhu University, Changchun 130118, China
*
Author to whom correspondence should be addressed.
Water 2025, 17(14), 2061; https://doi.org/10.3390/w17142061
Submission received: 27 May 2025 / Revised: 1 July 2025 / Accepted: 7 July 2025 / Published: 10 July 2025
(This article belongs to the Section Wastewater Treatment and Reuse)

Abstract

Urban river ecosystems are increasingly threatened by anthropogenic activities, with wastewater discharge being a significant contributor. The complex nature and diverse sources of wastewater pose challenges in assessing its impact on water quality and ecological health. This study investigated the distribution, toxicity, and ecological effects of organic pollutants in an urban river system during the dry season. A comprehensive analysis was conducted of 16 phthalate esters (PAEs), 16 polycyclic aromatic hydrocarbons (PAHs), and 8 antibiotics, with a focus on several key pollutants. The results revealed distinct pollutant profiles: Dibutyl phthalate (DBP), Dimethyl phthalate (DEHP), and Diisobutyl phthalate (DIBP) were the predominant PAEs, while Chrysene was the most abundant PAH. Among antibiotics, Oxytetracycline and Norfloxacin were the dominant compounds. Wastewater treatment plant (WWTP) effluents significantly altered the composition of organic pollutants in receiving waters. Although dilution reduced the concentrations of some pollutants, certain organic compounds were detected for the first time downstream of the WWTP, and some specific compounds exhibited increased concentrations. Toxicity prediction using the Concentration Addition (CA) model identified DBP as the primary contributor to overall toxicity, accounting for the highest toxic load among all detected pollutants. Furthermore, WWTP effluents induced significant shifts in microbial community structure downstream, with incomplete recovery to upstream conditions. Integrated analysis of 16S rRNA gene sequencing, water quality assessment, and toxicity prediction elucidated the multifaceted impacts of pollution sources on aquatic ecosystems. This study provides critical insights into the composition, spatial distribution, and toxicity characteristics of organic pollutants in urban rivers, as well as their effects on bacterial community structure. The findings offer a scientific foundation for urban river water quality management and ecological protection strategies.

1. Introduction

As vital natural resources for urban residents, urban rivers play an indispensable role in maintaining the stability of social structures, preserving the balance of ecosystems, and promoting sustainable economic development. However, with the accelerated pace of urbanization and the persistent release of significant amounts of pollutants and wastewater, the water quality of urban rivers is facing increasingly severe deterioration challenges [1]. The continuous degradation of river ecosystems due to urbanization is known as urban river syndrome, which is distinguished by frequent fluctuations in water flow, increased nutrient and metal contents, the straightening and flattening of river morphology, and a significant decline in biodiversity [2]. The water quality of urban rivers is influenced by a multitude of factors and concurrent and intertwined stressors. Anthropogenic factors that commonly impact the health of urban river ecosystems encompass effluents from wastewater treatment facilities and dispersed livestock farms and sewage discharges from rural areas [3].
Sewage treatment plant discharges are rich in nutrients and organic and inorganic pollutants and are one of the major point sources of pollution in urban rivers, as well as a key factor contributing to eutrophication and ecotoxicity problems in rivers [4,5]. Due to the limitations of the current wastewater treatment technologies, the complete removal of pollutants, particularly certain persistent ones, is not feasible. Animal waste constitutes a significant source of river contamination, entering urban river systems via terrestrial runoff as non-point source pollution or directly through open channels as point source pollution [6]. Wastewater from hospitals and livestock farms is rich in antibiotics and hormones, which are difficult to remove completely in conventional wastewater treatment processes, thus becoming point source pollution and being discharged into urban rivers [7]. Agricultural drainage water is rich in fertilizer and pesticide residues, which is one of the main pathways for the nonpoint source pollution of urban rivers. Agricultural activities result in detectable pesticide constituents in urban rivers; some of these pollutants are highly toxic and resistant to natural degradation [8].
Phthalates (PAEs), commonly employed as plasticizers across a range of products, are recognized as endocrine disruptors owing to their antiandrogenic properties [9]. However, the large-scale production and application of PAEs has resulted in their widespread presence in a wide range of environmental media globally, posing a significant threat to aquatic ecosystems and human health [10,11]. After entering the aquatic environment, PAEs can easily enter organisms due to their low volatility and ease of migration, resulting in a wide range of adverse effects on aquatic organisms including immunity and reproduction problems, oxidative damage, tissue damage, genetic and developmental issues and other toxicities [12]. In addition, epidemiological studies have revealed that exposure to PAEs may be associated with ill health, for example endocrine disruption, growth and developmental disorders, and potential carcinogenic risks [13].
Polycyclic aromatic hydrocarbons (PAHs) are highly toxic substances with relatively high mobility that can be emitted locally and dispersed globally [14]; their main sources are human activities such as fossil fuel combustion and biomass pyrolysis [15,16]. Despite undergoing degradation over time, they are still regarded as persistent hydrophobic compounds and are abundant in soils, meaning they have the potential to enter aquatic ecosystems via surface runoff and atmospheric transportation [17]. These substances also accumulate in living biomass and are readily transported to deeper water and sediments after binding to organic matter-rich particles [18]. The release and behavior of these substances in aquatic environments are complex and strongly influenced by seasonal variations. Antibiotics contribute significantly to medicine, but their incomplete degradation in the body leads to the release of large amounts of residues into the environment through sewage treatment plants [19]. Wastewater treatment plants are not designed to remove antibiotics, drug-resistant bacteria, and genes, so these pollutants may enter rivers and oceans, increasing environmental risks, especially in the context of water reuse [20,21].
Previous research has focused either on nutrients or on a single type of pollutant, with few adopting a multi-pollutant perspective. The development of effective assessment techniques for swiftly and accurately detecting ecosystem alterations has emerged as a critical challenge over the past decades, amidst the escalating degradation of rivers from localized to global scales [22]. Effective water quality management requires comprehensive risk assessment and safety planning, as emphasized in the WHO’s Water Safety Plan, which provides a framework for hazard identification and risk assessment from catchment to consumer [23]. 16S rRNA genes have become an effective means of monitoring aquatic biodiversity because of the high degree of stability and specificity that their sequences exhibit in bacteria [24]. Aquatic organisms are in water bodies containing a wide range of complex pollutants, and this exposure may pose a potential threat to individual organisms as well as to the ecosystem as a whole [25]. The widespread presence of organic pollutants due to their long half-life in the environment poses a serious risk to organisms and ecosystems, prompting the research community to explore efficient and cost-effective solutions, among which microbial bioremediation is a cutting-edge strategy to reduce the toxicity of bacterial organic pollutants by virtue of its key role in their biotransformation and degradation [26].
The objective of this study was to comprehensively analyze the combined effects of multiple organic pollutants on urban rivers and to assess the health of urban river ecosystems in terms of both mixed toxicity effects and biodiversity changes. The objectives of this study were to 1. quantify the concentration levels of PAEs, PAHs, and antibiotics in the Yitong River and their distributional characteristics; 2. investigate the contribution of wastewater plant tailings to the organic pollutants in the urban river; 3. predict the mixed toxicity of the pollutants by using ECOSAR and Concentration Addition (CA) modeling; 4. identify the key toxins in the urban river based on their toxicity contribution; and 5. clarify the organic pollutants’ effects on bacterial communities. To evaluate the effects of multiple organic pollutants on the health of aquatic ecosystems, this study constructed a correlation model between bacterial diversity and predicted toxicity. This study provides a novel perspective for evaluating the effects of multiple pollutants on urban river ecosystems and emphasizes the importance of caring for and protecting the health of urban river ecosystems.

2. Materials and Methods

2.1. Study Area

The sampling work was carried out in November 2024. A total of 10 sampling points were set up in the Yitong River from south to north, namely, the cross section of Xinlicheng Reservoir dam (S1); in front of the free barrage (S2); the cross section of Yangjiaweizi Bridge (S3); D50, D200, W2, W3, W4, and W5 are respectively 50 m, 200 m, 1 km, 2 km, 3 km, and 4 km downstream of the sewage plant discharge outlet and the cross section of Houweijiatun (S4). The specific sites are shown in Figure S1. Site S1 is an important water source for Changchun City, and its evaluation results reflect the initial water quality of the river before urban pollution. Site S2 is located on the cross section of the South Fourth Ring Road. Site S3 is located 400 m upstream of the wastewater treatment plant and is not affected by the wastewater treatment plant. Site S4 (minimally affected by urban pollution) is located downstream of the urban section. Sites S1–S4 comprehensively reflect the ecological health of the Changchun section of the Yitong River. W2 is located 1 km downstream of the sewage treatment plant, and the sampling sites W2–W5 are separated by 1 km, respectively. Sites D50–W5 are able to comprehensively reflect the trend of the influence of the sewage treatment plant on the downstream ecological health status.

2.2. Sample Collection

Three sub-sample points were randomly set within five meters of each sample point to collect samples, which were collected in three sterile sampling bottles; a total of 30 microbial samples were collected. To ensure microbial activity, the samples were kept at 0–4 °C throughout the whole process and to the laboratory within 12 h to be preserved at −80 °C until analyzed. The equipment used in the microbial sample collection and experimental process was sterilized in advance. The water samples were filtered through a 0.22 μm membrane and sent with sediment samples to Shanghai Meiji Biomedical Technology Co. for DNA extraction, PCR amplification, and high-throughput sequencing. To avoid PAE contamination, plastic products were swapped for glassware during the experiment. The glassware was soaked in an acid bath for three days, washed with ultrapure water, ultrasonically treated, and dried to ensure the quality of water samples.

2.3. Water Quality Parameter Analysis

A Shanghai Lei magnetic DZB-712 portable multi-parameter analyzer was used on site to determine the pH, conductivity (EC), dissolved oxygen (DO), and water temperature (WT) in the water environment. Total nitrogen (TN), ammonia nitrogen (NH4+-N), nitrate nitrogen (NO3-N), total phosphorus (TP), chemical oxygen demand (CODCr), permanganate index (CODMn), and chlorophyll index (Chl-a) were determined in water samples in the laboratory. The collected environmental samples were kept at 0–4 °C throughout the whole period before beginning the experiment, and the storage time did not exceed 24 h.

2.4. Instrumental Analysis of Organic Pollution

The sample preparation, instrumental analysis, quality assurance, and quality control methods for PAEs, PAHs, and antibiotics are shown in Table 1.

2.5. Prediction of Toxicity

Median Lethal Concentration (LC50) values for suspected contaminants in fish and daphnids over 96 h were obtained from ECOSAR (v1.1). Based on single-contaminant concentration–response curves, mixed toxicity was predicted using the CA model. The LC50 for a mixture of pollutants was determined using Equation (1), where the relative proportion of each pollutant was divided by the total LC50 value for that specific pollutant [30]. The ECOSAR model estimates the 96-h LC50 values of pollutants to fish using QSAR models, which predict toxicity parameters based on the molecular structure of the pollutants. The Concentration Addition (CA) model calculates the combined toxicity of mixtures using a specific formula. Silafluofen was used as a standard to assess the accuracy of sample pre-treatment by analyzing fortified matrix samples and determining recovery rates, ensuring the reliability of data input to the models. The predicted toxicity was cross-validated against the actual concentrations of silafluofen in the river and fish diversity data, which showed a negative correlation with mixture toxicity, thereby verifying the consistency between the model predictions and actual ecological impacts.
L C m i x = i = 1 n p i L C i 1
where n—Number of pollutants; LCi—Median lethal concentration for a single contaminant i; pi—Relative concentration of contaminant i; LCmix—Median lethal concentration of the mixture.

2.6. Biodiversity Assessment

The V3–V4 variable region of the 16S rRNA gene was amplified via PCR, and the resulting products were visualized on a 2% agarose gel. Quantitation was carried out using Qubit 4.0, sequencing was executed on the Illumina PE300 platform, and functional prediction analysis of the 16S rRNA gene was conducted using PICRUSt2 2.2.0 software. A detailed description of the methods is provided in Method S1.

2.7. Data Processing and Statistical Analysis

Spatial variations in the makeup of organic pollutants present in urban rivers and point source polluted watersheds were analyzed using Principal Coordinate Analysis (PCoA). A Pearson correlation test was performed using SPSS 27. Mixed toxicity prediction with toxicity contribution was calculated using Excel 2022, and ArcGIS 10.8.2 mapped the study area. Correlation heatmap plots and microbial community analysis were conducted utilizing R 3.3.1. Data were graphically illustrated using Origin 2021.

3. Results and Discussion

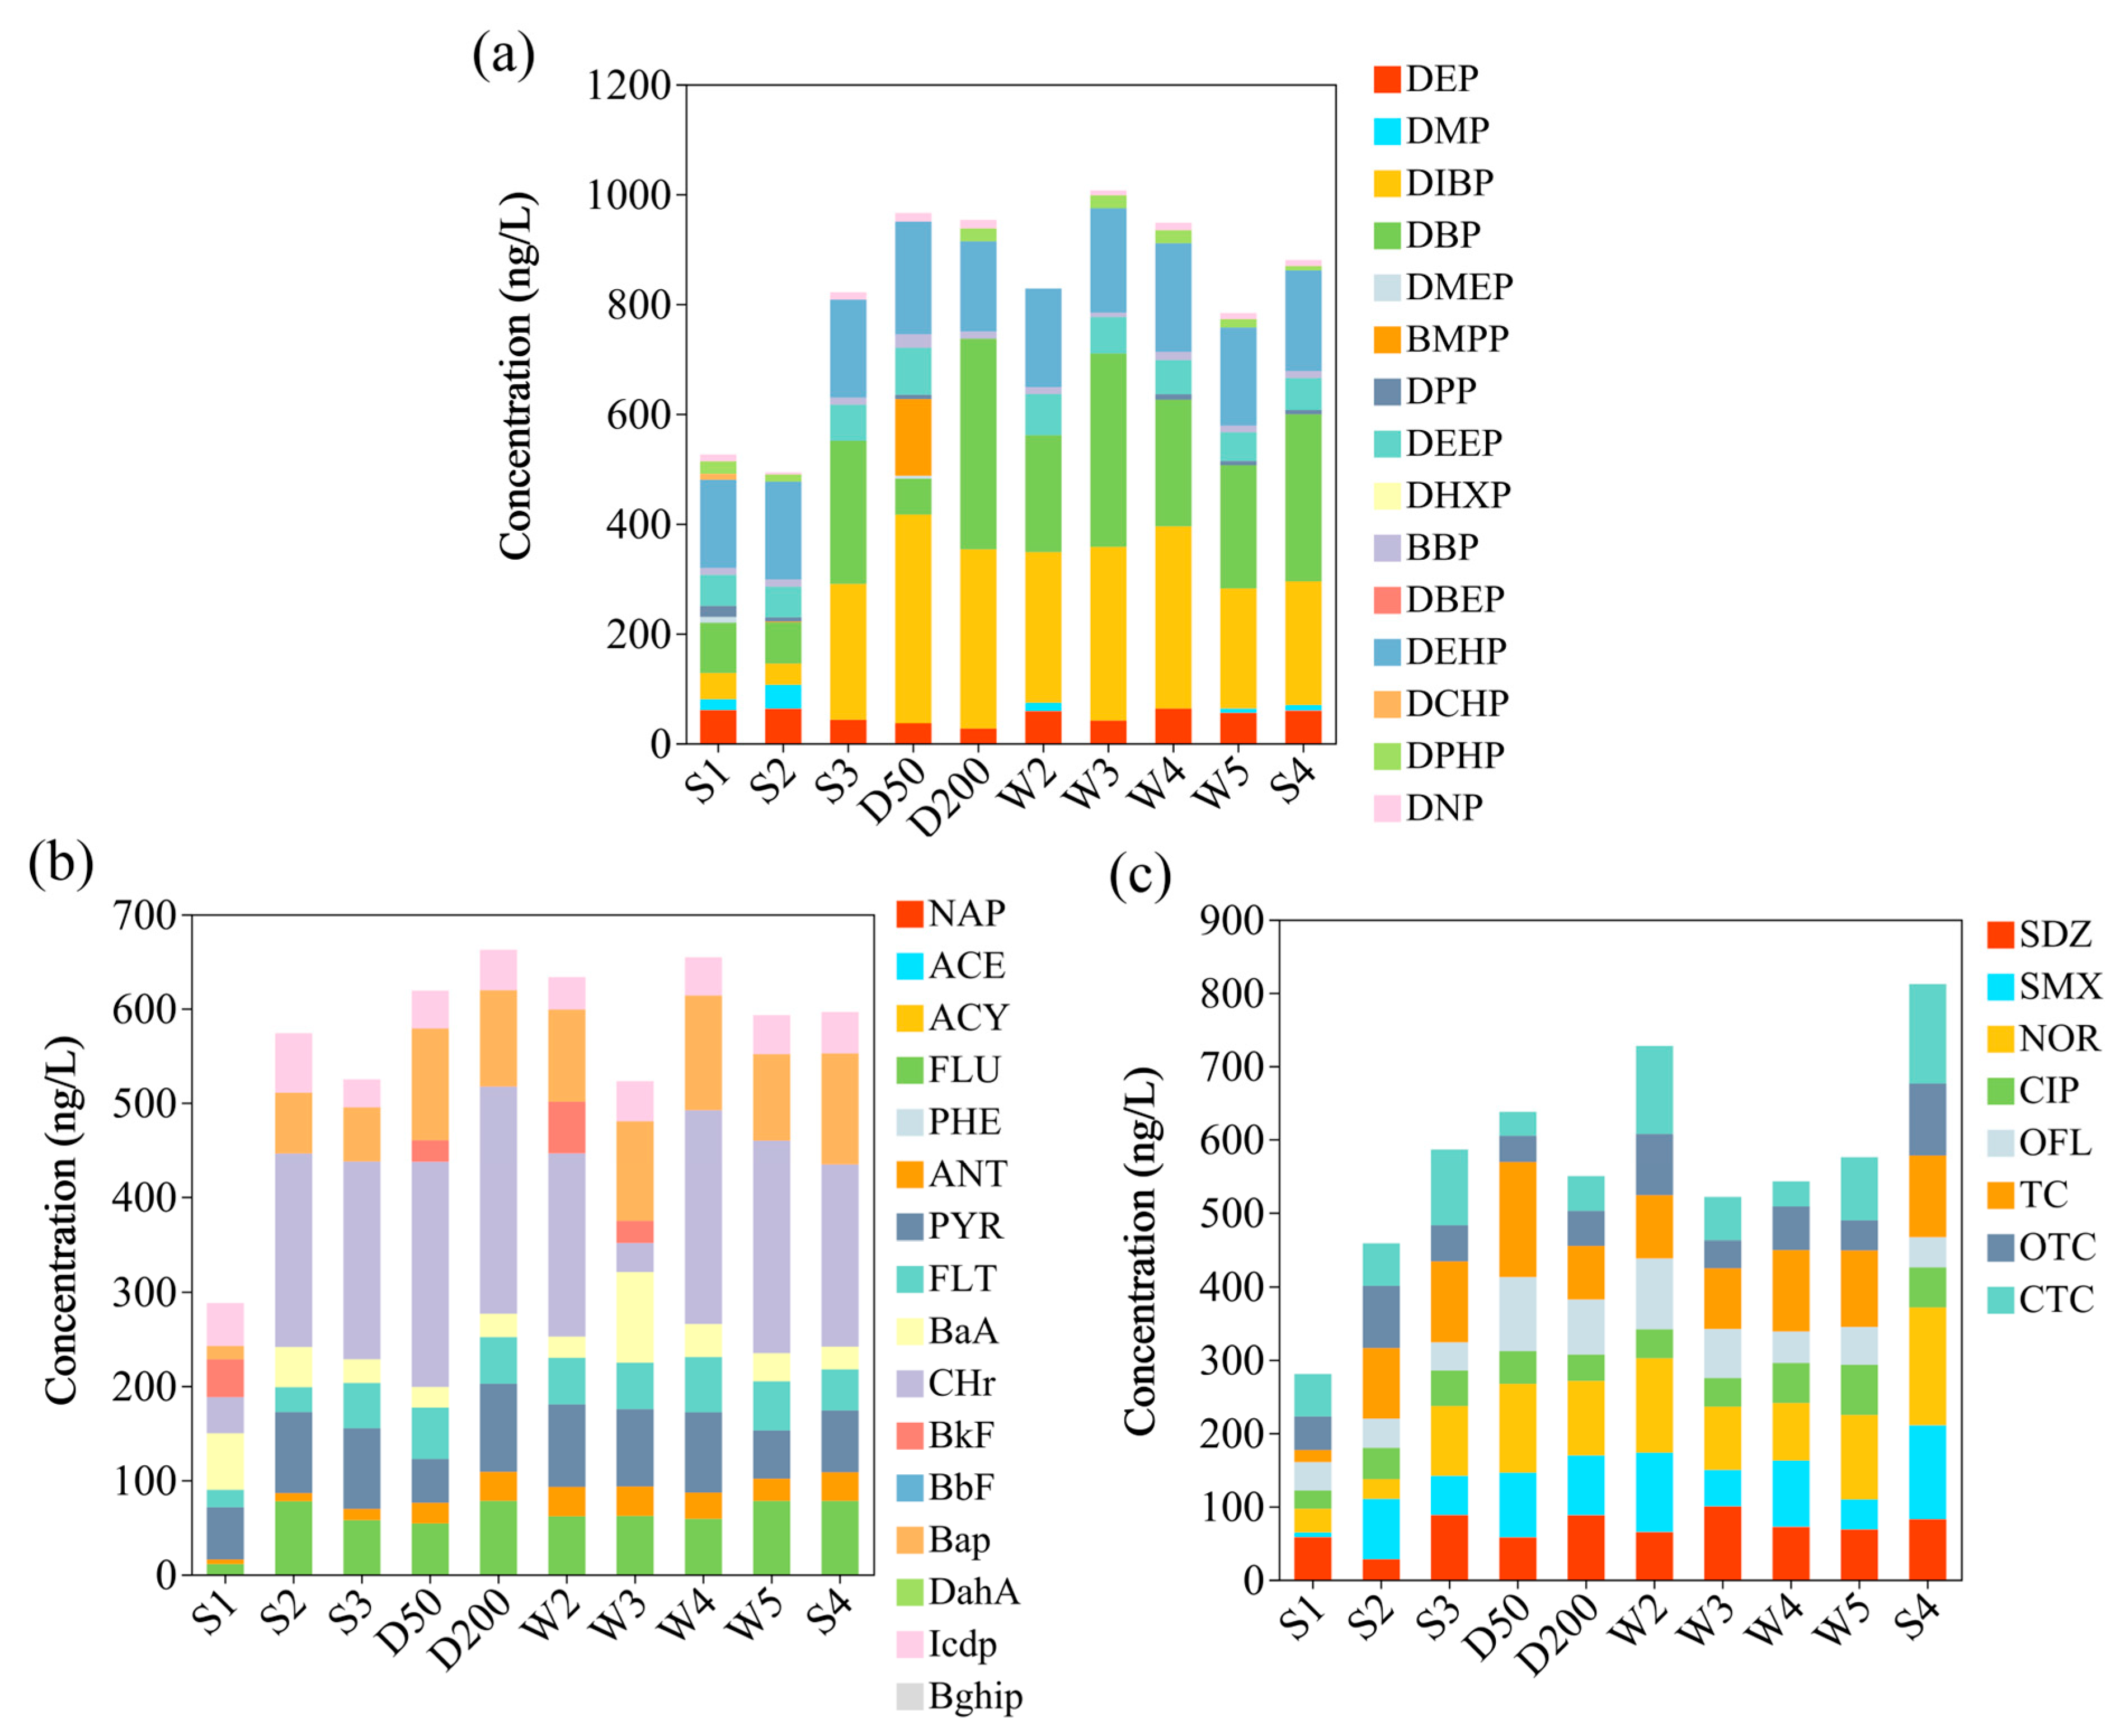
3.1. Organic Pollutant Composition in Urban Rivers

In this study, 16 PAEs, 16 PAHs, and 8 antibiotics were set as target pollutants. The details of the organic pollutants are shown in Table S1. Fourteen PAEs, nine PAH congeners, and eight antibiotics were detected in the river water samples collected. We analyzed 16 phthalate esters (∑PAEs), 16 polycyclic aromatic hydrocarbons (∑PAHs), and 8 antibiotics and set them as target pollutants. However, in the results, 14 PAEs, 9 PAHs, and all 8 antibiotics were detected. The discrepancy between the number of target pollutants and detected pollutants can be explained as follows: The two undetected PAEs and seven undetected PAHs were either absent from the river water or present at concentrations below the detection limits of our analytical methods. Detection limits are influenced by factors such as the sensitivity of the analytical instruments, sample preparation efficiency, and the chemical properties of the pollutants. In this study, the detection limits for PAEs and PAHs were determined based on the calibration of the analytical instruments and the optimization of the sample preparation procedures. The detection of 14 PAEs and 9 PAHs reflects the actual presence of these pollutants in the river water samples analyzed. Such inconsistencies between target and detected pollutants are common in environmental analysis due to the diverse sources and variable concentrations of pollutants in complex environmental matrices like urban rivers. The concentrations of these compounds are illustrated in Figure 1.
The mean concentrations of ∑PAEs, ∑PAHs, and the eight antibiotics in the dry season were 820.49 ng/L, 566.66 ng/L, and 569.01 ng/L, respectively. The frequency of detection was 90% for Di (2-ethylhexyl) phthalate (DEEP) and Dinonyl phthalate (DNP), 70% for Diphenyl phthalate (DPHP), 60% for Di-N-pentyl phthalate (DPP), 50% for Dimethyl phthalate (DMP), 20% for Bis(2-methoxyethyl) phthalate (DMEP) and Bis(4-methyl-2-pentyl) phthalate (DMPP); Bis(2-n-butoxyethyl) phthalate (DBEP) and Di-n-octyl phthalate (DNOP) were not detected. Benzo(k)fluoranthene (BkF) was detected at a frequency of 40%, and Naphthalene (NAP), Acenaphthene (ACE), Acenaphthylene (ACY), Phenanthrene (PHE), Benzo(b)fluoranthene (BbF), Dibenzo(a,h)anthracene (DahA), and Benzo(g,h,i)perylene (Bghip) were not detected. All other contaminants were found at every sampling location. Among them, PAEs were about 25.7% lower than the average concentration of PAEs in the Yitong River detected by Zhao et al. in the dry season of 2023 [31].
Dibutyl phthalate (DBP), Dimethyl phthalate (DEHP), and Diisobutyl phthalate (DIBP) accounted for the highest percentage of PAEs at all sampling points, and DIBP, DEHP, and DBP accounted for 78.27% of the total PAE content, with mean concentrations of 240.63 ng/L, 181.48 ng/L, and 220.10 ng/L, respectively. In all river segments, Chrysene (CHr) was the most abundant PAH, comprising the highest proportion of 31.75% of the total PAH content, with an average concentration of 179.96 ng/L. Oxytetracycline (CTC) and Norfloxacin (NOR) accounted for the highest proportion of antibiotics in all reaches, with CTC and NOR accounting for 16.64% and 16.63% of the total antibiotic content, with average concentrations of 94.68 ng/L and 94.64 ng/L, respectively.
Analysis of the organic pollutants in the wastewater plant tailwater influence basin (WWTPe) and urban river (UR) using PCoA showed (Figure 2) that points S3 and S4 in the UR showed similarity in organic pollutant compositions with points D50, W2, W4, and W5 in the WWTPe, whereas points S1, S2, D200, and W3 showed significant differences. PCoA analysis shows that the organic pollutant compositions are similar among the S3 and S4 points in the urban river and the D50, W2, W4, and W5 points in the WWTPe, indicating comparable organic pollution characteristics in these areas [32]. In contrast, the S1, S2, D200, and W3 points differ significantly, implying distinct organic pollutant compositions that are likely influenced by diverse pollution sources or environmental conditions. At point D50, the organic pollutant concentrations resemble upstream levels, with some even at lower levels, yet novel pollutants or higher concentrations are detected. Overall, PCoA analysis demonstrates that WWTP effluents affect downstream organic pollutant compositions, but this impact is regulated by various factors such as natural dilution, dispersion, biodegradation, and inputs from different pollution sources [33]. Most of the organic pollutant concentrations at point D50 downstream of the wastewater plant outfall were similar to those in the upstream water body and were even significantly lower for some organic pollutants, such as DBP, CTC, and PYR. However, DMEP, BMPP, BkF, DMEP, and DMPP were either detected for the first time at point D50 or had lower concentration levels upstream.
Overall, the wastewater plant tailings did not significantly elevate the organic pollutant concentrations in downstream waters. This could be attributed to the persistent discharge of tailwater from the wastewater treatment plant, where the impacts of dilution and dispersion may outweigh those of enrichment [34]. However, although natural processes such as dilution and biodegradation can reduce the concentration of some organic pollutants and mitigate the direct impacts on receiving waters after point source pollution is discharged into a water body, the risk of contamination cannot be completely eliminated, especially for pollutants that are difficult to decompose or are potentially toxic. Although the dilution of WWTP effluent reduces the concentrations of some pollutants, the concentrations of certain pollutants still increase. Some persistent pollutants, like specific PAHs and antibiotics with stable chemical structures, are hard to degrade in a short time. They are not completely removed by the WWTP and continue to accumulate downstream after discharge [35]. New pollutants may be generated during wastewater treatment. For instance, some organic matter can undergo chemical reactions during treatment to form new pollutants, whose concentrations may rise during subsequent dilution. The river’s environmental conditions may promote the release or transformation of certain pollutants. For example, pollutants in riverbed sediments may re-enter the water under specific conditions or some pollutants may undergo chemical transformations in the water to form new pollutants, leading to increased concentrations. These factors can cause the concentrations of some pollutants to increase even after dilution [36].

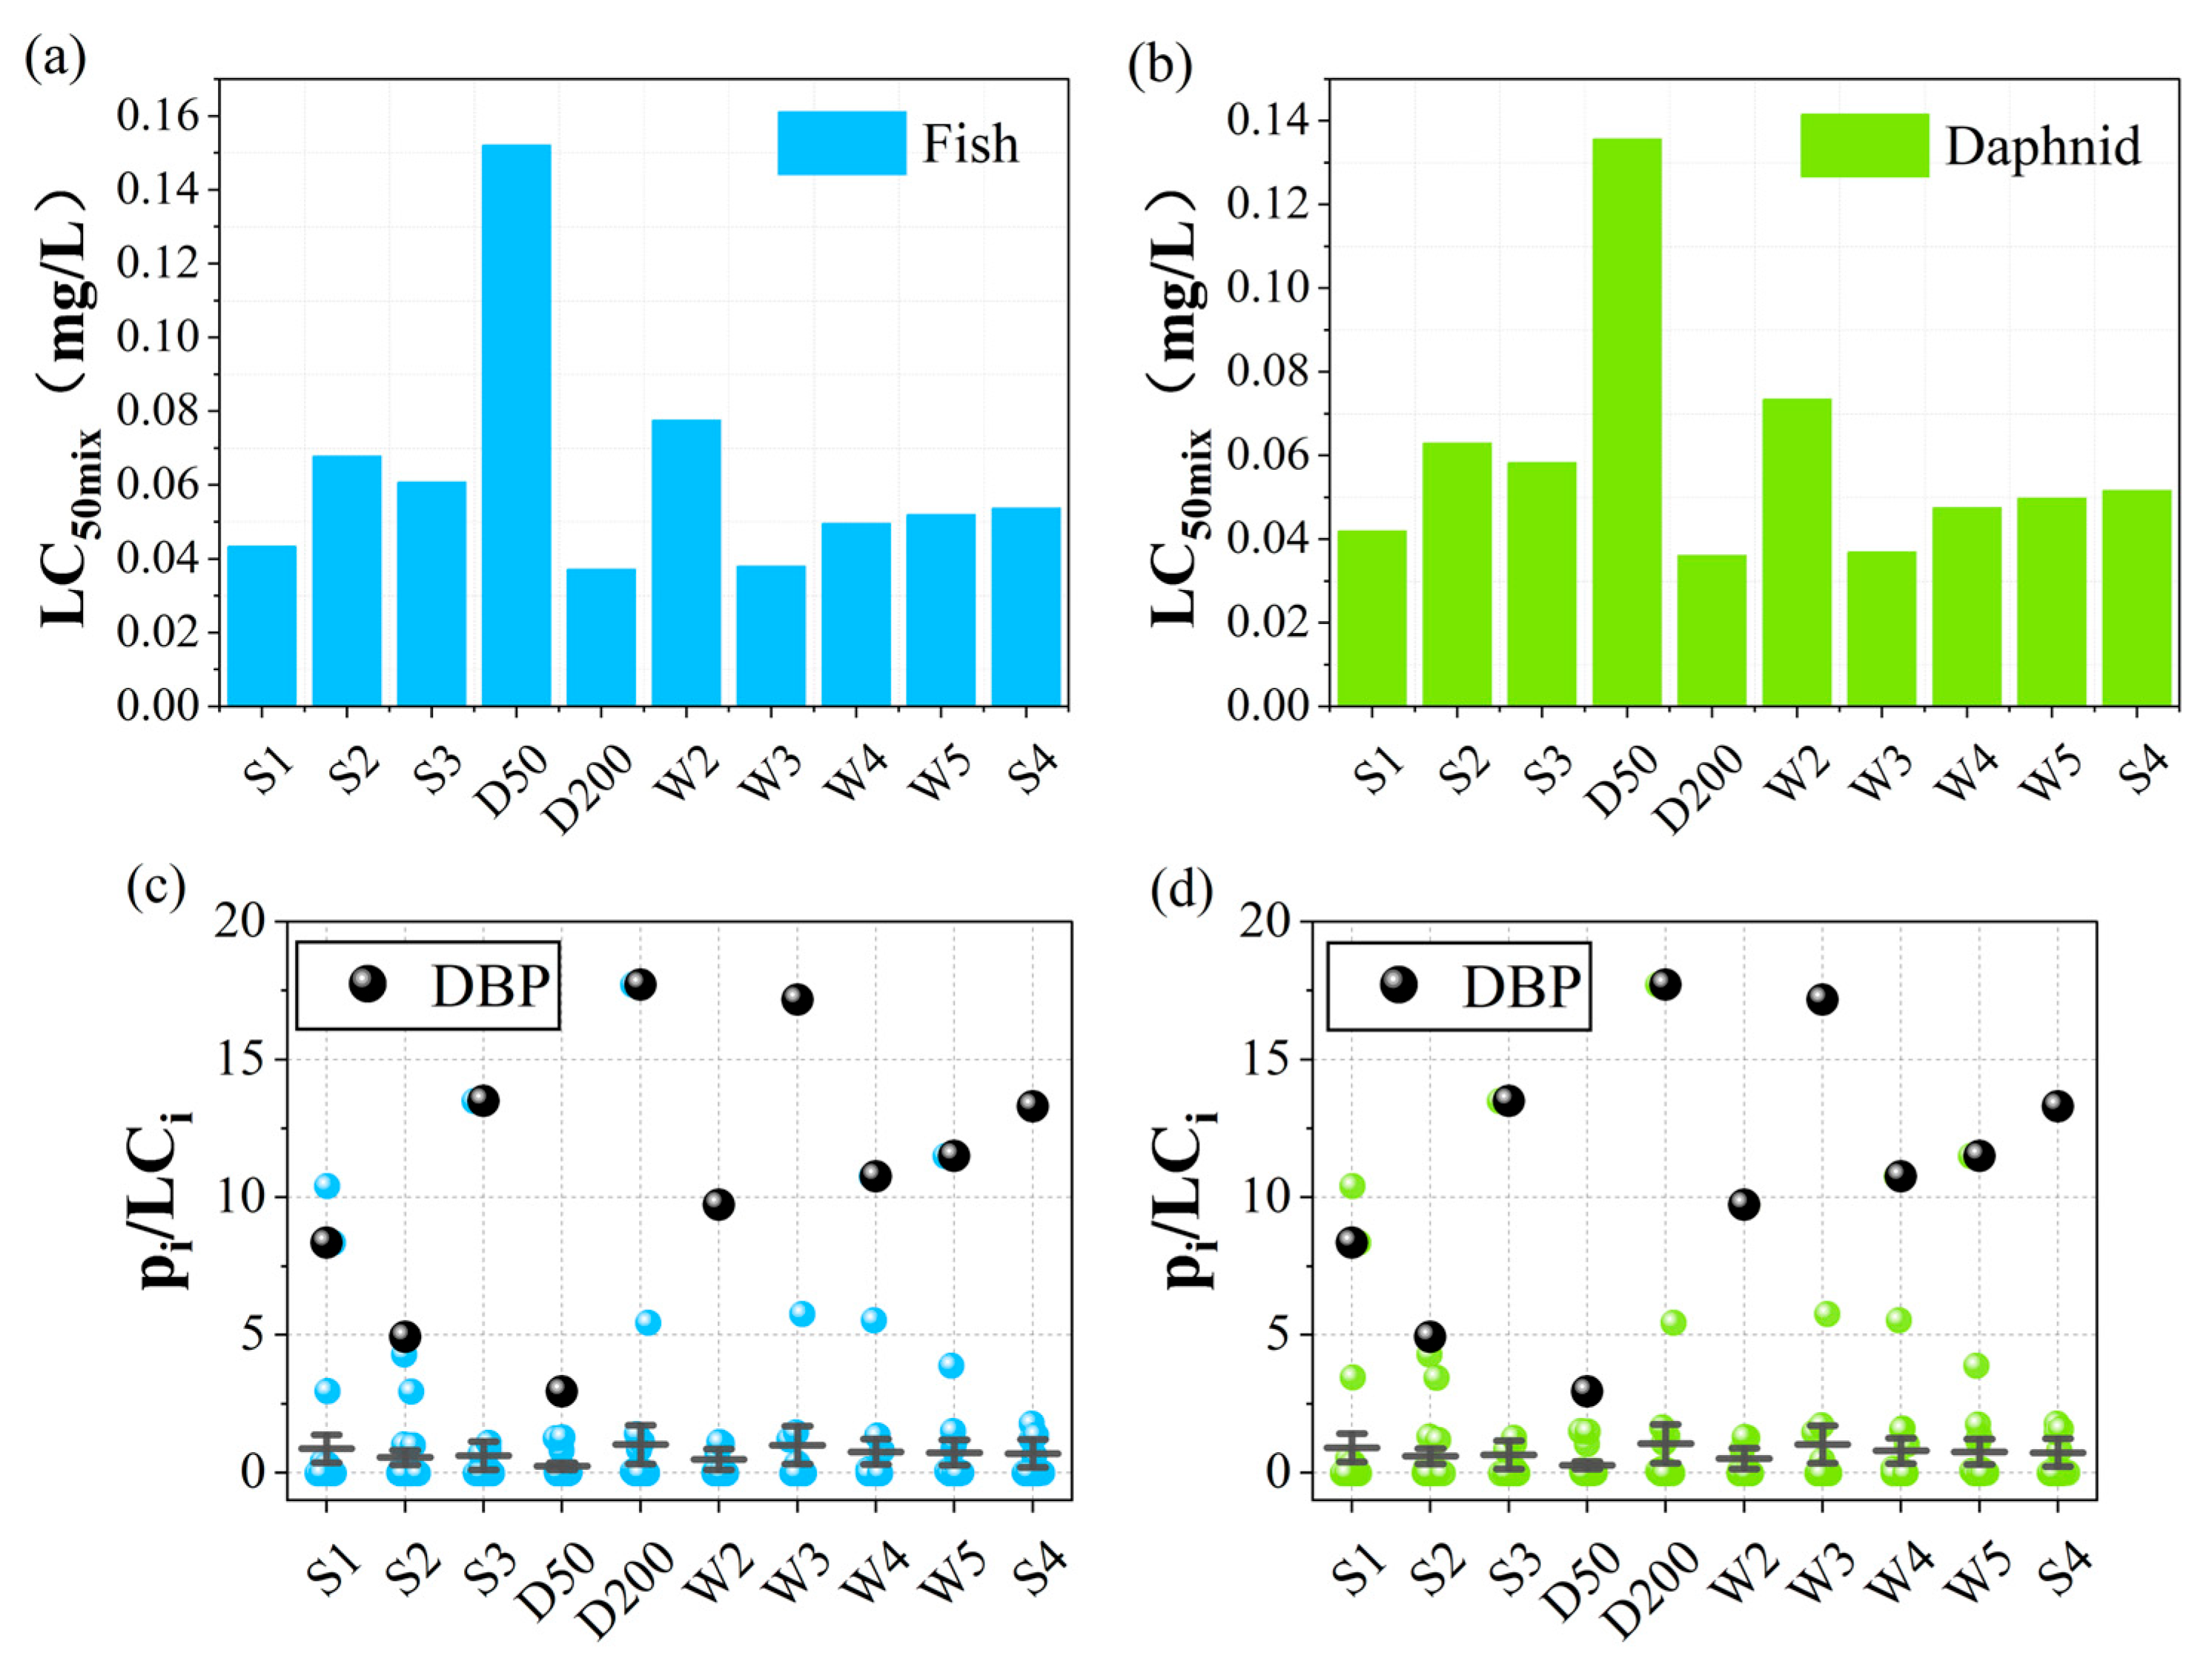
3.2. Mixed Toxicity Prediction Analysis

Excluding the organic pollutants with more zero values, the remaining 26 organic pollutants were screened for mixed toxicity prediction (Table S2). The mixed toxicity prediction results of the Yitong River during the dry period are shown in Figure 3a,b. The LC50mix was highest at the D50 point and then decreased to the lowest at the D200 point, with a slow increasing trend along the river. Overall, LC50mix was lower in the wastewater plant impact watersheds than in the urban rivers (except for D50 point) and the mixed predicted toxicity for fish and daphnids showed consistency.

3.3. Toxicity Contribution

Having clarified the variation in the mixing toxicity of pollutants in urban streams, we assessed the extent of their contribution to mixing toxicity by calculating the ratio of the relative concentrations of the top 26 organic pollutants (Figure S2) to their LC50 values. Higher ratios indicate that the pollutant contributes more to the mixing toxicity (Figure 3c,d). The pollutants with ratios greater than 1 were DBP, DPHP, and Icdp. Of these pollutants, DBP had the highest proportion in all river water samples (except point S1) and contributed the most to toxicity. Consequently, DBP was recognized as the major toxicity factor in the urban river. Unlike DIBP, which has been shown to have specific metabolic pathways in certain bacterial species [37], DBP tends to accumulate in aquatic organisms and has a longer half-life in the environment [38]. This accumulation potential, combined with its antiandrogenic properties, makes DBP particularly toxic, even at relatively low concentrations. Recent studies have highlighted the differential toxicological impacts of DBP and DIBP, with DBP often exhibiting more pronounced effects on endocrine disruption and aquatic life [39]. The DBP concentrations at the S1 and D50 sites were 91.50 ng/L to 65.33 ng/L, respectively, which were markedly lower compared to the other sites. The results indicated that DBP was not mainly from the sewage plant tailwater.
It is noteworthy that although DBP was cited as the main toxicity factor according to the mixed toxicity contribution, the lowest DBP concentration was found at the D50 site but it had the highest LC50mix. The high LC50mix value at D50, despite the low DBP concentration, may be due to the combined effects of multiple pollutants and differences in bioavailability. On the one hand, DMEP was detected at the D50 site, and these contaminants may synergize with DBP to enhance the overall toxicity. On the other hand, DBP might have higher bioavailability at the D50 point, making it more readily absorbed and utilized by organisms, thereby causing higher toxicity effects even at low concentrations [40]. Additionally, the environmental conditions at the D50 point could promote the release or transformation of certain pollutants. For instance, pollutants might be rereleased from riverbed sediments or undergo chemical transformations in the water to form new toxic substances, leading to increased toxicity. Research indicates that the bioavailability and toxicity of persistent organic pollutants like polycyclic aromatic hydrocarbons can vary significantly under complex environmental conditions, and their toxicity effects might still be considerable even at low concentrations [41]. This may be due to the fact that multiple organic pollutants were detected for the first time at D50, which is synergistic with the possible presence of other pollutants in the environment that synergize with DBP, thus enhancing the overall toxic effect [42]. Even if the concentration of DBP is low at the D50 site, it may result in higher toxic effects if it is more bioavailable or more readily taken up by organisms in combination with other contaminants [43]. DBP may affect organisms through a specific mechanism of toxic action, which may be more sensitive or potent at the D50 site, resulting in a higher toxic response. Mixed toxicity is often not a simple summation of the toxicity of a single pollutant but may have complex non-linear relationships [44].

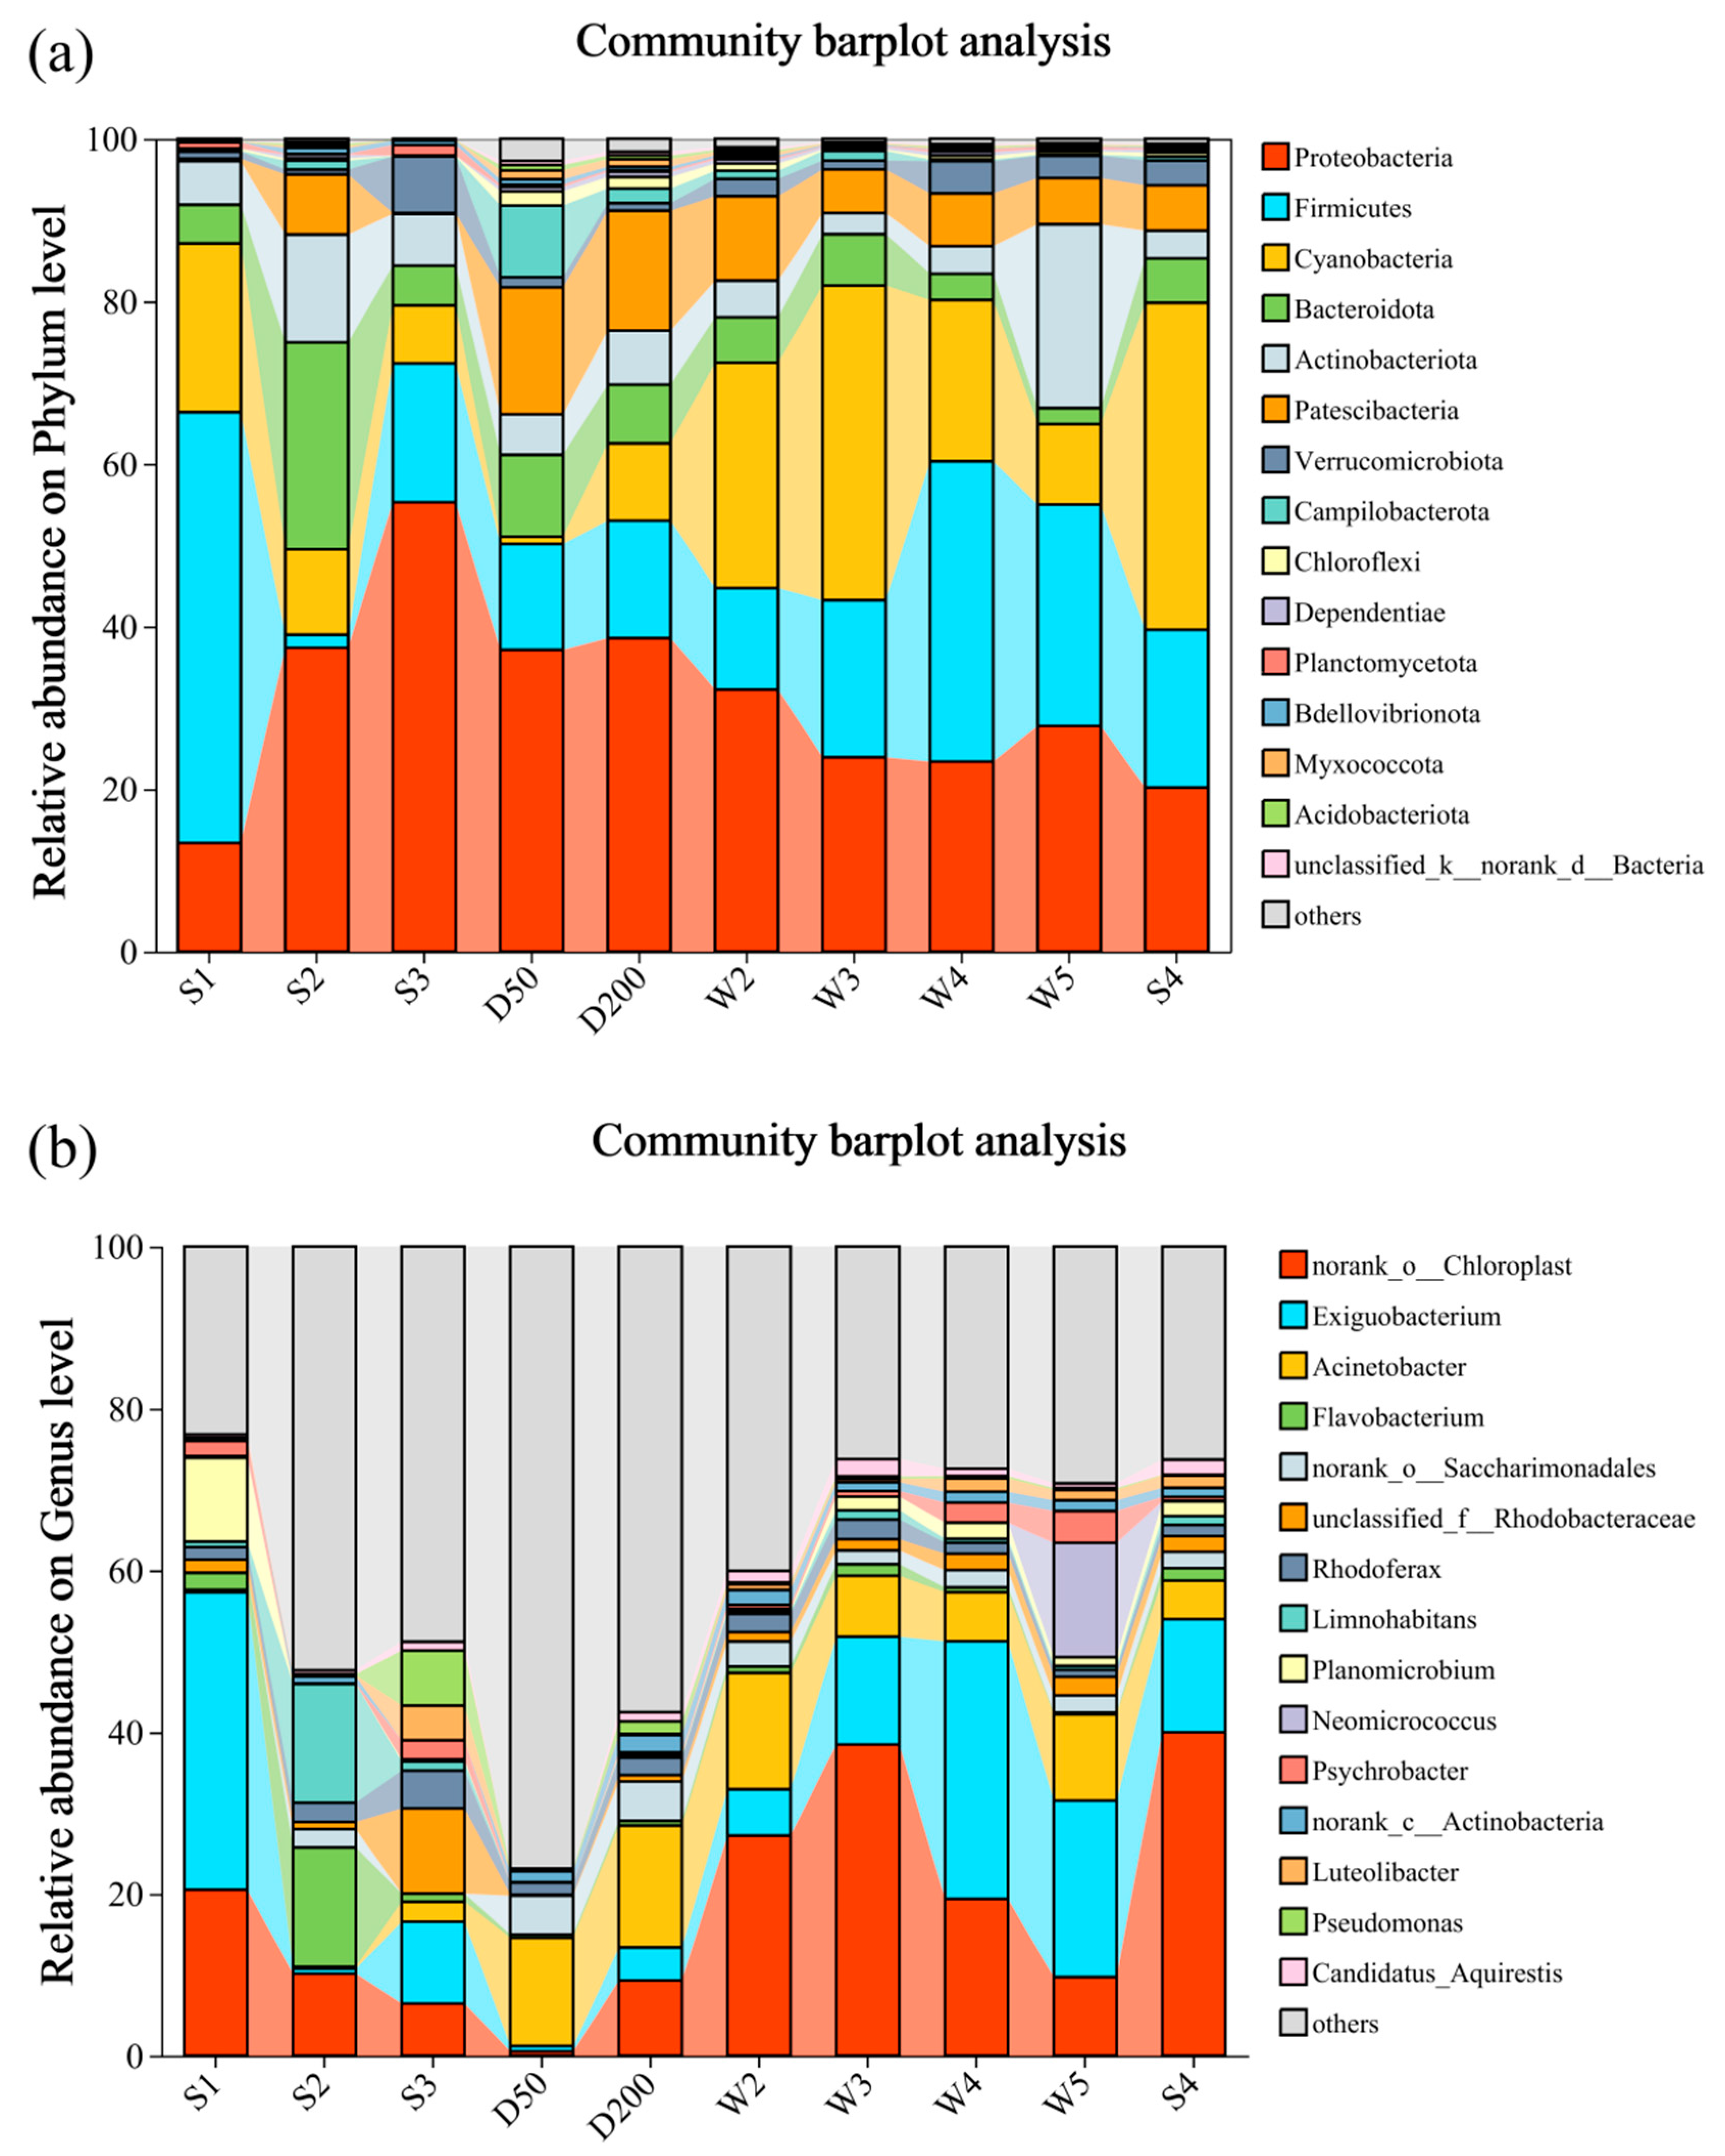
3.4. Effect of Pollutant Composition and Toxicity on Bacterial Community

The microbial community diversity indices are presented in Figure 4. The biodiversity status of the Changchun section of the Yitong River exhibited distinct spatial variations along the river gradient. From the upstream site (S1) to the midstream site (S3), a general decline in biodiversity indices was observed. In contrast, within the sampling interval from D50 (50 m downstream of the wastewater treatment plant) to W5, the biodiversity indices remained consistently high and relatively stable. It is noteworthy that S4 exhibits a comparatively high biodiversity index, despite its location downstream of the urban area.
The top 15 microbial communities in terms of relative abundance at the phylum and genus levels were studied to explore their distributional characteristics (Figure 5). Wastewater plant effluent significantly altered the microbial community structure in the downstream aquatic environment. At the phylum level, Proteobacteria displayed a significant decrease in relative abundance, whereas Cyanobacteria and Patescibacteria exhibited a notable increase. Additionally, norank_o___Chloroplast showed a significant rise in relative abundance, while Exiguobacterium experienced a marked decrease, and the relative abundance of Acinetobacter and norank_o__Saccharimonadales exhibited a significant increase.
Proteobacteria usually dominate in the normal biological treatment of wastewater because of their ability to degrade a wide range of organic pollutants. However, wastewater treatment plant tailwaters contain nutrients such as nitrogen and phosphorus, as well as a variety of pollutants such as organic and inorganic matter, and these conditions have the potential to negatively affect the growth of Proteobacteria. For example, studies have demonstrated that elevated levels of nitrogen and phosphorus nutrients can stimulate the proliferation of specific algae species (e.g., cyanobacteria), which compete with Proteobacteria for limited resources and space, leading to a decrease in their relative abundance [45]. In addition, antibiotic residues may inhibit the growth of certain sensitive strains of Proteobacteria, further reducing their relative abundance [46]. Cyanobacteria are prokaryotic organisms capable of photosynthesis, and they usually proliferate in water bodies rich in nutrients such as nitrogen and phosphorus. The high concentration of nutrients contained in the sewage plant tailwater provided favorable conditions for the growth of Cyanobacteria, resulting in a significant increase in their relative abundance. After the discharge of wastewater, the relative abundance of Proteobacteria decreased, while that of Cyanobacteria and Patescibacteria increased. Combined with the pollution data, the high concentration of antibiotics (such as tetracycline) in the wastewater may have inhibited the sensitive Proteobacteria, leading to a decrease in their relative abundance. The literature also shows that certain antibiotics can inhibit the growth of specific strains of Proteobacteria, further affecting their relative abundance. These changes in microbial communities reflect the significant impact of wastewater discharge on river ecosystems.
Overall, the microbial community structure in the receiving water bodies was significantly altered by the impact of the sewage plant tailwater. The community structure in the WWTPe watershed and the UR showed significant differences (Figure S3). For example, Acinetobacter became a new dominant population in the WWTPe watershed and it was difficult for the upstream levels of microbial species to be recovered even at long distances from the WWTP. Bacterial communities differed between the wastewater plant tailwater and receiving waters and effluent discharge had an additive effect on the bacterial communities in the water environment, consequently causing shifts in the bacterial community configuration [47,48]. Simultaneously, the effluent continued to carry trace nutrients and organic matter that continued to enrich the receiving water body, thereby altering the living environment for microorganisms [49].
The top 20 bacterial genera, based on relative abundance, were selected for correlation analysis with water quality parameters and organic pollutants (Figure 6). The water quality parameters are detailed in Table S3. The analysis revealed significant correlations between specific pollutants and bacterial genera. Notably, DNP, DBP, DIBP, BAP, FLT, CHr, ANT, Bap, OFL, NOR, WT, EC, NH4+-N, NO3-N, and TN showed strong positive correlations with Acinetobacter, norank_c_Actinobacteria, norank_o_Saccharimonadales, and Trichococcus. Conversely, these parameters were significantly negatively correlated with Limnohabitans, Polynucleobacter, Flavobacterium, and hgcl_clade.
Correlation analysis of ∑PAEs, ∑PAHs, and antibiotics and microbial community diversity indices (Figure S4) showed that only ∑PAHs exhibited a significant positive correlation with the Shannon index and a significant negative correlation with the Simpson index. The Pearson correlation coefficients of each PAH homolog and microbial community diversity index were passed. The study revealed a significant inverse relationship between Bap (Benzo[a]pyrene) and the Simpson index of bacterial community diversity, along with a notable positive association with the Shannon index, suggesting that its presence may have led to an increase in the inhomogeneity of the distribution of the bacterial community species while contributing to an increase in the diversity of the community species. This may be due to the fact that the toxic effect of Bap leads to a decrease in sensitive bacterial species, while the inducing effect promotes the dominance of bacterial species that can adapt to and degrade Bap [50].
Previous studies have often focused on single pollutants or nutrients. This study innovatively analyzed 16 PAEs, 16 PAHs, and 8 antibiotics in the Yitong River from a multi-pollutant perspective. By combining 16S rRNA gene sequencing, water quality assessment, and toxicity prediction, it offers a comprehensive evaluation of the impacts of multiple organic pollutants on urban river ecosystems. The results provide novel insights for urban river water quality management and ecological protection, addressing the limitations of single-pollutant assessment.

4. Conclusions

The concentrations of PAEs, PAHs, and antibiotics exhibited significant spatial variability. Among the PAEs, DIBP, DEHP, and DBP showed the highest concentrations, while CHr dominated the PAHs and CTC and NOR were the most abundant antibiotics. Notably, although effluent discharge influenced the organic pollutant composition in receiving waters, it was not the dominant factor. At 50 m downstream of the sewage plant outfall (D50 point), most organic pollutant concentrations were comparable to upstream levels, with some even significantly reduced. However, several organic pollutants were detected for the first time or exhibited increased concentrations at the D50 point. Toxicity assessment revealed that DBP was the primary contributor to the predicted mixed toxicity in urban streams. Furthermore, this study investigated the impacts of pollutant composition and toxicity on bacterial communities. The results showed that the wastewater discharged from the WWTP significantly altered the composition of the microbial community downstream and that it was difficult for microbial species to recover to upstream levels even much further downstream of the WWTP. In summary, this study elucidates the composition, distribution, and toxicity characteristics of organic pollutants in urban rivers, identifies key toxic pollutants and their contributions to mixture toxicity, and explores their effects on bacterial community structure. These findings provide a scientific basis for urban river water quality management and ecological conservation.

Supplementary Materials

The following supporting information can be downloaded at: https://www.mdpi.com/article/10.3390/w17142061/s1, Figure S1. Setup of sampling point locations; Figure S2. Relative concentrations of (a) PAEs, (b) PAHs and (c) antibiotics; Figure S3. Principal coordinate analysis of microbial communities at the genus level in urban streams and wastewater plants impacting watersheds; Figure S4. Heat map of correlation between organic pollution and microbial diversity indices. * p ≤ 0.05; Table S1. Compound Information; Table S2. Toxicity analysis (ECOSAR prediction); Table S3. Water quality parameters. References [51,52,53,54,55,56,57] are citied in the Supplementary Materials.

Author Contributions

Conceptualization, M.B. and K.Z.; methodology, X.Z., A.D., X.D. and Y.D.; writing—original draft preparation, M.B. and X.D.; writing—review and editing, X.Z., A.D., Y.D. and K.Z.; supervision, K.Z. All authors have read and agreed to the published version of the manuscript.

Funding

This project was funded by the National Natural Science Foundation of China “The driving mechanism of the composition and structure changes of filamentous bacterial communities in activated sludge microorganisms” (Grant No. 52370037).

Data Availability Statement

The data can be provided by the corresponding author upon reasonable request.

Conflicts of Interest

The authors declare no conflicts of interest.

References

  1. Yan, Z.; Chen, Y.; Bao, X.; Zhang, X.; Ling, X.; Lu, G. Microplastic pollution in an urbanized river affected by water diversion: Combining with active biomonitoring. J. Hazard. Mater. 2021, 417, 126058. [Google Scholar] [CrossRef] [PubMed]
  2. Abdi, R.; Endreny, T.; Nowak, D. A model to integrate urban river thermal cooling in river restoration. J. Environ. Manag. 2020, 258, 110023. [Google Scholar] [CrossRef] [PubMed]
  3. Song, J.; Xu, R.; Li, D.; Jiang, S.; Cai, M.; Xiong, J. Source apportionment and ecological risk assessment of antibiotics in Dafeng River Basin using PMF and Monte-Carlo simulation. Environ. Geochem. Health 2024, 46, 479. [Google Scholar] [CrossRef]
  4. Cooper, R.J.; Warren, R.J.; Clarke, S.J.; Hiscock, K.M. Evaluating the impacts of contrasting sewage treatment methods on nutrient dynamics across the River Wensum catchment, UK. Sci. Total Environ. 2022, 804, 150146. [Google Scholar] [CrossRef] [PubMed]
  5. Martínez-Santos, M.; Lanzén, A.; Unda-Calvo, J.; Martín, I.; Garbisu, C.; Ruiz-Romera, E. Treated and untreated wastewater effluents alter river sediment bacterial communities involved in nitrogen and sulphur cycling. Sci. Total Environ. 2018, 633, 1051–1061. [Google Scholar] [CrossRef]
  6. Chen, X.; Wang, M.; Kroeze, C.; Chen, X.; Ma, L.; Chen, X.; Shi, X.; Strokal, M. Nitrogen in the Yangtze River Basin: Pollution Reduction through Coupling Crop and Livestock Production. Environ. Sci. Technol. 2022, 56, 17591–17603. [Google Scholar] [CrossRef]
  7. He, Y.; Yuan, Q.; Mathieu, J.; Stadler, L.; Senehi, N.; Sun, R.; Alvarez, P.J. Antibiotic resistance genes from livestock waste: Occurrence, dissemination, and treatment. NPJ Clean Water 2020, 3, 4. [Google Scholar] [CrossRef]
  8. Chen, Y.; Huang, R.; Guan, Y.; Zhuang, T.; Wang, Y.; Tan, R.; Wang, J.; Zhou, R.; Wang, B.; Xu, J.; et al. The profiling of elements and pesticides in surface water in Nanjing, China with global comparisons. Sci. Total Environ. 2021, 774, 145749. [Google Scholar] [CrossRef]
  9. Tian, X.; Qin, B.; Yang, L.; Li, H.; Zhou, W. Association of phthalate exposure with reproductive outcomes among infertile couples undergoing in vitro fertilization: A systematic review. Environ. Res. 2024, 252, 118825. [Google Scholar] [CrossRef]
  10. Gong, X.; Xiong, L.; Xing, J.; Deng, Y.; Qihui, S.; Sun, J.; Qin, Y.; Zhao, Z.; Zhang, L. Implications on freshwater lake-river ecosystem protection suggested by organic micropollutant (OMP) priority list. J. Hazard. Mater. 2024, 461, 132580. [Google Scholar] [CrossRef]
  11. Paluselli, A.; Aminot, Y.; Galgani, F.; Net, S.; Sempéré, R. Occurrence of phthalate acid esters (PAEs) in the northwestern Mediterranean Sea and the Rhone River. Prog. Oceanogr. 2018, 163, 221–231. [Google Scholar] [CrossRef]
  12. Zhang, Y.; Jiao, Y.; Li, Z.; Tao, Y.; Yang, Y. Hazards of phthalates (PAEs) exposure: A review of aquatic animal toxicology studies. Sci. Total Environ. 2021, 771, 145418. [Google Scholar] [CrossRef] [PubMed]
  13. Machtinger, R.; Gaskins, A.J.; Racowsky, C.; Mansur, A.; Adir, M.; Baccarelli, A.A.; Hauser, R. Urinary concentrations of biomarkers of phthalates and phthalate alternatives and IVF outcomes. Environ. Int. 2018, 111, 23–31. [Google Scholar] [CrossRef] [PubMed]
  14. Froger, C.; Quantin, C.; Gasperi, J.; Caupos, E.; Monvoisin, G.; Evrard, O.; Ayrault, S. Impact of urban pressure on the spatial and temporal dynamics of PAH fluxes in an urban tributary of the Seine River (France). Chemosphere 2019, 219, 1002–1013. [Google Scholar] [CrossRef]
  15. Countway, R.E.; Dickhut, R.M.; Canuel, E.A. Polycyclic aromatic hydrocarbon (PAH) distributions and associations with organic matter in surface waters of the York River, VA Estuary. Org. Geochem. 2003, 34, 209–224. [Google Scholar] [CrossRef]
  16. Liu, Y.; Beckingham, B.; Ruegner, H.; Li, Z.; Ma, L.; Schwientek, M.; Xie, H.; Zhao, J.; Grathwohl, P. Comparison of Sedimentary PAHs in the Rivers of Ammer (Germany) and Liangtan (China): Differences between Early- and Newly-Industrialized Countries. Environ. Sci. Technol. 2013, 47, 701–709. [Google Scholar] [CrossRef]
  17. Qi, P.; Qu, C.; Albanese, S.; Lima, A.; Cicchella, D.; Hope, D.; Cerino, P.; Pizzolante, A.; Zheng, H.; Li, J.; et al. Investigation of polycyclic aromatic hydrocarbons in soils from Caserta provincial territory, southern Italy: Spatial distribution, source apportionment, and risk assessment. J. Hazard. Mater. 2020, 383, 121158. [Google Scholar] [CrossRef]
  18. Cai, M.; Liu, M.; Hong, Q.; Lin, J.; Huang, P.; Hong, J.; Wang, J.; Zhao, W.; Chen, M.; Cai, M.; et al. Fate of Polycyclic Aromatic Hydrocarbons in Seawater from the Western Pacific to the Southern Ocean (17.5° N to 69.2° S) and Their Inventories on the Antarctic Shelf. Environ. Sci. Technol. 2016, 50, 9161–9168. [Google Scholar] [CrossRef]
  19. Osińska, A.; Korzeniewska, E.; Harnisz, M.; Felis, E.; Bajkacz, S.; Jachimowicz, P.; Niestępski, S.; Konopka, I. Small-scale wastewater treatment plants as a source of the dissemination of antibiotic resistance genes in the aquatic environment. J. Hazard. Mater. 2020, 381, 121221. [Google Scholar] [CrossRef]
  20. Chen, B.; Liang, X.; Huang, X.; Zhang, T.; Li, X. Differentiating anthropogenic impacts on ARGs in the Pearl River Estuary by using suitable gene indicators. Water Res. 2013, 47, 2811–2820. [Google Scholar] [CrossRef]
  21. Lekunberri, I.; Villagrasa, M.; Balcázar, J.L.; Borrego, C.M. Contribution of bacteriophage and plasmid DNA to the mobilization of antibiotic resistance genes in a river receiving treated wastewater discharges. Sci. Total Environ. 2017, 601–602, 206–209. [Google Scholar] [CrossRef]
  22. Li, F.; Zhang, Y.; Altermatt, F.; Zhang, X. Consideration of Multitrophic Biodiversity and Ecosystem Functions Improves Indices on River Ecological Status. Environ. Sci. Technol. 2021, 55, 16434–16444. [Google Scholar] [CrossRef] [PubMed]
  23. Fanaei, F.; Shahryari, T.; Mortazavi, M.; Nasseh, N.; Pourakbar, M.; Barikbin, B. Hazard identification and integrated risk assessment of drinking water supply system from catchment to consumer based on the World Health Organization’s Water Safety Plan. Desalin. Water Treat. 2023, 286, 257–273. [Google Scholar] [CrossRef]
  24. Song, L.; Xie, K. Engineering CRISPR/Cas9 to mitigate abundant host contamination for 16S rRNA gene-based amplicon sequencing. Microbiome 2020, 8, 80. [Google Scholar] [CrossRef] [PubMed]
  25. Barber, L.B.; Faunce, K.E.; Bertolatus, D.W.; Hladik, M.L.; Jasmann, J.R.; Keefe, S.H.; Kolpin, D.W.; Meyer, M.T.; Rapp, J.L.; Roth, D.A.; et al. Watershed-Scale Risk to Aquatic Organisms from Complex Chemical Mixtures in the Shenandoah River. Environ. Sci. Technol. 2022, 56, 845–861. [Google Scholar] [CrossRef]
  26. Kumar, M.; Saggu, S.K.; Pratibha, P.; Singh, S.K.; Kumar, S. Exploring the role of microbes for the management of persistent organic pollutants. J. Environ. Manag. 2023, 344, 118492. [Google Scholar] [CrossRef]
  27. Zhu, Q.; Xu, L.; Wang, W.; Liu, W.; Liao, C.; Jiang, G. Occurrence, spatial distribution and ecological risk assessment of phthalate esters in water, soil and sediment from Yangtze River Delta, China. Sci. Total Environ. 2022, 806, 150966. [Google Scholar] [CrossRef]
  28. Mojiri, A.; Zhou, J.L.; Ohashi, A.; Ozaki, N.; Kindaichi, T. Comprehensive review of polycyclic aromatic hydrocarbons in water sources, their effects and treatments. Sci. Total Environ. 2019, 696, 133971. [Google Scholar] [CrossRef]
  29. Fabregat-Safont, D.; Gracia-Marín, E.; Ibáñez, M.; Pitarch, E.; Hernández, F. Analytical key issues and challenges in the LC-MS/MS determination of antibiotics in wastewater. Anal. Chim. Acta 2023, 1239, 340739. [Google Scholar] [CrossRef]
  30. Liu, Y.; Su, B.; Mu, H.; Zhang, Y.; Chen, L.; Wu, B. Effects of point and nonpoint source pollution on urban rivers: From the perspective of pollutant composition and toxicity. J. Hazard. Mater. 2023, 460, 132441. [Google Scholar] [CrossRef]
  31. Zhao, K.; Wang, S.; Bai, M.; Wang, S.; Li, F. Distribution, seasonal variation and ecological risk assessment of phthalates in the Yitong River, a typical urban watercourse located in Northeast China. Sci. Total Environ. 2024, 930, 172696. [Google Scholar] [CrossRef] [PubMed]
  32. Ouyang, T.; Liu, J.; Lu, G.; Wang, H.; Li, Y.; Zheng, F.; Gao, P. Pipeline misconnections in separated sewer systems worsen urban river ecological status through stormwater discharge. J. Environ. Manag. 2025, 389, 126100. [Google Scholar] [CrossRef] [PubMed]
  33. Ibekwe, A.M.; Ma, J.; Murinda, S.E. Bacterial community composition and structure in an Urban River impacted by different pollutant sources. Sci. Total Environ. 2016, 566–567, 1176–1185. [Google Scholar] [CrossRef]
  34. Hallas, J.F.; Mackowiak, C.L.; Wilkie, A.C. Mitigating rural WWTP impacts: System dynamics modeling of downstream nutrient outputs. Sci. Total Environ. 2020, 744, 140809. [Google Scholar] [CrossRef]
  35. Han, T.; Gao, L.; Chen, J.; He, X.; Wang, B. Spatiotemporal variations, sources and health risk assessment of perfluoroalkyl substances in a temperate bay adjacent to metropolis, North China. Environ. Pollut. 2020, 265, 115011. [Google Scholar] [CrossRef]
  36. Marizzi del Olmo, A.; López-Doval, J.C.; Hidalgo, M.; Serra, T.; Colomer, J.; Salvadó, V.; Escolà Casas, M.; Medina, J.S.; Matamoros, V. Holistic assessment of chemical and biological pollutants in a Mediterranean wastewater effluent-dominated stream: Interactions and ecological impacts. Environ. Pollut. 2025, 370, 125833. [Google Scholar] [CrossRef]
  37. Tao, H.-Y.; Shi, J.; Zhang, J.; Ge, H.; Zhang, M.; Li, X.-Y. Developmental toxicity and mechanism of dibutyl phthalate and alternative diisobutyl phthalate in the early life stages of zebrafish (Danio rerio). Aquat. Toxicol. 2024, 272, 106962. [Google Scholar] [CrossRef]
  38. Pei, Y.; Luo, K.; Zeng, J.; Gao, J.; Zhang, H. Review of the zebrafish (Danio rerio) model in disinfection by-products (DBPs) toxicity research: Opportunities and challenges. J. Hazard. Mater. 2025, 495, 138976. [Google Scholar] [CrossRef]
  39. Li, Z.; Gong, Y.; Okeke, E.S.; Li, D.; Chen, Y.; Feng, W.; Zhao, T.; Yang, L.; Mao, G.; Wu, X. Novel insights into DBP-induced zebrafish liver inflammatory damage: Ferroptosis activating the HMGB1-TLR4-NF-κB signaling pathway. Environ. Pollut. 2025, 376, 126395. [Google Scholar] [CrossRef]
  40. Gao, M.; Xu, Y.; Liu, Y.; Wang, S.; Wang, C.; Dong, Y.; Song, Z. Effect of polystyrene on di-butyl phthalate (DBP) bioavailability and DBP-induced phytotoxicity in lettuce. Environ. Pollut. 2021, 268, 115870. [Google Scholar] [CrossRef]
  41. Gaur, N.; Narasimhulu, K.; Y, P. Recent advances in the bio-remediation of persistent organic pollutants and its effect on environment. J. Clean. Prod. 2018, 198, 1602–1631. [Google Scholar] [CrossRef]
  42. Guo, W.; Zhang, J.; Sun, Z.; Orem, W.H.; Tatu, C.A.; Radulović, N.S.; Milovanović, D.; Pavlović, N.M.; Chan, W. Analysis of Polycyclic Aromatic Hydrocarbons and Phthalate Esters in Soil and Food Grains from the Balkan Peninsula: Implication on DNA Adduct Formation by Aristolochic Acid I and Balkan Endemic Nephropathy. Environ. Sci. Technol. 2021, 55, 9024–9032. [Google Scholar] [CrossRef] [PubMed]
  43. Li, J.J.; Zhang, X.J.; Yang, Y.; Huang, T.; Li, C.; Su, L.; Zhao, Y.H.; Cronin, M.T.D. Development of thresholds of excess toxicity for environmental species and their application to identification of modes of acute toxic action. Sci. Total Environ. 2018, 616–617, 491–499. [Google Scholar] [CrossRef] [PubMed]
  44. Sigurnjak Bureš, M.; Ukić, Š.; Cvetnić, M.; Prevarić, V.; Markić, M.; Rogošić, M.; Kušić, H.; Bolanča, T. Toxicity of binary mixtures of pesticides and pharmaceuticals toward Vibrio fischeri: Assessment by quantitative structure-activity relationships. Environ. Pollut. 2021, 275, 115885. [Google Scholar] [CrossRef]
  45. Severiano, J.d.S.; de Lima, E.R.P.; de Lucena-Silva, D.; Rocha, D.K.G.; Veríssimo, M.E.S.; Figueiredo, B.R.S.; de Lucena Barbosa, J.E.; Molozzi, J. The role of bioturbation triggered by benthic macroinvertebrates in the effectiveness of the Floc & Lock technique in mitigating eutrophication. Water Res. 2023, 246, 120691. [Google Scholar] [CrossRef]
  46. Cleary, D.W.; Bishop, A.H.; Zhang, L.; Topp, E.; Wellington, E.M.H.; Gaze, W.H. Long-term antibiotic exposure in soil is associated with changes in microbial community structure and prevalence of class 1 integrons. FEMS Microbiol. Ecol. 2016, 92, fiw159. [Google Scholar] [CrossRef]
  47. Pascual-Benito, M.; Ballesté, E.; Monleón-Getino, T.; Urmeneta, J.; Blanch, A.R.; García-Aljaro, C.; Lucena, F. Impact of treated sewage effluent on the bacterial community composition in an intermittent mediterranean stream. Environ. Pollut. 2020, 266, 115254. [Google Scholar] [CrossRef]
  48. Wang, Q.; Liang, J.; Zhao, C.; Bai, Y.; Liu, R.; Liu, H.; Qu, J. Wastewater treatment plant upgrade induces the receiving river retaining bioavailable nitrogen sources. Environ. Pollut. 2020, 263, 114478. [Google Scholar] [CrossRef]
  49. Romero, F.; Sabater, S.; Font, C.; Balcázar, J.L.; Acuña, V. Desiccation events change the microbial response to gradients of wastewater effluent pollution. Water Res. 2019, 151, 371–380. [Google Scholar] [CrossRef]
  50. Nam, K.; Rodriguez, W.; Kukor, J.J. Enhanced degradation of polycyclic aromatic hydrocarbons by biodegradation combined with a modified Fenton reaction. Chemosphere. 2001, 45, 11–20. [Google Scholar] [CrossRef]
  51. Liu, C.; Zhao, D.; Ma, W.; Guo, Y.; Wang, A.; Wang, Q.; Lee, D.J. Denitrifying sulfide removal process on high-salinity wastewaters in the presence of Halomonas sp. Appl. Microbiol. Biotechnol. 2016, 100, 1421–1426. [Google Scholar] [CrossRef] [PubMed]
  52. Chen, S.; Zhou, Y.; Chen, Y.; Gu, J. fastp: An ultra-fast all-in-one FASTQ preprocessor. Bioinformatics 2018, 34, i884–i890. [Google Scholar] [CrossRef] [PubMed]
  53. Mago, T.; Salzberg, S.L. FLASH: Fast length adjustment of short reads to improve genome assemblies. Bioinformatics 2011, 27, 2957–2963. [Google Scholar] [CrossRef] [PubMed]
  54. Edgar, R.C. UPARSE: Highly accurate OTU sequences from microbial amplicon reads. Nat. Methods. 2013, 10, 996–998. [Google Scholar] [CrossRef]
  55. Stackebrandt, E.; Goebel, B.M. Taxonomic Note: A Place for DNA-DNA Reassociation and 16S rRNA Sequence Analysis in the Present Species Definition in Bacteriology. Int. J. Syst. Evol. Microbiol. 1994, 44, 846–849. [Google Scholar] [CrossRef]
  56. Wang, Q.; Garrity, G.M.; Tiedje, J.M.; Cole, J.R. Nave Bayesian Classifier for Rapid Assignment of rRNA Sequences into the New Bacterial Taxonomy. Appl. Environ. Microbiol. 2007, 73, 5261–5267. [Google Scholar] [CrossRef]
  57. Douglas, G.M.; Maffei, V.J.; Zaneveld, J.R.; Yurgel, S.N.; Brown, J.R.; Taylor, C.M.; Huttenhower, C.; Langille, M.G. PICRUSt2 for prediction of metagenome functions. Nat. Biotechnol. 2020, 38, 685–688. [Google Scholar] [CrossRef]
Figure 1. Concentration levels of (a) PAEs, (b) PAHs, and (c) antibiotics.
Water 17 02061 g001
Figure 2. Principal coordinate analysis of organic pollutants in the wastewater treatment plant tailwater influence watershed (WWTPe) and urban river (UR).
Water 17 02061 g002
Figure 3. Mixed toxicity predictions and mixed toxicity contributions in urban streams. (a,b) LC50mix for fish and daphnids, respectively; (c,d) mixed toxicity contributions for fish and daphnids, respectively; black dots represent DBP.
Water 17 02061 g003
Figure 4. Microbial community diversity index. (a) Chao’s index, (b) Shannon’s index, (c) Simpson’s index, and (d) Sobs’ index.
Water 17 02061 g004
Figure 5. Structure of microbial communities analyzed at (a) the phylum level and (b) the genus level.
Water 17 02061 g005
Figure 6. Correlation analysis between microbial communities and physical and chemical indicators. * p ≤ 0.05, ** p ≤ 0.01, *** p ≤ 0.001.
Water 17 02061 g006
Table 1. Detection methods for organic pollutants.
Target CompoundSample PreparationInstrumental AnalysisReferences
PAEsSolid-phase extractionAnalysis via gas chromatography–mass
spectrometry (GC–MS)
[27]
PAHsSolid-phase extractionAnalysis via gas chromatography–mass
spectrometry (GC–MS)
[28]
AntibioticSolid-phase extractionLiquid chromatography–tandem mass
spectrometry(LC-MS/MS)
[29]
Disclaimer/Publisher’s Note: The statements, opinions and data contained in all publications are solely those of the individual author(s) and contributor(s) and not of MDPI and/or the editor(s). MDPI and/or the editor(s) disclaim responsibility for any injury to people or property resulting from any ideas, methods, instructions or products referred to in the content.

