Article

Adapting Newly Constructed Well Depth to Groundwater Level Changes

School of Civil Engineering, Shijiazhuang Tiedao University, Shijiazhuang 050043, China
*
Authors to whom correspondence should be addressed.
Water 2025, 17(14), 2066; https://doi.org/10.3390/w17142066
Submission received: 6 May 2025 / Revised: 6 July 2025 / Accepted: 8 July 2025 / Published: 10 July 2025
(This article belongs to the Section Hydrogeology)

Abstract

Groundwater is a vital resource for human activities, and its level changes influence the depth design and operation of wells. This study analyzed the Hebei Plain using 1127 boreholes to delineate aquifers I–IV via Kriging interpolation. Groundwater and wells were classified. Utilizing over 120,000 wells, this study analyzed depth trends for shallow/deep wells, developed well-depth models, and examined type correlation, while evaluating adjustments in new well depths in response to groundwater level changes. The results reveal shallow groundwater depth decreased by 0.29 m/yr from 2005 to 2019, reaching 73.84 m, and then rebounded 1.22 m/yr during 2019–2021 to 15.27 m; deep groundwater depth declined continuously at 0.78 m/yr over 2005–2021, reaching 105.82 m. Well-depth models show shallow well depths increased over time (peaking at 77.26 m) but project future declines, while deep wells exhibited continuous depth reduction (minimum 180.33 m) with ongoing decrease expected. The sensitivity of newly constructed well depths to groundwater fluctuations had the following order: rural domestic > agricultural > industrial for shallow wells, and agricultural > rural domestic > industrial for deep wells. This study informs future well-depth planning near overexploited zones and supports well optimization, irrigation management, strategy adjustment, and groundwater conservation.

1. Introduction

The decline in groundwater levels directly increases the risk of well failure and shortens well lifespan, thereby posing a potential threat to regional water supply security [1,2,3]. Although existing studies have begun to address well vulnerability [4,5,6], most have focused on evaluating the impacts of anthropogenic activities on existing wells through hydrochemical characteristics and geospatial data [7]. Meanwhile, some researchers have attempted to develop numerical models to analyze the relationship between wellhead protection zoning and vulnerability [5,7,8,9]. In addition, some studies have quantified the response of irrigation wells to climate change by developing vulnerability indices based on standardized positive and negative indicators [6,10]; other studies have employed clustering analysis combined with semi-quantitative frameworks to construct multi-factor models for evaluating well vulnerability [4,11,12,13]. The existing literature indicates that while research on well vulnerability has seen some development, the overall quantity of such studies remains relatively insufficient [4]. In the context of the well–water connection, previous research has primarily focused on evaluating existing policies in response to climate drought, groundwater depletion leading to the failure of existing wells [10]. Few studies have established well-depth prediction models and explored the impact of level changes in groundwater depth (for shallow unconfined aquifers: the vertical distance from the land surface to the groundwater table; for deep semi-confined aquifers: the vertical distance from the ground surface to the water level within the well) on the depth of newly constructed wells (the vertical distance from the land surface to the well bottom). The newly constructed wells mentioned here refer to those built annually. Research on this linkage remains particularly scarce in the Hebei Plain—the world’s largest groundwater depression cone.
Over the past three decades, intensive groundwater over-exploitation in the Hebei Plain has caused a precipitous decline in regional groundwater levels [11] forming the world’s largest deep groundwater depression centered around Cangzhou, Hengshui, and Xingtai [14]. Facing an increasingly severe groundwater situation, Hebei Province launched a pilot project for comprehensive groundwater over-exploitation control in 2014. In the same year, the South-to-North Water Diversion Project (Middle Route) was officially commissioned, reshaping the water supply structure of the Hebei Plain. In addition, to ensure water supply for agriculture [15,16], industry, and urban–rural domestic use [17,18], millions of wells have been constructed across the region [19]. However, following periods of significant groundwater decline and subsequent management interventions, the relationship between the depth of newly constructed wells and variations in groundwater depth remains unclear.
In light of this, the present study selects the Hebei Plain as a research area to investigate the temporal and spatial distribution characteristics of shallow and deep groundwater depths; analyze the variation patterns of newly constructed shallow/deep well depths and develop well-depth prediction models; and examine the adaptive relationships between different types of newly constructed wells and groundwater depth changes. This research explores well-depth models in groundwater over-exploitation zones and their adjacent areas, conducting a refined investigation into the relationships between newly constructed well depths (both shallow and deep) and variations in groundwater depth (shallow and deep). The results provide scientific support for future well-depth planning in Hebei Plain and offer important references for regional groundwater resource management.

2. Materials and Methods

2.1. Study Area

The Hebei Plain (35°70′–40°30′ N, 114°53′–119°51′ E), an integral part of the North China Plain and situated within the Haihe River Basin, spans an area of approximately 74,325 km2 [20] (Figure 1). This region experiences a temperate humid semi-arid continental monsoon climate, with an average annual precipitation of 500–600 mm [21,22]. Annual water resources per capita amount to 386 m3, representing one-eighth of China’s national average [23]. The region heavily depends on groundwater, with an annual extraction volume of 10.579 billion m3, of which approximately 2.878 billion m3 is from over-exploitation. High population density, intensive agricultural irrigation, and predominantly cultivated land use collectively accelerate groundwater depletion [24].
The Hebei Plain comprises three geomorphic units: the western piedmont alluvial-pluvial fan zone, central plain zone, and coastal plain zone [16]. The piedmont fan zone is predominantly composed of coarse-grained sand and gravel strata with low clay content, exhibiting conductivity ranging from 420 to 600 μS/cm. In contrast, both central and coastal plains display significant spatial heterogeneity in clay layer distribution. The Central Plain demonstrates conductivity values between 600 and 1800 μS/cm, while the Coastal Plain reaches conductivities of ≥3000 μS/cm (Figure 2).
From 1900 to 2022, the number of wells with recorded depth data reached 12.04 million (Figure 3). The number of new wells increased slowly from 1965 to 1993, accelerated from 1994 to 2013, and decreased sharply after reaching the peak in 2013. The surge in well construction around 1990 was primarily driven by Hebei Province’s rapid implementation of projects in response to the State Council’s directive, Decision on Vigorously Promoting the Construction of Farmland Water Conservancy Infrastructure. The extensive groundwater over-exploitation and the large number of wells make the Hebei Plain a representative region for studying the adaptation of newly constructed well depths to groundwater level changes.

2.2. Methods

The stratigraphic data from 1127 boreholes (Figure 1) were used to determine the burial depths and average thicknesses of the aquifer groups I, II, III, and IV within the Hebei Plain using kriging interpolation [8,25]. The burial depths of the four aquifer groups are as follows: −25.45 m for Group I, −128.96 m for Group II, −251.50 m for Group III, and −396.28 m for Group IV. The corresponding average thicknesses are 25.45 m, 103.50 m, 148.00 m, and 144.78 m. Among the four aquifers, Aquifer I is unconfined (i.e., water table aquifer). The confined aquifers are partially connected in the piedmont zone, but are mostly hydraulically isolated in the central plains due to the presence of confining layers. Groundwater in Groups I and II is more susceptible to fluctuations caused by climate and human activities, whereas Groups III and IV are relatively stable. Therefore, Groups I and II are classified as shallow groundwater, and Groups III and IV as deep groundwater. Accordingly, wells tapping into Groups I and II are defined as shallow wells, while those accessing Groups III and IV are considered deep wells [16]. Specifically, wells extending beyond Aquifer IV are minimally affected by groundwater fluctuations and thus excluded from consideration.
This study employs average groundwater level change rate (unit: m/yr) and average absolute deviation (unit: m) to comprehensively evaluate the fluctuation characteristics of groundwater near different well types. Additionally, Spearman’s rank correlation coefficient was used to analyze the relationship between groundwater depth and well depth, evaluating the adaptation capacity of different well types to groundwater depth changes (Figure 4). The average groundwater level change rate primarily characterizes long-term trends in groundwater depth variations, such as annual decline/rise rates, reflecting the overall directional tendency of groundwater depth changes. Meanwhile, the mean absolute deviation quantifies the magnitude of short-term fluctuations around the mean water level during specific periods (e.g., intra-annual variations), providing concrete metrics for deviation severity. The synergistic application of these two indicators enables a multi-dimensional characterization of groundwater level changes from both long-term trends and short-term variability perspectives, thereby facilitating a more precise understanding of actual groundwater depth behaviors.
For the correlation analysis, this study employed the Spearman rank correlation coefficient (ρ) to assess the relationship between groundwater depth and the depth of newly constructed wells. Spearman’s rank correlation is a non-parametric method that measures the strength and direction of monotonic relationships between variables. Compared with the Pearson correlation coefficient, the Spearman rank correlation coefficient is more robust, less sensitive to outliers, and does not rely on the assumption of data normality. This is particularly important in groundwater system studies, as groundwater data often deviate from normality and may include outliers. If the normality assumption is not met, applying the Pearson correlation coefficient may result in misleading conclusions or an under-/overestimation of correlation strength. Therefore, the Spearman rank correlation coefficient was adopted to improve the accuracy and robustness of the results. The coefficient level of Spearman rank correlation coefficient can be seen in Table 1.

3. Results

3.1. The Variation Trend of Well Depth with Time

Given the limited well data available after 2019, and the potential influence of local hydrogeological factors on the number of newly constructed wells, this research focuses on the well data from 1965 to 2018 to analyze the depth of newly constructed shallow and deep wells (Figure 5). Over the past 54 years, the depth of newly constructed shallow wells has shown an increasing trend, deepening by approximately 27.09 m, with the average depth reaching 77.13 m in 2018. This trend may be associated with groundwater over-exploitation in the region [26]. In contrast, the depth of newly constructed deep wells has exhibited a decreasing trend over time, becoming shallower by approximately 69.89 m over 54 years and reaching around 180.33 m in 2018. This trend may be related to long-term groundwater over-extraction control policies implemented in the region [27,28].
Under current conditions, shallow well depths exhibit an initial deepening followed by shallowing over time, conforming to the pattern described by Equation (1), and reached a peak depth of 70.65 m in 2014 before subsequent shallowing. Conversely, deep well depths demonstrate gradual shallowing according to Equation (2), yet are constrained by critical physical limits: their depths cannot be shallower than the aquiclude at the confined aquifer top. It is noteworthy that within the real number domain, the variation trajectories of shallow and deep well depths show no intersection points.
Shallow Well Depth Model:
 y1 = 57,067.98 + 58.82x − 0.02x2
Deep Well Depth Model:
y2 =  −51,425.08  + 51.13x  −  0.01x2
where x denotes the year,  y1 represents the depth of shallow wells, and y2 indicates the depth of deep wells.
In investigating the diverse applications of wells, it was observed that there are significant differences in well design depths. The following section explores the adaptation of different well types to groundwater level changes, aiming to determine which type of well exhibits higher sensitivity to these fluctuations. To this end, we categorize the wells into the following seven types: service wells, urban centralized water supply wells, urban domestic wells, rural water supply plant source wells, industrial wells, rural domestic wells, and agricultural irrigation wells.
Given the differences in groundwater utilization and impact between shallow and deep wells, this study conducted a statistical analysis of the seven well categories, categorized into shallow and deep wells. The statistical results, as shown in Table 2, indicate a total of 120,375 wells, with 81,491 shallow wells, accounting for 67.70%, and 38,877 deep wells, accounting for 32.30%.
Given the low representation of service wells, urban centralized water supply wells, and urban domestic wells—together accounting for only 0.3% of the total—and the lack of shallow-well data for rural water supply plant source wells, these four well categories were excluded from further statistical analysis. This study instead focuses on the three major well types: agricultural irrigation wells, rural domestic wells, and industrial wells, which collectively account for 98.77% of the total. The relationship between well depths and groundwater fluctuations is examined through both groundwater level change rates and correlation analysis.
Due to limited groundwater depth data availability in subsequent years—specifically, only records from 2005, 2010, 2015, 2018, 2019, 2020, and 2021—this analysis exclusively examines well-depth statistics for agricultural irrigation, rural domestic, and industrial wells during these periods (Figure 6). Notably, shallow rural domestic wells (2019–2021), shallow agricultural irrigation wells (2021), deep rural domestic wells (2019–2020), and deep agricultural irrigation wells (2021) were excluded from analysis owing to insufficient sample sizes (<5 wells per category).
For shallow agricultural irrigation wells, depths predominantly clustered within 50–100 m, with mean values initially increasing and then decreasing, peaking at 81.6 m. Shallow rural domestic wells exhibited depths concentrated between 50 and 120 m, reaching a maximum mean depth of 95 m. Shallow industrial wells displayed depths spanning 50–135 m, achieving a peak mean of 99 m. Among shallow wells, industrial wells demonstrated the greatest depths, rural domestic wells exhibited intermediate depths, and agricultural irrigation wells showed the shallowest depths.
For deep wells, agricultural irrigation wells were mostly concentrated between 80–320 m, with a maximum average depth of 237.14 m (noting that 2021 data were limited). Rural domestic deep wells ranged from 150 to 390 m, with a peak average of 280.75 m, while industrial deep wells ranged from 125 to 530 m, reaching a maximum average of 335 m. Among deep wells, average depths increased in the order: agricultural < rural domestic < industrial. These differences may reflect varying requirements for groundwater quality, supply stability, and well construction costs across well types.

3.2. Characterization of the Spatial and Temporal Distribution of Groundwater Variability

Based on the aquifer division method, groundwater was classified as shallow if it belonged to Aquifers I and II, and as deep if it belonged to Aquifers III and IV. The spatial distribution of shallow and deep groundwater depths was mapped for the years 2005, 2010, 2015, 2018, 2019, 2020, and 2021 (Figure 7 and Figure 8, respectively), providing a basis for further analysis and discussion.
Spatially, the depth to shallow groundwater exhibits a pattern of being shallower in the northeast and deeper in the southwest, with the maximum depth occurring near Shijiazhuang and Xingtai. The maximum and average depths to groundwater across the study area increased at rates of 0.29 m/yr and 1.60 m/yr, respectively, reaching their peaks in 2019 at 73.84 m and 17.71 m. From 2019 to 2021, the maximum and average groundwater depths rebounded at rates of 0.31 m/yr and 1.22 m/yr, reaching 73.22 m and 15.27 m, respectively. The observed groundwater recovery after 2019 may be associated with local policy interventions [29].
The spatial pattern of deep groundwater depth exhibits a trend of increasing depth toward the southeast and shallower conditions toward the northeast. Moreover, the area affected by groundwater decline has been gradually expanding. The greatest groundwater depth is observed in the vicinity of Cangzhou and Hengshui. From 2005 to 2020, the maximum and average depths to deep groundwater increased at rates of 1.00 m/yr and 0.78 m/yr, respectively, reaching peak values of 105.82 m and 48.87 m in 2020. In 2018 and 2021, the depth to deep groundwater fluctuated by 0.67 m/yr and 1.24 m/yr, respectively, which falls within the normal range of variability.
The spatial distribution of newly constructed shallow and deep wells for industrial, rural domestic, and agricultural irrigation purposes in 2005, 2010, 2015, 2018, 2019, 2020, and 2021 is shown in Figure 9. The average change rate and average absolute deviation of groundwater depth near these three well types are also illustrated in Figure 10.
During 2005–2018, the average change rate of groundwater level near agricultural and industrial wells was positive (indicating increasing depths), signifying groundwater level decline around shallow wells of these types. Conversely, rural domestic wells showed a negative change rate of groundwater level (reflecting decreasing depth to water table), denoting a general rise in water table around them.
In terms of fluctuation magnitude, rural domestic wells demonstrated the greatest magnitude of fluctuations among the three well types, with a maximum absolute deviation reaching 18.77 m/yr. The fluctuation amplitude near both shallow industrial and agricultural wells displayed progressive intensification over time, with industrial wells consistently exhibiting persistently greater variations than agricultural wells.
During 2005–2018, deep agricultural and rural domestic wells exhibited positive average groundwater level change rates, along with increasing mean absolute deviations, indicating an accelerating deepening of groundwater. For deep industrial wells, the trend in groundwater depth change was unclear, but variability around them gradually increased. Among deep wells, rural domestic wells showed greater groundwater fluctuations than agricultural wells, while industrial wells experienced the smallest variation. These differences in groundwater fluctuation characteristics near various well types may be influenced by factors such as artificial recharge policies and well-depth characteristics [30,31].

3.3. Analysis of Well Depth Responsiveness

Due to data limitations, this study performed a correlation analysis between groundwater depth data for the years 2005, 2010, 2015, 2018, 2019, 2020, and 2021, and the depths of newly constructed wells. The analysis was conducted under two scenarios: Scenario I—shallow wells and shallow groundwater, and Scenario II—deep wells and deep groundwater. Both well types and groundwater layers exhibited positive correlations in both scenarios, but the strength of the correlations varied (Table 3).
In Scenario I, the correlation for agricultural irrigation wells was stronger compared to the other two well types. The correlation coefficient for agricultural irrigation wells showed an increasing trend, shifting from a moderate to a strong correlation. For rural domestic wells, the ρ-values ranged from 0.49 to 0.86, showing a trend of moving from moderate to very strong correlation. For industrial wells, there were two years with insignificant correlations, while the correlation for the remaining years showed an upward trend, but remained lower than that for rural domestic wells.
In Scenario II, the ρ-values for agricultural irrigation wells generally ranged from 0.63 to 0.94, indicating strong correlations, which were higher than those observed in Scenario I. The correlation for rural domestic wells was approximately 0.50. Industrial wells only showed a weak correlation between deep groundwater depth and well depth in 2010, which was lower than that of rural domestic wells.

4. Discussion

Many regions worldwide are experiencing a sustained decline in groundwater levels [32,33,34], with the Hebei Plain in China being particularly notable [35,36]. The shallow groundwater depth in the Hebei Plain exhibits a spatial pattern of being shallower in the northeast and deeper in the southwest. From 2005 to 2019, the depth of shallow groundwater in the region exhibited a spatial trend of deepening from northeast to southwest, with an average deepening rate of 0.24 m/yr. The maximum depth near Shijiazhuang reached 73.84 m, consistent with previous studies [25,37]. From 2019 to 2021, shallow groundwater levels rebounded at a rate of 0.81 m/yr, attributed to the implementation of the South-to-North Water Diversion Project and comprehensive groundwater over-exploitation management measures [29,30,37]. In 2019 and 2020, the average shallow groundwater depths were 17.71 m and 17.26 m, respectively. Although both years exhibited a rising trend, the difference was minimal, which may be attributed to similar temperature and precipitation patterns during these years. Notably, the volume of water diverted from external sources in 2020 increased by 57% compared to 2019 [29]. The spatial distribution of deep groundwater depth exhibits a pattern of greater depths in the southeast and shallower levels toward the northeast. The maximum depth, recorded near Hengshui and Cangzhou, reached 105.82 m. The locations of the maximum buried depths for both shallow and deep groundwater coincide with the groundwater funnel area [38]. The shallow and deep groundwater depths in the Hebei Plain exhibit contrasting spatial distribution patterns, primarily due to differences in hydrogeological conditions and groundwater extraction practices between the eastern and western regions. In the west, shallow groundwater is relatively abundant and primarily recharged by lateral inflow from piedmont areas and precipitation infiltration. However, prolonged extraction has led to increased burial depth of shallow groundwater [16]. In contrast, the eastern region suffers from shallow groundwater scarcity and poor water quality, thus relying heavily on deep groundwater resources. Continuous overexploitation in this area has significantly deepened the depth to deep groundwater, ultimately resulting in opposite spatial trends between shallow and deep groundwater depths.
In addition, the depth of newly constructed shallow wells has shown a continuous increasing trend since 1965, with the maximum average depth reaching 77.13 m. This pattern is likely associated with declining precipitation and falling shallow groundwater levels during 1960–2018 [39,40,41], which necessitated the continuous deepening of wells to ensure adequate water withdrawal [42]. The shallow-well-depth model indicates that shallow wells reached a peak depth of 70.65 m in 2014, after which their depths began to shallow. This trend may be influenced by multiple factors, including increased diverted water volume from the South-to-North Water Diversion Project, the promotion of water-efficient irrigation technologies, and rising construction costs for wells [28,43].
In contrast to the trend observed in newly constructed wells, many earlier wells have not undergone significant changes in depth. This may be attributed to relatively stable groundwater conditions in those areas or the fact that the original well depths remain sufficient to meet water demand, making reconstruction or modification unnecessary. Moreover, in most overexploited areas, older wells are often not deepened due to cost constraints; instead, new wells are constructed as a supplement [26]. Existing studies have also noted the widespread abandonment or decommissioning of older wells [8,26,44].
This study also found that the spatial distribution of deep wells has shifted significantly over time. The results of this study show that the proportion of new deep well construction in Hengshui and Cangzhou decreased from 56.10% in the early stage to less than 10% in the later stage, while the proportion of Baoding and Xingtai increased from 21.13% to 51.42% before subsequently decreasing. This shows that the construction of deep wells has transferred from deep water areas to shallow water areas, which is in line with the law of the deviation direction of the center of gravity of groundwater exploitation in this region [45]. The deep-well-depth model also indicates that deep well depths will continue to shallow in the future. This spatial shift is not only influenced by groundwater conditions, but also closely related to well construction costs and local policy regulations. In general, deeper wells entail higher construction costs [26] Moreover, the Hebei provincial government has imposed increasingly strict regulations on the construction of deep wells in overexploited areas. For example, the Provisional Measures for Urban Groundwater Management in Hebei Province (issued in 1970 and 1981) and the Implementation Measures of the Water Law of the People’s Republic of China in Hebei Province (revised in 2010, 2016, and 2023) have successively tightened restrictions on well depth and groundwater abstraction permits [27], expanded regulatory coverage, and strengthened approval procedures [28].
This study found that shallow groundwater fluctuations near newly constructed shallow wells varied significantly by well type. Rural domestic wells exhibited the greatest variability, followed by industrial wells, with agricultural irrigation wells showing the least (e.g., the maximum multi-year absolute deviations were 18.77 m/yr for rural wells, 17.80 m/yr for industrial wells, and 13.21 m/yr for agricultural wells). These differences may be attributed to local groundwater management strategies. Local authorities prioritize domestic and industrial water supply during external water transfers, directly inducing significant water-level fluctuations (notably rebounds) in these zones [46]. Conversely, advanced irrigation technologies (drip/micro-sprinkler systems) adopted in agriculture facilitated groundwater recovery near agricultural wells post-2019 [13] Combining this with the correlation between newly constructed shallow well depths and shallow groundwater depths, we found that rural domestic wells exhibit the greatest groundwater fluctuations with moderate correlation between well depth and water table depth, indicating highest sensitivity to aquifer level changes; Agricultural wells, though exhibiting the least groundwater variation, had the highest correlation between well depth and water table, indicating a strong depth response. Industrial wells showed intermediate levels of groundwater fluctuation but had the weakest correlation, suggesting the lowest sensitivity. The differing adaptation of agricultural and industrial wells to groundwater fluctuation characteristics may be partly explained by well depth. Long-term average depths of agricultural shallow wells remained below 95 m, while industrial shallow wells averaged up to 99 m. This depth difference may account for the higher sensitivity of agricultural wells to groundwater fluctuations.
For newly constructed deep wells, deep groundwater fluctuations varied by well type. Rural domestic wells showed the greatest variation, followed by agricultural irrigation wells, while industrial wells exhibited the least fluctuation. In terms of correlation between well depth and deep groundwater depth, newly constructed agricultural irrigation wells displayed the strongest relationship. In contrast, rural domestic and industrial wells showed weaker correlations, though rural wells were slightly more correlated than industrial ones. These results suggest that newly constructed agricultural deep wells are the most sensitive to groundwater level changes, followed by rural domestic wells, with industrial wells being the least sensitive. Such differences may largely result from variations in well depth across well types [11,47]. Over the years, the depth ranges of agricultural, rural domestic, and industrial deep wells have been approximately 80–320 m, 150–390 m, and 125–530 m, respectively. In some cases, however, the depth of newly constructed wells did not correlate strongly with groundwater depth. This may be attributed to the omission of climatic and environmental factors such as local temperature, precipitation, and evaporation. Therefore, future models aimed at predicting well-depth requirements should incorporate these hydrometeorological variables, in combination with groundwater governance policies, to improve model accuracy and applicability.
From a broader planning standpoint, the implementation of new well projects should increasingly consider regional hydrogeological constraints, long-term water resource sustainability, and policy-driven groundwater control measures. In areas with severe over-exploitation, shallow wells may be discouraged in favor of managed recharge or alternative water sources, while deep wells should be subject to stricter regulation to avoid further depletion of confined aquifers.

5. Conclusions

This study utilized data from 1127 boreholes to extract aquifer information, categorizing groundwater and wells into shallow and deep layers. Specifically, it investigated variations in groundwater depth, changes in newly constructed well depths, establishment of shallow and deep-well-depth models, and adaptive adjustments of well depth in response to groundwater level fluctuations. The key findings are summarized as follows:
(1)
The evolution of the regional groundwater system shows significant spatial differentiation and temporal trends. The distinct spatial pattern of shallow groundwater depth (high in the east/south and low in the west/north) and the opposite pattern of deep groundwater depth reveal the profound influence of geological structural background and differentiated extraction pressure on different aquifer systems. Between 2005–2019, shallow groundwater depth declined continuously at a rate of 0.29 m/yr, followed by a marginal recovery (1.22 m/yr) during 2019–2021. Meanwhile, deep groundwater depth decreased at 0.78 m/yr from 2005 to 2021. This differentiation pattern of recent local improvement in shallow groundwater and continuous deterioration in deep groundwater is a phenomenon worthy of high attention in the management of groundwater over-exploitation in semi-arid alluvial plain areas.
(2)
The strategy for the depth of newly constructed wells has changed, reflecting an adaptive adjustment to the changes in groundwater. Between 1965 and 2018, shallow well-depth models revealed that newly constructed shallow wells initially deepened to a maximum average depth of 77.26 m before subsequent decreasing, with projections indicating continued decreasing. Conversely, newly constructed deep wells exhibited a decreasing trend (reaching a minimum average depth of 180.33 m), with forecasts suggesting persistent decreasing. This phenomenon of shallow wells deepening and then shallowing, and deep wells shallowing, is important evidence that the depth of newly built wells in global groundwater over-exploitation areas has been adjusted to adapt to the governance after water resource depletion.
(3)
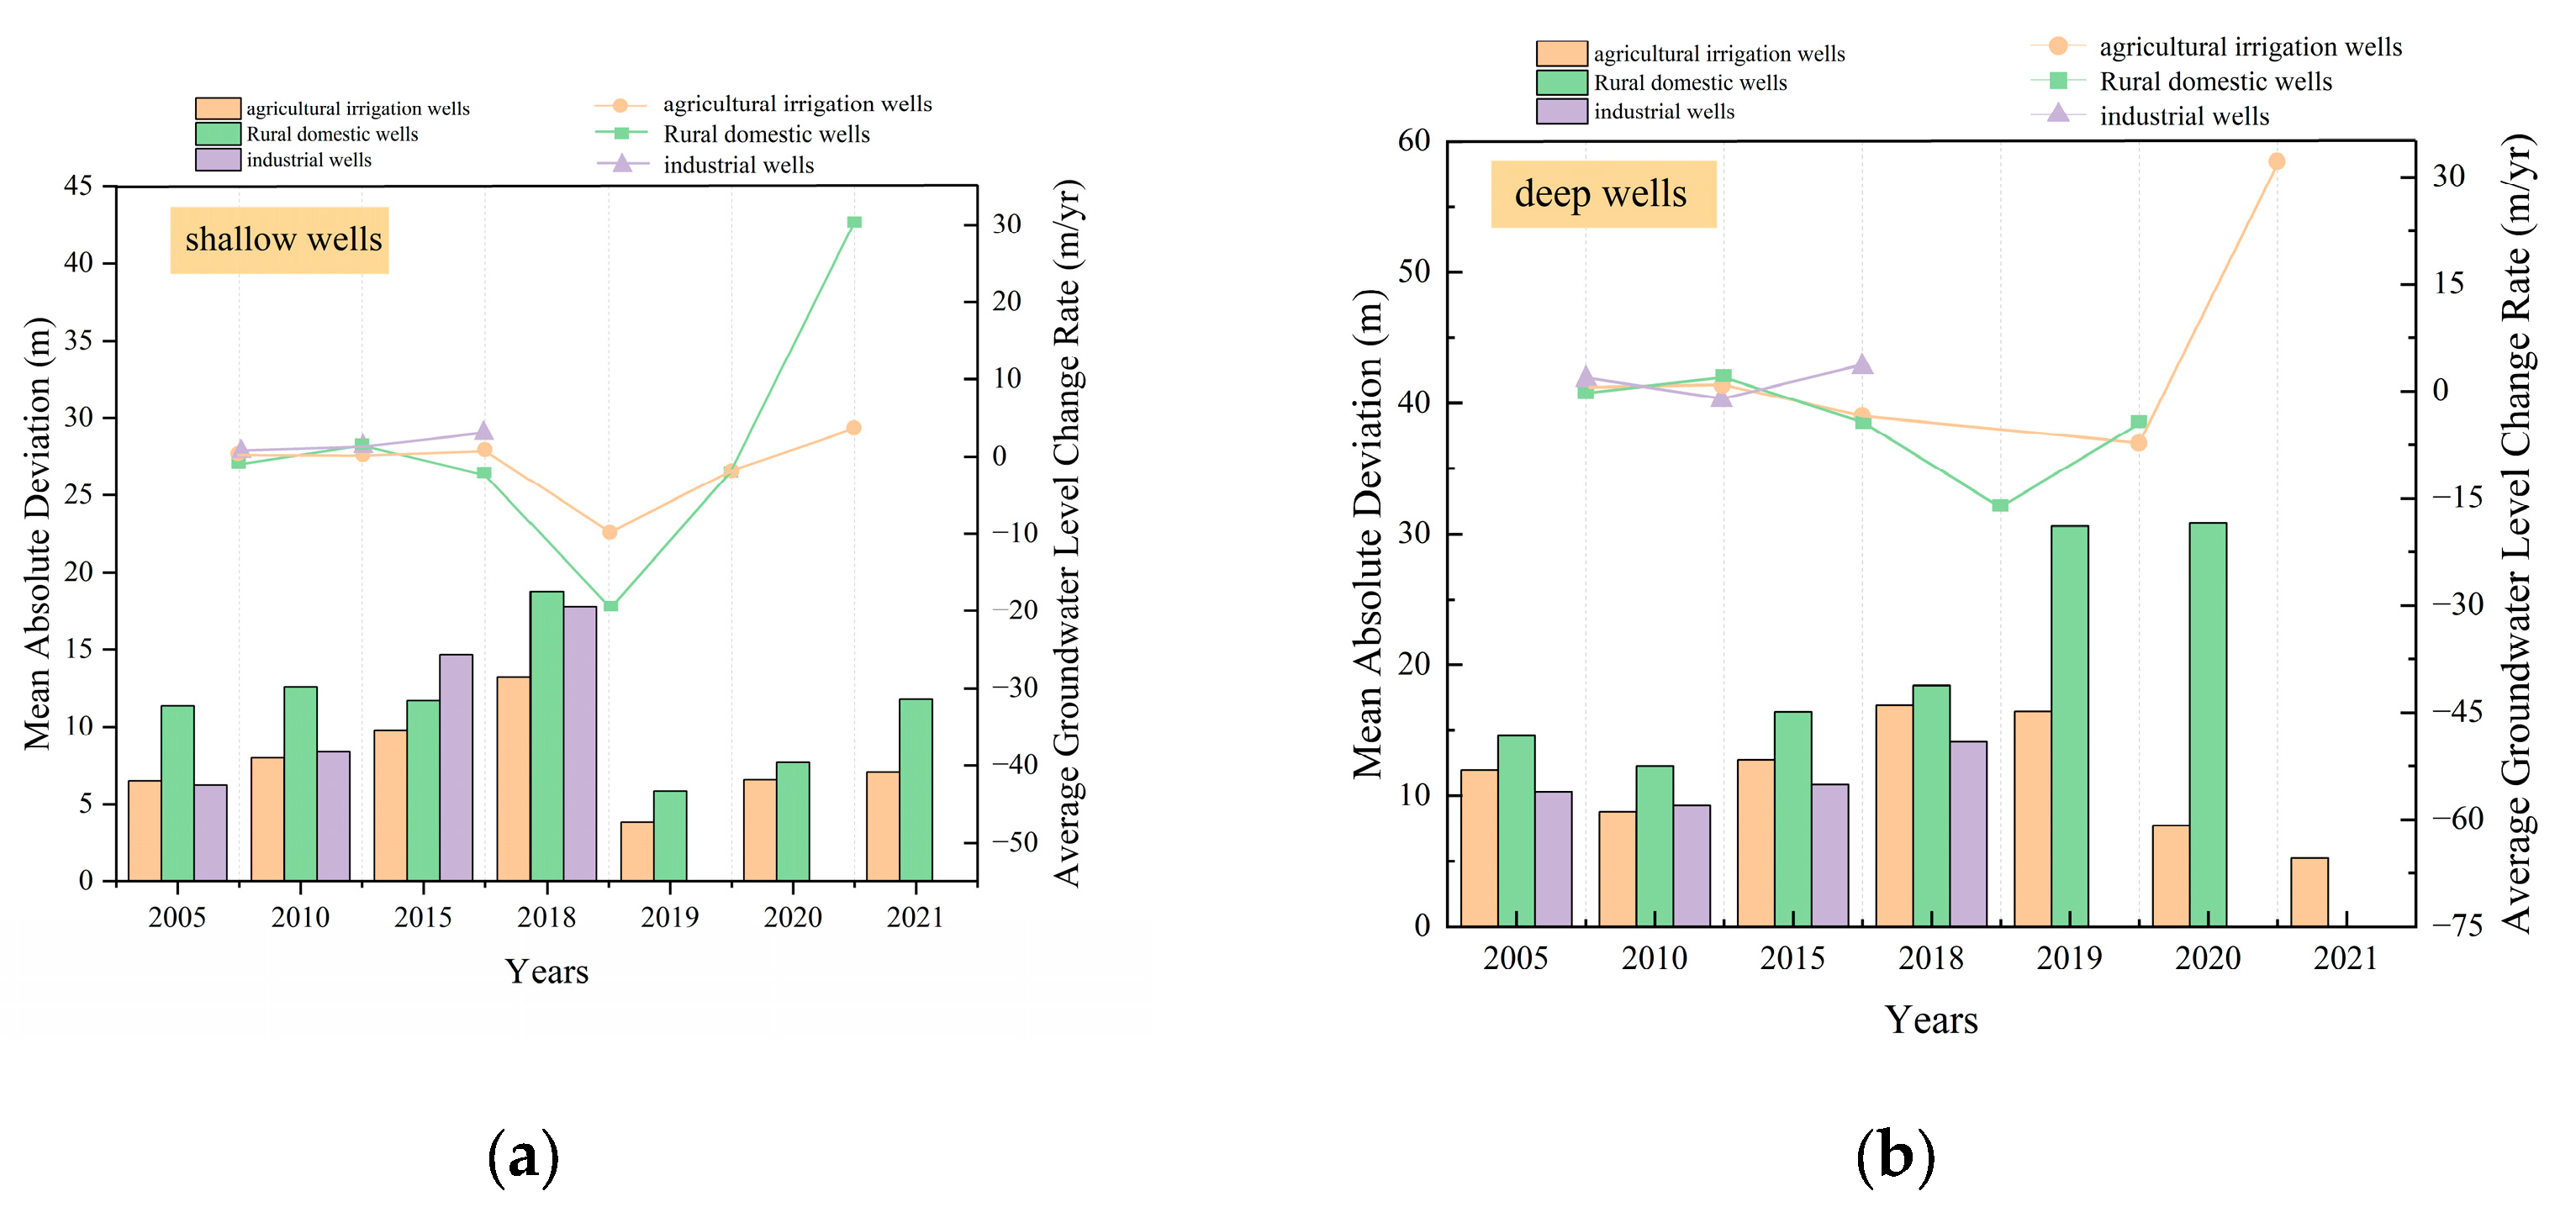
Against the backdrop of sustained regional groundwater decline (shallow: 0.29 m/yr, deep: 0.78 m/yr), wells serving different water utilization types exhibit differentiated impacts on groundwater level fluctuation patterns. For shallow groundwater, the most pronounced fluctuations occur near rural domestic wells, significantly exceeding those near industrial wells, while the weakest fluctuations are observed around agricultural irrigation wells. In contrast, for deep groundwater, fluctuations are highest around agricultural irrigation wells, followed by industrial wells, with the least variation near rural domestic wells. This indicates: although regional groundwater depletion is driven by a combination of climatic and anthropogenic factors, water utilization patterns determine the amplitude characteristics of local fluctuations. Consequently, in areas with high fluctuation intensity (e.g., shallow domestic/deep agricultural well perimeters), new well construction requires additional depth increments equivalent to historical maximum fluctuation amplitudes to mitigate risks of extreme water level fluctuations.
(4)
The adaptability of newly constructed well depths to groundwater depth variations demonstrates type dependency and stratum specificity. In shallow aquifers, rural domestic wells exhibit the highest sensitivity, followed by agricultural wells, with industrial wells showing the weakest response. Conversely in deep aquifers, agricultural wells display the greatest sensitivity, succeeded by rural domestic wells, while industrial wells remain least responsive.
The above research results not only provide references for the comprehensive management of groundwater over-exploitation in the Hebei Plain and the optimization of shallow and deep-well-depth planning, but more importantly, reveal the laws governing groundwater depth evolution, human adaptive behavior (well-depth adjustment), and their interactions under the background of multi-layer aquifer systems and diversified water demand. These laws, especially the shift in well-depth strategies and the sensitivity of different types of newly constructed wells to groundwater changes, hold significant reference value and serve as a warning for alluvial plains and arid and semi-arid agricultural areas worldwide facing similar groundwater sustainability challenges. Naturally, the factors influencing the depth of newly constructed wells are complex, such as environmental changes, well construction costs, and policy incentives, yet this study has not comprehensively addressed these factors. Future research can develop multivariate predictive models to more comprehensively simulate and predict well-depth trends, to support more refined decision-making in sustainable groundwater resource management.

Author Contributions

Conceptualization, B.L.; methodology, B.L. and Y.L.; software, Y.L.; validation, S.Z. and M.L.; formal analysis, Y.L. and M.L.; investigation, Y.G.; resources, B.L. and H.Z.; data curation, H.Z.; writing—original draft preparation, S.Z., Y.C. and Y.L.; writing—review and editing, B.L.; visualization, M.L. and Y.G.; supervision, Y.G.; project administration, H.Z.; funding acquisition, B.L. and S.Z. All authors have read and agreed to the published version of the manuscript.

Funding

This research was funded by the Hebei Provincial Department of Education Youth Fund Project (grant number QN2023158); Open Research Fund of State Key Laboratory of Simulation and Regulation of Water Cycle in River Basin (China Institute of Water Resources and Hydropower Research) (grant number IWHR-SKL-KF202316) and The APC was funded by Shaoxiong Zhang.

Data Availability Statement

The data that support the findings of this study are available from Department of Water Resources of Hebei Province but restrictions apply to the availability of these data, which were used under license for the current study, and so are not publicly available. Data are, however, available from the authors upon reasonable request and with permission of Department of Water Resources of Hebei Province.

Acknowledgments

We extend our gratitude to the Department of Water Resources of Hebei Province for drilling and well data. During the preparation of this work the authors used ERNIE Bot (version 4.5) in order to improve the language used and help create a consistent paper. After using this tool/service, the authors reviewed and edited the content as needed and take full responsibility for the content of the publication.

Conflicts of Interest

The authors declare no conflicts of interest.

References

  1. Bostic, D.; Mendez-Barrientos, L.; Pauloo, R.; Dobbin, K.; MacClements, V.J.S.R. Thousands of domestic and public supply wells face failure despite groundwater sustainability reform in California’s Central Valley. Sci. Rep. 2023, 13, 14797. [Google Scholar] [CrossRef] [PubMed]
  2. Jasechko, S.; Perrone, D. California’s Central Valley Groundwater Wells Run Dry During Recent Drought. Earth’s Future 2020, 8, e2019EF001339. [Google Scholar] [CrossRef]
  3. Perrone, D.; Jasechko, S. Deeper well drilling an unsustainable stopgap to groundwater depletion. Nat. Sustain. 2019, 2, 773–782. [Google Scholar] [CrossRef]
  4. Zanotti, C.; Rotiroti, M.; Caschetto, M.; Redaelli, A.; Bozza, S.; Biasibetti, M.; Mostarda, L.; Fumagalli, L.; Bonomi, T. A cost-effective method for assessing groundwater well vulnerability to anthropogenic and natural pollution in the framework of water safety plans. J. Hydrol. 2022, 613, 128473. [Google Scholar] [CrossRef]
  5. Huan, H.; Wang, J.; Lai, D.; Teng, Y.; Zhai, Y. Assessment of well vulnerability for groundwater source protection based on a solute transport model: A case study from Jilin City, northeast China. Hydrogeol. J. 2015, 23, 581–596. [Google Scholar] [CrossRef]
  6. Shin, H.J.; Lee, J.Y.; Jo, S.M.; Cha, S.S.; Park, C.G. Vulnerability assessment of upland public groundwater wells against climate change. J. Korean Soc. Agric. Eng. 2020, 47, 577–596. [Google Scholar] [CrossRef]
  7. Carolina, B.; Morello-Frosch, R.; Hubbard, A.; Ray, I. Social disparities in nitrate-contaminated drinking water in California’s San Joaquin Valley. Environ. Health Perspect. 2011, 119, 1272–1278. [Google Scholar]
  8. Pauloo, R.; Escriva-Bou, A.; Dahlke, H.; Fencl, A.; Guillon, H.; Fogg, G. Domestic well vulnerability to drought duration and unsustainable groundwater management in California’s Central Valley. Environ. Res. Lett. 2020, 15, 044010. [Google Scholar] [CrossRef]
  9. Soriano, M.A.,, Jr.; Siegel, H.G.; Gutchess, K.M.; Clark, C.J.; Li, Y.; Xiong, B.; Plata, D.L.; Deziel, N.C.; Saiers, J.E. Evaluating Domestic Well Vulnerability to Contamination from Unconventional Oil and Gas Development Sites. Water Resour. Res. 2020, 56, e2020WR028005. [Google Scholar] [CrossRef]
  10. Shin, H.-J.; Lee, J.-Y.; Jo, S.-M.; Jeon, S.-M.; Kim, M.-S.; Cha, S.-S.; Park, C.-G. Vulnerability evaluation of groundwater well efficiency and capacity in drought vulnerable areas. J. Korean Soc. Gricultural Eng. 2019, 61, 41–53. [Google Scholar]
  11. Zhong, H.; Sun, L.; Fischer, G.; Tian, Z.; Velthuizen, H.v.; Liang, Z. Mission Impossible? Maintaining regional grain production level and recovering local groundwater table by cropping system adaptation across the North China Plain. Agric. Water Manag. 2017, 193, 1–12. [Google Scholar] [CrossRef]
  12. Perrone, D.; Jasechko, S. Dry groundwater wells in the western United States. Environ. Res. Lett. 2017, 12, 104002. [Google Scholar] [CrossRef]
  13. Wang, Y.; Zhang, Y.; Zhang, R.; Li, J.; Zhang, M.; Zhou, S.; Wang, Z. Reduced irrigation increases the water use efficiency and productivity of winter wheat-summer maize rotation on the North China Plain. Science of the Total Environment 2018, 618, 112–120. [Google Scholar] [CrossRef] [PubMed]
  14. Chen, X.; Wang, P.; Muhammad, T.; Xu, Z.; Li, Y. Subsystem-level groundwater footprint assessment in North China Plain—The world’s largest groundwater depression cone. Ecol. Indic. 2020, 117, 106662. [Google Scholar] [CrossRef]
  15. Feng, W.; Zhong, M.; Lemoine, J.M.; Biancale, R.; Hsu, H.T.; Xia, J. Evaluation of groundwater depletion in North China using the Gravity Recovery and Climate Experiment (GRACE) data and ground-based measurements. Water Resour. Res. 2013, 49, 2110–2118. [Google Scholar] [CrossRef]
  16. Zhou, H.; Wu, C.; Li, B.; Lu, C.; Zhao, Y.; Zhao, Z. Classification of deep and shallow groundwater wells based on machine learning in the Hebei Plain North China. Sci. Rep. 2024, 14, 18166. [Google Scholar] [CrossRef]
  17. Liu, J.; Zang, C.; Tian, S.; Liu, J.; Yang, H.; Jia, S.; You, L.; Liu, B.; Zhang, M. Water conservancy projects in China: Achievements, challenges and way forward. Glob. Environ. Change 2013, 23, 633–643. [Google Scholar] [CrossRef]
  18. Zhao, Y.; Zhu, Y.; Lin, Z.; Wang, J.; He, G.; Li, H.; Li, L.; Wang, H.; Jiang, S.; He, F.; et al. Energy Reduction Effect of the South-to-North Water Diversion Project in China. Sci. Rep. 2017, 7, 15956. [Google Scholar] [CrossRef]
  19. Han, Z.; Li, F.; Zhao, Y.; Liu, C. Investigation into groundwater level prediction within a deep learning framework: Incorporating the spatial dynamics of adjacent wells. J. Hydrol. 2025, 657, 133097. [Google Scholar] [CrossRef]
  20. Wang, B.; Jin, M.; Nimmo, J.R.; Yang, L.; Wang, W. Estimating groundwater recharge in Hebei Plain, China under varying land use practices using tritium and bromide tracers. J. Hydrol. 2008, 356, 209–222. [Google Scholar] [CrossRef]
  21. Guo, H.; Zhang, Z.; Cheng, G.; Li, W.; Li, T.; Jiao, J.J. Groundwater-derived land subsidence in the North China Plain. Environ. Earth Sci. 2015, 74, 1415–1427. [Google Scholar] [CrossRef]
  22. Xu, Y.; Mo, X.; Cai, Y.; Li, X. Analysis on groundwater table drawdown by land use and the quest for sustainable water use in the Hebei Plain in China. Agric. Water Manag. 2005, 75, 38–53. [Google Scholar] [CrossRef]
  23. Wu, Z.; Lu, C.; Sun, Q.; Lu, W.; He, X.; Qin, T.; Yan, L.; Wu, C. Predicting Groundwater Level Based on Machine Learning: A Case Study of the Hebei Plain. Water 2023, 15, 823. [Google Scholar] [CrossRef]
  24. Cai, K.; Song, Z. Cycling and total risks of multiple As fractions in the Beijing–Tianjin–Hebei area on the agricultural plain. China Ecotoxicol. Environ. Saf. 2020, 190, 1151–1159. [Google Scholar] [CrossRef]
  25. Liu, Y.; Wu, G.; Ma, B.; Wu, T.; Wang, X.; Wu, Q. Revealing climatic and groundwater impacts on the spatiotemporal variations in vegetation coverage in marine sedimentary basins of the North China Plain, China. Sci. Rep. 2024, 14, 10085. [Google Scholar] [CrossRef]
  26. Narayanamoorthy, A. Groundwater depletion and water extraction cost: Some evidence from South India. Int. J. Water Resour. Dev. 2015, 31, 604–617. [Google Scholar] [CrossRef]
  27. Hebei Province to Implement the ‘People’s Republic of China Water Law’ Approach. Available online: http://slt.hebei.gov.cn/a/2017/11/17/2017111721475.html (accessed on 14 April 2025).
  28. Interim Measures for Management of Urban Groundwater Resources in Hebei Province. Available online: http://www.law-lib.com/law/law_view1.asp?id=17770 (accessed on 14 April 2025).
  29. Cao, J.; Xiao, Y.; Long, D.; Cui, Y.; Liu, M.; Zhang, J.; Wang, Y.; Hong, X.; Chen, K. Combined Gravity Satellite and Water Well Information to Monitor Groundwater Storage Changes in the North China Plain. Geomat. Inf. Sci. Wuhan. Univ. 2024, 49, 805–818. [Google Scholar]
  30. Qu, J.; Jiang, J.; Yan, T.; Li, Y.; Tian, R.; Wang, L. Evolution of groundwater ecosystem service value in the receiving areas of Beijing-Tianjin-Hebei around the opening of the Middle Route Project of South-to-North Water Diversion. Acta Geophys. 2023, 72, 2743–2758. [Google Scholar] [CrossRef]
  31. Gao, Y.; Li, J.; Hao, Q.; Yu, C.; Meng, S. Analysis on the Effect of Groundwater Overexploitation Control in Water receiving region of the First Phase of the South-North Water Transfer Project. MATEC Web Conf. 2018, 246, 01069. [Google Scholar]
  32. Giordano, M. Global Groundwater? Issues and Solutions. Annu. Rev. Environ. Resour. 2010, 34, 153–178. [Google Scholar]
  33. Kong, F.; Xiong, K.; Zhang, N. Determinants of farmers’ willingness to pay and its level for ecological compensation of Poyang Lake Wetland, China: A household-level survey. Sustainability 2014, 6, 6714–6728. [Google Scholar] [CrossRef]
  34. Wada, Y.; Wisser, D.; Bierkens, M.F. Global modeling of withdrawal, allocation and consumptive use of surface water and groundwater resources. Earth Syst. Dyn. 2014, 5, 15–40. [Google Scholar]
  35. Jia, J.; Liu, C. Groundwater dynamic drift and response to different exploitation in the north China plain: A case study of Lunancheng county, Hebei province. Acta Geogr. Sin. 2002, 57, 201–209. [Google Scholar]
  36. Hao, J.; Zhang, G.; Li, Z.; Wang, X.; Yunling, Y. Characteristics of precipitation variation in recent 61 years and its influence on ecological environment in Xingtai City. Agric. Res. Arid. Areas 2017, 35, 271–277. [Google Scholar]
  37. Jasechko, S.; Seybold, H.; Perrone, D.; Fan, Y.; Shamsudduha, M.; Taylor, R.G.; Fallatah, O.; Kirchner, J.W. Rapid groundwater decline and some cases of recovery in aquifers globally. Nature 2024, 625, 715–721. [Google Scholar]
  38. Fei, Y.; Miao, J.; Zhang, Z.; Chen, Z.; Song, H.; Yang, M. Analysis on Evolution of Groundwater Depression Cones and Its Leading Factors in North China Plain. Resour. Sci. 2009, 31, 394–399. [Google Scholar]
  39. Xu, H.; Xiao, G.; Li, H. Evolution of quaternary groundwater system in Hebei plain human activities. Bull. Geol. Sci. Technol. 2002, 21, 7–13. [Google Scholar]
  40. Zhou, Z.; Liu, J.; Yang, C.; Li, K. The variation of terrestrial water storage in north China based on CRACE gravity satellite. South--North. Water Transf. Water Sci. Technol. 2020, 18, 66–73. [Google Scholar]
  41. Gong, Y.; Xing, K.; Wang, P. Research on change trend of temperature and precipitation in Cangzhou nearly 40 years. Chin. J. Agrometeorol. 2008, 29, 143–145. [Google Scholar]
  42. Famiglietti, J.S. The global groundwater crisis. Nat. Clim. Change 2014, 4, 945–948. [Google Scholar]
  43. Li, Z.; Mo, Y.; Gao, H.; Gong, S.; Zhang, Y.; Li, G.; Wu, F. The hydraulic performance and clogging characteristics of a subsurface drip irrigation system operating for five years in the North China plain. Agric. Water Manag. 2025, 307, 109217. [Google Scholar]
  44. Lancia, M.; Jing, H.; Steed, S.M.; Zheng, C. Analysis of hydraulic conductivity characteristics of alluvial sequence in North China Plain. Env. Earth Sci. 2021, 80, 553. [Google Scholar]
  45. Xu, L.; Shu, L.; Li, W.; Min, X.; Lu, C.; Liu, B. Spatial and temporal evolution characteristics of groundwater mining in China from 2000 to 2020. Water Resour. Prot. 2023, 39, 79–85+93. [Google Scholar]
  46. Yang, W.; Long, D.; Scanlon, B.R.; Burek, P.; Zhang, C.; Han, Z.; Butler, J.J.; Pan, Y.; Lei, X.; Wada, Y. Human Intervention Will Stabilize Groundwater Storage Across the North China Plain. Water Resour. Res. 2022, 58, e2021WR030884. [Google Scholar] [CrossRef]
  47. Mulroe, B.; Shaw, S.B.; Kroll, C.N. Using records of well completions to assess vulnerability of domestic wells in the Northeast U.S. to drought. Clim. Change 2023, 176, 95. [Google Scholar]
Figure 1. The Hebei Plain (the position of the drilling and the A–A1 profile are shown in the figure). The figure was created by the author using ArcMap 10.8.
Water 17 02066 g001
Figure 2. A–A1 profile (The figure shows the position of the four aquifers in the A–A1 profile relative to the ground.).
Water 17 02066 g002
Figure 3. Statistics of the number of wells. (a) represents the number of newly constructed wells each year; (b) shows the cumulative number of wells since 1900.
Water 17 02066 g003
Figure 4. Methodological framework (the figure illustrates the research methodology and workflow).
Water 17 02066 g004
Figure 5. Time–depth chart of the well (red line: temporal evolution of depths for newly constructed deep wells; blue line: temporal evolution of depths for newly constructed shallow wells).
Water 17 02066 g005
Figure 6. Temporal variation in well depths of different well types (2005–2021): (a) shallow agricultural irrigation wells, (b) shallow rural domestic wells, (c) shallow industrial wells, (d) deep agricultural irrigation wells, (e) deep rural domestic wells, (f) deep industrial wells.
Water 17 02066 g006
Figure 7. Trends in shallow groundwater depth from 2005 to 2021. (a) Spatial distribution of shallow groundwater depth; (b) temporal variation of maximum and average depth to shallow groundwater.
Water 17 02066 g007
Figure 8. Trends in deep groundwater depth from 2005 to 2021. (a) Spatial distribution of deep groundwater depth; (b) temporal variation of maximum and average depth to deep groundwater.
Water 17 02066 g008
Figure 9. Well distribution map. (a) shows the spatial distribution of shallow industrial wells, rural domestic wells, and agricultural irrigation wells across the Hebei Plain; (b) illustrates the distribution of deep industrial wells, rural domestic wells, and agricultural irrigation wells in the same region.
Water 17 02066 g009
Figure 10. Average groundwater level change rate and rate average absolute deviation. (a) illustrates the average groundwater level change rate and average absolute deviation of shallow groundwater depth near industrial wells, rural domestic wells, and agricultural irrigation wells; (b) shows the average groundwater level change rate and average absolute deviation of deep groundwater depth near industrial wells, rural domestic wells, and agricultural irrigation wells. In the figure, a positive average groundwater level change rate indicates an increase in groundwater depth, while a negative rate indicates a decrease in groundwater depth.
Water 17 02066 g010
Table 1. Spearman correlation coefficient classification (the table presents the strength of correlation corresponding to different Spearman coefficient values.).
Correlation StrengthValue Range
No correlation0–0.2
Weak correlation0.2–0.4
Moderate correlation0.4–0.6
Strong correlation0.6–0.8
Very strong correlation0.8–1
Table 2. Number of wells: number, proportion, and average depths of shallow/deep wells.
Types of WellsNumber of WellsProportion (%)Number of Shallow WellsAverage Depth of Shallow Well (m)Number of Deep WellsAverage Depth of Deep Well (m)
Service wells580.0519100.4239258.90
Urban centralized water supply wells950.08611689332.33
Urban domestic wells2070.122783.93118215.53
Rural water supply plant source wells11240.8812693.80937329.74
Industrial wells11690.9540595.06738249.62
Rural domestic wells25442.1152284.182022264.69
Agricultural irrigation wells115,32095.8180,38673.9434,934197.37
Service wells580.0519100.4239258.90
Table 3. Correlation between shallow groundwater depth and shallow well depth (the table shows the correlations between shallow and deep groundwater depths and the corresponding well depths for the three types of wells).
YearShallow Agricultural Irrigation WellsShallow Rural Domestic WellsShallow Industrial WellsDeep Agricultural Irrigation WellsDeep Rural Domestic WellsDeep Industrial Wells
20050.54 **0.63 *0.260.78 **0.53 **0.27
20100.67 **0.49 *0.43 *0.66 **0.46 **0.35 **
20150.60 **0.220.68 *0.73 **0.180.24
20180.68 **0.86 **0.800.69 **0.090.49
20190.72//0.94 **//
20200.76 **//0.44 **//
Notes: Here, * and ** indicate significant correlations at the 0.01 and 0.005 levels (two-tailed); / indicates a lack of sufficient data.
Disclaimer/Publisher’s Note: The statements, opinions and data contained in all publications are solely those of the individual author(s) and contributor(s) and not of MDPI and/or the editor(s). MDPI and/or the editor(s) disclaim responsibility for any injury to people or property resulting from any ideas, methods, instructions or products referred to in the content.

