Article

Algal Community Dynamics in Three Water Intakes of Poyang Lake: Implications for Drinking Water Safety and Management Strategies

1
College of Life Sciences, Jiangxi Normal University, Nanchang 330022, China
2
Key Laboratory for Algal Biology, Institute of Hydrobiology, Chinese Academy of Sciences, Wuhan 430072, China
*
Authors to whom correspondence should be addressed.
These authors contributed equally to this work.
Water 2025, 17(13), 2034; https://doi.org/10.3390/w17132034
Submission received: 15 May 2025 / Revised: 22 June 2025 / Accepted: 3 July 2025 / Published: 7 July 2025
(This article belongs to the Special Issue Freshwater Species: Status, Monitoring and Assessment)

Abstract

This study aimed to investigate phytoplankton dynamics and water quality at three drinking water intakes (Duchang, Hukou, and Xingzi) in Poyang Lake through monthly monitoring from May 2023 to April 2024. The results showed that a total of 168 species of phytoplankton were identified in nine phyla, and there were significant spatial and temporal differences in the abundance of phytoplankton at the three waterworks intakes, with a spatial trend of annual mean values of Duchang > Xingzi > Hukou and a seasonal trend of summer and autumn > spring and winter. The dominant species of phytoplankton in the waterworks intakes of the three waterworks also showed obvious spatial and temporal differences. Cyanobacteria (particularly Pseudanabaena sp. and Microcystis sp.) dominated the phytoplankton communities during summer and autumn, demonstrating significant water degradation potential. In contrast, Cyclotella sp. prevailed in winter and spring assemblages. Based on water quality assessments at the three intake sites, the Duchang County intake exhibited year-round mild eutrophication with persistent mild cyanobacterial blooms (June–October), while the other two sites maintained no obvious bloom conditions. Further analyzing the toxic/odor-producing algal strains, the numbers of dominant species of Pseudanabaena sp. and Microcystis sp. in June–October in Duchang County both exceeded 1.0 × 10⁷ cells·L−1. It is necessary to focus on their release of ATX-a (ichthyotoxin-a), 2MIB (2-Methylisoborneol), MCs (microcystins), etc., to ensure the safety of the water supply at the intake. Building upon these findings, we propose a generalized algal monitoring framework, encompassing three operational pillars: (1) key monitoring area identification, (2) high-risk period determination, and (3) harmful algal warnings. Each of these is substantiated by our empirical observations in Poyang Lake.

Graphical Abstract

1. Introduction

Poyang Lake is the largest freshwater lake in China, located in the north of Jiangxi Province. This vital water body serves as Jiangxi’s “mother river” and sustains the livelihood and development of local communities [1]. Hydrologically, its basin covers 9% of the Yangtze River watershed while contributing 15.5% of the Yangtze’s total discharge. The lake further functions as a critical flood storage reservoir and water replenishment zone for the middle–lower Yangtze reaches [2]. In recent years, the continuous development of aquaculture, mining industry, industrialization, sand mining, and urbanization around the lake in the Poyang Lake basin has resulted in an overall increasingly severe situation of the ecological environment in the Poyang Lake region, and mild eutrophication is now occurring on a local scale [3]. The increase in nutrient salt concentration promotes the growth of phytoplankton, and cyanobacterial blooms occur in several areas of Poyang Lake in summer [4,5].
Phytoplankton, as primary producers in aquatic ecosystems [6], exhibit community composition and distribution patterns that objectively reflect water environmental changes. Specifically, as lakes transition from oligotrophic to eutrophic states, phytoplankton respond differentially to increasing nutrient concentrations, ultimately leading to dominance by a few species (e.g., Cyanobacteria or Chlorophyta) [7]. The exacerbation of eutrophication-driven algal blooms has become a critical issue in aquatic ecosystems [8], making phytoplankton abundance, diversity, and community structure vital indicators for monitoring lake eutrophication [9]. Poyang Lake, a crucial drinking water source in Jiangxi Province, hosts diverse phytoplankton assemblages with pronounced seasonal shifts in dominant species [10]. These seasonal variations result in significant differences in cellular morphology and metabolic organic matter profiles among algal populations, posing challenges for water treatment processes. Studies indicate that coagulation efficiency varies markedly across algal taxa, primarily due to differences in cell morphology and algal-derived organic matter composition [11,12]. Furthermore, the hazards posed by algae extend beyond direct interference with water treatment processes and warrant significant attention to the environmental risks associated with their secondary metabolites, such as algal toxins and algal-derived taste and odor compounds. Certain phytoplankton species, particularly Cyanobacteria, produce secondary metabolites (e.g., MCs, geosmin, and 2-MIB) that threaten drinking water safety through hepatotoxicity and neurotoxicity, while simultaneously inducing taste and odor issues and degrading water quality aesthetics [13,14]. Historically, algal blooms in Lakes Taihu, Chaohu, and Dianchi have demonstrated how cyanobacterial proliferation can severely compromise both the sensory quality and safety of drinking water supplies.
Most of the focuses on Poyang Lake are mainly on the relationship between phytoplankton phyla and water environment factors in some specific periods or in a large area of the main lake [4,15], and the systematic study on the dominant algal species in the water intake area of the water plant is still insufficient. This study aims to systematically develop a generalized framework for algal monitoring (including key monitoring area identification, high-risk period determination, and harmful algal warnings) by elucidating the dynamic variations of dominant algal communities and their potential impacts on drinking water safety in the Poyang Lake water supply area. Focusing on the water intake area of Poyang Lake Waterworks during 2023–2024, we conducted comprehensive analyses of spatiotemporal patterns in algal community structure, deciphered annual growth dynamics of dominant species, and identified key taxa with water quality implications. The assessment of toxin/odor-producing risks provides critical scientific evidence for optimizing targeted algal control strategies and mitigating water quality threats, demonstrating practical significance for safeguarding regional drinking water security.

2. Material and Methods

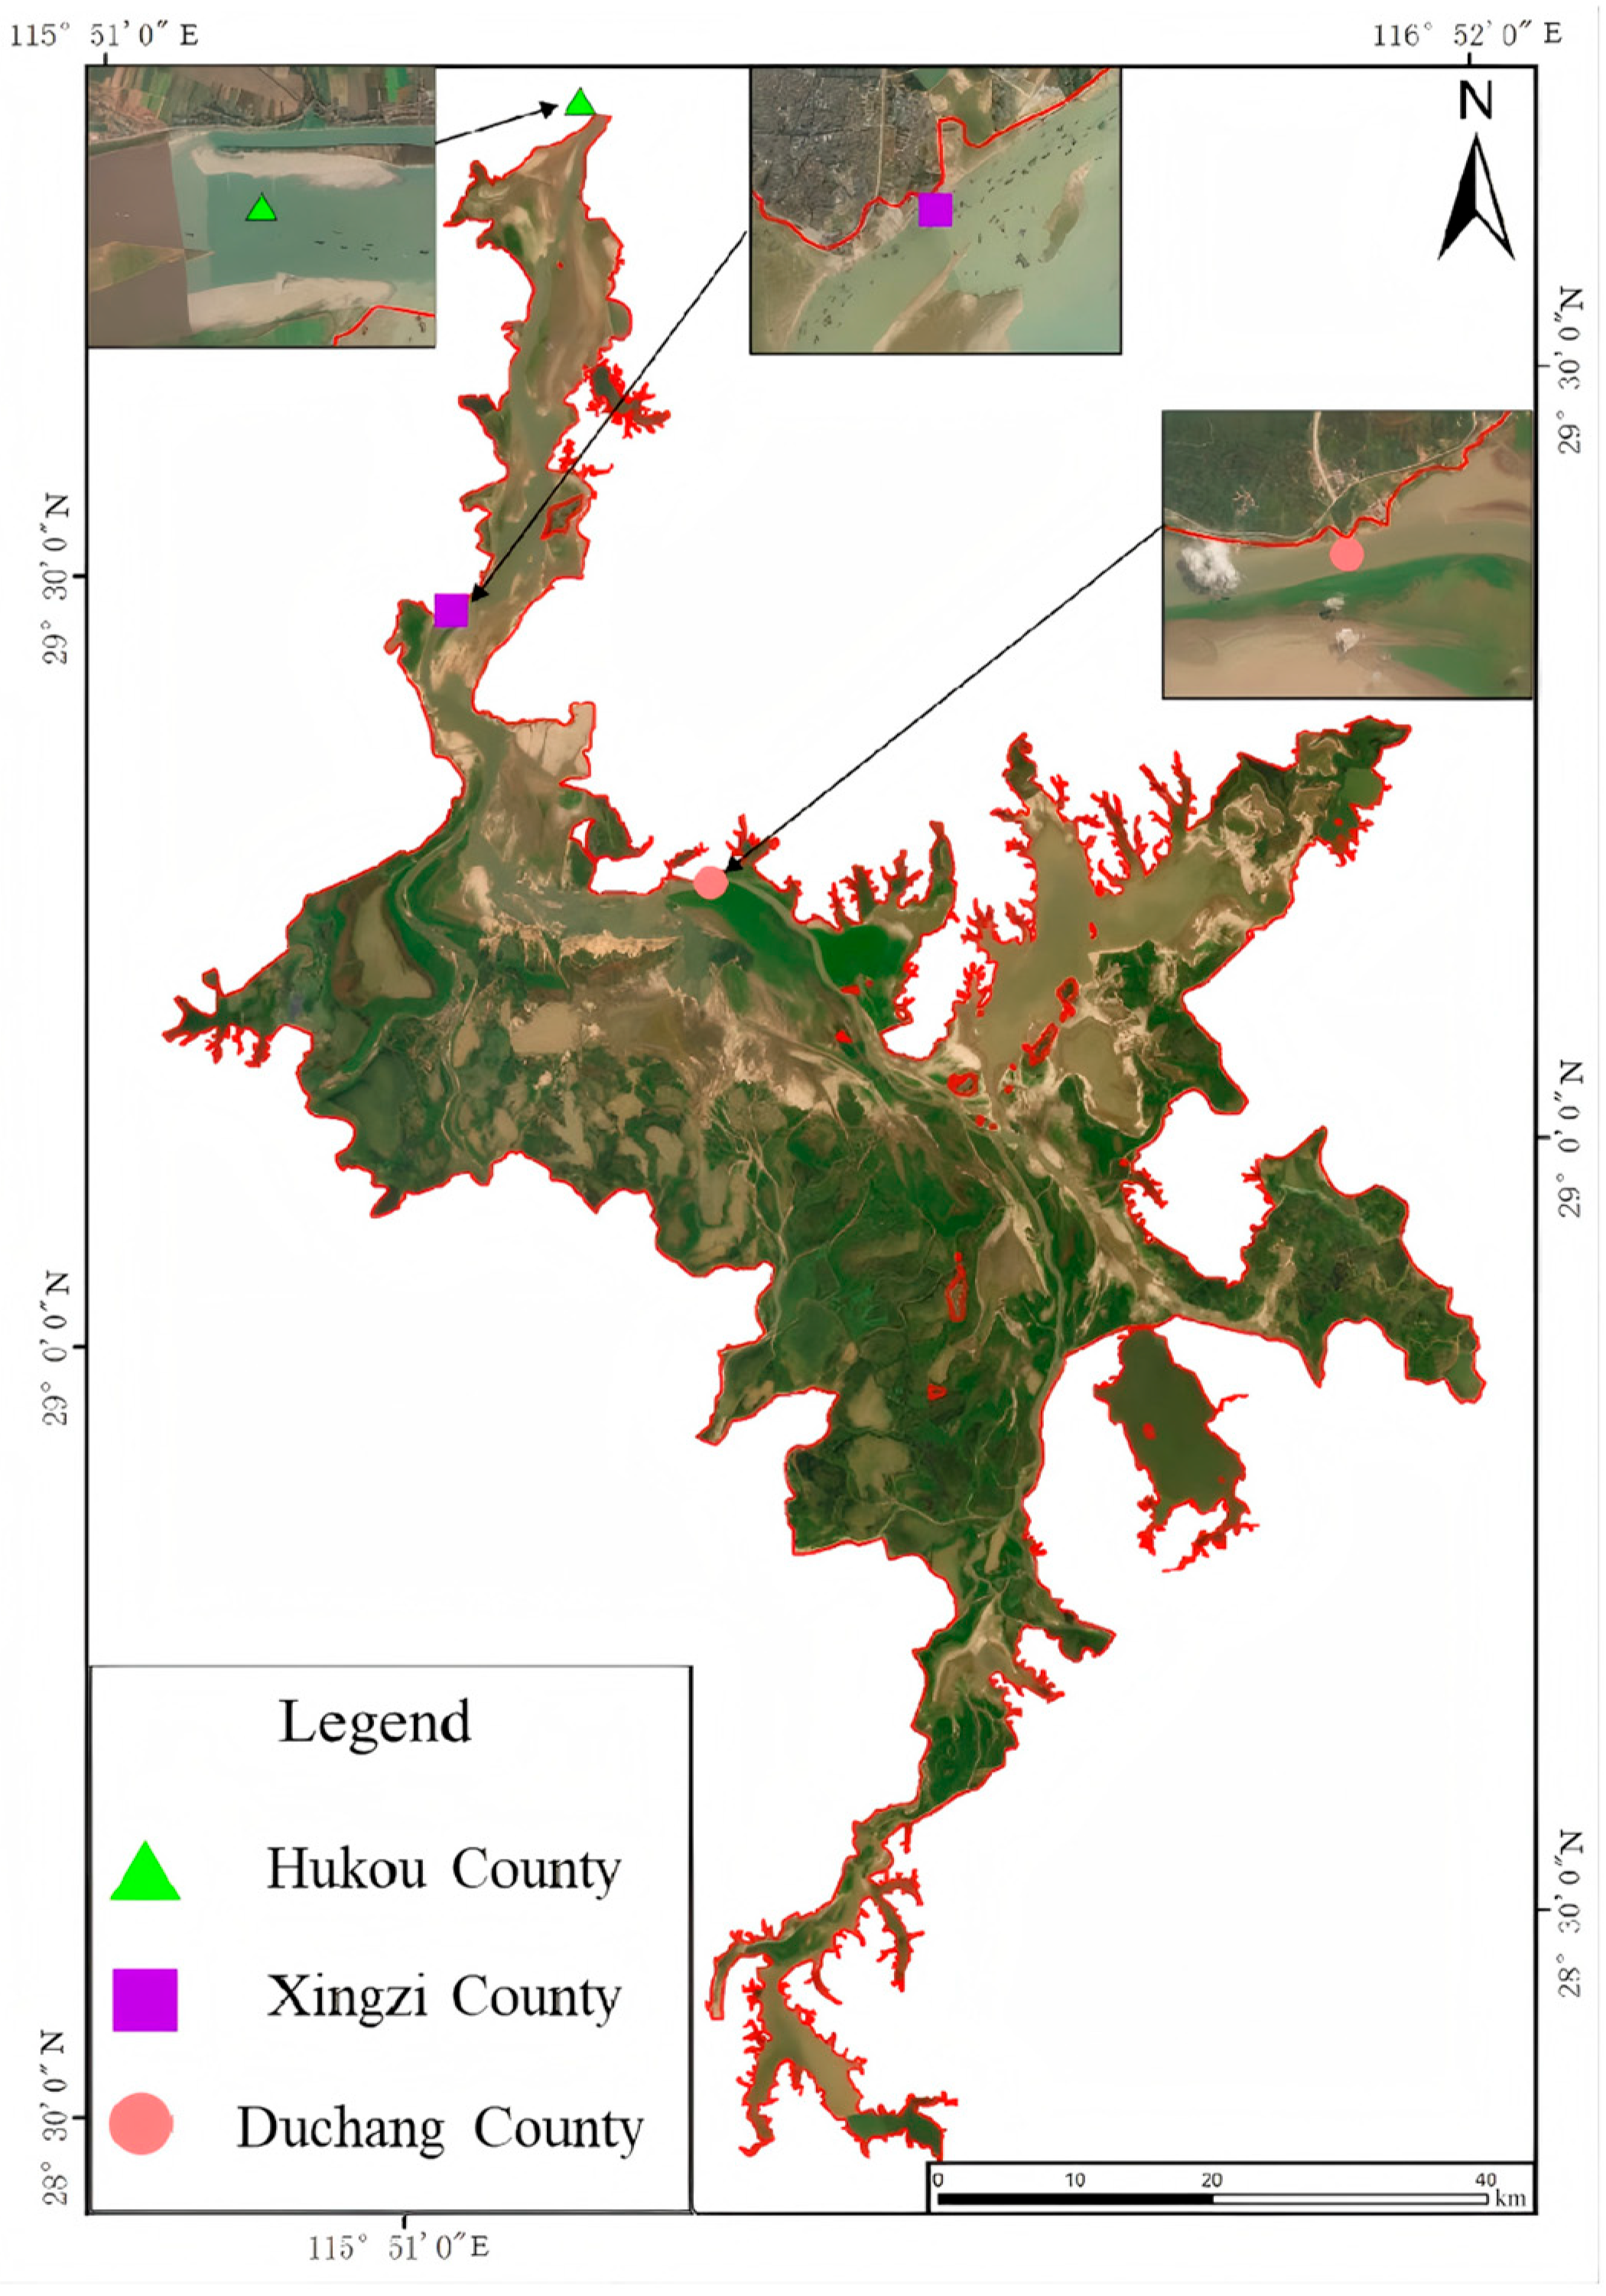
2.1. Overview of the Study Area and Point Placement

Poyang Lake (28°22′~29°45′ N, 115°47′~116°45′ E) is located in the northern part of Jiangxi Province, which receives inflows from five major tributaries—the Ganjiang, Fuhe, Xinjiang, Raohe, and Xiushui Rivers—and connects downstream to the Yangtze River. Its water level is jointly regulated by inflows from these tributaries and backwater effects from the Yangtze, resulting in significant intra-annual water level fluctuations [16]. In our study, three fixed water intakes of Poyang Lake were selected as monitoring points, which were the Guanhu Water Plant Intake in Duchang County, the Tate-Nan Water Plant Intake in Xingzi County, and the Runquan Water Plant Intake in Hukou County. Duchang County and Xingzi County are located in the main lake area of Poyang Lake, and Hukou County is located in the outlet of Poyang Lake. The sampling locations are shown in Figure 1.

2.2. Sampling and Processing

2.2.1. Water Quality Sample Collection and Processing

Sampling was conducted once a month from May 2023 to April 2024, and the transparency (SD) was determined using the Sachs disk method at the sampling site; the collected water samples were brought back to the laboratory to determine chlorophyll a (μg/L) within 6 h [17]. The data of total phosphorus (TP), total nitrogen (TN), the permanganate index (CODMn), and other conventional water quality indicators in our study were obtained from the national automatic surface water quality monitoring data released by the Ministry of Ecology and Environment.

2.2.2. Phytoplankton Sampling and Treatment

Algae were collected using a water collector to collect 1 L of surface water samples, which were fixed and preserved by adding 1~1.5% Lugol’s solution and then left to stand for 48 h before identification and counting of algae species using a microscope (Olympus CX31, Olympus Corporation, Tokyo, Japan). Phytoplankton enumeration and identification were performed with reference to “Chinese freshwater algae: system, classification and ecology”, identifying phytoplankton to the species or genus level. Counting was conducted using the visual field method, with replicate counts performed for each sample. Each replicate count examined 100 microscopic fields to ensure statistical reliability. Subsequently, algal cell density (cells·L−1) was calculated by converting field counts into algal cell numbers per liter of water sample through application of the volume concentration factor [18].

2.2.3. Statistical Analysis of Data

Water quality data and algal detection data were pre-sorted and analyzed using Microsoft Excel. We tested for statistical differences (alpha = 0.05) in total algal cell density among the three stations, using the function aov conducted in R version 4.4.2 with the packages “readxl”, “dplyr”, and “tidyr”. The data related to algal community structure were processed and mapped using OriginPro software(version 2022b).

2.3. Evaluation Methodology

2.3.1. Algae Data Processing

The annual average algal density at different sampling sites was calculated using the formula below:
N a = 1 12 i = 1 12 N i
where Na is the mean algal density at a specific sampling site (cells·L−1) and Ni is the monthly mean algal density (cells·L−1).

2.3.2. Comprehensive Nutritional Status Index (TLI) Approach

The comprehensive trophic level index (TLI(Σ)) was calculated following the “Lake Eutrophication Evaluation Method and Classification Standard” [19]. This trophic index weighted parameters including chlorophyll a (Chla), total phosphorus (TP), total nitrogen (TN), transparency (SD), and the permanganate index (CODMn), with Chla serving as the primary indicator.
The single trophic level index (TLI(j)) is defined by the following expression:
TLI (Chla) = 10 (2.5 + 1.086 lnChla)
TLI (TP) = 10 (9.436 + 1.624 lnTP)
TLI (TN) = 10 (5.453 + 1.694 lnTN)
TLI (SD) = 10 (5.118 − 1.94 lnSD)
TLI (CODMn) = 10 (0.109 + 2.661 lnCODMn)
The weighted trophic level index formula is expressed as
T L I = j = 1 m W j T L I j
where TLI() is the composite trophic state index; Wj is the associated weights of the trophic state index for the j-th parameter, and TLI(j) represents the trophic state index for the j-th parameter.
Utilizing Chla as the reference parameter, the normalized correlation weight for the j-th parameter is computed by Equation (8):
W j = r i j 2 j = 1 m r i j 2
where rij is the correlation coefficient between the j-th parameter and the reference parameter Chla and m is the number of evaluation parameters.
The Pearson correlation coefficients rij and rij2 between Chla and other parameters in Chinese lakes (including reservoirs) are presented in Table 1.

2.3.3. Dominant Algal Species

The dominance index (Y) [20] was used to identify dominant algal species in the study area, calculated as
Y = (Ni/N) × fi
where Ni is the abundance of the i-th species (cells·L−1); N is the total algal abundance (cells·L−1); and fi is the frequency of occurrence of the i-th species. A species was classified as dominant if Y ≥ 0.02.

2.3.4. Water Quality Evaluation Criteria

The classification of cyanobacterial bloom severity is based on the Technical Specification for Bloom Severity Classification and Monitoring issued by the Department of Ecology and Environment of Guangdong Province [21], while the grading of TLI follows the Lake Eutrophication Evaluation Method and Classification Standard [20]. The grading thresholds are summarized in Table 2.

3. Results

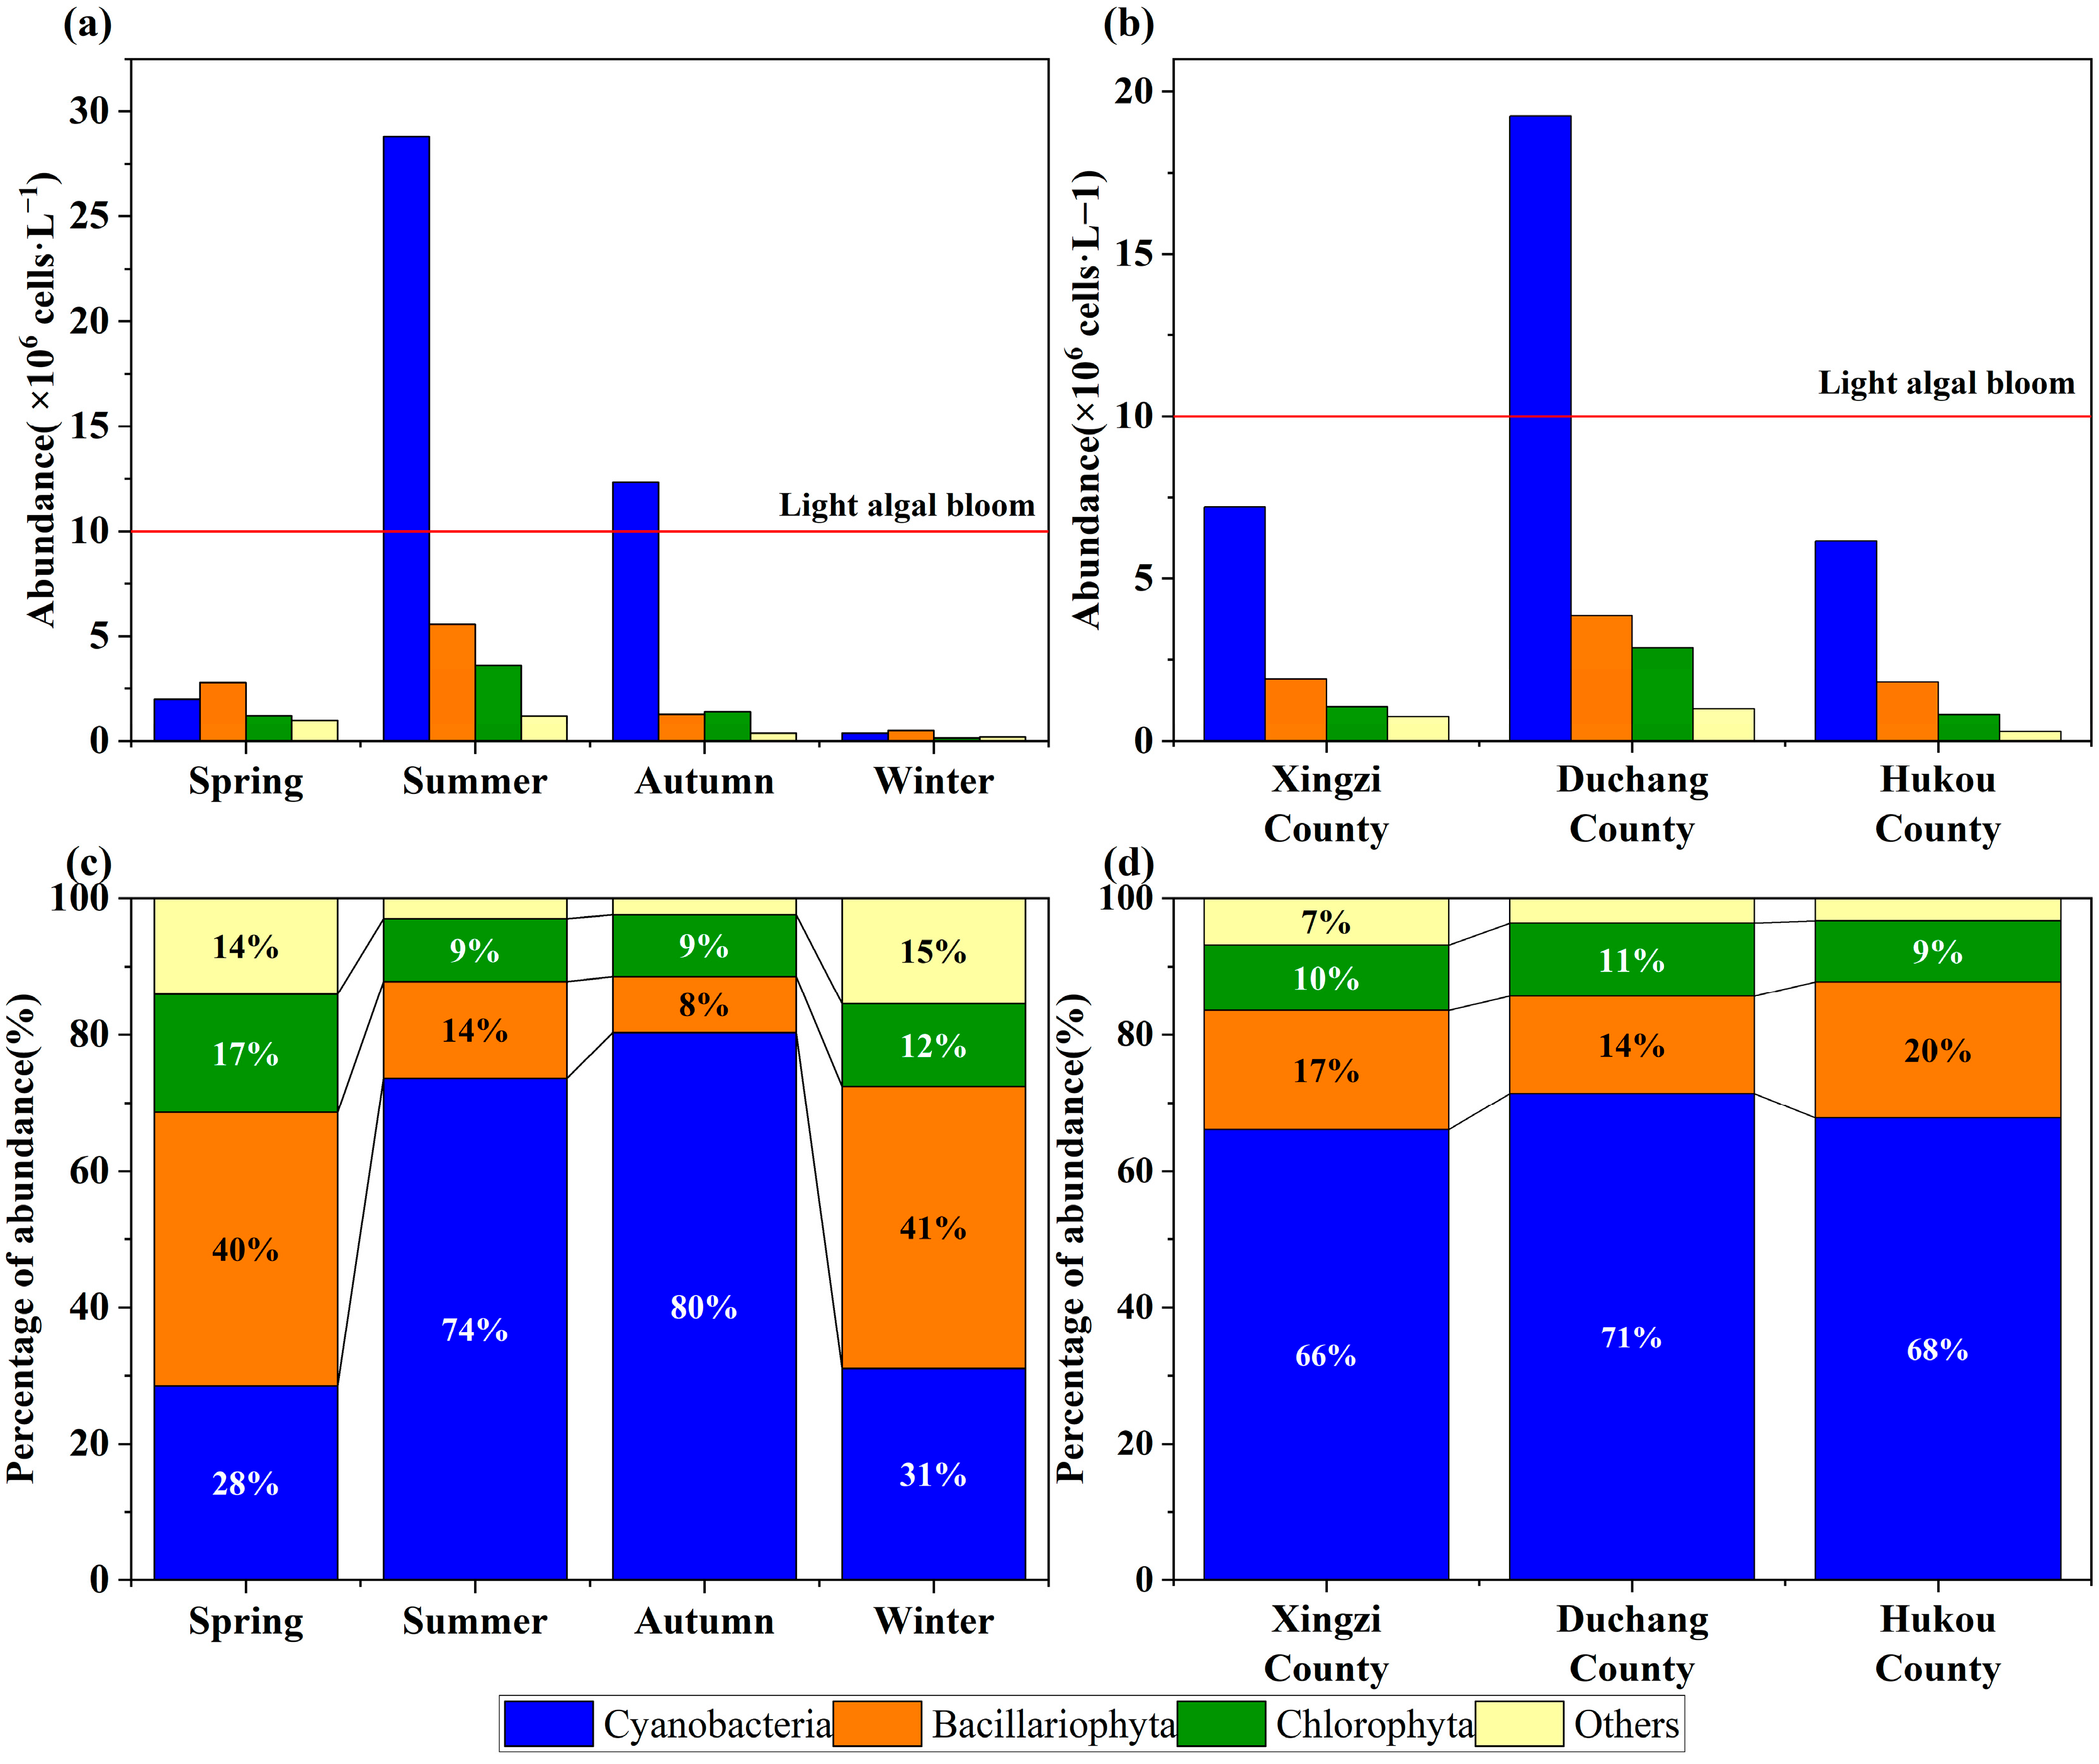
3.1. Phytoplankton Community Structure Characteristics

A total of 168 algal species across nine phyla were identified during the 12-month survey (2023–2024). Chlorophyta (48.8%), Bacillariophyta (22.0%), and Cyanobacteria (14.3%) constituted the dominant phyla. The annual mean algal cell density across the three water intakes in Poyang Lake was 1.56 × 10⁷ cells·L−1, with Cyanobacteria exhibiting absolute dominance (69.4% of total abundance) (Figure 2).
Th spatiotemporal analysis revealed significant temporal variation in algal cell density (Figure 3). During colder seasons (spring and winter), mean densities were lower (6.91 × 10⁶ and 1.21 × 10⁶ cells·L−1, respectively), with cold-adapted bacillariophyta dominating (40–41% relative abundance). In contrast, summer and autumn showed elevated densities (3.91 × 10⁷ and 1.53 × 10⁷ cells·L−1), where Cyanobacteria predominated (74–80% relative abundance). Spatial heterogeneity was pronounced among the intakes: Duchang County exhibited the highest annual mean density (2.70 × 10⁷ cells·L−1), significantly exceeding Xingzi (1.09 × 10⁷ cells·L−1) and Hukou (9.06 × 10⁶ cells·L−1) (p < 0.05). Cyanobacteria dominated all sites (>66% relative abundance). According to water bloom levels (Table 2), only Duchang exceeded the threshold for mild cyanobacterial blooms. Summer and autumn cyanobacterial mean densities of the three intakes surpassed mild bloom levels. It is particularly notable that algal cell density reached its peak value of 1.03 × 10⁸ cells/L at the Duchang County intake in August. Therefore, Duchang was the sole site classified with mild blooms, while Xingzi and Hukou showed no significant bloom activity.
Further analysis of the coefficient of variation (CV) for algal cell density at the three water intakes (Table 3) revealed distinct temporal dynamics. Algal density consistently exceeded mild bloom thresholds from June to October, exhibiting thermally driven seasonal patterns. At the Duchang intake, densities remained above the thresholds for five consecutive months (June–October) with a CV of 1.16, indicating prolonged high-density peaks. Notably, Xingzi exhibited the highest CV (1.47), driven by dual peaks in June and August (2.45 × 10⁷ and 2.60 × 10⁷ cells·L−1, respectively), despite its annual mean (1.09 × 10⁷ cells·L−1) nearing the bloom threshold. In contrast, Hukou recorded the lowest annual mean density (9.06 × 10⁶ cells·L−1) and CV (1.09), reflecting sporadic peaks without sustained blooms. These findings highlight Duchang as a critical risk area due to its elevated mean density (2.70 × 10⁷ cells·L−1) and variability, necessitating prioritized monitoring and intervention.

3.2. Eutrophication and Water Quality Assessment

The analysis of the water quality data revealed seasonal and spatial variations in the comprehensive trophic level index (TLI) across the three intakes (Figure 4a). TLI values ranged from 46.4 to 55.1. Duchang County exhibited the highest mean annual TLI (52.6), surpassing Hukou (50.8) and Xingzi (49.2) Counties. Notably, only Duchang maintained a TLI > 50 across all seasons. In Hukou County, the winter TLI measured 48.9, while the spring through autumn values consistently exceeded 50. Xingzi County exceeded the threshold solely during the summer (TLI > 50), with seasonal means ranging between 46.9 and 49.8 during other seasons. According to the criteria for evaluating the eutrophication of water bodies, Duchang County displayed persistent light eutrophication year-round, while Hukou County exhibited this condition in all seasons except winter (mesotrophic). Xingzi County manifested light eutrophication solely during the summer, sustaining mesotrophic status throughout the remaining seasons.
Algal growth is regulated by a combination of temperature, nutrient salts, and other conditions. A nonlinear regression analysis between the TLI and algal cell density demonstrated a significant positive correlation (p < 0.05) (Figure 4b), indicating that eutrophication and algal cell density are correlated phenomena. The regression curve showed the TLI increasing with algal density, with the TLI remaining below 48 (indicating good water quality) when densities were below 2.0 × 10⁷ cells·L−1.

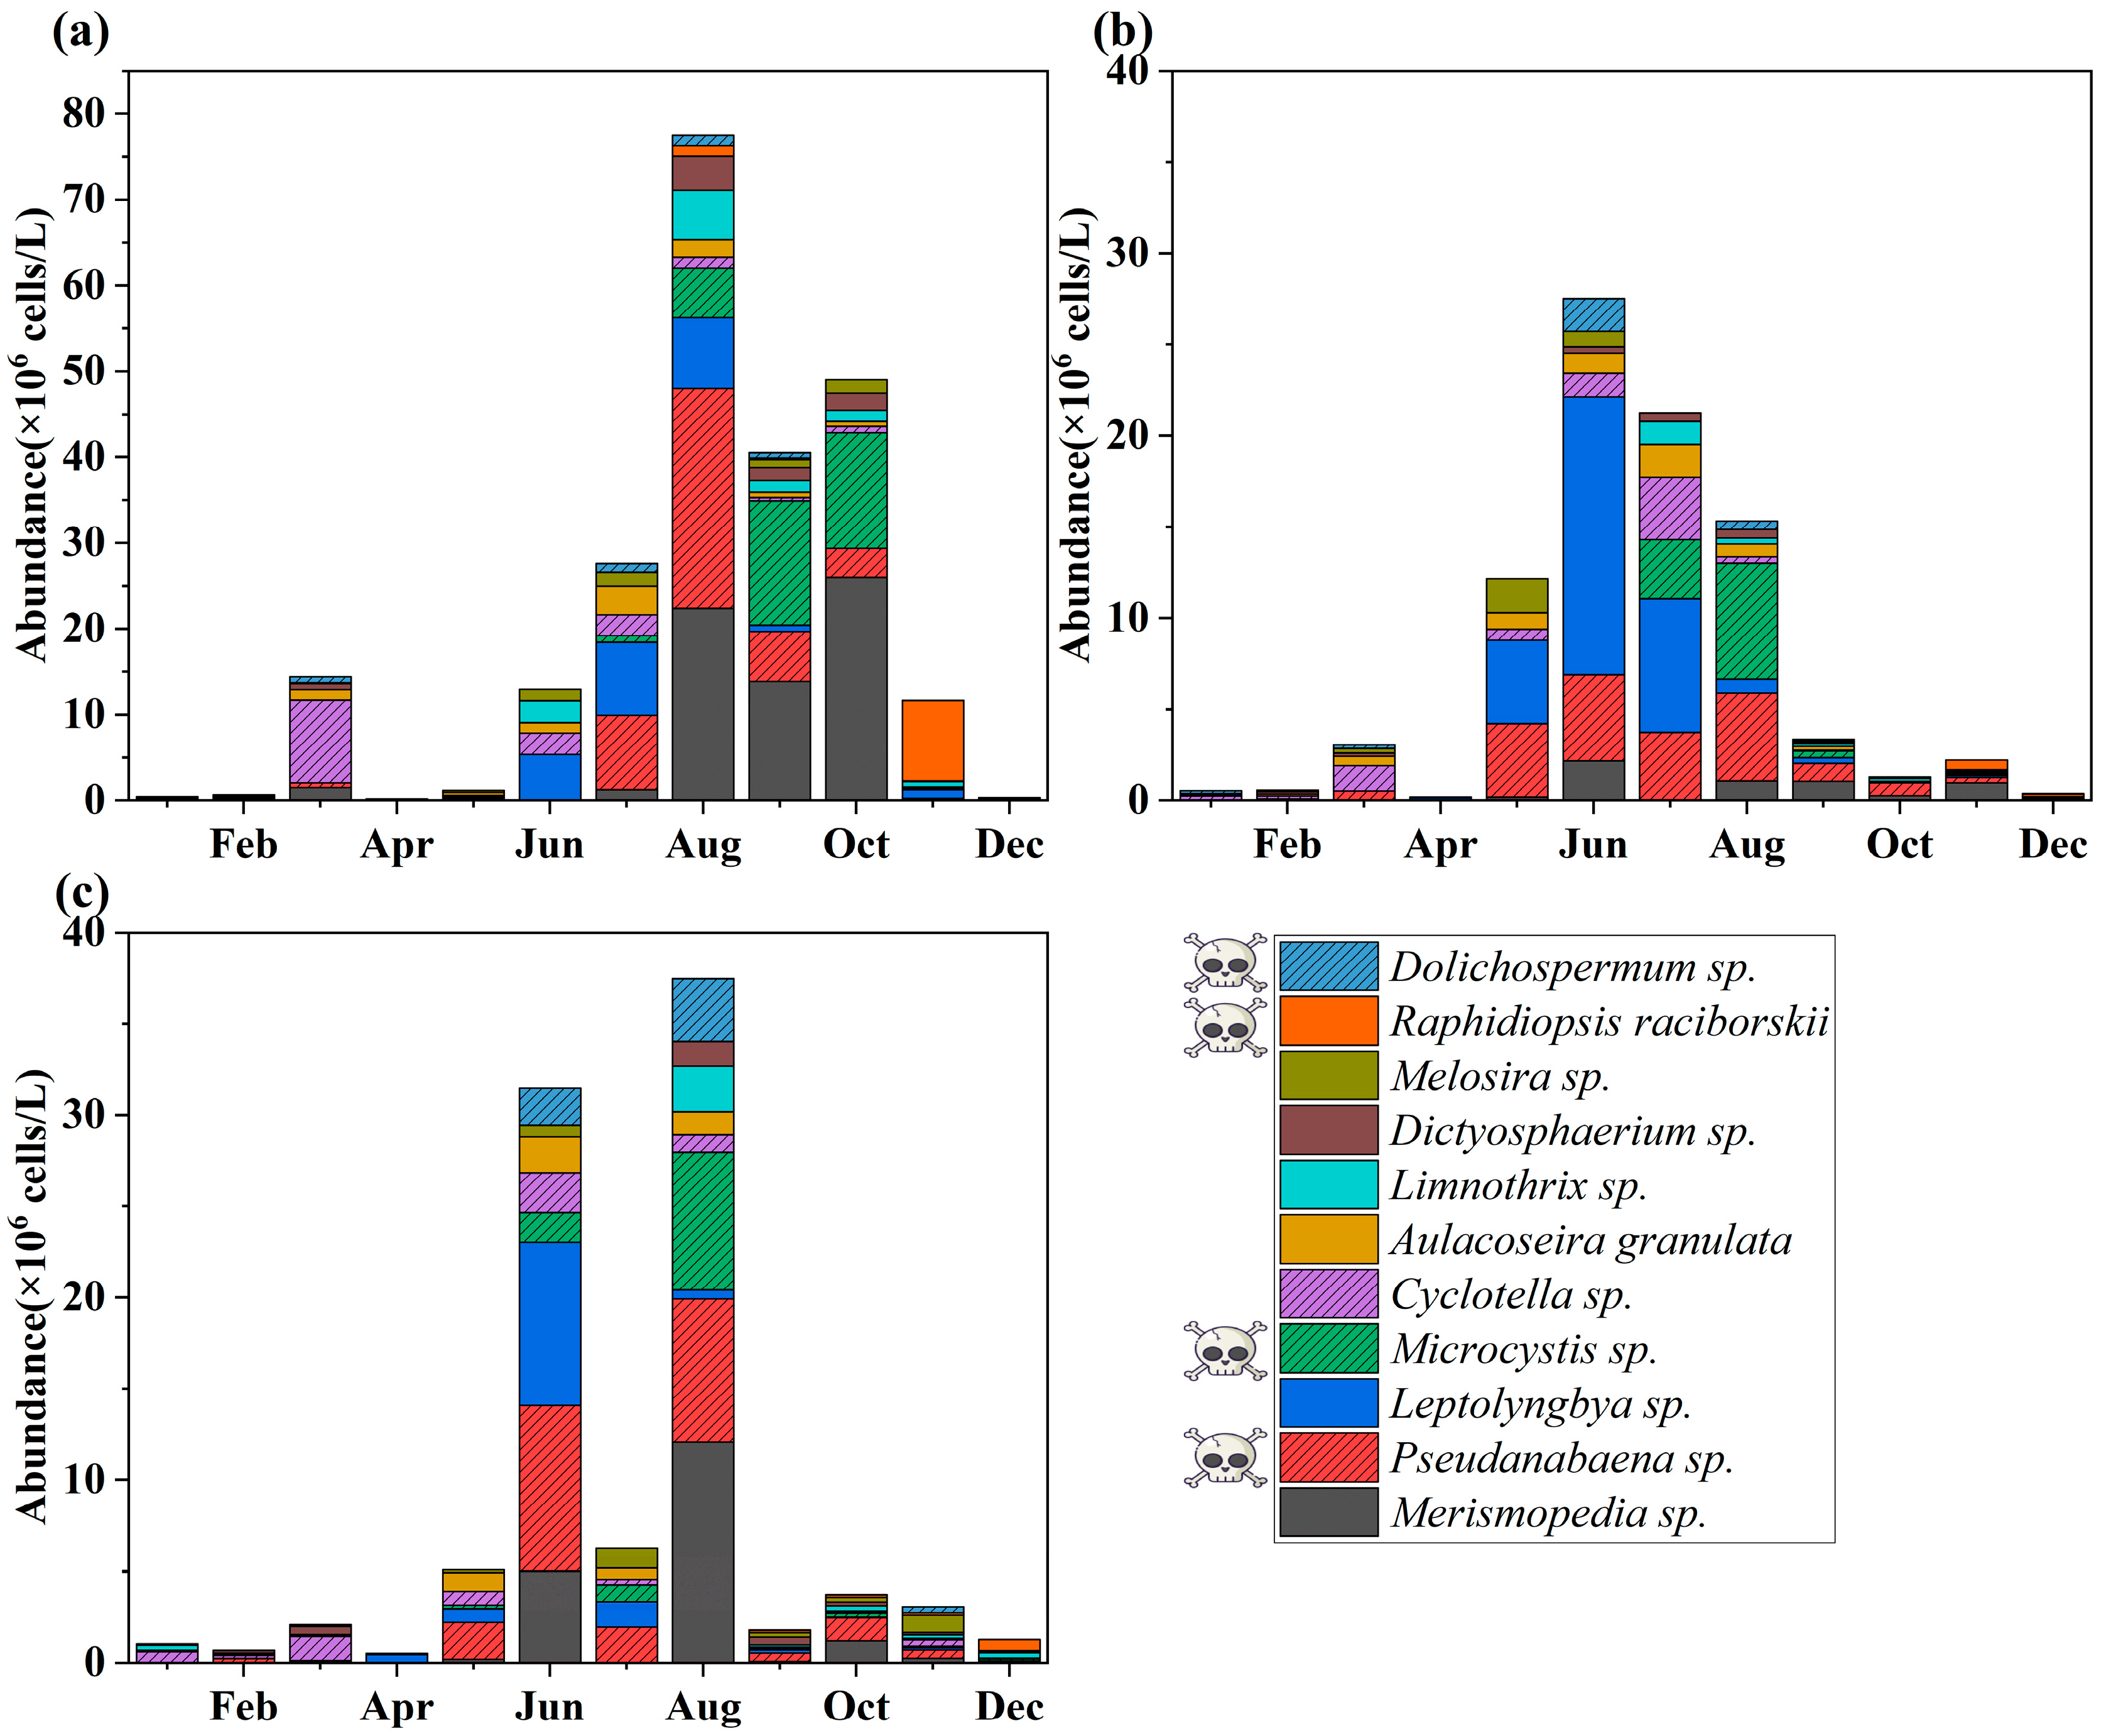
3.3. Spatial–Temporal Succession of Dominant Species

Our investigation revealed eleven dominant species across the three water intake points, ranked by descending dominance as follows: Merismopedia sp., Peudanabaena sp., Leptolyngbya sp., Microcystis sp., Cyclotella sp., Aulacoseira granulata, Limnothrix sp., Dictyosphaerium sp., Melosira sp., Raphidiopsis raciborskii, and Dolichospermum sp.
In Duchang County (Figure 5a), from January to March, Bacillariophyta (Cyclotella sp.) dominated, peaking at 0.97 × 10⁷ cells·L−1 (40.27% of total density) in March. From April to May, Leptolyngbya sp. and Aulacoseira granulata prevailed, though the densities remained below 106 cells·L−1. From June to October, Cyanobacteria (Pseudanabaena sp., Microcystis sp., and Merismopedia sp.) proliferated rapidly. Pseudanabaena sp. peaked at 2.56 × 10⁷ cells·L−1 in August, while Microcystis sp. and Merismopedia sp. reached 1.45 × 10⁷ and 2.60 × 10⁷ cells·L−1 in September and October, respectively. From November to December, Raphidiopsis raciborskii and Dolichospermum sp. dominated (74.52% and 39.55% of monthly density) but remained below 107 cells·L−1. In Hukou County (Figure 5b) and Xingzi County (Figure 5c), the dominant species densities were consistently ~106 cells·L−1. In Hukou, Pseudanabaena sp. and Microcystis sp. constituted 52.13% of the total density in August. Xingzi exhibited similar trends, with these species accounting for 33.52% in June.
All sites exhibited a consistent successional trajectory: Bacillariophyta-dominated (Cyclotella sp.) communities in winter–spring transitioned to Cyanobacteria dominance (Pseudanabaena sp., Microcystis sp., Merismopedia sp., and Raphidiopsis raciborskii) in summer–autumn (Figure 5a–c). Monthly variations in dominant species abundance highlighted the spatial heterogeneity.
Furthermore, at the water intake of the Duchang County water treatment plant, the dominant species concentration exceeded 1.0 × 10⁷ cells/L for a sustained period of five months (June to October). The peak density of Pseudanabaena sp. (the dominant species) reached 2.56 × 10⁷ cells/L in Duchang, which was 1.68 times and 2.12 times higher than the peak densities recorded at the intakes in Hukou County and Xingzi County, respectively. Moreover, the number of dominant species exceeding 1.0 × 10⁷ cells/L was significantly greater in Duchang County compared to the other two counties.
In summary, algal growth at the Duchang County intake demonstrates characteristics of a high peak dominant species density, prolonged duration of dominance, and a greater abundance of dominant species. This further confirms that the Duchang County intake requires special attention.

3.4. Potential Impacts of Harmful Algae on Water Safety

Through the annual analysis of the dominant species of algae in Poyang Lake, it was found that there were many common toxic/odor-producing algae strains among the dominant species. Based on the comprehensive analysis of the literature, the potential threats from the dominant species of toxic (Table 4) and odorous (Table 5) harmful algae in Poyang Lake were inferred.
The main toxicity-producing algae in the dominance of Poyang Lake were Dolichospermum sp., Microcystis sp., and Raphidiopsis raciborskii, whose spatial and temporal distributions and potential toxicity profiles showed significant risks. In June and August, the average abundance of Dolichospermum sp. reached 1.49 × 10⁶ cells/L. The literature reports that it can secrete the potent neurotoxin ATX-a (LD50 for intraperitoneal injection in mice: 0.23 μg/g) and the paralytic shellfish toxin STX (LD50 for intravenous injection in mice: 3.4 μg/kg). Among these, the extracellular toxin ATX-a may increase exposure risks. Microcystis sp., with an average abundance of 5.36 × 10⁶ cells/L in August–October, produces microcystin toxins (MCs), whose biomass is positively correlated with toxin concentration (r = 0.47) [22], and long-term exposure to MCs at low doses may induce hepatocellular carcinomas [23]. In November, the abundance of Raphidiopsis raciborskii at the Duchang County water intake reached 9.4 × 10⁶ cells/L, approaching the cyanobacterial bloom threshold. The literature reports that this species can secrete the highly toxic cylindrospermopsin (CYN; LD50: 200 μg/kg) and the paralytic shellfish toxin saxitoxin (STX). Therefore, June–October is the high-risk period for algal toxin exposure, and Duchang County needs to focus on prevention and control due to the simultaneous presence of multiple algal species.
In Poyang Lake, the dominant odor-producing algal species primarily consist of Cyclotella sp., Dolichospermum sp., Pseudanabaena sp., and Microcystis sp. Cyclotella sp. exhibited peak abundances (average 2.72 × 10⁶ cells·L−1) in March and June–July, releasing fishy-smelling compounds including heptanal and 2,4-decadienal [24]. Dolichospermum sp. concurrently produced geosmin (GSM; odor threshold: 4–10 ng/L) and 2-methylisoborneol (2-MIB; odor threshold: 10 ng/L) [13,25]. From June to September, the abundance of Pseudanabaena sp. reached 2.45 × 10⁷ cells/L. Studies indicate that its extracellular 2-MIB (2-methylisoborneol) concentration (2.2–27 fg/cell) is positively correlated with temperature and light intensity [26]. During August and September, Microcystis aeruginosa, as the predominant dominant species, may produce β-cyclocitral—a compound responsible for earthy/musty off-flavors (odor threshold: 19 ng/L) [27].
Synergistic interactions among these algal species may collectively elevate odorant concentrations above sensory thresholds from June to October. Notably, Dolichospermum sp., Pseudanabaena sp., and Microcystis sp. pose dual risks because they simultaneously produce cyanotoxins and odor compounds. Particular attention should be directed toward their compounded pollution effects due to the co-occurrence of toxic and odorous metabolites.
Table 4. Variation patterns of dominant potentially toxigenic algal species and environmental risk assessment at three drinking water intakes in Poyang Lake.
Algal SpeciesToxinsPer-Cell ProductionToxicity Magnitude (For Mice)Environmental/Human Health Risks
Dolichospermum sp.ATX-a 0.23 mg/kgATX-a is an extracellular neurotoxin [28];
STX The toxic dose of STX for 1 mouse unit: 0.189 μg [29]STX is a type of highly toxic algal toxin [29]
MCs Unspecified typesHepatotoxic potential [30]
Pseudanabaena sp.MCs (partial producers) [31] Hepatotoxic potential [30]
Microcystis sp.MCs (MC-LR is the main variant)0.1–1.38 pg/cell [31]MC-LR:0.05–0.1 mg/kg intraperitoneal [13]MC-LR: predominant congener with hepatotoxicity and chronic carcinogenic risk [13]
RaphidiopsisraciborskiiCYN0.01–0.11 μg/106 cells [32]LD50: 0.2 mg/kg intraperitoneal [33]; 4.4~6.9 mg/kg oral [34]CYN: cytotoxic water-soluble alkaloid; inhibits protein/glutathione synthesis; potential carcinogen [35]
Notes: ATX-a, anatoxin-a; MCs, microcystins; MC-LR, most widespread and toxic MC variant; STX, saxitoxin; CYN, cylindrospermopsin.
Table 5. Variation patterns of dominant odor-producing algal species and odor threshold values at three drinking water intakes in Poyang Lake.
Odor CompoundsAlgal SpeciesOdor Threshold (ng·L−1)Odor Perception
Heptanal, 2,4-decadienal [24]Cyclotella sp. Fishy odor
GSMDolichospermum sp.(4~10 [25])Earthy-musty odor
2-MIBDolichospermum sp., Pseudanabaena sp.10 [25]Earthy-musty odor
β-cyclocitralMicrocystis sp.19 [25]Grassy odor
Notes: 2-MIB, 2-methylisoborneol; GSM, geosmin.

4. Discussion

4.1. Characteristics of Algal Community Distribution and Eutrophication Assessment

The algal species composition at the water intakes of three typical water treatment plants in Poyang Lake exhibited a Chlorophyta–Bacillariophyta–Cyanobacteria pattern in our study. Algal cell density was relatively low in spring and winter, when Bacillariophyta dominated the community (this is what has been observed in this study and is substantiated by the tables and figures). Bacillariophyta are known to generally be cold-tolerant and dominate during cold months [36]. In contrast, during summer and autumn hot–humid periods, algal cell density increased significantly to a maximum of 1.03 × 10⁸ cells·L−1. This peak coincided with the predominance of small-sized/colonial cyanobacteria—taxa exhibiting known thermal optima under elevated temperatures [37]. The dominant species, including Microcystis sp., Pseudanabaena sp., Leptolyngbya sp., and Raphidiopsis raciborskii, accounted for over 90% of the total algal cell density.
As the largest freshwater lake in China, Poyang Lake has been extensively studied since the 1980s [38]. From 1988 to 2015, the algal composition remained dominated by Chlorophyta, Bacillariophyta, and Cyanobacteria, with a consistent trend of increasing cyanobacterial proportions over the years [39]. Surveys from 2019 to 2020 in typical river–lake confluence areas showed peak algal cell density in summer, reaching 6.89 × 10⁷ cells·L−1 [40]. In 2020, the annual average cyanobacterial cell density in the main lake area was below 1.0 × 10⁷ cells·L−1, with Pseudanabaena and Microcystis as the dominant species [41]. Recent field surveys of Poyang Lake indicate a predominant alternation pattern between Cyanobacteria and Bacillariophyta in the lake-wide algal cell density succession. Phytoplankton density exhibited a gradual increase during 2018–2020, followed by a moderate decline in 2021–2022 [42]. Following the fishing ban implemented on January 1, 2021, fish populations increased, leading to a decline in phytoplankton density at Hukou Station [42]. However, persistent high temperatures and low rainfall in 2022 resulted in a “low-water river phase,” with phytoplankton density in the main lake area reaching 2.0 × 10⁷ cells·L−1 in July [43]. During our investigation, significant water level fluctuations were observed in Poyang Lake (2023–2024), as documented by hydrological data from the Jiangxi Department of Water Resources and field sampling. Wang S.Y. et al. have demonstrated abrupt water level changes alter sediment suspension and resuspension, releasing nutrients and promoting algal growth [44]. Elevated cyanobacterial cell densities (>107 cells/L) observed at the Duchang County water intake during summer and autumn, reaching levels indicative of mild algal blooms, may be associated with water level fluctuations. The spatiotemporal dynamics of algal species composition and abundance in Poyang Lake are documented in Supplementary Table S1.
Eutrophication has become a major water pollution concern in recent years, primarily due to elevated nitrogen and phosphorus concentrations disrupting aquatic nutrient balance and triggering excessive algal growth [45]. Historical studies confirm that filamentous Pseudanabaena sp. and Microcystis sp.—common in eutrophic waters—indicate that Poyang Lake’s water quality has reached a eutrophic state [41,46]. Eutrophication peaks in summer, correlating with Cyanobacteria achieving maximum growth rates at temperatures above 25 °C [47]. Notably, water turbulence can suppress surface Cyanobacterial aggregation [48], but under calm conditions, the risk of algal bloom accumulation remains high, consistent with summer observations in Duchang County.
Due to variations in geographic characteristics across different sites in Poyang Lake, cyanobacterial distribution exhibited spatial heterogeneity [10]. In our study, the Duchang County intake, located further south than those in Xingzi and Hukou Counties, experienced high water levels and reduced flow velocity during summer floods. The resulting thermal stratification may have facilitated algal vertical migration and gas vesicle regulation, enhancing cyanobacterial proliferation and aggregation [49], thereby explaining the unusually high algal cell density in Duchang County. In contrast, the intakes near the main navigation channels in Xingzi and Hukou Counties exhibited stronger turbulence, higher nutrient diffusion efficiency, and suppressed algal accumulation [50]. Consequently, water treatment plants in Duchang County should remain vigilant against cyanobacterial blooms during summer.

4.2. Potential Impacts of Algae on Drinking Water Safety and Mitigation Measures

The annual average algal abundance in Poyang Lake reached 1.56 × 10⁷ cells·L−1, with the highest value recorded in Duchang County (1.03 × 10⁸ cells·L−1 in August), indicating severe algal bloom conditions. Compared to other reservoirs in China, Poyang Lake’s algal abundance was higher than that of the Danjiangkou Reservoir (5.07 × 10⁶ cells·L−1 in 2020 [51]) and Xin’anjiang Reservoir (4.04 × 10⁶ cells·L−1 in 2021–2022 [52]) but lower than Lake Taihu (1.18 × 10⁸ cells/L in 2017 [53]), which suffers from severe eutrophication. The increasing trend in algal abundance was accompanied by a rising proportion of Cyanobacteria, from 65.9% in 2019 to over 90% in 2021 [48], reflecting their expanding competitive advantage. During our study, Duchang County experienced prolonged cyanobacterial blooms (exceeding 1 × 10⁷ cells·L−1 from June to October), increasing the risk of vertical migration via gas vesicles and surface scum accumulation near water intakes.
The elevated algal abundance in Poyang Lake exacerbates algal-derived pollution, posing two major threats to drinking water safety: (1) direct interference with water treatment processes, as algal cells clog filters and increase sludge disposal costs after coagulation–sedimentation [54], and (2) the accumulation of secondary metabolites, as during June–October, high cyanobacterial abundance leads to elevated levels of microcystins (MCs), anatoxin-a (ATX-a), and cylindrospermopsin (CYN), as well as taste-and-odor compounds such as 2-methylisoborneol (2-MIB), geosmin, and unsaturated aldehydes. Conventional treatment struggles to remove these contaminants effectively. Moreover, oxidant overdosing under high-algal conditions triggers cell lysis, releasing intracellular toxins and creating a vicious cycle of reduced treatment efficiency and aggravated secondary pollution [55,56].
To mitigate these risks, we propose the following strategies: (1) eutrophication control—strengthen monitoring to identify pollution sources and hotspots, implement ecological ditches and wetland buffers to intercept agricultural runoff, and promote controlled-release fertilizers to reduce nutrient inputs [57]; (2) water treatment optimization— establish dynamic monitoring and graded treatment protocols, integrating pre-oxidation and granulated activated carbon (GAC) adsorption after rapid filtration to remove algae and metabolites. Coagulant dosing strategies should be optimized to minimize cell rupture and enhance toxin/odor removal [58]. Additionally, the application of ozone during the post-oxidation stage at the end of the water treatment process is recommended, as it effectively degrades cyanotoxins and compounds causing aquatic odor problems.

4.3. Risk Identification Methods for Algal Blooms in Drinking Water Sources

Given the complex and variable conditions triggering algal bloom occurrence in natural water bodies like Poyang Lake, coupled with the absence of standardized assessment criteria [10], water management authorities face significant challenges in implementing targeted monitoring. To address this, we developed a general operational guidance framework for algal bloom priority surveillance (Figure 6) based on existing research, which not only streamlines surveillance complexity in large-scale aquatic systems but also enables targeted monitoring of critical algal-prone areas. The operational framework integrates three critical dimensions of algal bloom early-warning indicators: (1) key monitoring area identification, (2) high-risk period determination, and (3) harmful algal warnings. The modular design of this framework enables application across diverse lake and reservoir systems. The specific evaluation methodology of the systematic monitoring framework is structured as follows (Figure 6).
To strengthen algal monitoring, initially strategically positioned sampling sites are established across the study area, followed by continuous monthly algal sample collection over 12 consecutive months. Specimens are subsequently taxonomically characterized using integrated morphological analysis, molecular biological techniques, and AI-powered image recognition, ultimately establishing a comprehensive monthly algal community structure database for each monitoring location, from which information on the following three aspects was derived.
(1)
Identification of Key Monitoring Areas
The systematic methodology initially requires the computation of mean cyanobacterial cell density values across 12-month periods for each sampling site. To address substantial spatial heterogeneity across numerous monitoring locations with wide-ranging density values (typically spanning 3–5 orders of magnitude), we recommend the logarithmic transformation of cyanobacterial density data. Sampling sites exhibiting log10-transformed means >7 (equivalent to >107 cells/L) are consequently designated priority monitoring areas. Our findings highlight significant spatial disparities in algal proliferation across Poyang Lake. Duchang County exhibited persistently elevated algal densities, which has been designated as a priority monitoring area for algal surveillance. This approach aligns with prior studies emphasizing the importance of region-specific monitoring in assessing algal bloom dynamics [59].
(2)
Determination of High-Risk Periods
Identifying months with elevated algal bloom risks is essential for timely intervention [60]. Following the identification of high-risk spatial areas, our framework incorporates both seasonally persistent elevated levels and episodic peaks (single-month anomalies) in algal growth. Consequently, any month exhibiting logarithmic-transformed algal cell density values exceeding 7 is classified as a high-risk temporal period. E. Zohdi et al. [61] demonstrate the necessity of seasonal monitoring to predict and mitigate harmful algal blooms (HABs).
(3)
Harmful Algae Warnings
The systematic methodology incorporates inventories of both toxin-producing and taste/odor-causing algal species. Further analysis of dominant algal species during high-risk periods enhances risk assessment accuracy. However, during the preservation of algal samples, the algal colonies often undergo disaggregation, thus challenging the species-level identification of amorphous colonial forms, notably toxigenic Microcystis sp. Integrated morphological–molecular analysis (e.g., micellar layer thickness and 16S-23S ITS sequencing) enables precise toxic strain identification (e.g., M. aeruginosa vs. M. flos-aquae) [62]. AI imaging (>92% accuracy) accelerates the detection of toxic/odor-producing algae in the water body [63]. These advances support establishing a species-specific harmful algae database for optimizing water treatment in Poyang Lake.
This integrated monitoring framework serves as a foundational pillar for aquatic ecosystem management, encompassing the identification of key monitoring areas, the determination of high-risk periods, and harmful algae warnings. This approach holistically deciphers algal dynamics and establishes a scientific foundation for preventing and regulating harmful algal blooms.

5. Conclusions

This study investigated the dynamics of phytoplankton communities at three water intake points in Poyang Lake over one year. The results showed significant spatiotemporal variations in algal cell density and composition, with cyanobacteria dominating during summer and autumn. Duchang County emerged as a critical risk area due to its high algal density and prolonged periods of cyanobacterial blooms. Nutrient status evaluation indicated mild eutrophication in Duchang during summer and autumn. Potentially harmful algae, such as Pseudanabaena sp. and Microcystis sp., were abundant, posing risks from toxin production and odor compounds. Building upon these findings, we systematized a three-tiered algal monitoring framework that structurally integrates key monitoring area identification, high-risk period identification, and harmful algal warnings, each substantiated by our empirical observations in Poyang Lake.

Supplementary Materials

The following supporting information can be downloaded at: https://www.mdpi.com/article/10.3390/w17132034/s1, Table S1. The spatiotemporal dynamics of algal species composition and abundance in Poyang Lake.

Author Contributions

B.L.: investigation, data curation, graphic design, chart creation, and visualization; J.L.: writing—original draft and chart creation; Y.H.: investigation and methodology; S.C.: software and validation; S.L. and X.Z.: conceptualization, supervision, and funding acquisition. All authors have read and agreed to the published version of the manuscript.

Funding

This research was funded by the National Natural Science Foundation of China (52260001) and the National Key R&D Program of China (2022YFC3203601).

Data Availability Statement

The data presented in this study are available on request from the corresponding author.

Acknowledgments

The authors gratefully acknowledge Rongli Miao from the Hydrobiological Data Analysis Center at the Institute of Hydrobiology, Chinese Academy of Sciences, for her professional support in algal community analysis.

Conflicts of Interest

The authors declare no conflicts of interest.

References

  1. Wang, X.; Liu, Z.; Xu, Y.J.; Mao, B.; Jia, S.; Wang, C.; Ji, X.; Lv, Q. Revealing nitrate sources seasonal difference between groundwater and surface water in China’s largest fresh water lake (Poyang Lake): Insights from sources proportion, dynamic evolution and driving forces. Sci. Total Environ. 2025, 958, 178134. [Google Scholar] [CrossRef] [PubMed]
  2. Cai, Q. Healthy Yangtze River and Ecological Poyang Lake: Keynote Address at the Symposium on Conservation and Management of Lakes in the Yangtze River Basin. Yangtze River 2009, 40, 1–4. [Google Scholar]
  3. Dai, G.; Peng, N.; Zhong, J.; Yang, P.; Zou, B.; Chen, H.; Lou, Q.; Fang, Y.; Zhang, W. Effect of metals on microcystin abundance and environmental fate. Environ. Pollut. 2017, 226, 154–162. [Google Scholar] [CrossRef]
  4. Liu, J.; Chen, Y.; Li, M.; Liu, B.; Liu, X.; Wu, Z.; Cai, Y.; Xu, J.; Wang, J. Water-level fluctuations are key for phytoplankton taxonomic communities and functional groups in Poyang Lake. Ecol. Indic. 2019, 104, 470–478. [Google Scholar] [CrossRef]
  5. Wu, Z.S.; He, H.; Cai, Y.J.; Zhang, L.; Chen, Y.W. Spatial distribution of chlorophyll a and its relationship with the environment during summer in Lake Poyang: A Yangtze-connected lake. Hydrobiologia 2014, 732, 61–70. [Google Scholar] [CrossRef]
  6. Walsh, J.J.; Dieterle, D.A.; Lenes, J. A numerical analysis of carbon dynamics of the Southern Ocean phytoplankton community: The roles of light and grazing in effecting both sequestration of atmospheric CO2 and food availability to larval krill. Deep-Sea Res. 2001, 48, 1–48. [Google Scholar] [CrossRef]
  7. Xu, H.; Paerl, H.W.; Qin, B.Q.; Zhu, G.W.; Gao, G. Nitrogen and phosphorus inputs control phytoplankton growth in eutrophic Lake Taihu, China. Limnol. Oceanogr. 2010, 55, 420–432. [Google Scholar] [CrossRef]
  8. Burford, M.A.; Carey, C.; Hamilton, D.P.; Huisman, J.; Paerl, H.W.; Wood, S.A.; Wulff, A. Perspective: Advancing the research agenda for improving understanding of cyanobacteria in a future of global change. Harmful Algae 2020, 91, 101601. [Google Scholar] [CrossRef]
  9. Ding, N.; Xu, D.; Liu, K.; Zhou, Y.-F. Characteristics of Periphytic Algae Communities in Wuli Lake, Lake Taihu. Acta Agric. Univ. Jiangxiensis 2015, 37, 346–352. [Google Scholar]
  10. Wan, S.S.; Liu, J.F.; Chen, Y.W.; Zhang, L.; Wang, X.; Li, H. Spatiotemporal Distribution Characteristics and Influencing Factors of Phytoplankton Community Structure in Poyang Lake. J. Nanchang Inst. Technol. 2024, 43, 42–50+64. [Google Scholar]
  11. Gonzalez-Torres, A.; Pivokonsky, M.; Henderson, R.K. The impact of cell morphology and algal organic matter on algal floc properties. Water Res. 2019, 163, 114887. [Google Scholar] [CrossRef] [PubMed]
  12. Rao, N.R.H.; Granville, A.M.; Henderson, R.K. Understanding variability in algal solid-liquid separation process outcomes by manipulating extracellular protein-carbohydrate interactions. Water Res. 2021, 190, 116747. [Google Scholar] [CrossRef] [PubMed]
  13. Miller, T.R.; Beversdorf, L.J.; Weirich, C.A.; Bartlett, S.L. Cyanobacterial Toxins of the Laurentian Great Lakes, Their Toxicological Effects, and Numerical Limits in Drinking Water. Mar. Drugs 2017, 15, 160. [Google Scholar] [CrossRef] [PubMed]
  14. Li, X.C.; Dreher, T.W.; Li, R.H. An overview of diversity, occurrence, genetics and toxin production of bloom-forming Dolichospermum (Anabaena) species. Harmful Algae 2016, 54, 54–68. [Google Scholar] [CrossRef]
  15. Xiong, L.; Fang, S.; Li, K.; Wu, Z.; Min, X.; Liu, J.; Xing, J.; Deng, Y.; Guo, Y. Temporal distribution patterns of phytoplankton and their drivers in Lake Poyang (China)–A monthly study from 2011 to 2019. Ecol. Indic. 2021, 133, 108435. [Google Scholar] [CrossRef]
  16. Qin, J.; Ye, H.; Lin, K.; Qi, S.; Hu, B.; Luo, J. Assessment of water-related ecosystem services based on multi-scenario land use changes: Focusing on the Poyang Lake Basin of southern China. Ecol. Indic. 2024, 158, 111549. [Google Scholar] [CrossRef]
  17. Sartory, D.P.; Grobbelaar, J.U. Extraction of chlorophyll a from freshwater phytoplankton for spectrophotometric analysis. Hydrobiologia 1984, 114, 177–187. [Google Scholar] [CrossRef]
  18. Hu, H.; Wei, Y. The Freshwater Algae of China: Systematics, Taxonomy and Ecology; Science Press: Beijing, China, 2006; pp. 1–1023. [Google Scholar]
  19. Wang, M.C.; Liu, X.Q.; Zhang, J.H. Lake Eutrophication Evaluation Method and Classification Standard. Environ. Monit. China 2002, 18, 47–49. [Google Scholar]
  20. McNaughton, S.J. Relationships among Functional Properties of Californian Grassland. Nature 1967, 216, 168–169. [Google Scholar] [CrossRef]
  21. DB44/T 2261-2020; Technical Specification for Classification and Monitoring of Algal Blooms. Guangdong Provincial Administration for Market Regulation: Guangzhou, China, 2020.
  22. Yuan, L.; Liao, Q.; Zhang, L.; Zhang, D.; Luo, L.; Liu, J. Seasonal and Spatial Variations of Microcystins and Their Relationships with Physiochemical and Biological Factors in Poyang Lake. Environ. Sci. 2018, 39, 450–459. [Google Scholar]
  23. Liang, X.; Yang, Y.; Xu, S.; Liu, Y.; Chu, H.; Tang, Y.; Yang, F. Long-term low-dose microcystin-LR exposure induces renal injury in mice by activating PI3K/AKT signaling pathway. J. South. Med. Univ. 2022, 42, 1486–1494. [Google Scholar]
  24. Jian, W.; Ma, X.G. Analysis of algae-derived odor problem in Hongsheng Reservoir. Chin. J. Environ. Eng. 2022, 16, 3975–3983. [Google Scholar]
  25. Wang, Y.; Zhang, C.; Zhu, y.; Liang, J.; Song, G.; Bi, Y. Spatiotemporal Dynamic Characteristics of Odor-Causing Substances in the Main Canal of the Middle Route of the South-to-North Water Diversion Project. In Proceedings of the 2019 Annual Conference of the Chinese Hydraulic Engineering Society, Zhengzhou, China, 18–20 September 2019; Volume 9, pp. 334–342. [Google Scholar]
  26. Izaguirre, G.; Taylor, W.D. A Pseudanabaena species from Castaic Lake, California, that produces 2-methylisoborneol. Water Res. 1998, 32, 1673–1677. [Google Scholar] [CrossRef]
  27. Deng, X.; Qi, M.; Ren, R.; Liu, J.; Sun, X.; Xie, P.; Chen, J. The relationships between odors and environmental factors at bloom and non-bloom area in Lake Taihu, China. Chemosphere 2019, 218, 569–576. [Google Scholar]
  28. Puddick, J.; van Ginkel, R.; Page, C.D.; Murray, J.S.; Greenhough, H.E.; Bowater, J.; Selwood, A.I.; Wood, S.A.; Prinsep, M.R.; Truman, P.; et al. Acute toxicity of dihydroanatoxin-a from Microcoleus autumnalis in comparison to anatoxin-a. Chemosphere 2021, 263, 127937. [Google Scholar] [CrossRef]
  29. Lin, Y.T.; Jia, X.P.; Yang, M.L.; Li, J.; Wu, H.; Zhou, Y. Discussion on several issues in the Kunming mouse bioassay for paralytic shellfish toxins. J. Trop. Oceanogr. 2001, 2, 88–91. [Google Scholar]
  30. Oudra, B.; Loudiki, M.; Vasconcelos, V.; Sabour, B.; Sbiyyaa, B.; Oufdou, K.; Mezrioui, N. Detection and quantification of microcystins from cyanobacteria strains isolated from reservoirs and ponds in Morocco. Environ. Toxicol. 2002, 17, 32–39. [Google Scholar] [CrossRef]
  31. Wood, S.A.; Dietrich, D.R.; Cary, S.C. Increasing Microcystis cell density enhances microcystin synthesis: A mesocosm study. Inland Waters 2012, 2, 17–22. [Google Scholar] [CrossRef]
  32. Wu, M.; Fan, L.; Wu, Y.; Qin, W.; Shang, T.; Cheng, N.; Lei, L. Low dominance of toxic genotype within the Cylindrospermopsis raciborskii population and its affecting factors in tropical reservoirs of southern China- a case study of Zhuhai city. Acta Hydrobiol. Sin. 2024, 48, 211–221. [Google Scholar]
  33. Banker, R.; Carmeli, S.; Werman, M.; Teltsch, B.; Porat, R.; Sukenik, A. Uracil moiety is required for toxicity of the cyanobacterial hepatotoxin cylindrospermopsin. J. Toxicol. Environ. Health-Part A 2001, 62, 281–288. [Google Scholar] [CrossRef]
  34. Seawright, A.A.; Nolan, C.C.; Shaw, G.R.; Chiswell, R.K.; Norris, R.L.; Moore, M.R.; Smith, M.J. The oral toxicity for mice of the tropical cyanobacterium Cylindrospermopsis raciborskii (Woloszynska). Environ. Toxicol. 1999, 14, 135–142. [Google Scholar] [CrossRef]
  35. Froscio, S.M.; Hurnpage, A.R.; Wickramasinghe, W.; Shaw, G.; Falconer, I.R. Interaction of the cyanobacterial toxin cylindrospermopsin with the eukaryotic protein synthesis system. Toxicon 2008, 51, 191–198. [Google Scholar] [CrossRef] [PubMed]
  36. Grimaud, G.M.; Mairet, F.; Sciandra, A.; Bernard, O. Modeling the temperature effect on the specific growth rate of phytoplankton: A review. Rev. Environ. Sci. Bio-Technol. 2017, 16, 625–645. [Google Scholar] [CrossRef]
  37. Visser, P.M.; Ibelings, B.W.; Bormans, M.; Huisman, J. Artificial mixing to control cyanobacterial blooms: A review. Aquat. Ecol. 2016, 50, 423–441. [Google Scholar] [CrossRef]
  38. Huang, G.Q.; Liu, Y.B.; Shi, Q.H. Research, Development, Utilization and Protection of Poyang Lake in the 60 Years since the Founding of New China. J. Jiangxi Agric. Univ. (Soc. Sci. Ed.) 2009, 8, 1–11. [Google Scholar]
  39. Qian, K.; Liu, X.; Duan, M.; Chen, Y. Distribution and its influencing factors of bloom-forming cyanobacteria in Poyang Lake. China Environ. Sci. 2016, 36, 261–267. [Google Scholar]
  40. Yu, X.; Chen, Y.; Liu, J.; Wang, J.; Xu, G.; Zou, H.; Chen, N.; Xia, Y. Analysis on the Current Situation of Phytoplankton in the Typical River Lake Ecotone of Lake Poyang. Environ. Sci. 2023, 44, 4954–4964. [Google Scholar]
  41. Hu, F.; Liu, J.-T.; Yang, P.; Wen, C.; Zhang, L.; Zhang, J. Spatial and Temporal Distribution Characteristics of Cyanobacteria and the Driving Factors in Poyang Lake. Resour. Environ. Yangtze Basin 2024, 33, 605–614. [Google Scholar]
  42. Huang, L.; Yin, H. Analysis of influencing factors of phytoplankton at different hydrological periods at the outlet of Poyang Lake. Express Water Resour. Hydropower Inf. 2025, 46, 1–13. [Google Scholar]
  43. Li, W.; Jiang, M.; Xu, L.; Hu, S.; You, H.; Zhou, Q.; Chen, Z.; Zhang, L. Spatial and temporal characteristics of phytoplankton in Lake Poyang and its response to extreme flood and drying events. J. Lake Sci. 2024, 36, 1001–1013. [Google Scholar]
  44. Wang, S.Y.; Gao, Y.; Jia, J.J.; Kun, S.D.; Lyu, S.X.; Li, Z.X.; Lu, Y.; Wen, X.F. Water level as the key controlling regulator associated with nutrient and gross primary productivity changes in a large floodplain-lake system (Lake Poyang), China. J. Hydrol. 2021, 599, 126414. [Google Scholar] [CrossRef]
  45. Zi, F.; Ge, J.; Wang, X.; Liu, F.; Song, Y.; Zhang, D.; Lin, X.; Chen, S. The relationship of phytoplankton community structure and related environmental factors in upstream reservoirs of Xinjiang. J. Tarim Univ. 2024, 36, 84–92. [Google Scholar]
  46. Qian, K.; Liu, X.; Chen, Y. Spatial distribution characteristics of periphytic algae community of Lake Poyang in the high water level phase. J. Lake Sci. 2021, 33, 102–110. [Google Scholar]
  47. Johnk, K.D.; Huisman, J.; Sharples, J.; Sommeijer, B.; Visser, P.M.; Stroom, J.M. Summer heatwaves promote blooms of harmful cyanobacteria. Glob. Change Biol. 2008, 14, 495–512. [Google Scholar] [CrossRef]
  48. Yang, P.; Liu, J.; Hu, F.; Wen, C.; Wen, H.; Wu, J.; Fu, S.; Dai, G. Influence of wind field on surface cyanobacteria density of Lake Poyang in wet season, China. J. Lake Sci. 2024, 36, 377–391. [Google Scholar]
  49. Huisman, J.; Codd, G.A.; Paerl, H.W.; Ibelings, B.W.; Verspagen, J.M.H.; Visser, P.M. Cyanobacterial blooms. Nat. Rev. Microbiol. 2018, 16, 471–483. [Google Scholar] [CrossRef]
  50. Sun, X.; Qin, B.; Zhu, G.; Zhang, Z. Effect of Wind-Induced Wave on Concentration of Colloidal Nutrient and Phytoplankton in Lake Taihu. Environ. Sci. 2007, 28, 506–511. [Google Scholar]
  51. Xiao, Y.; Cheng, J.; Mo, X.; Li, Y.; Liu, X.; Bi, S. Spatio-temporal variation of phytoplankton community and its relationship with environmental factors in Danjiangkou reservoir. J. Lake Sci. 2023, 35, 821–832. [Google Scholar]
  52. Tong, L.; Liu, D.; Duan, J.; Hu, Z.; Pan, J.; Lu, X.; Cui, S.; Liu, Q. Temporal and spatial changes of phytoplankton communities and their relationship with environmental factors in Qiandao Lake. J. Shanghai Ocean. Univ. 2024, 33, 1176–1186. [Google Scholar]
  53. Zhu, W.; Chen, H.M.; Wang, R.C.; Li, X.L.; Zhang, Y.; Zhou, M. Analysis of the Causes for the Large Bloom Area in Taihu Lake in 2017. J. Lake Sci. 2019, 31, 621–632. [Google Scholar]
  54. Liu, R.; Chen, Y.; Wang, L.; Gong, Y.; Zhang, X.; Park, M.S.; Hu, Q. Influences of cellular characteristics and media properties on membrane microalgal harvesting: A comparative study using Scenedesmus acuminatus cultivated at a pilot scale. J. Chem. Technol. Biotechnol. 2019, 94, 1679–1689. [Google Scholar] [CrossRef]
  55. Hou, C.R.; Jia, R.B. Study on the Release Characteristics of Algal Toxins from Cells Destroyed by Chemical Oxidation. China Water Wastewater 2006, 13, 98–101. [Google Scholar]
  56. Mohamed, Z.A.; Alamri, S.; Hashem, M. Endotoxin removal efficiency in conventional drinking water treatment plants, a case study in Egypt. Water SA 2022, 48, 180–186. [Google Scholar]
  57. Liu, Y.; Zheng, W.; Zhang, J.; Ma, Z.; Kuai, J.; Wang, B.; Zhou, G. Progress and its application of slow/controlled release fertilizers in agricultural production. J. Huazhong Agric. Univ. 2023, 42, 167–176. [Google Scholar]
  58. Jiang, X.Y.; Xu, S.T.; Cong, H.B.; Wang, L.; Zhang, Y.; Li, F. Removal of algal toxins in pressure-enhanced coagulation-sedimentation-filtration algae removal process. Water Wastewater Eng. 2015, 51, 120–124. [Google Scholar]
  59. Paerl, H.W.; Huisman, J. Climate-Blooms like it hot. Science 2008, 320, 57–58. [Google Scholar] [CrossRef]
  60. Woolway, R.I.; Kraemer, B.M.; Lenters, J.D.; Merchant, C.J.; O’Reilly, C.M.; Sharma, S.; Schladow, S.G.; Weyhenmeyer, G.A. Global lake responses to climate change. Nat. Rev. Earth Environ. 2020, 1, 388–403. [Google Scholar] [CrossRef]
  61. Zohdi, E.; Abbaspour, M. Harmful algal blooms (red tide): A review of causes, impacts and approaches to monitoring and prediction. Int. J. Environ. Sci. Technol. 2019, 16, 1789–1806. [Google Scholar] [CrossRef]
  62. Chen, H.M.; Zhu, W.; Wang, R.C.; Feng, G.Y.; Xue, Z.P. Rapid horizontal accumulation and bloom formation of the cyanobacterium Microcystis under wind stress. Hydrobiologia 2023, 850, 123–135. [Google Scholar] [CrossRef]
  63. Zhang, H.; Yang, S.; Zhang, X. Automatic recognition and classification of microalgae using an inception-v3 convolution neural network model. Int. J. Environ. Sci. Technol. 2024, 21, 4625–4634. [Google Scholar] [CrossRef]
Figure 1. Distribution of sampling points in Poyang Lake.
Water 17 02034 g001
Figure 2. The composition of the number of species and abundance of various phyla of algae in Poyang Lake.
Water 17 02034 g002
Figure 3. Spatiotemporal changes in algal community structure in Poyang Lake. Note: line representing “Light/mild algal bloom” is based on Table 1 data. ((a): Temporal variations in the abundance of various phyla of algae in Poyang Lake; (b): The phylum composition of the average annual algal abundance in the three counties of Poyang Lake; (c): Temporal variations in the percentage of abundance of each phylum of algae in Poyang Lake; (d): The proportion of species in the average annual algal abundance of the three counties along Poyang Lake).
Water 17 02034 g003
Figure 4. Trophic level index (TLI) as a function of (a) season and station (b) cell density.
Water 17 02034 g004
Figure 5. Spatial distribution and temporal succession of potentially harmful algae at different water intakes: (a) Duchang County, (b) Hukou County, and (c) Xingzi County. The skull indicates that the dominant species can produce toxins, and the diagonal line indicates that the dominant species can produce odorous substances.
Water 17 02034 g005
Figure 6. Flowchart for determining key algal monitoring areas, high-risk time periods, and harmful algal conditions.
Water 17 02034 g006
Table 1. The Pearson correlation coefficients rij and rij2 between Chla and other parameters in Chinese lakes (including reservoirs).
ParametersChlaTPTNSDCODMn
rij10.840.82−0.830.83
rij210.70560.67240.68890.6889
Table 2. Water body evaluation grading reference values.
Water Quality GradeWater Bloom LevelsCyanobacterial Cell Density (Cells·L−1)Trophic Levels T L I
Index
INo blooms[0, 2.0 × 10⁶)Oligotrophic[0, 30]
IINo significant bloom[2.0 × 10⁶, 1.0 × 10⁷)Mesotrophic(30, 50]
IIIMild bloom[1.0 × 10⁷, 5.0 × 10⁷)Lightly eutrophic(50, 60]
IVModerate bloom[5.0 × 10⁷, 1.0 × 10⁸)Moderately eutrophic(60, 70]
VSevere bloom≥1.0 × 10⁸Heavily eutrophic>70
Table 3. Summary of algae data at water plant intakes.
SiteMean Density (Cells·L−1)Peak-to-Mean RatioCoefficient of Variation (CV)Months Exceeding Mild Bloom Threshold
Duchang County2.70 × 1072.031.165 (June–October)
Hukou County0.91 × 1073.471.094 (May–August)
Xingzi County1.09 × 1074.321.472 (June, August)
Disclaimer/Publisher’s Note: The statements, opinions and data contained in all publications are solely those of the individual author(s) and contributor(s) and not of MDPI and/or the editor(s). MDPI and/or the editor(s) disclaim responsibility for any injury to people or property resulting from any ideas, methods, instructions or products referred to in the content.

