
Research on Urban Flood Risk Assessment Based on Improved Structural Equation Modeling (ISEM) and the Extensible Matter-Element Analysis Method (EMAM)

Abstract
1. Introduction
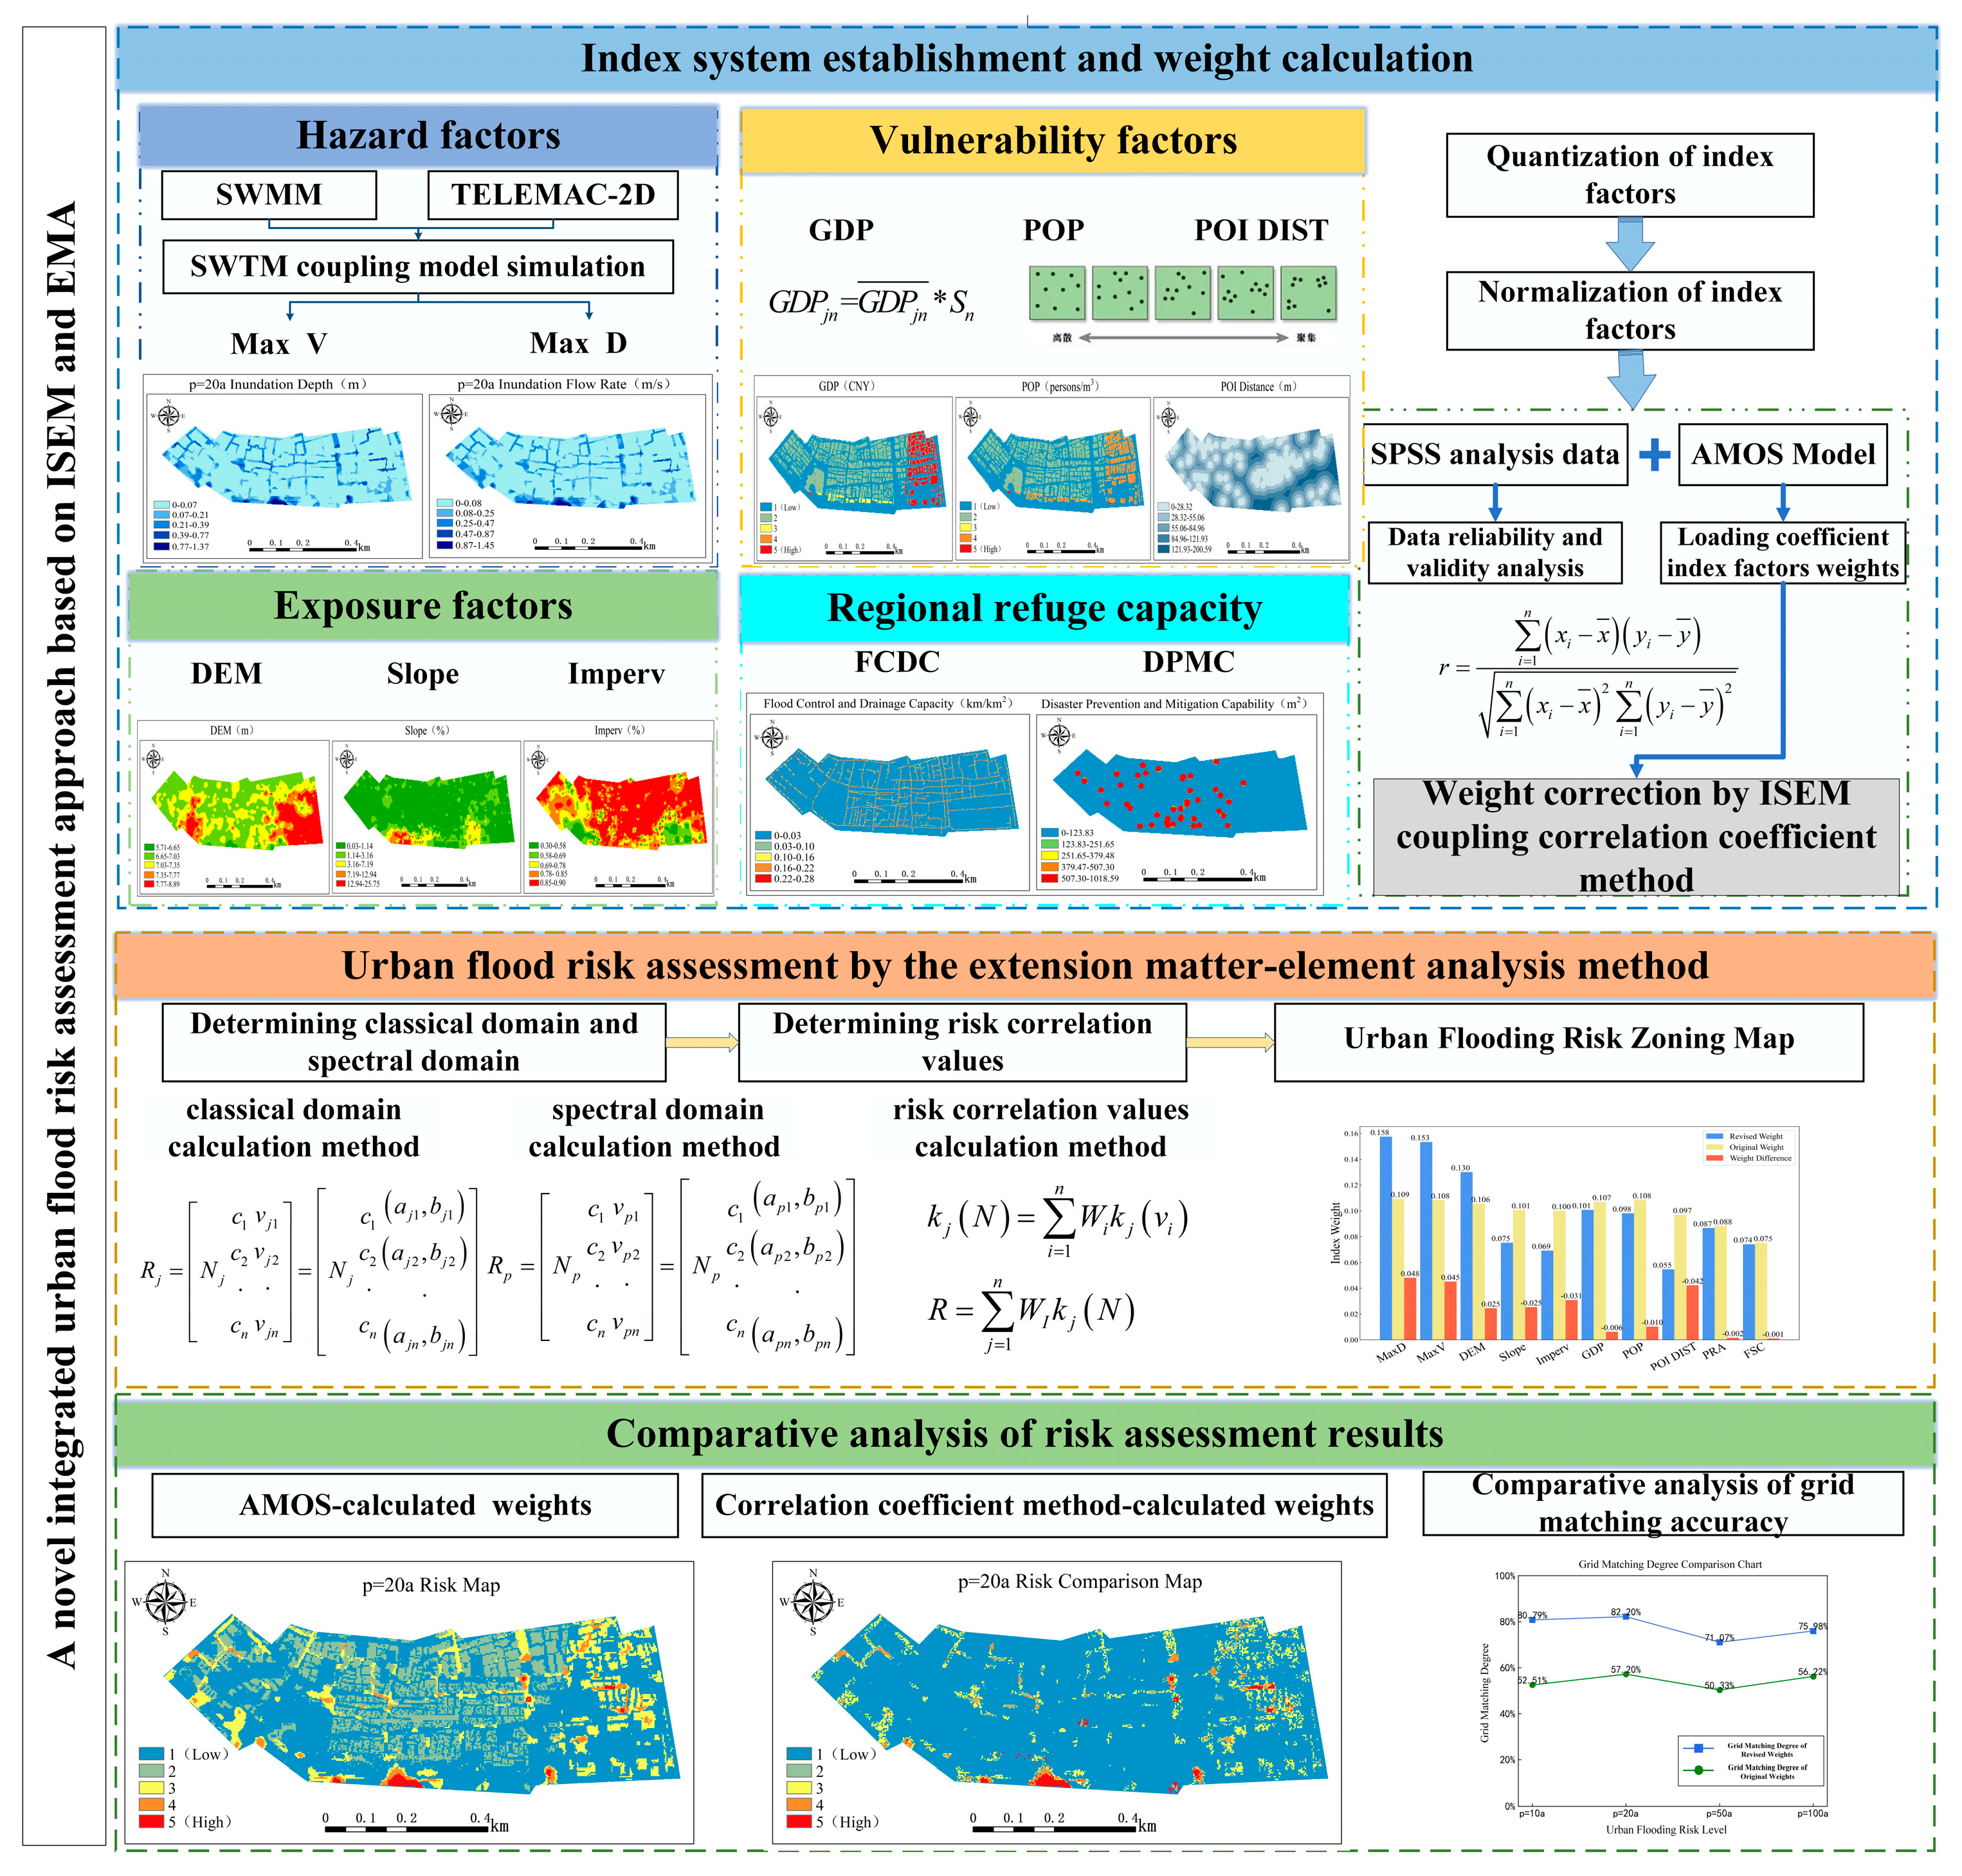
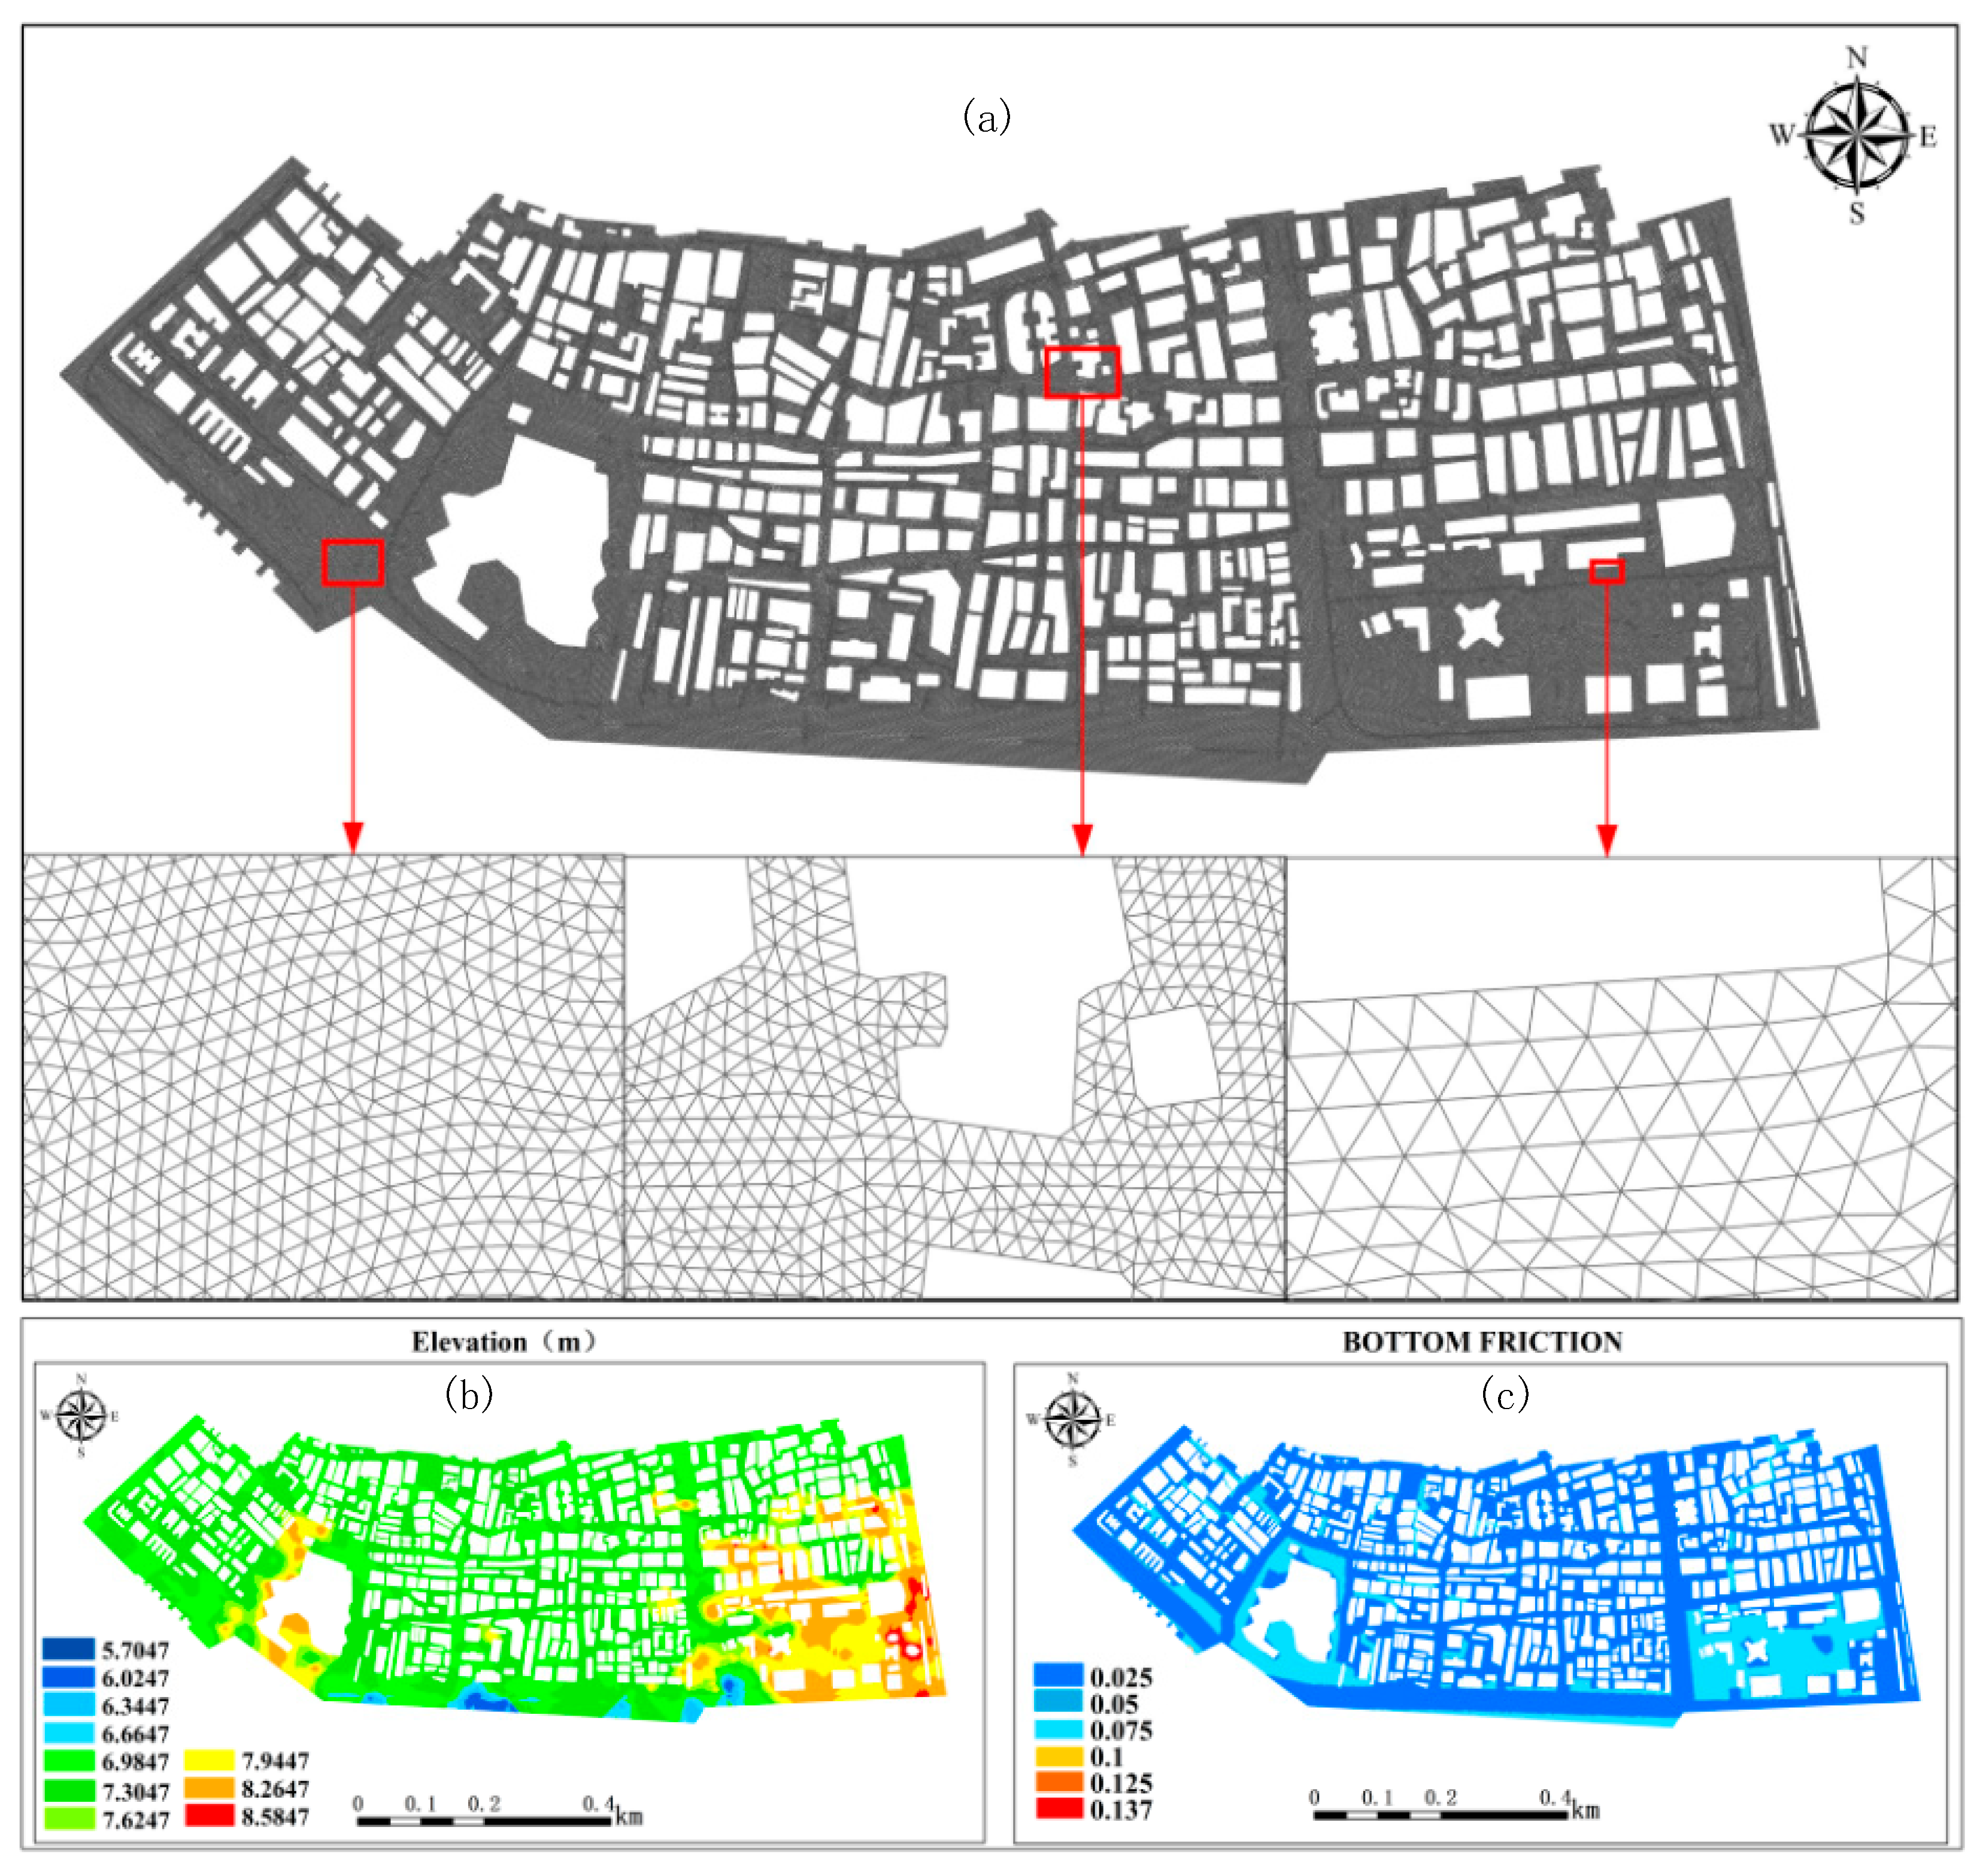
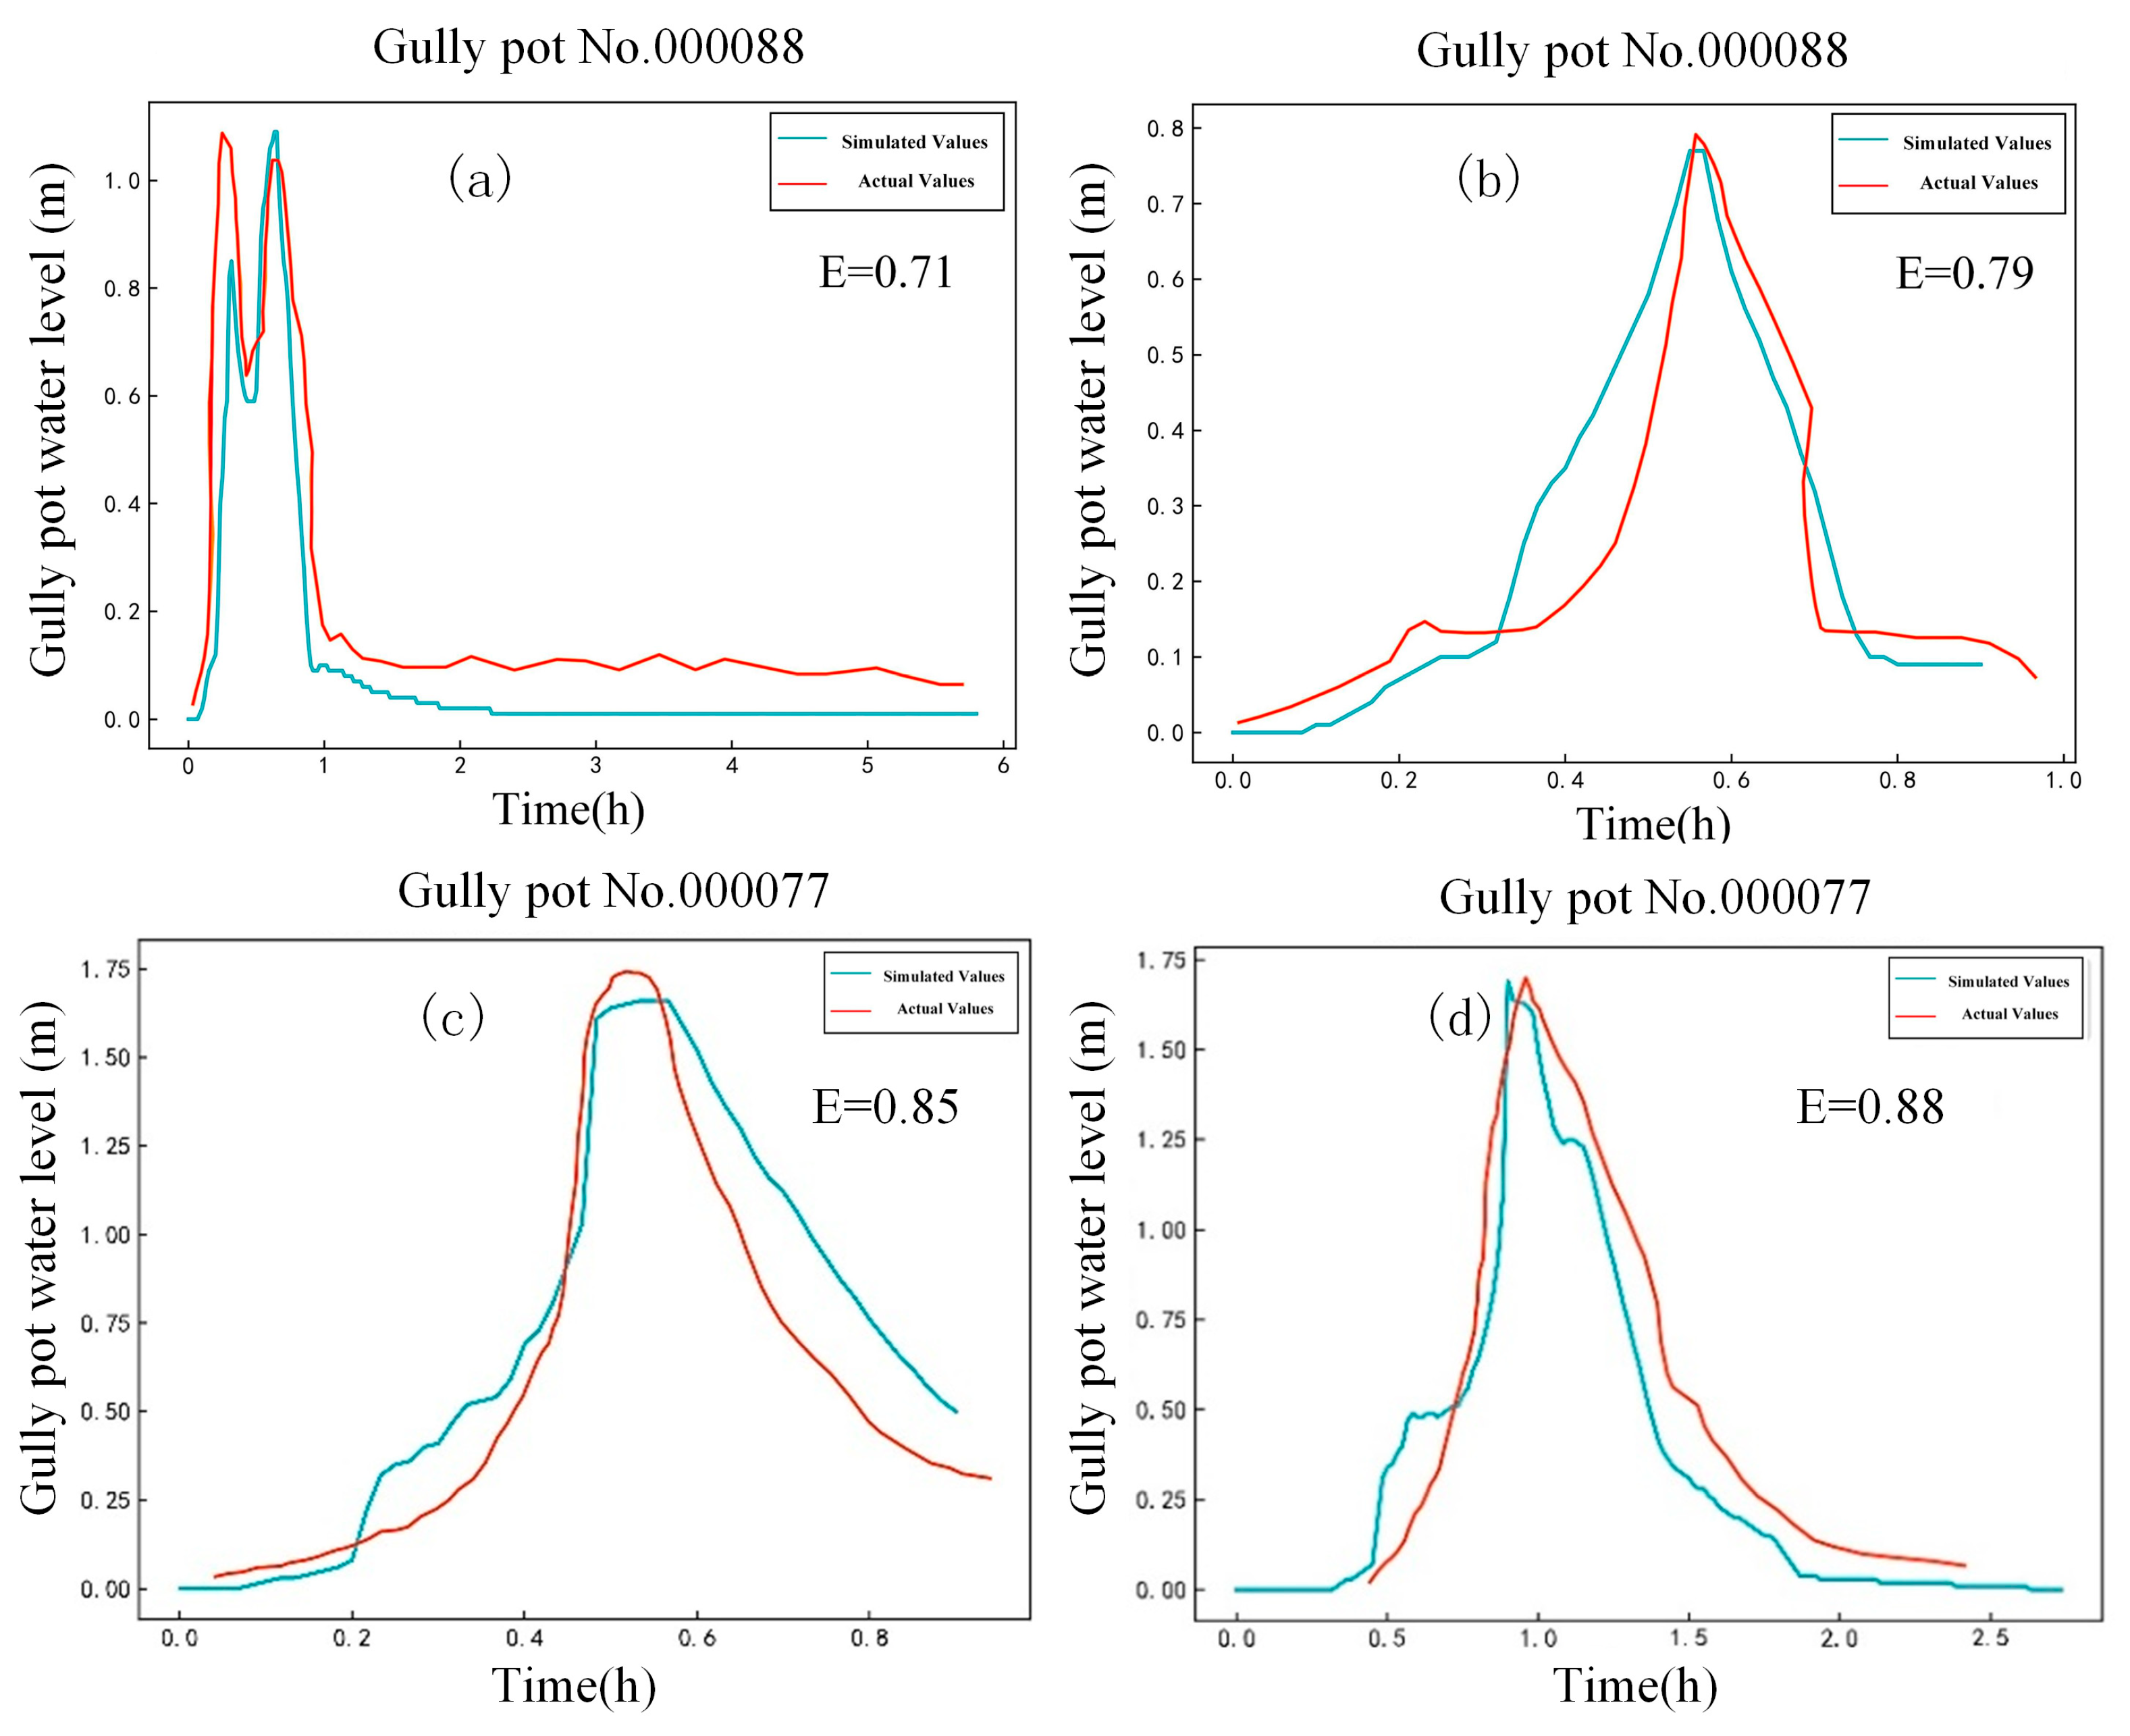
2. Methodology
2.1. Index System Establishment and Quantization
- (1)
- Hazard factors.
- (2)
- Exposure factors.
- (3)
- Vulnerability factors.
- (4)
- Regional refuge capacity factors.
2.2. Index Weight Calculation
2.3. Urban Flood Risk Assessment
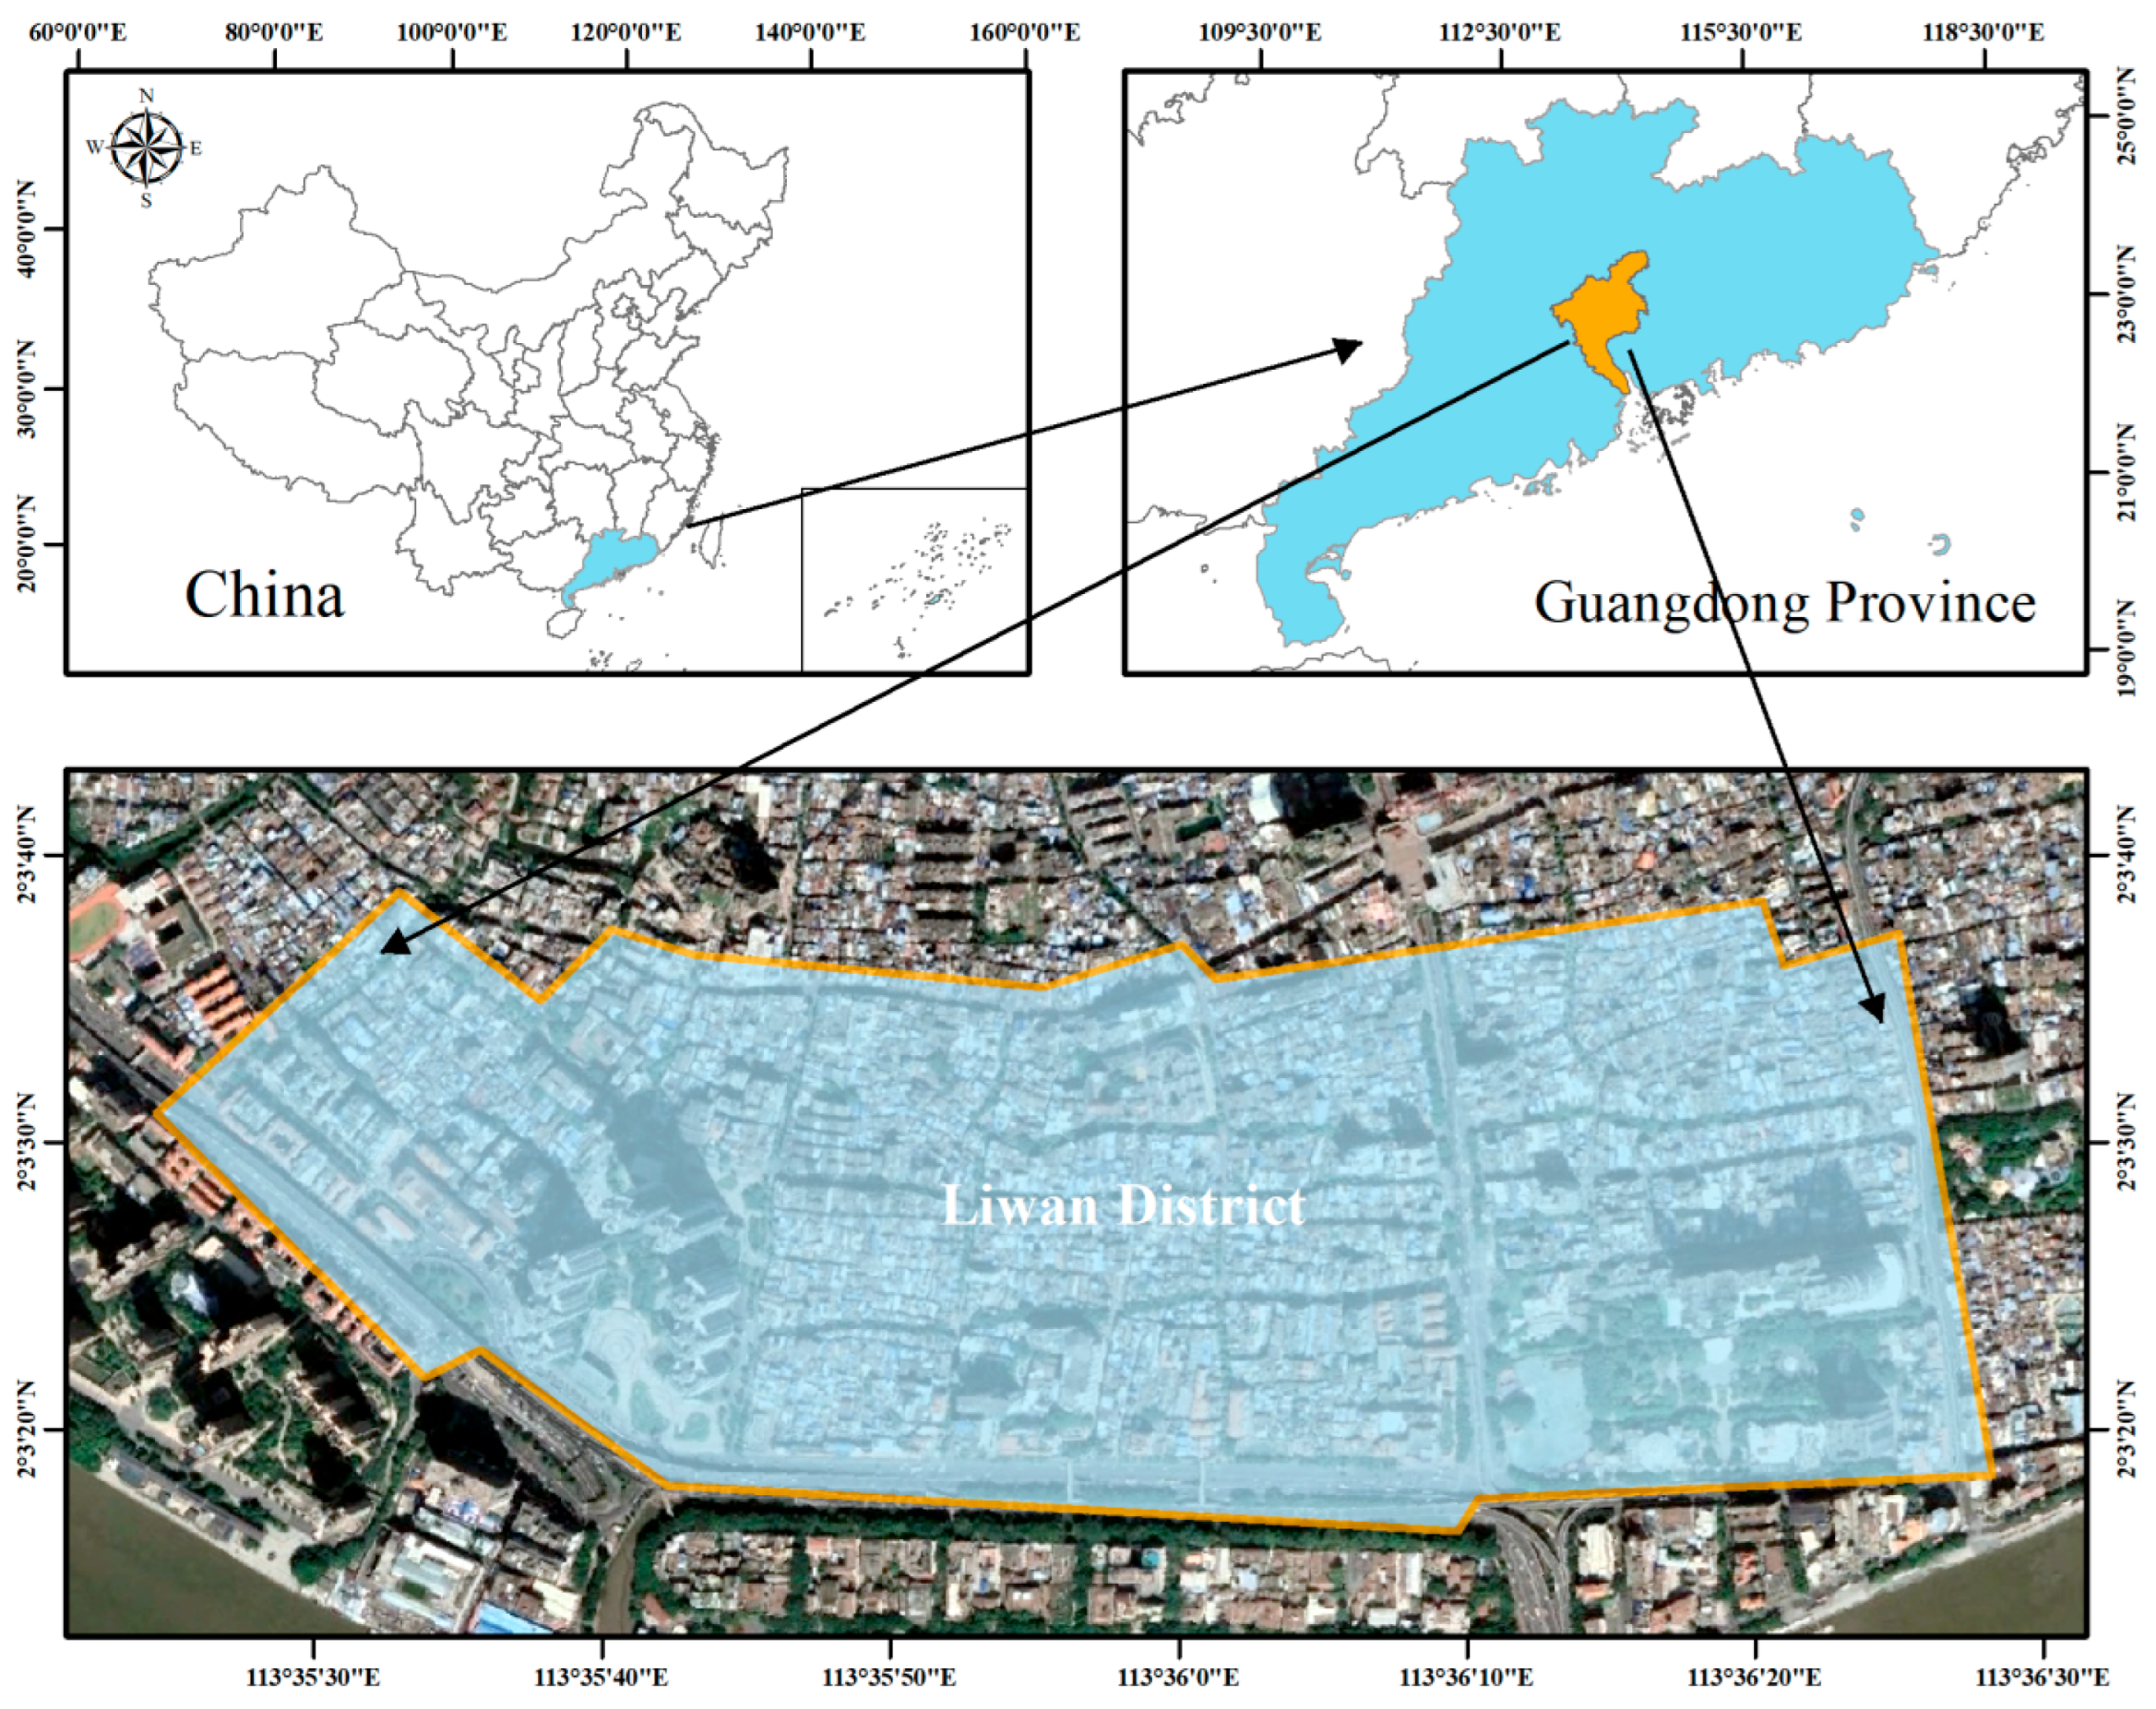
3. Case Study
3.1. Study Area
3.2. Data Sources
3.3. Urban Flood Risk Assessment Results
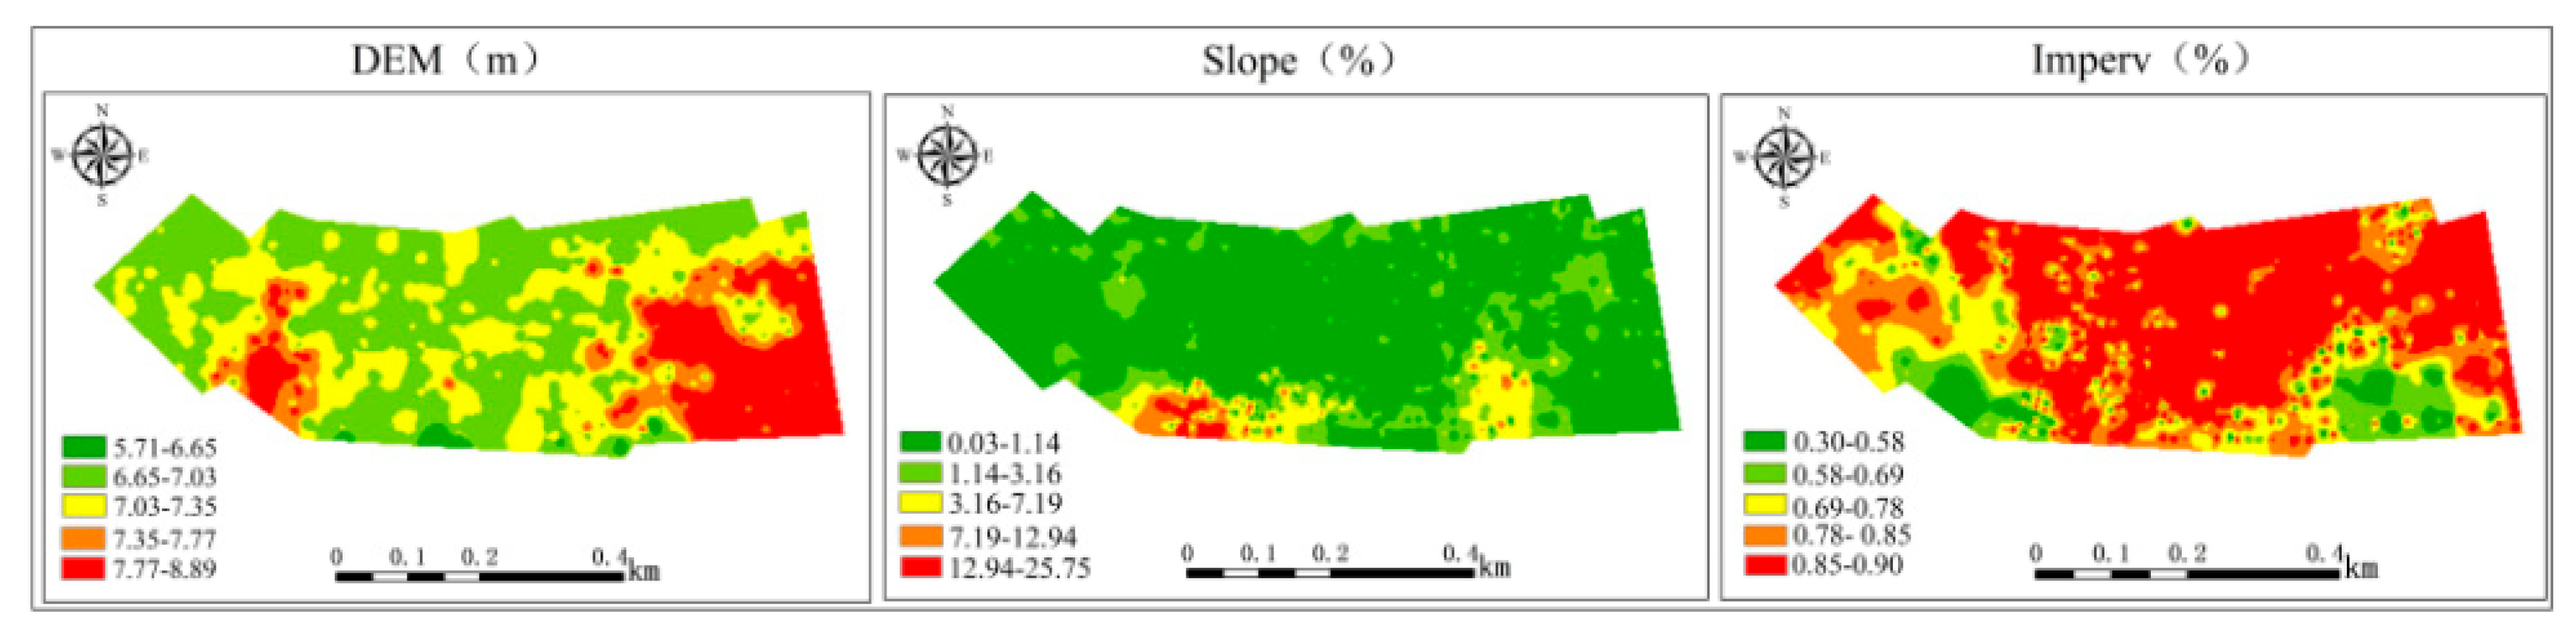
3.3.1. Results of Index Factor Analysis
Hazard Factors
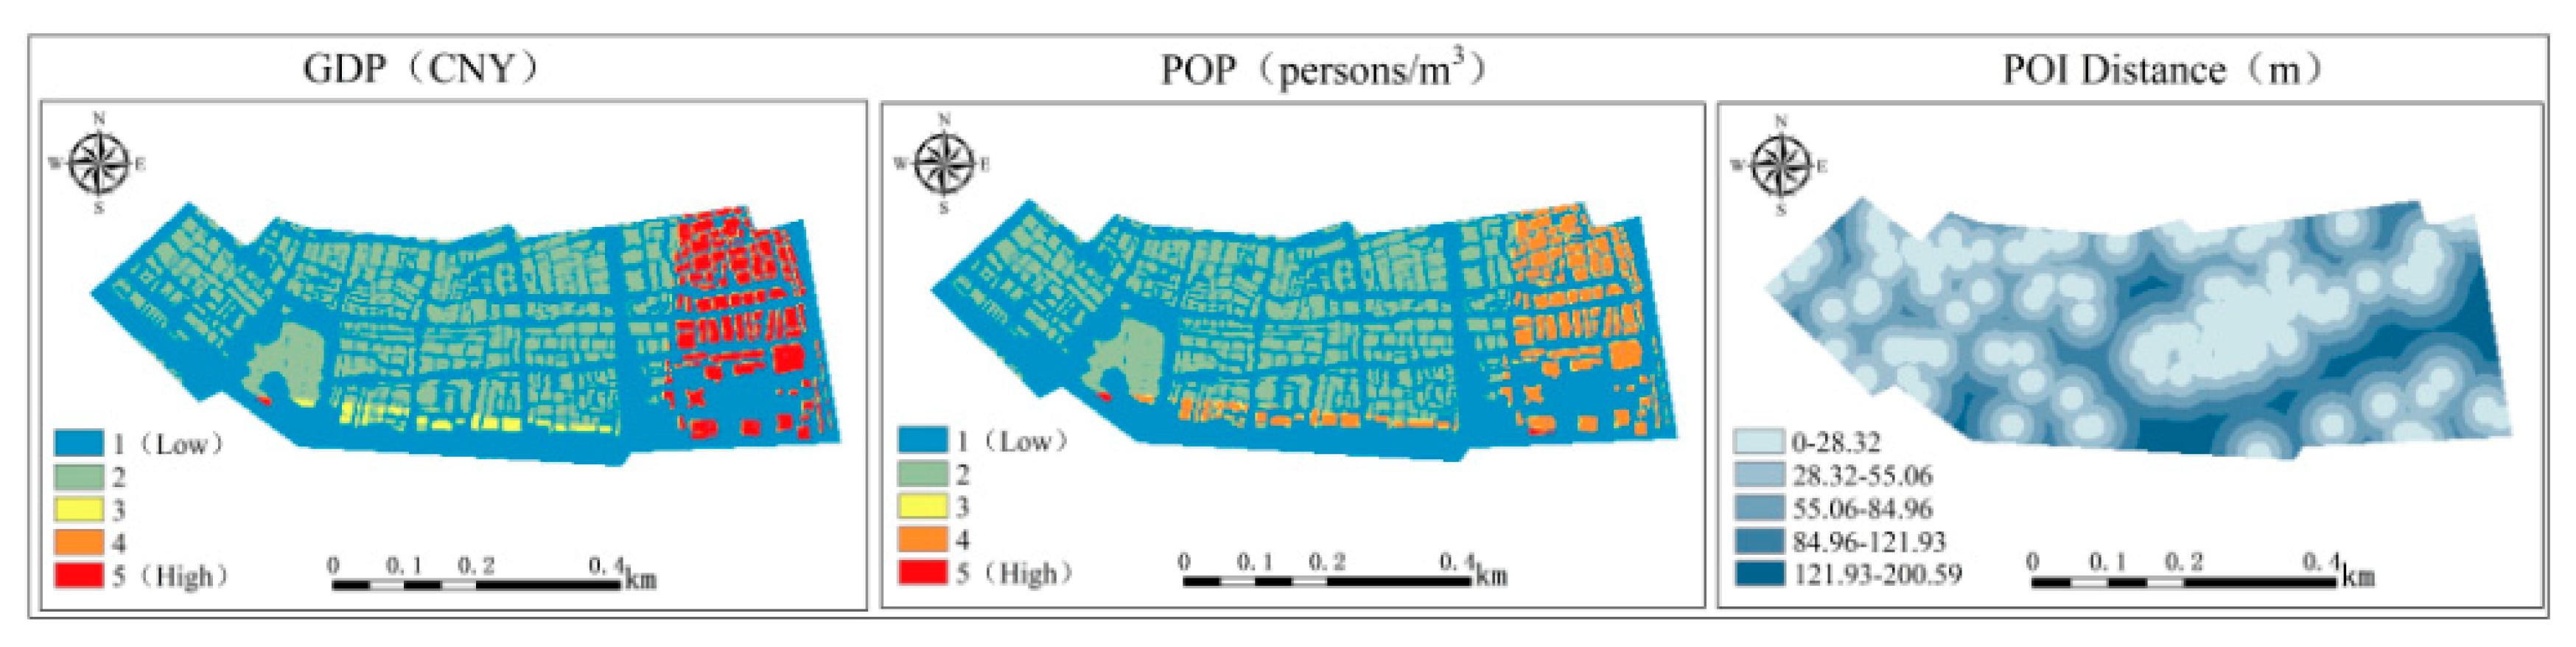
Exposure Factors
Vulnerability Factors
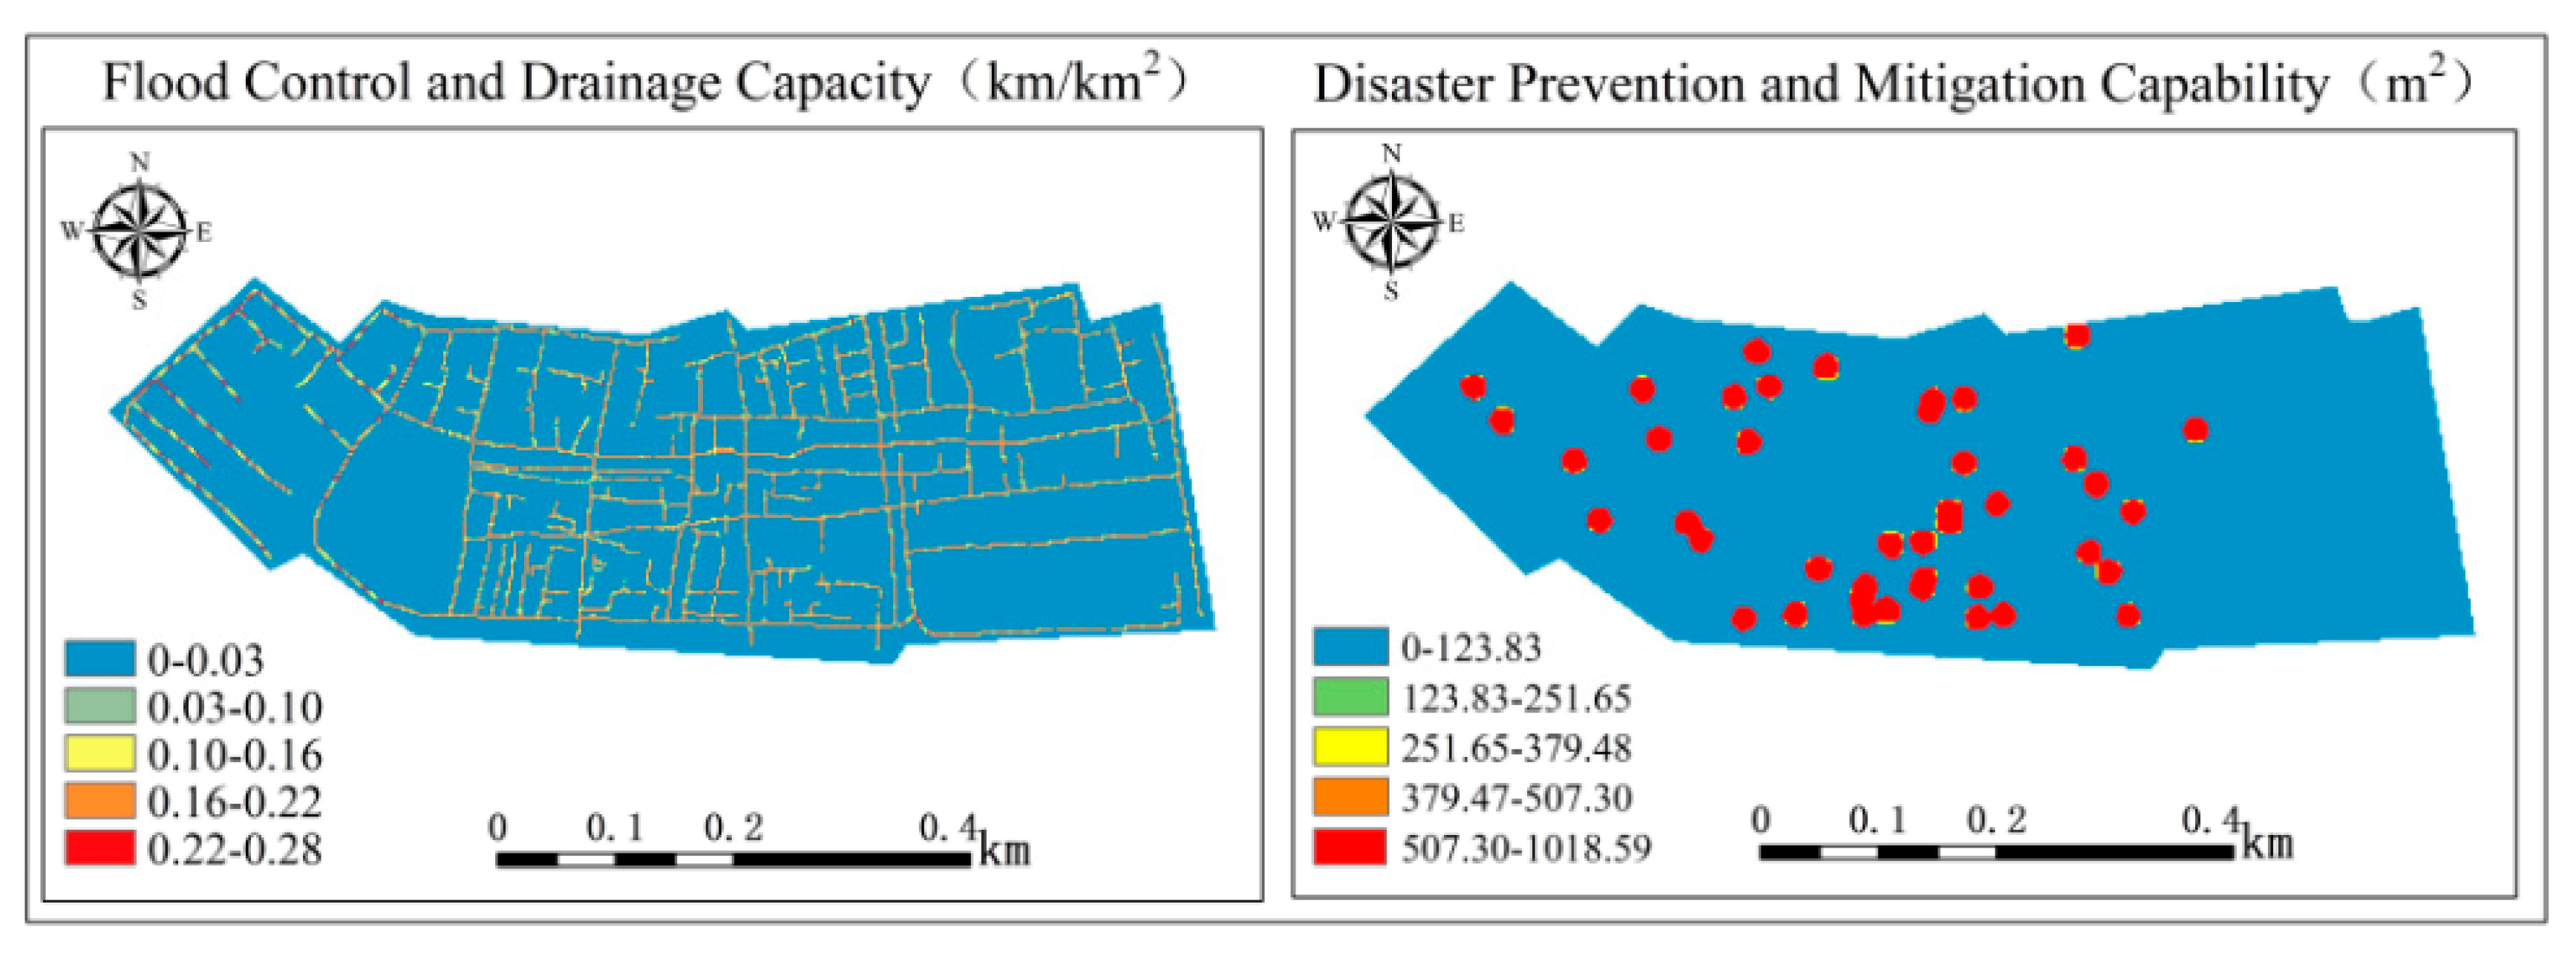
Regional Shelter Capability
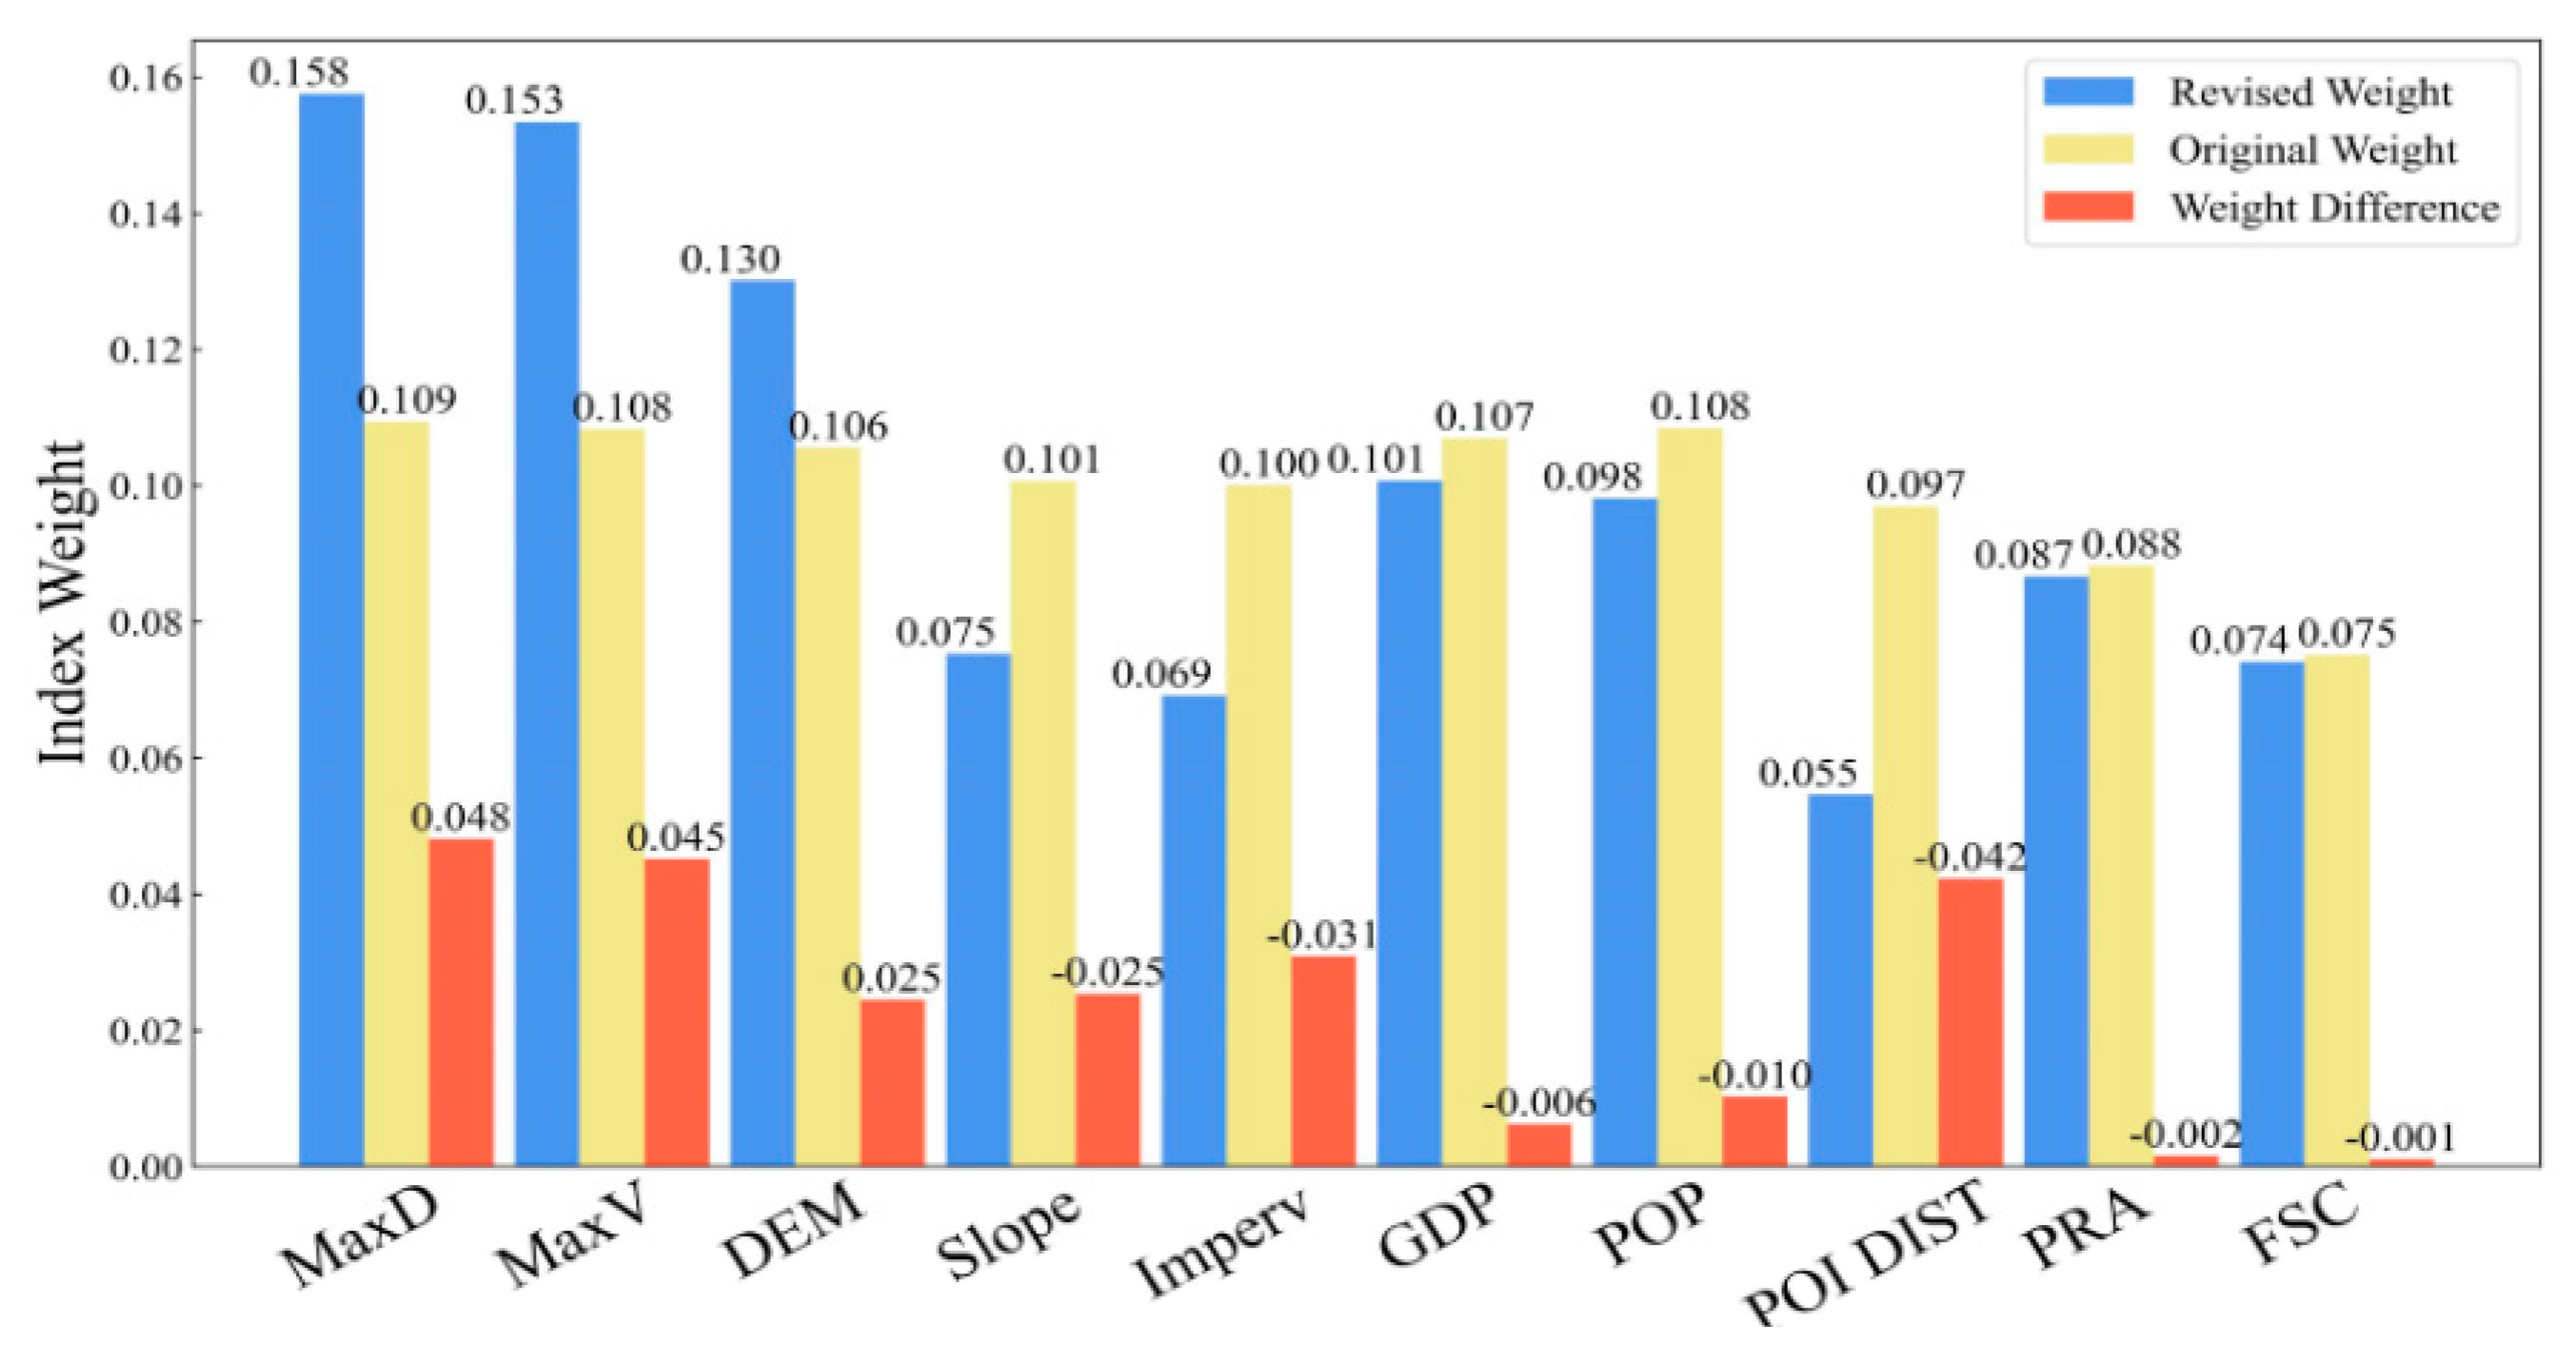
3.3.2. Index Weight Results
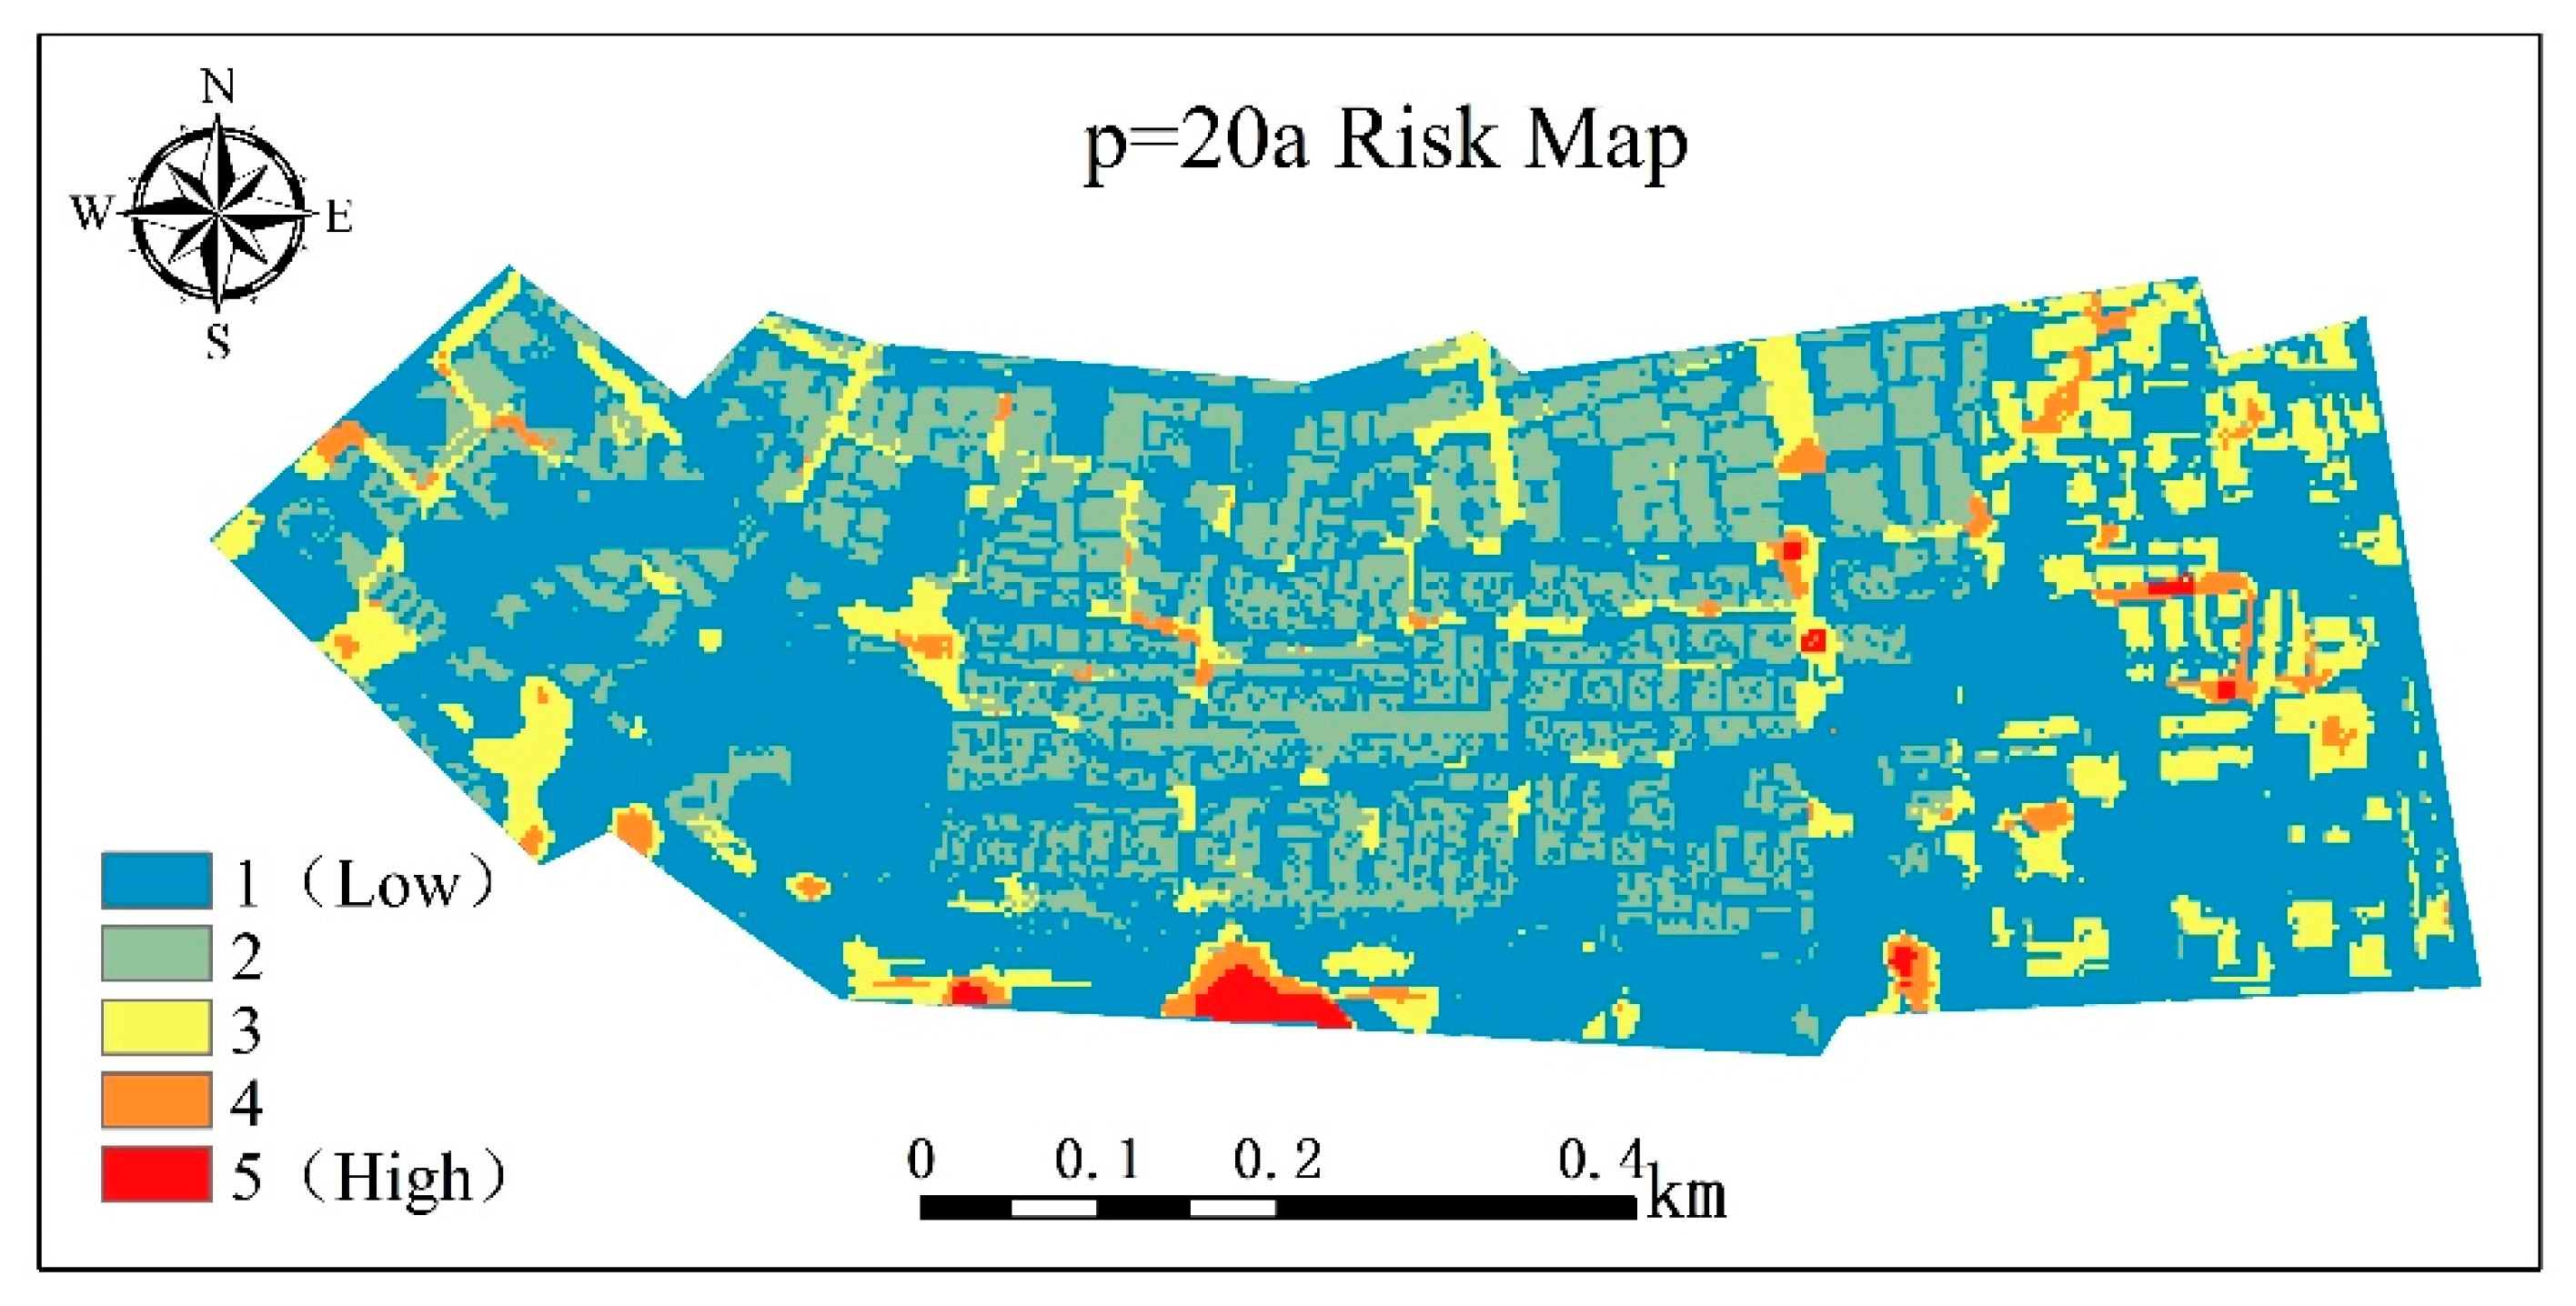
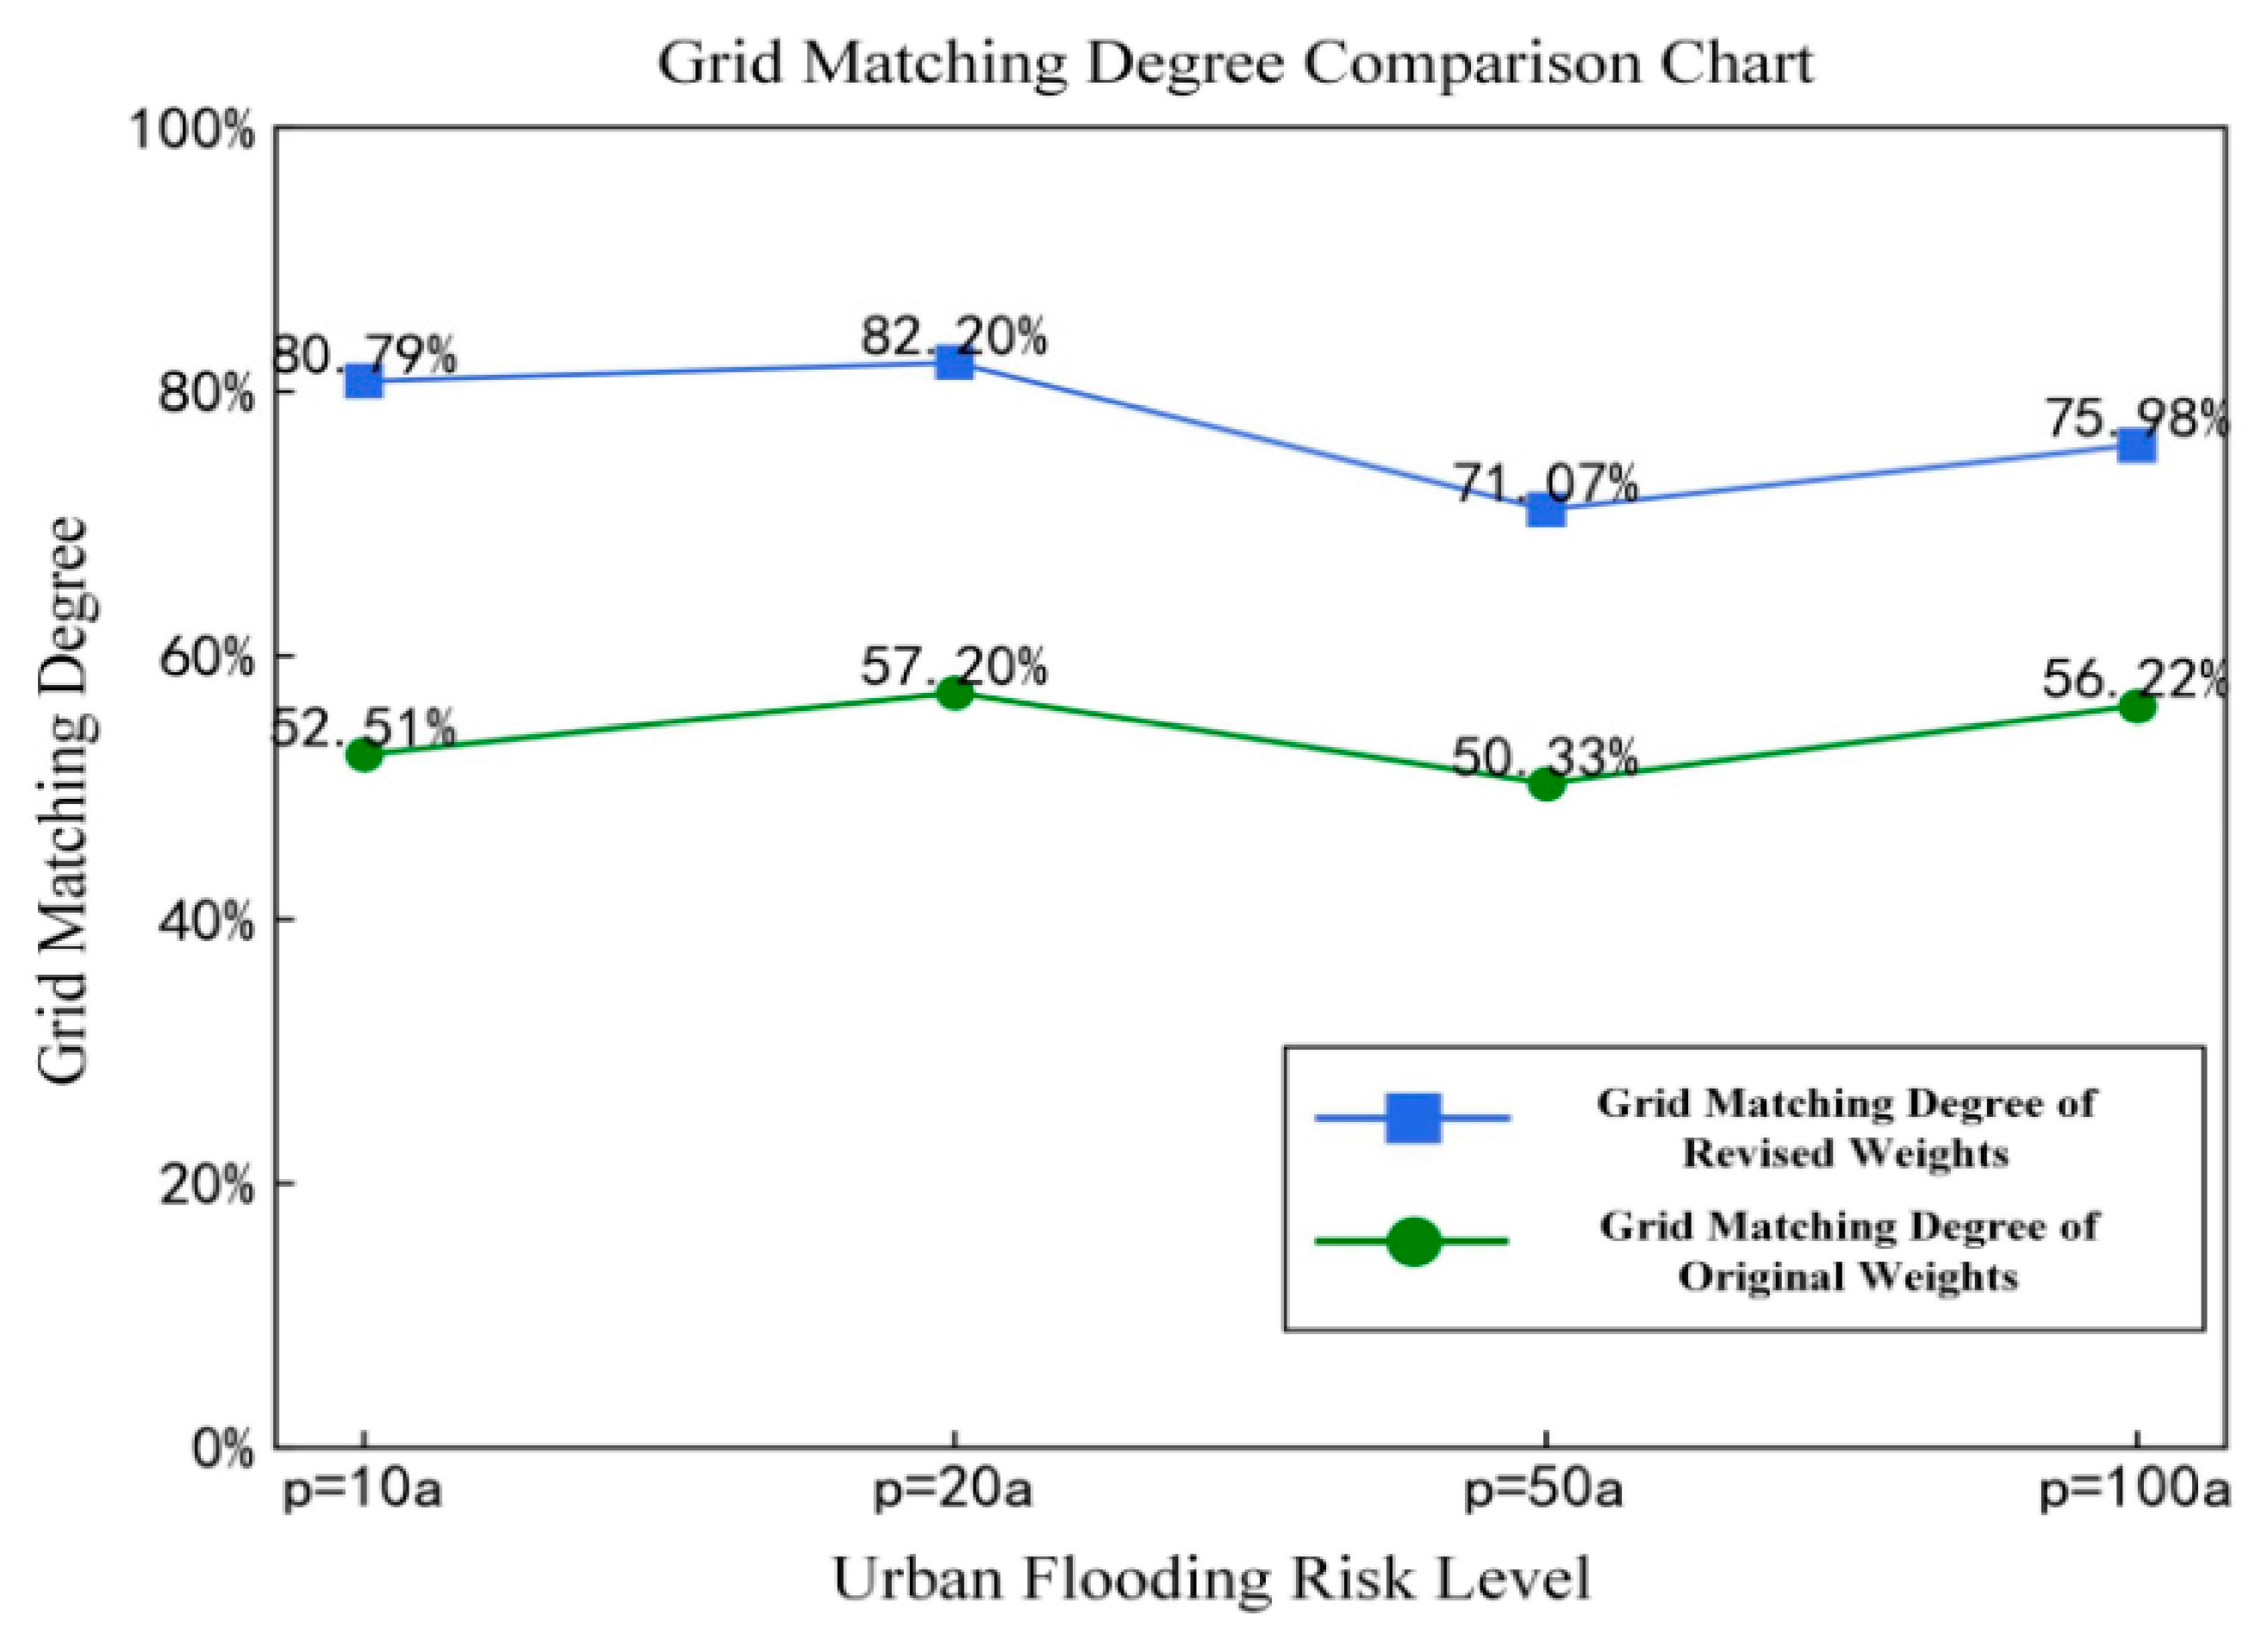
3.3.3. Flood Risk Assessment Results
4. Discussion
4.1. Advantage Analysis of the Integrated Approach
4.2. Limitations and Future Work
5. Conclusions
Author Contributions
Funding
Data Availability Statement
Acknowledgments
Conflicts of Interest
Abbreviations
| ISEM | improved structural equation modeling |
| EMAM | extensible matter-element evaluation analysis method |
| GDP | Gross Domestic Product |
| POI | point of interest |
| SEM | structural equation modeling |
| KMO | Kaiser–Meyer–Olkin measure |
| MaxD | max inundation depth |
| MaxV | max inundation velocity |
| DEM | Digital Elevation Model |
| POP | population density |
| FCDC | disaster prevention and mitigation capability |
| DPMC | flood control and drainage capacity |
References
- Wu, J.; Zhang, P. The effect of urban landscape pattern on urban waterlogging. Acta Geogr. Sin. 2017, 72, 444–456. [Google Scholar]
- Li, H.; Wang, Y.; Ping, L.; Li, N.; Zhao, P. Comprehensive Zoning Strategies for Flood Disasters in China. Water 2024, 16, 2546. [Google Scholar] [CrossRef]
- Hallegatte, S.; Green, C.; Nicholls, R. Future flood losses in major coastal cities. Nat. Clim. Change 2013, 3, 802–806. [Google Scholar] [CrossRef]
- Koc, K.; Işık, Z. A multi-agent-based model for sustainable governance of urban flood r isk mitigation measures. Nat Hazards 2020, 104, 1079–1110. [Google Scholar] [CrossRef]
- Wang, H.; Du, W.; Liu, J.; Wang, J.; Mei, C. Derivation and transmission analysis of urban flood disaster chain based on knowledge graph. Adv. Water Sci. 2024, 35, 185–196. [Google Scholar]
- Liu, J.; Mei, C.; Wang, J.; Wang, D.; Wang, H. Flood survey of“23·7”heavy rain in Mentougou Watershed of Beijing. China Flood Drought Manag. 2023, 33, 50–55. [Google Scholar]
- Li, Y.; Zhao, S. Floods losses and hazards in China from 2001 to 2020. Clim. Change Res. 2022, 18, 154–165. [Google Scholar]
- Liu, J.; Zheng, W.; Li, H.; Chen, J. Evaluation of Flooding Disaster Risks for Subway Stations Based on the PSR Cloud Model. Sustainability 2023, 15, 15552. [Google Scholar] [CrossRef]
- Yang, W.; Zheng, C.; Jiang, X.; Wang, H.; Lian, J.; Hu, D.; Zheng, A. Study on urban flood simulation based on a novel model of SWTM coupling D8 flow direction and backflow effect. J. Hydrol. 2023, 621, 129608. [Google Scholar] [CrossRef]
- Li, J.; Meng, Z.; Zhang, J.; Chen, Y.; Yao, J.; Li, X.; Qin, P.; Liu, X.; Cheng, C. Prediction of seawater intrusion run-up distance based on K-means clustering and ANN model. J. Mar. Sci. Eng. 2025, 13, 377. [Google Scholar] [CrossRef]
- Sivagurunathan, V.; Elsawah, S.; Khan, S.J. Scenarios for urban water management futures: A systematic review. Water Res. 2022, 211, 118079. [Google Scholar] [CrossRef]
- Yuan, Y.; Zhang, Q.; Chen, S.; Chen, F.; Zhang, M. Design and spatial pattern optimization for a sponge city using factor analysis and geographical statistics to restore urban resilience: A case study in a coastal area of China. Water Sci. Technol. 2023, 88, 2246–2263. [Google Scholar] [CrossRef] [PubMed]
- Sun, Z.; Zhang, J.; Zhang, Q.; Hu, Y.; Yan, D.; Wang, C. Integrated risk zoning of drought and waterlogging disasters based on fuzzy comprehensive evaluation in Anhui Province, China. Nat. Hazards 2014, 71, 1639–1657. [Google Scholar] [CrossRef]
- Wang, G.; Liu, Y.; Hu, Z.; Lyu, Y.; Zhang, G.; Liu, J.; Liu, Y.; Gu, Y.; Huang, X.; Zheng, H.; et al. Flood Risk Assessment Based on Fuzzy Synthetic Evaluation Method in the Beijing-Tianjin-Hebei Metropolitan Area, China. Sustainability 2020, 12, 1451. [Google Scholar] [CrossRef]
- Yang, W.; Xu, K.; Lian, J.; Bin, L.; Ma, C. Multiple flood vulnerability assessment approach based on fuzzy comprehensive evaluation method and coordinated development degree model. J. Environ. Manag. 2018, 213, 440–450. [Google Scholar] [CrossRef] [PubMed]
- Yan, L.; Rong, H.; Yang, W.; Lin, J.; Zheng, C. A novel integrated urban flood risk assessment approach based on one-two dimensional coupled hydrodynamic model and improved projection pursuit method. J. Environ. Manag. 2024, 366, 121910. [Google Scholar] [CrossRef]
- Zheng, C.; Yang, W.; Jiang, X.; Lian, J.; Hu, D.; Yan, X.; Yan, L. A novel integrated Urban flood risk assessment approach coupling GeoDetector-Dematel and clustering method. J. Environ. Manag. 2024, 354, 12038. [Google Scholar] [CrossRef]
- Jenifer, M.A.; Jha, M.K. Comparison of Analytic Hierarchy Process, Catastrophe and Entropy Techniques for Evaluating Groundwater Prospect of Hard-Rock Aquifer Systems. J. Hydrol. 2017, 548, 605–624. [Google Scholar] [CrossRef]
- Thirumalaivasan, D.; Karmegam, M.; Venugopal, K. AHP-DRASTIC: Software for Specific Aquifer Vulnerability Assessment Using DRASTIC Model and GIS. Environ. Model Softw. 2003, 18, 645–656. [Google Scholar] [CrossRef]
- Wang, L. Research on Waterlogging Simulation and Risk Assessment in Haizhu District of Guangzhou. Master’s Thesis, Huazhong University of Science and Technology, Wuhan, China, 2021; 82p. [Google Scholar]
- Liu, Y. Study on Risk Assessment and Prevention Methods of Waterlogging Disaster—A Case Study of Quanzhou City. Master’s Thesis, Tianjin University, Tianjin, China, 2020; 155p. [Google Scholar]
- Bian, Y. Research and Application of Structural Equation Model. Master’s Thesis, Dalian Maritime University, Dalian, China, 2017. [Google Scholar]
- Ma, D.; Lu, Y. Information access, authoritarian personality, Ideology and network nationalism: An analysis of the formation mechanism of Chinese Netizens’ political attitudes. J. Tsinghua Univ. (Philos. Soc. Sci. Ed.) 2019, 34, 180–192. [Google Scholar]
- Liu, N. Risk Evaluation of Rainstorm Waterlogging Disaster in Nanjing Urban Area. Master’s Thesis, Nanjing University of Information Science and Technology, Nanjing, China, 2013; 65p. [Google Scholar]
- Yu, L.; Pan, Y.; Wu, Y. Indicators’ correlation adjustment in multiple attribute evaluation of academic journal assessment. Stud. Sci. Sci. 2009, 27, 989–993, 1010. [Google Scholar]
- Wang, T. Research on Diversified Supply Mode Selection of Integrated Pipe Gallery Based on RAGA-PP and Extension Matter-element Analysis. Master’s Thesis, Chongqing University, Chongqing, China, 2022. [Google Scholar]
- Luo, H. A Study on Risk Assessment Method of Urban Flood Disaster and Its Applications. Master’s Thesis, South China University of Technology, Guangzhou, China, 2020. [Google Scholar]
- Lv, H. Risk Assessment Methods and Countermeasures for Floods of Metro System in Subsiding Environment. Ph.D. Thesis, Shanghai Jiao Tong University, Shanghai, China, 2019; 264p. [Google Scholar]
- Wang, Z.; Chen, Y.; Lai, C. Numerical simulation of urban waterlogging based on TELEMAC-2D and SWMM model. Water Resour. Prot. 2022, 38, 117–124. [Google Scholar]
- Kaveh, K.; Bui, M.D.; Rutschmann, P. Integration of artificial neural networks into TELEMAC-MASCARET system, new concepts for hydromorphodynamic modeling. Adv. Eng. Softw. 2019, 132, 18–28. [Google Scholar] [CrossRef]
- Rui, X.; Jiang, C.; Chen, Q.; Ding, X. Principle analysis and application of storm water management model on stimulating rainfall-runoff. Adv. Sci. Technol. Water Resour. 2015, 35, 1–5. [Google Scholar]
- Vu, T.T.; Nguyen, P.K.T.; Chua, L.H.C.; Law, A.W.K. Two-Dimensional Hydrodynamic Modelling of Flood Inundation for a Part of the Mekong River with TELEMAC-2D. Br. J. Environ. Clim. Change 2015, 5, 162–175. [Google Scholar] [CrossRef]
- Zhang, D.; Zhao, D.; Chen, J.; Wang, H.; Wang, H. Application of Chicago rainfall process line model to drainage system simulation. Water Wastewater Eng. 2008, 34, 354–357. [Google Scholar]


| Class | Factor | Short Title | Data Sources |
|---|---|---|---|
| Hazard factors | Max inundation depth | MaxD | Model simulation results |
| Max inundation velocity | MaxV | Model simulation results | |
| Exposure factors | Elevation | DEM | National Geomatics Center of China |
| Slope | Slope | GIS technology extraction | |
| Imperv | Imperv | GIS technology extraction | |
| Vulnerability factors | GDP density | GDP | Institute of Geographic Sciences and Natural Resources Research, Chinese Academy of Sciences |
| Population density | POP | Institute of Geographic Sciences and Natural Resources Research, Chinese Academy of Sciences | |
| POI distance | POI DIST | Gaode Map | |
| Regional refuge capacity factors | Disaster prevention and mitigation capability | FCDC | <Guangzhou Statistical Yearbook> |
| Flood control and drainage capacity | DPMC | GIS calculation for pipeline network density |
| Physical Parameters Land Use Type | Roadway | Building | Hardening of the Pavement | Vegetation | Bare Soil | Else |
|---|---|---|---|---|---|---|
| Manning coefficients | 0.02 | 0.02 | 0.025 | 0.15 | 0.04 | 0.02 |
| Maximumfill volume (mm) | 2 | 2 | 2 | 6 | 5 | 2 |
| Impermeable percentage | 0.92 | 0.92 | 0.92 | 0.15 | 0.3 | 0.3 |
| Initial infiltration rate (mm·h−1) | 58.45 | 58.45 | 58.45 | 76 | 35.82 | 34.72 |
| Stable infiltration rate (mm·h−1) | 0 | 0 | 0 | 20 | 6 | 6.6 |
| Attenuation factor | 20 | 20 | 20 | 2.28 | 3.3 | 3.3 |
| Criterial-Layer Index | Cronbach’s Alpha | Variable | KMO | Bartlett’s Test of Sphericity | ||||
|---|---|---|---|---|---|---|---|---|
| Approximate Chi-Square | Degrees of Freedom | Significance | ||||||
| Reliability Analysis | Hazard risk of causative factors | 0.886 | Validity Analysis | F1 | 0.600 | 117.926 | 1 | <0.001 |
| Exposedness of disaster environment | 0.813 | F2 | 0.668 | 134.949 | 3 | <0.001 | ||
| Vulnerability of the affected system | 0.830 | F3 | 0.663 | 171.134 | 3 | <0.001 | ||
| Regional shelter capability | 0.729 | F4 | 0.600 | 89.656 | 3 | <0.001 | ||
| Total | 0.936 | Total | 0.903 | 898.884 | 45 | <0.001 | ||
| Fit Index | Model Computation Results (Standard) | Fit Degree |
|---|---|---|
| X2/DF | 2.815 (<5) | Fit |
| RMSEA | 0.05 (<0.08) | Fit |
| GFI | 0.851(>0.8) | Fit |
| AGFI | 0.835(>0.8) | Fit |
| CFI | 0.868(>0.8) | Fit |
| IFI | 0.830(>0.8) | Fit |
Disclaimer/Publisher’s Note: The statements, opinions and data contained in all publications are solely those of the individual author(s) and contributor(s) and not of MDPI and/or the editor(s). MDPI and/or the editor(s) disclaim responsibility for any injury to people or property resulting from any ideas, methods, instructions or products referred to in the content. |
© 2025 by the authors. Licensee MDPI, Basel, Switzerland. This article is an open access article distributed under the terms and conditions of the Creative Commons Attribution (CC BY) license (https://creativecommons.org/licenses/by/4.0/).
Share and Cite
Yan, L.; Zhang, L.; Yang, W.; Chen, C.; Lin, J.; Chen, Z.; Jiang, X.; Liang, H.; Cong, P.; Gao, J.; et al. Research on Urban Flood Risk Assessment Based on Improved Structural Equation Modeling (ISEM) and the Extensible Matter-Element Analysis Method (EMAM). Water 2025, 17, 2025. https://doi.org/10.3390/w17132025
Yan L, Zhang L, Yang W, Chen C, Lin J, Chen Z, Jiang X, Liang H, Cong P, Gao J, et al. Research on Urban Flood Risk Assessment Based on Improved Structural Equation Modeling (ISEM) and the Extensible Matter-Element Analysis Method (EMAM). Water. 2025; 17(13):2025. https://doi.org/10.3390/w17132025
Chicago/Turabian StyleYan, Lin, Lihong Zhang, Weichao Yang, Caixia Chen, Jianxin Lin, Zhenxian Chen, Xuefeng Jiang, Haoyang Liang, Peijiang Cong, Jinhua Gao, and et al. 2025. "Research on Urban Flood Risk Assessment Based on Improved Structural Equation Modeling (ISEM) and the Extensible Matter-Element Analysis Method (EMAM)" Water 17, no. 13: 2025. https://doi.org/10.3390/w17132025
APA StyleYan, L., Zhang, L., Yang, W., Chen, C., Lin, J., Chen, Z., Jiang, X., Liang, H., Cong, P., Gao, J., & Xue, T. (2025). Research on Urban Flood Risk Assessment Based on Improved Structural Equation Modeling (ISEM) and the Extensible Matter-Element Analysis Method (EMAM). Water, 17(13), 2025. https://doi.org/10.3390/w17132025