Abstract
Grass-covered levees commonly protect river and estuarine areas against flooding. Climate-induced water level changes may increasingly expose these levees to overflow events. This study investigates whether grass-covered levees can withstand such events, and under what conditions failure may occur. Between 2020 and 2022, full-scale overflow tests were conducted at the Living Lab Hedwige-Prosperpolder along the Dutch–Belgian Scheldt Estuary to assess erosion resistance under varying hydraulic conditions and vegetation states. A custom-built overflow generator was used, with instrumentation capturing flow velocity, water levels, and erosion progression. The results show that well-maintained levees with intact grass cover endured overflow durations up to 30 h despite high terminal flow velocities (4.9–7.7 m/s), without structural damage. In contrast, levee sections with pre-existing surface anomalies, such as animal burrows, slope irregularities, surface damage, or reed-covered soft soils, failed rapidly, often within one to two hours. Animal burrows facilitated subsurface flow and internal erosion, initiating fast, retrograde failure. These findings highlight the importance of preventive maintenance, particularly the timely detection and repair of anomalies. Once slope failure begins, the process unfolds rapidly, leaving no practical window for intervention.
1. Introduction
In many countries with moderate climates, levees with a sand core and a grass-covered clay top layer are a common form of embankment and flood protection along rivers and estuaries. Due to climate change, it is expected that current levees may be better or worse adapted to future environmental conditions. Water levels in rivers, estuaries, and coastal areas are subject to change due to various processes, including sea-level rise [1,2], altered precipitation patterns [2,3], and morphological changes [4,5]. Climate change may also intensify or increase the frequency of precipitation events, leading to more extreme water levels along rivers and estuaries. Longer or more frequent drought periods may affect vegetation states [6,7] and induce cracking of the top layer [8], and thus compromise the integrity of the levee’s vegetation cover. These processes may result in more frequent overflow or overtopping events, and levees may exhibit a suboptimal vegetation state. Various measures can be implemented to mitigate the risks associated with rising peak water levels, such as remeandering, depoldering, constructing tidal areas and wetlands along estuaries, or creating flood control areas. In Belgium, for example, the Sigma plan includes a series of flood control areas and tidal wetlands, some of which have already been operational since the 1980s [9]. In such a context, and especially from a levee risk management, economic, and ecological perspective, it is worthwhile to investigate whether it is acceptable for grass-covered levees to experience overflow, and if so, under which conditions.
The erosion resistance of grass-covered levees has been extensively studied. Field tests in flow flumes or vegetated spillways were carried out in the United States in the 1940s and in Australia in the 1960s. Additional data on the performance of vegetated cover layers during natural flood events—noting that overflow depth, velocity and duration of overflow during these natural floods were estimated—along with various laboratory experiments involving different types of vegetation, have been compiled into velocity–duration diagrams for three distinct qualities of grass cover (Figure 1): good, normal, and poor [10,11]. A comparison of the velocity–duration curves [12] for the three qualities of grass cover presented in [10,11] concluded that the curves published in [10] derive from the earlier base data and that the curves published in [11] may include a factor of safety since they appear to be more conservative. The original curves “appear to give more appropriate results” in relation to floods of 2007 [12]. More recently, tests assessing the erosion resistance of a cover layer were performed in the UK using a portable erosion measurement device [13]. Additionally, [12] also compares the results of these tests with the erosion performance data presented in [10] and found good agreement between the two datasets.
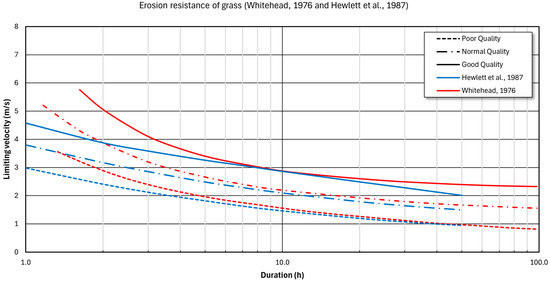
Figure 1.
Comparison of erosion resistance of plain grass cover curves, redrawn from Whitehead (1976) [10] and Hewlett et al. (1987) [11].
Larger-scale overflow erosion tests were recently conducted in the US, Germany, Poland, France, and Belgium in accordance with ASTM D6460 [14]. In a steep flume at Colorado State University, overflow tests were carried out mainly on riprap slope protection [15], articulate concrete blocks slope protection, and vegetated turf reinforcement slope protection. In Germany, the erosion resistance of levees constructed with dredged materials was tested both in small-scale laboratory flumes and in situ on the German DredgDikes research levee [16]. In a second part of the DredgDikes project, various alternative dike construction materials were tested on a large-scale research dike in Gdansk, Poland [17].
In France, INRAE performed overflow erosion tests in 2022 on a levee operated by Compagnie Nationale du Rhone near Avignon [18,19]. On a levee of the river Scheldt at Wijmeers (Belgium), operated by De Vlaamse Waterweg, wave overtopping tests and some overflow tests were carried out [20,21] in 2015.
In the period from 2018 to 2023, the Hedwige-Prosperpolder, straddling the Dutch–Belgian border along the Scheldt estuary, was depoldered and restored to estuarine wetlands, as part of the Sigma Plan. As a consequence, the local levees bordering the polder ceased to function as water-retaining structures. During the works, a significant part of the levee was used as a living laboratory, designated as the Living Lab Hedwige Prosperpolder (“LLHPP”). Within the context of the Interreg 2 Seas project, Polder2C’s full-scale levee overflow tests within the LLHPP were executed in the winters of 2020–2022. Twenty-seven overflow tests were conducted to evaluate the erosion resistance under a variety of test conditions, including reference sections, sections with different types of anomalies, and various repair measures [22]. The procedure followed was based on ASTM-D6460 [14].
In the present paper, the results from these tests are described and analyzed both qualitatively and quantitatively. The observations and findings provide valuable insights for levee managers in areas with grass-covered levees. Section 2 outlines the engineering background, describing the field site, levee geometry, and structural and vegetative characteristics. Section 3 details the experimental setup, overflow test procedures, and data acquisition methods. In Section 4, the results of selected overflow tests are presented and analyzed, focusing on both hydraulic conditions and levee response. Section 5 discusses key failure mechanisms and influencing factors based on the test outcomes. Finally, Section 6 provides the main conclusions and implications for levee design and maintenance in the context of overflow resilience.
2. Engineering Background
2.1. Field Test Site and Overall Geometry
The Hedwige Prosper Polder Living Lab spans 3 km of levee along the Scheldt Estuary, straddling the Belgian–Dutch border. Within this area, several projects were executed, including the Interreg Polder2C’s overflow tests, as described in [22].
Figure 2 shows a digital terrain model of the levee and its surroundings. In the Belgian part, the levee crest is situated at 11.2 m above reference level. Note that altitudes in this paper are given in the Belgian altitude reference, with the zero level at the mean sea level at low tide in the port of Ostend. This reference level is situated 2.33 m below the Dutch altitude reference level. The polder side has a typical elevation of 4 m, while the marsh on the river side is situated higher (5 to 6 m). The levee crest is typically 10 m wide and has a polder-oriented slope of 19° or an 11/4 ratio. In the Dutch part, the crest level is at 11.8 to 12 m altitude, and the polder elevation is also 4 m. The slope is typically 21° or a 10/4 ratio. A service road is situated on the crest on the Belgian part of the levee, while in the Dutch part, the service road is located at the landside toe of the levee. The overflow test sections are situated in sector IV (see Figure 2) for the Belgian part, and sector VI for the Dutch part (Figure 3). The crest locations of the individual overflow test sections are given in Table 1 and presented in Figure 4.
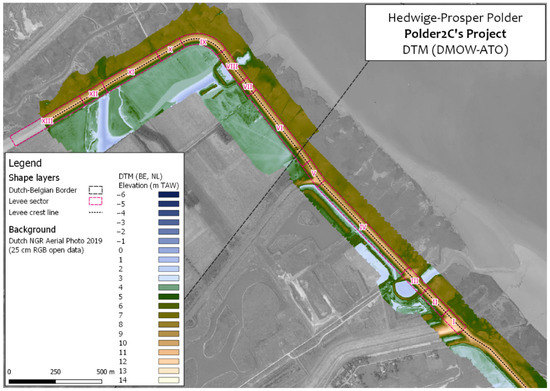
Figure 2.
Digital terrain model based on stereophotogrammetry of the investigation area.
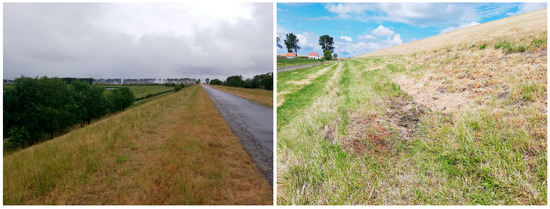
Figure 3.
General state of the levees on 6 August 2025. Both north-facing pictures. Left: Belgian part of the levee, with the service road on the crest. Note the tree growth at the levee toe. Right: Dutch part of the levee, with the service road on the landward toe side of the levee.

Table 1.
Coordinates of the individual test sections (crest locations in WGS84 coordinates).
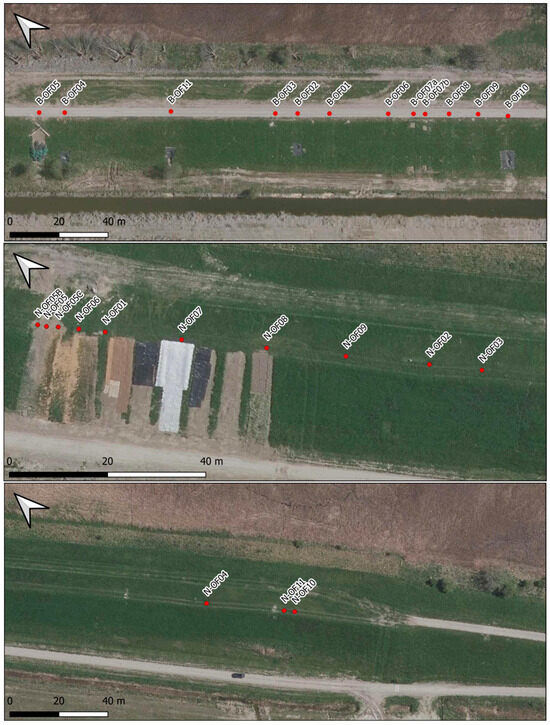
Figure 4.
Location of the sections (crest position) for Belgian sections (upper panel) and Dutch sections (middle and lower panel). The landward side is downward on the images (SW slope).
2.2. Levee Properties
At the start of the Polder2C’s project, an extensive survey was conducted to characterize the properties of the levees [22,23]. This included morphological and surface properties, biophysical, geotechnical, and geophysical properties, as well as sedimentological attributes of the clay cover and the sand core. Survey data are available through the Polder2C’s data platform (https://polder2csknowledge.smartdata2030.com/public_activities/ (accessed on 24 May 2025)). In this paper, we only refer to data relevant for the current scope (see Table 2).
A vegetation map has been constructed for the entire levee investigation zone, distinguishing 11 vegetation types [6]. The overall vegetation map is illustrative of differences in vegetation management between the levees. The Dutch levee is characterized by continuous and fairly homogenous species-poor grassland of false oat-grass (Arrhenatherum elatius) (dark green), whereas the Belgian levee is much more heterogeneous, with species-poor grassland (dark green), species-poor grassland (at the toe area), trees (dark brown), and shrubs (light brown), see Figure 5.
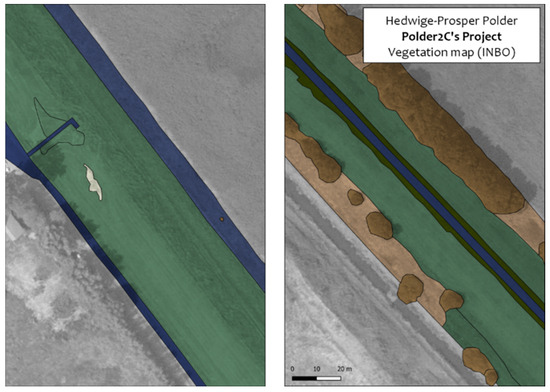
Figure 5.
Example of a vegetation map section on the Dutch levee (left) and Belgian levee (right).
For sedimentological characterization [23,24], soil samples of the top clay layer and underlying sand core were analyzed. The top clay layer consists of silty sand in the Netherlands, and silty sand to sandy silt in Belgium. An important difference in the top layer characteristics is the thickness of the top clay layer, which is 80 to 100 cm in the Netherlands and only 20 to 40 cm in the Belgian part of the levee.
An extensive geotechnical investigation was conducted, describing cone penetration tests and borehole samples, including the soil type, constituents, shear resistance, deformation characteristics, and permeability tests [23,24]. Cross- and inline electrical resistivity profiles and ground-penetrating radar profiles have been acquired at the levee crest, levee toe, and perpendicular to the levee crest orientation [25,26]. Jet erosion tests were performed to assess erosion characteristics of the top soil [27]. Detailed investigation of the burrows and local damages or irregularities was reported in [28].
In [6], detailed analyses of grass species and soil composition, biomass, soil coverage, and root density are reported for two locations on the Dutch part of the levee, and six locations on the Belgian part of the levee. All but one location were assigned to species-poor Arrhenaterum grassland; the exception is a location with seepage and growth of reed and nettle vegetation. The vegetation coverage, reflecting the erosion resistance, was above 70% of the target value at 5 of the 8 locations. One location had a far lower coverage of 31%, in line with its lower root density. At 4 locations (on the Belgian part), the root density translates to adequate root density, but in all other locations, the root density is considered poor to very poor (the latter in the reed-covered area).
To measure the pulling strength of the grass, 80 grass pulling tests in total were carried out: 40 in Belgium and 40 in the Netherlands [29]. The results show that the mean maximum grass sod pulling strength varied from 449 to 720 N (depending on the number of pre-cut sods) for the Dutch part, and 417 to 742 N for the Belgian part. This indicates that the average pulling strength is similar for both parts. It is noted that the standard deviation was higher for the Belgian tests, indicating a greater variability in grass sod quality. The grass sod strengths were also recalculated to critical current velocities for overtopping (rather than overflow), with 6.5 m/s for the Dutch grass cover and 5.0 m/s for the Belgian grass cover [29]. Note that the critical velocity of grass sods from the grass pulling tests is determined for use in the cumulative overload method for wave overtopping, rather than continuous overflow (see Table 2).

Table 2.
Typical properties of Belgian vs. Dutch levee (cover).
Table 2.
Typical properties of Belgian vs. Dutch levee (cover).
| Belgian Part | Dutch Part | Reference | |
|---|---|---|---|
| Sedimentology top layer | Sandy, silty clay to clayey, silty sand | Sandy clay | [24] |
| Sedimentology sand core | Moderately to densely packed clayey/silty sand | Very densely packed sand | [24] |
| Clay cover thickness | 20–40 cm | 80–100 cm | |
| Typical vegetation type | species-poor Arrhenaterum grassland and trees, shrubs | species-poor Arrhenaterum grassland | [6] |
| Grass pulling force | 417 to 742 N | 449 to 720 N | [29] |
| Critical velocity | 5.0 m/s | 6.5 m/s | [29] |
| CPT cone resistance top layer | 0–2 MPa | 0–2 MPa | [24] |
| CPT sleeve friction top layer | <0.025 MPa | 0.025–0.05 MPa | [24] |
| Critical stress jet erosion (top) | 42–180 Pa | 52–130 Pa | [27] |
| Hanson erosion coefficient (top) | 0.4–49 cm3/N/s | 1.2–57 cm3/N/s | [27] |
3. Test Procedures and Data Acquisition Methods
3.1. Test Setup and Data Acquisition
In order to establish a sustained overflow with controlled characteristics on the landward side of the levee, an overflow generator was developed and built at Flanders Hydraulics [30]. The overflow generator was placed on the upper part of the riverward slope, ensuring that the outflow occurred at crest level. The flow crosses the levee crest and flows down the levee slope at the landward side. The flow is contained between plywood boarding walls inserted into slits in the soil to limit leakage. The width of a stream section was typically 2 m, though it was reduced for some tests to increase the specific discharge.
On the levee crest and on the landward slope, an observation and data acquisition system (cDAQ 9184 with NI 9205 modules, National Instruments, Austin, TX, USA) was setup, consisting of acoustic water level sensors (Q54U, Banner, Minneapolis, MN, USA), electromagnetic velocity meters (Model 802,Valeport Limited, Totnes, Devon, UK), and camera systems (uEye UI-5270SE-C-HQ, IDS, Oversulm, Germany) (Figure 6). A discharge sensor (Optisonic 6300, Krohne, Duisbug, Germany) was installed on the feeder pipe of the overflow generator. Before being stored on a computer system, all sensors were coupled to an analog-to-digital converter. The cameras were connected to a separate computer system. Data were transferred from the field to an offsite backup overnight, using a radio link to a nearby internet access point. Additionally, ad hoc measurements with other techniques supplemented the dataset. A more extensive description of the monitoring setup is also provided in [30].
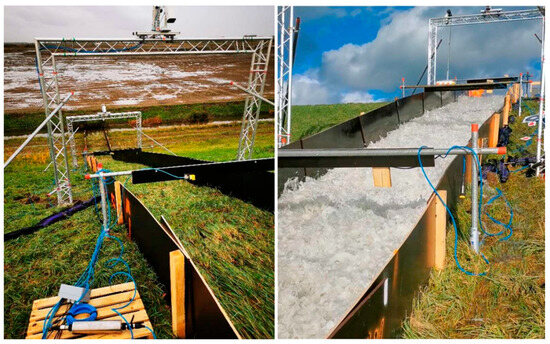
Figure 6.
View of the setup and monitoring system on the levee slope before and during overflow. The installation features overhead cameras, and water level and velocity meters.
The overflow tests were conducted during daytime for 8 to 10 h per day. The tests were executed in different sessions (blocks) of 1 to 2 h, with only brief interruptions (5 to 10 min) to evaluate the state of the grass cover and detect incipient defects or irregularities. During these interruptions, images were captured with the camera system.
3.2. Data Processing and Analysis
The data from the water level and velocity sensors were acquired in continuous mode at 10 Hz, yielding highly detailed time series. Analog-to-digital calibration was performed in the lab prior to testing. For the zero position of the water level, a recalibration was carried out at the start of each new test section.
Post-processing of the time series consisted of offset correction, despiking, and calculation of basic statistics for each test block. For each test, mean water levels and current velocities were aggregated on a time-weighted basis.
Camera images were stitched based on visual marks in the field and georeferenced by RTK GNSS (Leica GS14 and Leica GS15, Heerbrugg, Switzerland) using the scikit-image 0.17.2 Python library.
3.3. Test Overview and Rationale
The research question posed in the introduction was “whether it is permissible to allow grass-covered levees experience overflow […], and if so, to what extent and under what conditions”? This question was translated into a test plan to determine the resistance to erosion and failure of various levee cover conditions (pristine to damaged) under different overflow discharges.
Different types of tests were defined, depending on the initial state of the levee cover. Hydraulic tests were conducted on levee sections without significant pre-existing anomalies, and were considered visually in good condition.
Damage tests were conducted on levee sections where any form of anomaly is present: large burrows, trees, artificial damage, etc. These tests were designed to evaluate the impact of such anomalies on the residual strength and the damage evolution of the levee slope.
A third type is repair tests, conducted on a levee section being repaired after being damaged. These tests are considered out of scope for this paper, but insights related to repair measures are discussed in [31] and in the references listed in Table 3.

Table 3.
Summary of overflow tests. The initial capital in the ID (refers to the country where the test took place (N: Netherlands, B: Belgium). The purpose indicates the basic intention behind the test: H = Hydraulic test, D = Damage test, R = Repair test. S = Special test. qmax is the maximum nominal discharge applied. The tests indicated with bold ID are discussed in this paper.
Finally, special tests include student design challenges for levee repair methods. These are also considered out of scope for this paper.
4. Results
The overflow tests yielded an extensive dataset as documented in the technical reports of the Polder2C’s project [36,37], with a general overview in [22]. In total, 27 overflow tests were conducted on 22 test sections, 11 sections at the Belgian part of the levee system and 11 on the Dutch part. Smaller additional tests were conducted to test repair measures. The general overview of the experiments is summarized in Table 3, detailing the purpose, the nominal discharge, section width, and test duration. In this section, the tests will be described. In total, 15 tests will be discussed in this section: 9 hydraulic tests and 6 damage tests, all highlighted in bold in Table 3. The first part presents the hydraulic boundary conditions and relevant observations. The second part contains a description of the observed evolution of the grass cover and levee slope state during the tests.
4.1. Hydraulic (Boundary) Conditions and Properties
With the measurement setup described in the Test Procedures and Data Acquisition Methods section, continuous time series of the discharge, water level, and current velocity on different levee slope positions (upper, middle, and lower) were acquired. Due to field conditions, apparatus malfunctions, etc., not all test runs yielded successful measurements for the full duration of the test. For example, malfunction of the discharge measurement equipment prevented acquisition of the discharge over the full experiment duration. However, we ensured that partial data were acquired in most experiments. For example, if the discharge measurement was missing from one of the test blocks, the discharge was taken from an adjacent test block with comparable measurement water levels.
Between the upper and middle slope measurement locations, a transition from the quasi-laminar to turbulent air-entrained flow occurs at the so-called inception point (Figure 7). Beyond the inception point, both the acoustic water level sensor and the electromagnetic current meter became unreliable. The output of the acoustic water sensors is limited to an internal processed single distance, making it impossible to measure non uniform water surfaces. The electromagnetic current meters cannot operate reliably in highly aerated flow conditions. Consequently, only the upper slope measurements are considered as a relevant and reliable description of the hydraulic conditions on the site [30].
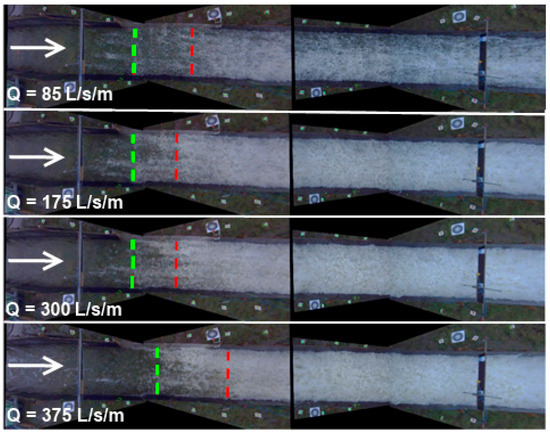
Figure 7.
Top view composite images of the flow down the levee crest towards the toe for 4 different specific discharges. The green line indicates the inception of foaming; the red line full turbulence.
As an alternative to direct measurements on the lower slope, a terminal current velocity was calculated using Manning’s formula [38]:
where is the Equilibrium or terminal velocity (m/s), is the hydraulic radius (m), is the sine of the bed slope angle (-), is the Gauckler–Manning coefficient (s.m−1/3), and is the specific discharge (m2/s). Based on Particle Tracking Velocimetry (PTV) over the full levee slope, a Gauckler–Manning coefficient was estimated as for the Belgian sections and for the Dutch sections (Figure 8). These values are relatively low compared to the literature values for grass-covered soil; for example, a coefficient of n = 0.020 is recommended in [10] for slopes of 1:3 and steeper. However, this is attributed to the flattening of the grass stalks in a shingled fashion, which effectively creates a smoother surface by reducing localized surface irregularities, as mentioned in [10]. The coefficients are then used in combination with the given average discharge for an experiment to estimate the terminal velocity applicable for each experiment.
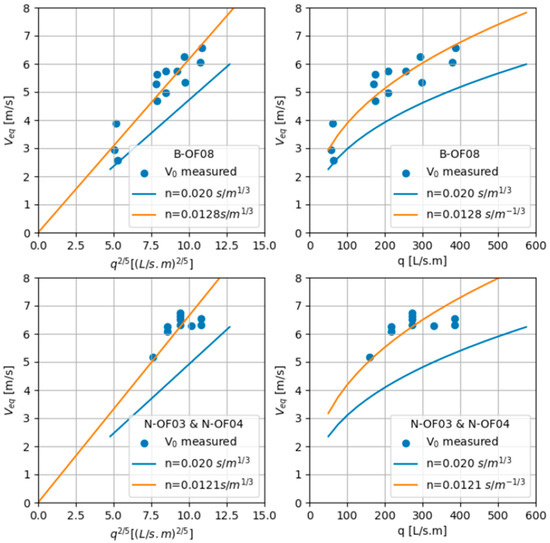
Figure 8.
Equilibrium velocity in function of specific discharge. Estimation of the Gauckler–Manning coefficient based on test data on a Belgian section (top row) and a Dutch section (bottom row). Comparison with value of n = 0.020 s/m1/3, recommended in [10].
Finally, the key parameter values for specific discharge, water height, and velocity at the upper slope position; the experiment duration; and the calculated terminal velocity are shown in Table 4.

Table 4.
Measured values of key hydraulic parameters (Qs: average specific discharge. H: average water height. Vu: average velocity at upper slope location. Veq: calculated terminal velocity) for each overflow test.
The discharge is the main boundary condition for the hydraulic setup. The specific discharge (volume per second per meter width) was varied between 90 L/s/m and 544 L/s/m. The duration of each test varied from less than 1 h to over 24 h. Short-duration tests were mostly due to some type of failure of the levee slope (see further), whereas the long-duration tests were limited in duration to allow for the execution of multiple tests within the given overall time frame.
In [30], Particle Tracking Velocimetry data for Dutch and a Belgian test sections is reported, showing velocities on the lower part of the levee slope of 5 to 7 m/s on the Belgian section, and 6 to 7 m/s on a Dutch section for discharges of more than 170 L/s/m. These values corroborate the range of the calculated equilibrium velocities.
4.2. Evolution of Grass Cover and Levee Slope State During Overflow
4.2.1. Grass Cover Layer State Evolution
During the overflow tests, it was observed that the quality of the vegetation (grass) cover layer evolved over time. The description of this evolution was mainly based on the hydraulic-type tests.
For the Belgian locations, the initial state visually showed lumps of dense grass sods interspaced with barren patches (Figure 9 and subsequent figures). The vegetation coverage varied between 64.8 and 82.1% based on six detailed analysis plots, with a poor-to-mediocre root density [6]. Initially, some loose debris (loose, dried or cut grass) was washed away during the onset of the experiment, and at the same time the grass was flattened by the current so that it formed a continuous cover, resembling shingled rooftiles, over the clay soil. Through time, barren patches became increasingly visible, which was a sign that grass sods were being cut or the soil in between the grass sods was eroded by the overflowing current. This was shown in Figure 9 (upper half of the levee slope) and Figure 10 (lower half), at different time points (0, 2, 5 and 15 h), for test section B-OF01. It showed that poorly grass-covered areas quickly (already after 2 h) evolved towards a more barren state in several patches, which only worsened after more hours. The degradation of the cover layer occurred both at the upper slope and the lower slope. Some more details are provided per section.
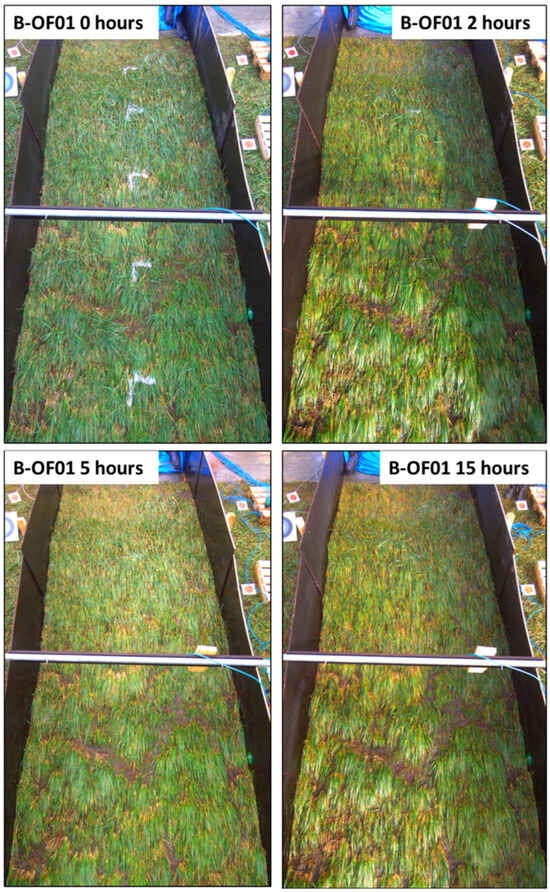
Figure 9.
B-OF01. Visual evolution of the grass cover layer quality (Qs = 178 L/s/m) at the upper slope position at 0, 2, 5, and 15 h overflow.
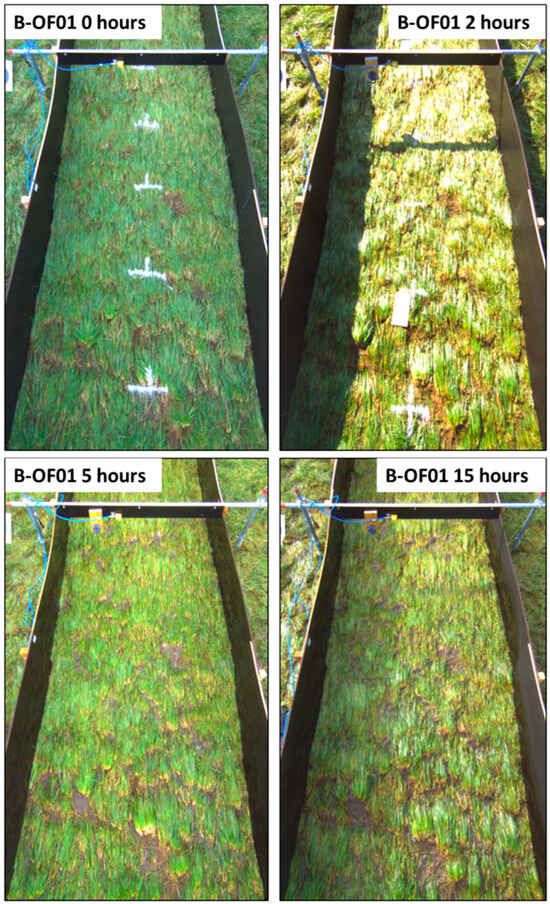
Figure 10.
B-OF01. Visual evolution of the grass cover layer quality (Qs = 178 L/s/m) at the lower slope position at 0, 2, 5, and 15 h overflow.
B-OF01 (Figure 9 and Figure 10)—The initial state of section B-OF01 was considered a good levee state, with a vegetation state after normal maintenance and grass lengths of 20 to 40 cm. A rather barren spot was present 4 to 5 m from the crest break, along with patches of reduced vegetation between grass sods scattered over the surface. At 5 to 7 m from the crest, a few mice burrows were observed. During the test, the grass sods increasingly became more isolated with more barren space in between. Grass roots became more exposed, indicating the erosion of the soil. No critical damage was observed for the duration of the test (nearly 21 h).
B-OF02—This test was conducted on a section from which the vegetation was mowed to a length of about 10 cm using a brush cutter. However, no significant differences in cover degradation were seen compared to test B-01. It was observed that water leaked outside the test section through a mole burrow. On the third day of the tests, an artificial step-shaped anomaly was introduced in the levee slope (see next section). This step showed that the grass root structure was well-developed to a depth of at least 30 cm and even into the levee sand core, which appeared at a depth of 40 cm.
B-OF03—This test was conducted on a narrower section of 1 m in width, instead of the regular 2 m, in order to simulate a higher discharge (330 L/s/m). The overflow was conducted for nearly 10 h. As in other experiments, barren patches appeared, but no critical damage occurred. The erosion of the soil was not observed to be more extensive or stronger than in other Hydraulic type tests with lower discharge.
B-OF08 (Figure 11)—The test section was in a visually good state, with vegetation in a condition after normal maintenance, and no visible major anomalies. The test was conducted for 22 h on this section, and relatively little damage occurred. Soil erosion between grass sods was visible and the grass roots became partially exposed. The grass cover layer (as a whole) retained its integrity. Near the levee toe, where the slope transitions into a horizontal surface, more erosion and clay soil exposure was visible (Figure 11). However, here too, no additional damage occurred.
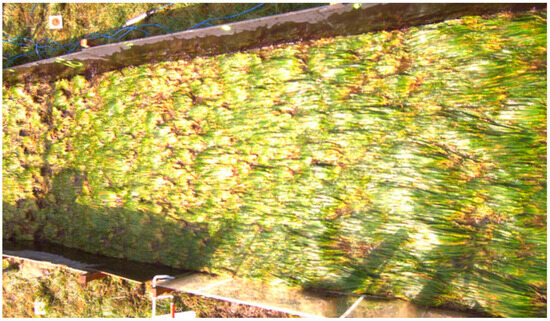
Figure 11.
B-OF08. Non-critical damage of the toe area of the levee (left side of the picture).
B-OF09 (Figure 12)—This test was characterized by a high-discharge boundary condition. At the upper slope position, the grass density was visibly reduced, with the size of barren patches increased. At the lower part of the slope, the evolution was even more significant, with a high number of small-to-medium-sized barren areas visible. After 13 h of overflow, the regular test was concluded and followed by a phase with artificial damage (see next section).
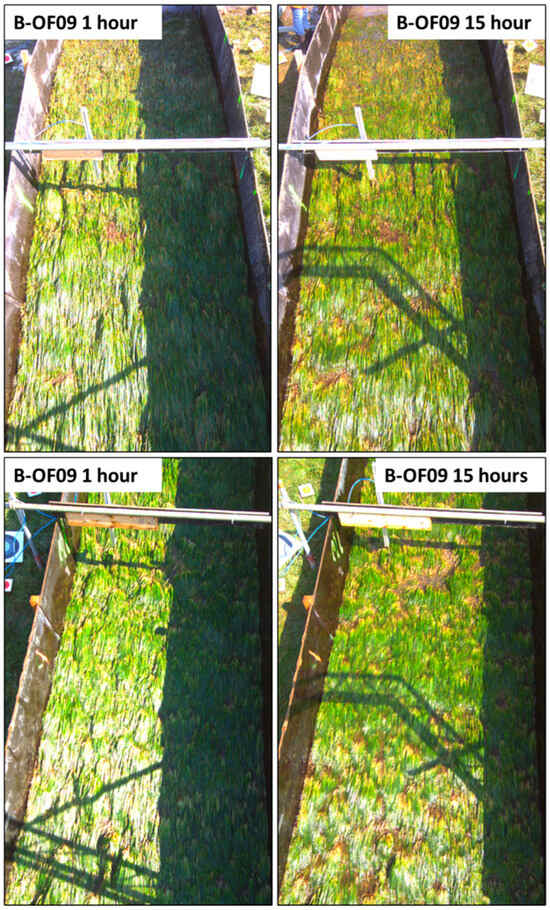
Figure 12.
B-OF09. Visual evolution of the grass cover layer quality (Qs = 373 L/s/m) at the upper (top row) and lower (bottom row) slope position after 1 and 15 h of overflow.
B-OF10 (Figure 13)—This test was conducted similarly to B-OF03, with a section width of 1 m instead of 2 m. The discharge applied was 550 L/s/m. The vegetation state was considered normal, with grass lengths of 15 to 30 cm. After 4 h of testing, scour occurred 2 m upslope from the toe break (Figure 13). This erosion started along the plywood panels and may have been initiated by the installation itself. After less than two additional hours of overflow, the damage became more extensive. One of the patterns observed here due to the pronounced surface irregularities was that the current was ripping off vegetation from the substrate. Consequently, under high-discharge conditions, a small erosion depression could rapidly evolve into extensive damage within a short time. After the execution of the test, an extensive burrow system in the clay layer was observed extending through this layer into the sand core. This burrow system may have influenced the outcome of the test.
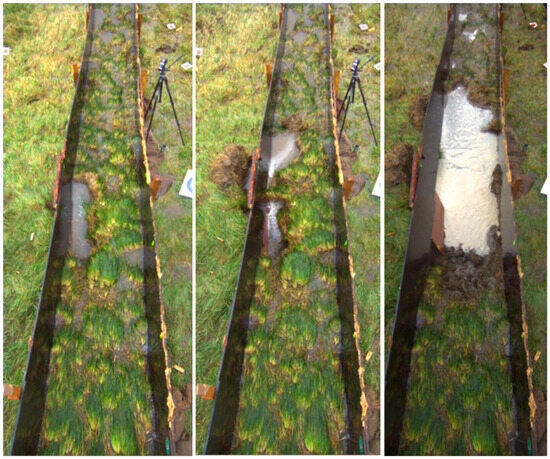
Figure 13.
B-OF10. Damage evolution, starting with a scour along the boarding and evolving into extensive damage in less than 1 h.
On the Dutch test sections, the grass cover was visually fairly continuous without large initial barren spots. The vegetation coverage was determined to be 31.2 and 75% in two detailed analysis plots, and the root density was considered very poor to mediocre in these plots [6]. Over the course of time, it was observed how a small number of barren patches became visible. The evolution was slow and, after 15 h (Figure 14 and Figure 15), the barren patches were still limited. At the toe of the levee, a water puddle was often formed, which may be related to the presence of a gravel drain structure (top part of the image in Figure 15). No significant degradation was observed here, indicating that the grass cover extended well along into the toe area.
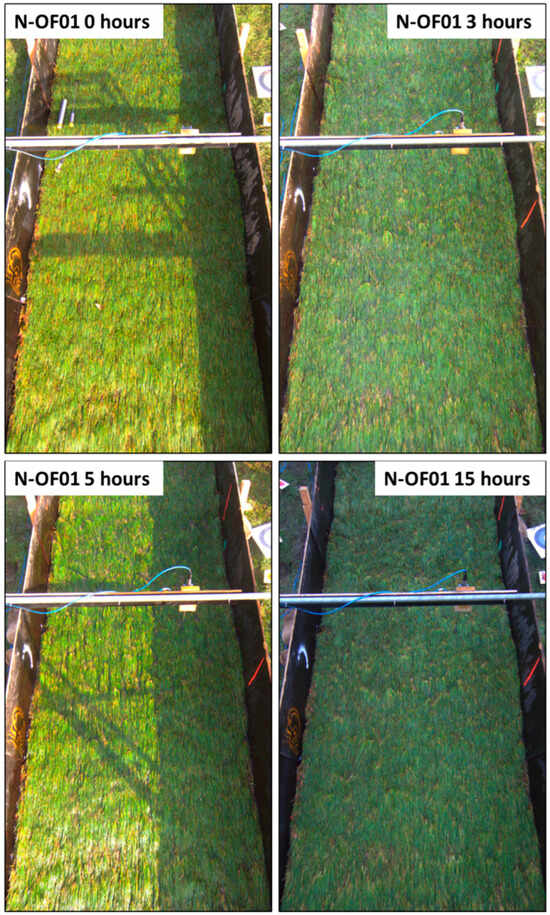
Figure 14.
N-OF01. Visual evolution of the grass cover layer quality (Qs = 175 L/s/m) at the upper slope position at 0, 3, 5, and 15 h overflow.
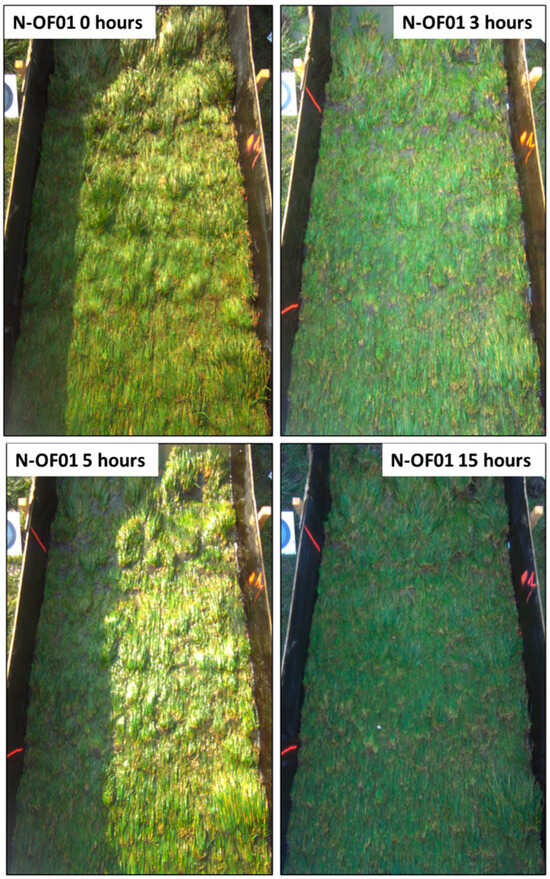
Figure 15.
N-OF01. Visual evolution of the grass cover layer quality (Qs = 175 L/s/m) at the lower slope position at 0, 3, 5, and 15 h overflow.
N-OF01 (Figure 14 and Figure 15)—The initial state of the levee cover was considered to be in good condition, with grass lengths of 10 to 20 cm. The grass cover withstood an overflow of 165 L/s/m for 30.5 h before the test was stopped. Some soil erosion occurred and the grass root systems were exposed. This did not result in any critical damage.
N-OF03—This test section was in good condition at the start, similar to N-OF01. The overflow was applied for over 14 h, with peak discharges up to 165 L/s/m. After an hour of overflow, some vegetation was observed to be thinning, or being eroded from the cover, especially at the lower slope, resulting in barren patches. However, no further damage occurred during the test.
N-OF04—A test section similar to N-OF01 and N-OF03, with a well-developed vegetation cover and some small burrows within and near the test section, was tested for over 25 h with a specific discharge of 330 L/s/m. The burrows had diameters of 3 to 5 cm, but none of them appeared to reach deep. Surface erosion led to the exposure of barren patches and root systems, as typically observed in other tests. A scour hole developed at the toe of the levee, at the transition between the vegetated area and the asphalt. The levee slope itself was not compromised.
The data show that for most Hydraulic tests, the duration of the test exceeded 10 h of overflow, and even up to 30 h and 30 min. One exception is the B-OF10 test, where the scour generated by the setup and/or the presence of undetected burrows likely led to fast and extensive damage.
No clear relation between test duration and discharge intensity could be derived. The recorded durations represent only a lower bound, as the tests were often terminated due to practical constraints (e.g., schedule limitations) or operator discretion (e.g., end of day), rather than based on specific qualitative or quantitative test outcomes.
4.2.2. Levee Slope State Evolution
The different hydraulic and damage test sections are classified by their terminal state as either intact (no slope failure or critical damage has occurred) or failed (critical damage, with contact to the sand core, or observable slope failure). For the tests with an intact end state, the duration of the test is a lower bound for the actual failure resistance. For the tests with a failed end state, the size of the final failure depends on the duration of the time between initial failure and the time to the shutdown of the pumps. Below is a short description of the different failed sections.
B-OF02 (Figure 16)—After 16 h of overflow on a section with short-cut grass, regular testing was interrupted to introduce artificial damage: a step was dug halfway down the levee slope. The initial size of the step was 1.35 m wide and 0.30 m high, creating a large surface of barren clay exposed to the stream, locally reducing the remaining thickness of the clay layer to 0.10 m. Inside the clay, grass roots could be observed, as well as small animal burrows. After 4 h of overflow over this step, clay erosion was visible, but not leading to further failure. The step was deepened to 40 cm, exposing the sand core of the levee. The overflow resumed with a block of 15 min, and erosion progressed quickly. After six and half minutes in the second block, the water changed from clear to brownish. With that observation, the overflow was stopped, revealing significant damage. The step wall had started to collapse and core sands were being eroded.
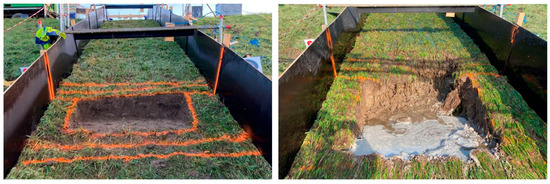
Figure 16.
B-OF02. Initial and terminal state of the artificial step.
B-OF04 (Figure 17 and Figure 18)—The test section contained a small willow tree located two meters outside the toe of the levee. The goal was to test whether soil erosion around such a feature could undermine the levee. The levee slope immediately above the tree was very irregular, partly uncovered, due to animal activity: grazing sheep used this location as a resting area. Shortly after the start of the test, it was observed that sand boils were present outside the 2 m wide test zone: water and sand were flowing out of the ground through small mouse or mole burrows near the toe area. After only 67 min, the vegetated clay cover layer of the levee collapsed, and the experiment was stopped. During the next two minutes, it was observed that sand and water were flowing from underneath the clay cover layer, leading to further retrograde collapse. This process repeated several times until the sand core sand reached a stable state. The total retrograde erosion after the initial failure was 2 m.
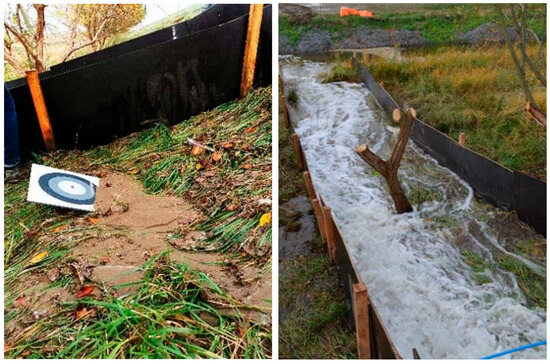
Figure 17.
B-OF04. Sand boils and the tree area during the test.
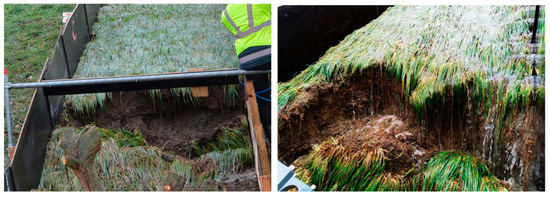
Figure 18.
B-OF04. Terminal test state with slope failure.
B-OF05 (Figure 19)—Test section B-OF05 was situated near B-OF04, between the tree area, and characterized by the slope damage attributed to the presence of sheep and other animals. Ample indications of animals were observed, including droppings and small burrows. The most prominent feature was a cliff-like structure near the toe of the levee. The overflow test was run for 17 h and 40 min, longer than expected given the presence of initial damage. The collapse occurred suddenly and rapidly. Within a very short time, the cover layer collapsed and created significant damage, undermining the entire levee face. The displacement volume was quantified by 3D laser scanning and amounted to 16.4 m3. In [28], later investigation of repair measures on this site documented that the area was characterized by animal burrows running from the crest towards the toe area. It is therefore suggested that these burrows contributed to the outcome of this test.
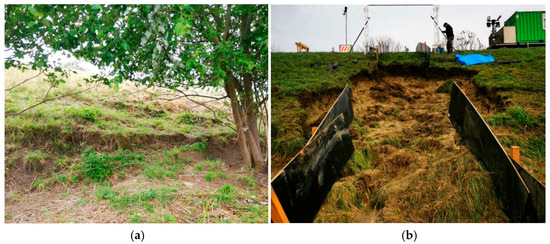
Figure 19.
B-OF05. (a) Slope damage near the toe. (b) Resulting slope failure at the B-OF05 test location.
B-OF10—This test was previously described, noting that slope failure occurred due to scour initiated along the plywood boarding. Subsequently, a burrow system was discovered, which appeared to connect the surface to the sand core.
B-OF11 (Figure 20)—This test section aimed to evaluate the effect of the presence of a tree at the levee toe, similar to test B-OF04. The idea behind this test was that the tree could provoke scour around the tree and destabilize the lower part of the levee slope. Test B-OF04 resulted in slope damage unrelated to the presence of the tree; therefore, this objective was repeated here. During the initial part of the test, some soil erosion and vegetation thinning was observed. Later during the test, the shallow tree root system became increasingly exposed but no true scour, or tree destabilization, was observed. During the test, a 5 cm diameter burrow entrance was discovered 4 m upslope of the tree. Because of earlier experiences and limited time for continuation of the test, it was decided to artificially create burrows using a hand auger drill. One vertical burrow was drilled inside the test section into the sand core. A second drillhole, outside the test section, was drilled horizontally towards the first drillhole. The idea here was to induce fluid flow through the sand core and invoke levee destabilization, as observed in earlier cases. Unexpectedly and before sand was expelled from the artificial burrow, sand started to emerge from an undiscovered burrow at the toe of the levee. On the levee surface, two meters upslope, a slight depression was observed and a crack in the cover layer. This quickly evolved into a cover layer collapse and the end of the test. After removal of the boarding, the amount of sand spilled from the levee core made a 2 m wide, 10 cm high layer of sand extending several meters downstream from the test section.
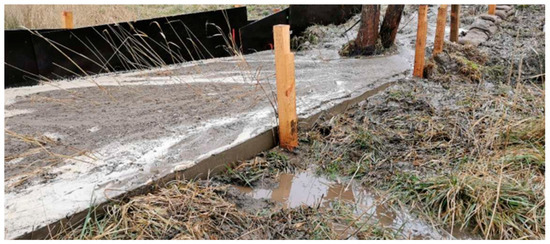
Figure 20.
B-OF11. Sand layer at the toe area after collapse of the levee slope.
N-OF05 (Figure 21 and Figure 22)—This overflow test was designed to assess the influence of a large animal burrow (rabbit or fox) on the levee slope. A burrow was located halfway up the levee slope. Sand from the sand core had been dug out and formed a small mound in front of the burrow entrance. The execution of the experiment was carried out with caution; because the expectation was that erosion could occur quickly, the test consisted of a larger number of short-duration overflow runs (blocks of 5 to 15 min). In total, 10 blocks were performed for a total overflow time of 1 h and 19 min. The nominal discharge applied was 180 L/s. During the first block of the experiment, the sand mound around the rabbit burrow was washed away, turning overflow water muddy dark brown. This event exposed a piece of wire fence, indicating that a pre-existing burrow had been repaired (confirmed by levee inspectors). During the subsequent blocks, the current began to bypass the burrow (due to topographic differences). The current continued in this diverted path for several minutes, whilst the wire fence was slowly being undercut. The wire fence appeared to effectively stabilize the top layer. The top clay layer was exposed to the current and was mostly unprotected by vegetation because of the sand mound. This likely triggered the undercutting process. After 20 min of testing, a scour area formed in front of the protected area, cutting into the cover layer. This process developed continuously, resulting in a waterfall-like feature. The erosion became very pronounced after about 45 min into the test. Finally, after 1 h and 13 min, the test was ended because the developed cliff suddenly destabilized and triggered a large slope failure. In the minutes that followed, headcut erosion migrated another 2 m upstream.
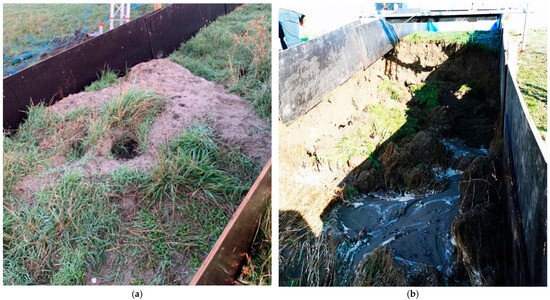
Figure 21.
N-OF05. (a) Sand mound in front of burrow (initial state). (b) Damaged section after levee slope failure (terminal state).
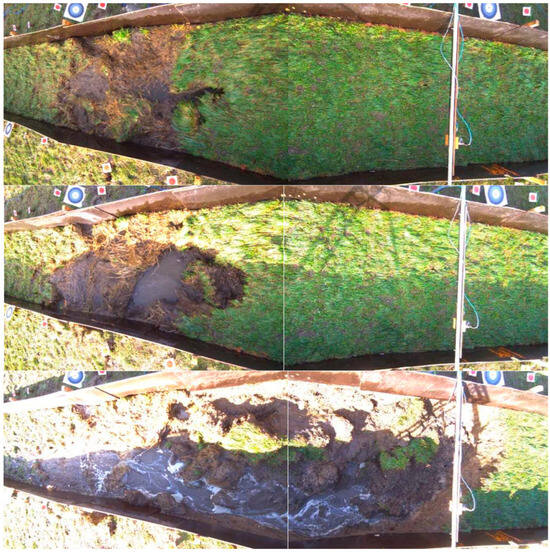
Figure 22.
N-OF05. Evolution of the headcut erosion (left is downslope). Top panel: Initial state after sand mound is washed away. Middle panel: Onset of collapse at burrow entrance. Lower panel: Damaged area at the end of the test.
N-OF10 and N-OF11 (Figure 23 and Figure 24)—Two tests in adjacent sections were conducted on an area characterized by a reed field on the lower slope. The reed field had developed as a consequence of a seepage area, attributed to a clogged drain conduit at the levee toe. The reed area consisted of very soft, moist soil. Because of the soft soil, mowing by tractor was not possible, and the area had not been mowed for many years. The upper part of the levee slope was considered to be in good condition. During the overflow test on N-OF10, rapid erosion of sediment from the reed root system was observed. The water appeared to follow channels between reed patches, which resisted the current more effectively. Just upstream of the reed area, longer grass and other vegetation patches began to loosen and erode rapidly. The vegetation layer, undercut by the current, started to loosen. Under the loosened vegetation, erosion progressed rapidly, as the soil itself was very soft. The sandy inner core was exposed quickly, after which sediment outflow occurred. The experiment was stopped when collapse and cracks appeared in the test section. The course of events at N-OF11 was similar to that appearing at test N-OF10.
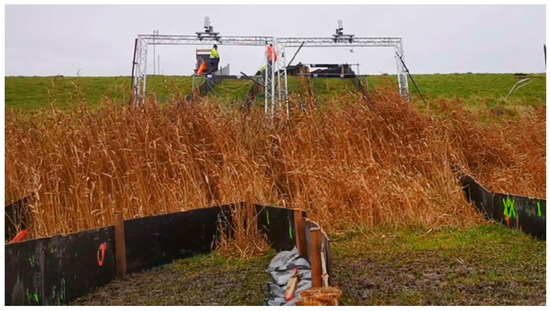
Figure 23.
Setup of the reed field tests N-OF10 (right hand side on the picture) and N-OF11 (left hand side).
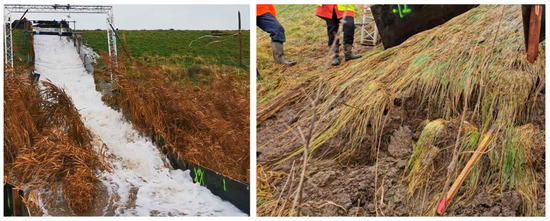
Figure 24.
View of the overflow current during N-OF11 (left panel). Detail of the erosion caused at the reed field area in N-OF10 (right panel).
4.2.3. Terminal State
The data show that for all sections with pre-existing damage, thus classified as damage tests, the outcome was failed. All hydraulic tests conducted on good-quality grass covers resulted in an intact levee, except for B-OF02, where artificially introduced damage led to failure. The terminal states of all tests are summarized in Table 5.

Table 5.
Terminal state of different field tests. H = Hydraulic test. D = Damage test.
5. Discussion
5.1. Interpretation of the Overflow Conditions and Terminal State
The erosion resistance of a vegetated cover layer is illustrated as a velocity duration diagram, as shown in Figure 1. The curves based on [10] are redrawn in Figure 25 and used for comparison with the results of the present study, which were added as vertical bars alongside the reference curves. The lower end of each bar represents the measured velocity on the upper slope, which ranged between 2 and 4 m/s for all observations. The upper end of the vertical bar represents the calculated terminal velocity on the levee slope. The horizontal position of the bar indicates the test duration. For a large group of tests with durations of 5 to 30 h, the upper slope velocities fall within the failure thresholds defined by the curves. However, when the terminal velocities are considered, these thresholds are exceeded.
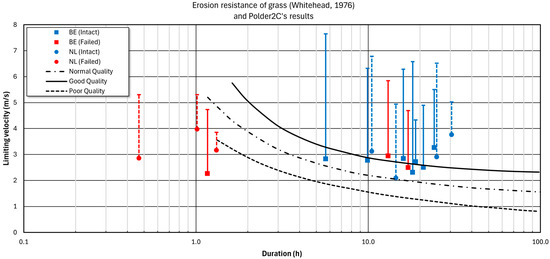
Figure 25.
Erosion resistance of grass. Black curves represent the poor, normal and good grass cover quality, as referred to in [10]. The results from the experiments are represented by vertical bars, for which the lowest value is the measured upper slope velocity and the highest value is the calculated terminal velocity. See text for interpretation.
This information was then combined with the terminal state of each test (failed or intact) and indicated by a color code in Figure 25. For most tests, the end state of the test was intact, indicating the grass-covered clay layers are at least as resistant as anticipated by the curves for these durations. All hydraulic tests fell within this category, except for B-OF02, where artificial damage was introduced. These tests demonstrated that a well-maintained grass-covered levee without any anomaly can withstand overflow with high (terminal) velocities for several hours to tens of hours. In semidiurnal tidal rivers, such as the Scheldt estuary at this location, the expected overflow duration is well below this limit. However, repeated overflow may occur in the next tide. Based on these observations, it can be concluded that well-maintained levees without anomalies are highly resistant to erosion during overflow events, even at intensities exceeding those indicated by [10].
Within the group of tests with failed terminal states, two tests resulted in failure after more than 10 h of overflow (B-OF05 and B-OF11). These represent late failures that occurred in sections with some degree of pre-existing damage. Even with such damage, the levee was still able to retain its structural integrity for several hours.
A second group of test results related to damaged sections and with failed terminal state had durations of less than two hours. Each of these tests was characterized by initial anomalies: reed fields on soft soil, large burrows, pre-existing cliffs. Also, artificial damage was also a contributing factor to this group.
All naturally or artificially damaged sections failed to varying degrees. This indicates that the existence of such damage is a critical factor for the safety of the levee system. In the event of overflow, even within short durations as in tidal regimes, such damage may be sufficient to cause levee failure, with potentially severe consequences for the environment and society.
5.2. Influencing Factors on Levee State During Overflow
It became evident during the overflow tests that the presence of animal burrows could significantly affect both the outcome of the test and the speed at which failure occurred. The execution of a test on a large animal burrow (N-OF05) resulted in significant damage of the levee profile within just over one hour of overflow, despite the earlier repair measures applied to a pre-existing burrow. In other cases (tests B-OF04, B-OF05, B-OF10 and B-OF11), smaller burrows appeared to create water flow conduits under the clay cover, through the sand core. In some instances, this led to visible sand expulsion beyond the boundaries of the test section. Based on these observations, the failure mechanism is described as follows (Figure 26).
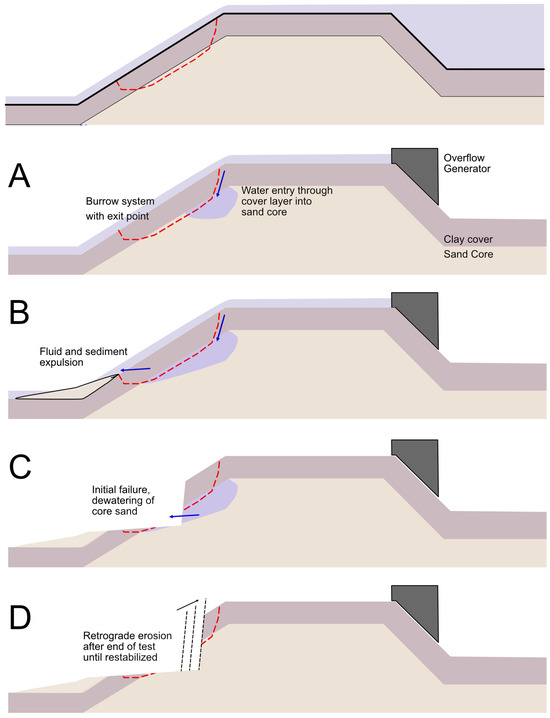
Figure 26.
Evolution of the failure mechanism influenced by burrow systems. (A) Fluid enters the levee sand core through burrow piercing the clay cover layer. Blue arrows indicate fluid flow direction. (B) Fluid migrates through sand core and is expelled through a burrow at a lower point, entraining sediments. (C) Due to mass deficit, the clay cover layer collapses and slope failure occurs. (D) Due to dewatering of the sand core and sand fluidization, retrograde erosion and collapse occurs, indicated by the black arrow.
- During overflow, water infiltrates the clay cover and shallow sand core through cracks, animal burrows, or other discontinuities. Burrows may also create a direct path into the sand core. The infiltrating water partially saturates the sand core (Figure 26A).
- The hydraulic gradient inside the levee may be locally altered. An underground system of burrows (e.g., mole burrows at the clay–sand interface) or other irregularities may act as preferential flow pathways. These may further affect the internal hydraulic gradient or saturation line inside the levee.
- If a hydraulic exit point (e.g., a burrow) is present lower on the levee slope, the water can, given time and/or suitable pathways, exit and create a subsurface flow. Depending on the flow velocity and local soil properties, this can lead to sediment entrainment, and expulsion at the surface may occur (as observed in several instances) (Figure 26B).
- Sediment entrainment causes a mass deficit under the clay layer. Combined with fluid saturation of the sand core, the local geotechnical stability is reduced. Once the mass deficit exceeds a critical threshold, an initial surface depression forms and ultimately leads to collapse of the clay cover layer (Figure 26C).
- After failure, the hydraulic head established in the core sand needs to equilibrate through the outflow of water and sediment from the standing upslope face. This process leads to retrograde erosion and repeated collapse of the levee cover layer, until the cliff face stabilizes after sufficient sand desaturation (Figure 26D).
From a management perspective, the speed and scale of this failure proved to be unexpectedly large. It led to the insight that animal activities on a levee can seriously undermine the overall strength and resilience of a levee system.
Only two tests with small trees on the levee slope were conducted. During these tests, soil erosion and vegetation thinning were observed, and the shallow tree root systems became increasingly exposed. However, no true scour or tree destabilization was observed. In both cases, the damage was unrelated to the presence of the tree and was instead caused by the presence of small mice or mole burrows, some of which may have remained undiscovered near the toe of the levee. It was thought that the tree could indirectly promote the occurrence of the animal burrows. By providing shade for grazing animals, the tree may have attracted a broader ecosystem, ranging from insects to burrowing animals to the area.
In one test, the vegetation was mowed to a length of approximately 10 cm using a brush cutter, compared to the typical grass lengths of 20 to 40 cm in other test sections during the same testing period. However, no significant difference in the evolution of the erosion of the grass was noticed between these two tests. This corresponds to the findings in [10], which state that once the grass sward is flattened by the flow, the boundary shear force exerted by the water is largely independent of grass length.
It was not possible to discern conclusive differences between the levee maintenance approaches in the Netherlands and Belgium (Flanders). An important design difference between the Dutch and Belgian levees is the thickness of the clay cover layer. The cover layer thickness of the Dutch levee ranged from 0.80 to 1.00 m, and 0.20 to 0.40 m for a Belgian levee. Initially it was assumed that the increased cover layer thickness of the Dutch levee would increase the erosion resistance. Still, sudden failures appeared due to factors as large burrows, or the presence of soft spots at the levee toe. Our tests did not show that small burrows alone could lead to slope failure in sections with clay cover layers between 0.8 and 1.0 m thick. However, in wave overtopping tests carried out in 2022 at the LLHPP, sand expulsion from mole burrows led to large-scale failure after only 3 h and 45 min of overtopping [29]. These results suggest that clay layer cover thickness is not the sole or definitive factor governing levee strength against erosion and failure. At this stage, the number of tests conducted is too limited to draw statistically significant conclusions about the influence of clay layer thickness on overall levee stability.
6. Conclusions
Measurements and observations during a large set of overflow experiments conducted within the Living Lab Hedwige-Prosper polder in the period 2020–2022 led to several insights regarding overflow resistance of grass-covered levees and the factors that undermine it.
- Well-maintained grass-covered levees can withstand 15 to 30 h of overflow without significant damage to the vegetation or structural failure, despite progressive exposure of the clay layer.
- Animal burrows often create a direct hydraulic connection between the overflow and the sand core. Other anomalies such as soft patches or local slope damage can facilitate infiltration or accelerate erosion, leading to direct exposure of the core. Failure even occurred in visually ‘good’ sections, suggesting that non-visible internal anomalies such as animal burrows are an underestimated risk.
- Saturation of the sand core can lead to structural failure. The time to failure is highly variable—ranging from tens of minutes to several hours—and introduces major uncertainty in the sequence of failure events.
- The presence of trees or tall vegetation did not directly influence overflow resistance. However, indirect effects, such as masking of surface anomalies or attracting burrowing animals, may affect levee stability during overflow.
- Retrograde erosion magnifies initial failure. Once slope instability initiates, its progression toward the crest can occur within minutes. Subsequent sand mobilization and collapse of the cover layer proceeded rapidly and would likely compromise the entire levee section if not halted—as would be the case in a real-world scenario.
- Clay cover thickness alone does not guarantee stability. Even with cover layers up to one meter thick, rapid failure (within just over one hour) was observed when large burrows or soft sediment patches were present. This underscores the importance of overall structural integrity.
The results show that controlled overflow of a grass-covered levee may be acceptable under strict conditions. The levee must be in good structural condition, with high-quality maintenance and regular inspection, particularly regarding large animal burrows, significant vegetation irregularities, or morphological anomalies. Vegetation management also plays an important supporting role in preserving the surface integrity. Once slope failure initiates, however, the chain of events unfolds rapidly, leaving no practical time for intervention. This highlights the importance of preventive measures, since post-failure mitigation, such as emergency intervention, is unlikely to be timely in real-world overflow scenarios.
Author Contributions
Conceptualization: P.P.; Investigation: P.P.; D.D., and J.V.; Data curation: D.D. and J.V.; Visualization: D.D. and J.V.; Writing—original draft: D.D., J.V.; Writing—review and editing: P.P. and K.V.; Project administration: P.P. and K.V.; Funding acquisition: P.P. All authors have read and agreed to the published version of the manuscript.
Funding
This research was funded by the Interreg 2 Seas programme 2014–2020 and co-funded by the European Regional Development Fund under subsidy contract No [2S07-023] under the Project name Polder2C’s.
Data Availability Statement
Data, reports, and other materials can be downloaded via the Polder2C’s website at https://polder2cs.eu/results (accessed on 15 May 2025).
Acknowledgments
The authors would like to thank the large number of people involved in preparing and executing different aspects of the field tests: the Engineering and Operations team of Flanders Hydraulics (BE) for the design and building of the overflow generator, for installing the different monitoring instrumentation and the data acquisition system, for setting up data transfer links, and for providing technical back-office support. The technical staff for the on-site installation of the test sections; the local water manager of the Flemish Waterway NV (BE) and their contractor for performing the depoldering works in the area and for giving extensive technical support during the execution of the field tests. The Waterschap Brabantse Delta (NL) for providing pumps and personnel for a series of tests, and the numerous students and people visiting the test site and contributing in one or another way to the execution of the field tests. We thank A.R. Koelewijn (Deltares, NL), ing. W.S. Zomer MSc. (BZ Engineers and Managers, NL), V. Tsimopoulou (HZ University of Applied Sciences, NL), and the many others involved in the Interreg Polder2C’s project for the constructive and enriching discussions during the field work and thereafter.
Conflicts of Interest
Dr. Davy Depreiter was employed by the company GeoHydroData BV. The remaining authors declare that the research was conducted in the absence of any commercial or financial relationships that could be construed as a potential conflict of interest.
References
- Dangendorf, S.; Hay, C.; Calafat, F.M.; Marcos, M.; Piecuch, C.G.; Berk, K.; Jensen, J. Persistent acceleration in global sea-level rise since the 1960s. Nat. Clim. Change 2019, 9, 705–710. [Google Scholar] [CrossRef]
- Intergovernmental Panel on Climate Change (Ipcc). Climate Change 2021–The Physical Science Basis: Working Group I Contribution to the Sixth Assessment Report of the Intergovernmental Panel on Climate Change, 1st ed.; Cambridge University Press: Cambridge, UK, 2023. [Google Scholar] [CrossRef]
- Vlaamse Milieumaatschappij. Impact van Klimaatverandering op Meteorologische Droogte in Vlaanderen; Vlaamse Milieumaatschappij: Aalst, Belgium, 2018; Available online: https://www.vliz.be/imisdocs/publications/06/320806.pdf (accessed on 15 May 2025).
- Wang, Z.B.; Jeuken, M.C.J.L.; Gerritsen, H.; De Vriend, H.J.; Kornman, B.A. Morphology and asymmetry of the vertical tide in the Westerschelde estuary. Cont. Shelf Res. 2002, 22, 2599–2609. [Google Scholar] [CrossRef]
- Winterwerp, J.C.; Wang, Z.B. Man-induced regime shifts in small estuaries—I: Theory. Ocean Dyn. 2013, 63, 1279–1292. [Google Scholar] [CrossRef]
- Vandevoorde, B.; Van Lierop, F. T0-Bepaling van de Dijkvegetatie Hedwige-Prosperpolder (Datarapport); Instituut voor Natuur- en Bosonderzoek: Brussels, Belgium, 2021. [Google Scholar] [CrossRef]
- Vandevoorde, B.; Dhaluin, P.; Van Lierop, F.; Elsen, R.; Van den Bergh, E. Beheervoorstel voor de Dijkvegetaties Langs de Zeeschelde, Durme en Rupel; Instituut voor Natuur- en Bosonderzoek: Brussels, Belgium, 2019. [Google Scholar] [CrossRef]
- Zhang, J.-M.; Luo, Y.; Zhou, Z.; Chong, L.; Victor, C.; Zhang, Y.-F. Effects of preferential flow induced by desiccation cracks on slope stability. Eng. Geol. 2021, 288, 106164. [Google Scholar] [CrossRef]
- Meire, P.; Dauwe, W.; Maris, T.; Peeters, P.; Coen, L.; Deschamps, M.; Rutten, J.; Temmerman, S. The recent “Saint Nicholas” storm surge in the Scheldt estuary: The Sigma plan proves its efficiency! ECSA Bull. 2014, 62, 19–23. [Google Scholar]
- Whitehead, E. A Guide to the Use of Grass in Hydraulic Engineering Practice; Technical note; no. 71; Construction Industry Research and Information Assoc: London, UK, 1976. [Google Scholar]
- Hewlett, H.W.M.; Boorman, L.A.; Bramley, M.E. Design of Reinforced Grass Waterways; Report; no. 116; Construction Industry Research and Information Association (CIRIA): London, UK, 1987. [Google Scholar]
- Morris, M.; BOORMAN, L.; Simm, J. Just How Important Is Grass Cover? Emerald Publishing: Leeds, UK, 2010; pp. 87–99. [Google Scholar] [CrossRef]
- Boorman, L.A.; Hazelden, J. The use of a new portable erosion measuring device for assessing the erodibility of the surface layers of flood embankments. Soil Use Manag. 2012, 28, 120–127. [Google Scholar] [CrossRef]
- D18 Committee. Test Method for Determination of Rolled Erosion Control Product (RECP) Performance in Protecting Earthen Channels from Stormwater-Induced Erosion; ASTM: West Conshohocken, PL, USA, 2024. [Google Scholar] [CrossRef]
- Abt, S.R.; Johnson, T.L. Riprap Design for Overtopping Flow. J. Hydraul. Eng. 1991, 117, 959–972. [Google Scholar] [CrossRef]
- Cantré, S.; Olschewski, J.; Saathoff, F. Full-Scale Flume Experiments to Analyze the Surface Erosion Resistance of Dike Embankments Made of Dredged Materials. J. Waterw. Port Coast. Ocean Eng. 2017, 143, 04017001. [Google Scholar] [CrossRef]
- Olschewski, J.; Cantre, S.; Saathoff, F.; Ossowski, R. Overflowing Tests at the Polish Dredgdikes Research Dike–Stability of the Dike Surface Against Erosion. Eng. Struct. Technol. 2015, 6, 159–168. [Google Scholar] [CrossRef]
- Bonelli, S.; Nicaise, S.; Charrier, G.; Chaouch, N.; Byron, F.; Grémeaux, Y. Quantifying the erosion resistance of dikes with the overflowing simulator. In Proceedings of the 3rd International Conference on Protection Against Overtopping, Cumbria, UK, 6–8 June 2018. [Google Scholar]
- Nicaise, S.; Picault, C.; Byron, F.; Grémeaux, Y.; Doghmane, A.; Crampette, F.; Golay, F.; Bonelli, S. Résistance à la Surverse-Essais In Situ; Zenodo: Geneva, Switzerland, 2024. [Google Scholar] [CrossRef]
- Van Damme, M.; Ponsioen, L.; Herrero, M.; Peeters, P. Comparing overflow and wave-overtopping induced breach initiation mechanisms in an embankment breach experiment. E3S Web Conf. 2016, 7, 03004. [Google Scholar] [CrossRef]
- Ponsioen, L. Overflow and Wave Overtopping Induced Failure Processes on the Landside Slope of a Dike. Master’s Thesis, Delft University of Technology, Delft, The Netherlands, 2016. Available online: https://repository.tudelft.nl/record/uuid:a6ef81da-53a2-4e84-8829-b9a08afea2ef (accessed on 15 May 2025).
- Koelewijn, A.R.; Rikkert, S.J.H.; Peeters, P.; Depreiter, D.; Van Damme, M.; Zomer, W. Overflow Tests on Grass-Covered Embankments at the Living Lab Hedwige-Prosperpolder: An Overview. Water 2022, 14, 2859. [Google Scholar] [CrossRef]
- Depreiter, D.; Peeters, P.; Vanhille, W.; Muylaert, S.; De Backer, G.; Koelewijn, A.; Van Calster, W. Survey Overview Report: WP 1 Living Lab Climate Adaptive Flood Defences. 2022. Available online: https://edepot.wur.nl/590365 (accessed on 15 May 2025).
- De Backer, G.; D’heer, S. Report on the Geotechnical Laboratory Testing; Geotechnical Division, Flemish Government: Gent, Belgium, 2022.
- Fauchard, C.; De Backer, G.; Guilbert, V.; Sassaye, L. WP 1 Living Lab Climate Adaptive Flood Defences Geophysical and Geotechnical Measurements; Cerema-Centre d’Etudes et d’Expertise sur les Risques, l’Environnement, la Mobilité et l’Aménagement: Bron, France, 2023; Available online: https://hal.science/hal-04150876 (accessed on 15 May 2025).
- Antoine, R.; Fauchard, C.; Guilbert, V.; Beaucamp, B.; Ledun, C.; Heinkele, C.; Saussaye, L.; Muylaert, S.; Vancalster, W.; Depreiter, D.; et al. Geophysical and Uav-Based Observations over a Flood Defense Structure: Application to the Polder2c’s Experimental Dike. Int. Arch. Photogramm. Remote Sens. Spat. Inf. Sci. 2021, 43, 237–242. [Google Scholar] [CrossRef]
- GeoPhyConsult, S.A.S. Jet Erosion Tests on Samples Coming from Hedwige-Prosperpolder; GeoPhyConsult: Chambéry, France, 2020. [Google Scholar]
- Holscher, R.; Zomer, W.S.; Postma, M.; Heuvel, A.; Booltink, M.; Wentholt, L.R.; Koelewijn, A.R.; Depreiter, D. Field Research on Burrows and Discontinuities in Embankments: Fact Finding Field Research in the Hedwige-Prosperpolder; Stichting Toegepast Onderzoek Waterbeheer (STOWA): Amersfoort, The Netherlands, 2021; Available online: https://edepot.wur.nl/562465 (accessed on 15 May 2025).
- Daamen, E.; Heida, L.; Mom, R.; Wauben, C. Factual Report Golfoverslag en Grastrekproeven Polder2C’s; Infram Hydren: Maarn, NL, USA, 2022. [Google Scholar]
- Vercruysse, J.; Depreiter, D.; López Castoño, S.; Verelst, K.; Peeters, P. Design and Application of an Overflow Generator; Hydraulics Research: Antwerp, Belgium, 2023; Available online: https://www.vlaanderen.be/Publication/28515 (accessed on 15 May 2025).
- Peeters, P.; Vonk, B.; Rauwoens, P. Overview of Innovative Solutions-Tools-Services. 2023. Available online: https://polder2cs.eu/results/reports/flood-defence (accessed on 15 May 2025).
- van Damme, M.; Alleon, C.; Neuts, A.; Koelewijn, A.; Bennabi, A.; Ebrahimi, M.; Soares-Frazao, S.; Sergent, P.; Samoui, H.; van den Berg, M. Modelling Erosion Progression for Steady Overflow and Wave Overtopping Conditions. 2023. Available online: https://edepot.wur.nl/590371 (accessed on 15 May 2025).
- van Bergeijk, V. Developing a Clay Erosion Model for Levee Landside Slopes in Case of Wave Overtopping. 2024. Available online: https://publications.deltares.nl/11210371_014_0001.pdf (accessed on 15 May 2025).
- Van Den Hoven, K.; Grashof-Bokdam, C.J.; Slim, P.A.; Wentholt, L.; Peeters, P.; Depreiter, D.; Koelewijn, A.R.; Stoorvogel, M.M.; Van Den Berg, M.; Kroeze, C.; et al. Greening the dike revetment with historic sod transplantation technique in a living lab. J. Flood Risk Manag. 2024, 17, e12968. [Google Scholar] [CrossRef]
- Tsimopoulou, V.; Karaoulis, M.; Nieboer, R.; Ahlrichs, E.; Koelewijn, A.; Kieftenburg, A. Geophysical monitoring of large-scale levee overflow experiments with electrical resistivity tomography. J. Coast. Hydraul. Struct. 2025, 5, 41. [Google Scholar] [CrossRef]
- Depreiter, D.; Peeters, P.; Koelewijn, A.; Vercruysse, J.; Verelst, K.; Zomer, W.; Tsimopoulou, V. Overflow Tests on Belgian Levees. 2022. Available online: https://edepot.wur.nl/590366 (accessed on 15 May 2025).
- Depreiter, D.; Peeters, P.; Verelst, K.; Zomer, W.; Tsimopoulou, V.; Koelewijn, A. Overflow Tests on Dutch Levees. 2022. Available online: https://edepot.wur.nl/590368 (accessed on 15 May 2025).
- Chow, V.T. Open-Channel Hydraulics; McGraw-Hill: New York, NY, USA, 1959. [Google Scholar]
Disclaimer/Publisher’s Note: The statements, opinions and data contained in all publications are solely those of the individual author(s) and contributor(s) and not of MDPI and/or the editor(s). MDPI and/or the editor(s) disclaim responsibility for any injury to people or property resulting from any ideas, methods, instructions or products referred to in the content. |
© 2025 by the authors. Licensee MDPI, Basel, Switzerland. This article is an open access article distributed under the terms and conditions of the Creative Commons Attribution (CC BY) license (https://creativecommons.org/licenses/by/4.0/).