

Water Footprint Through an Analysis of Water Conservation Policy: Comparative Analysis of Water-Intensive and Water-Efficient Crops Using IoT-Driven ML Models
 ,
,
Abstract
1. Introduction
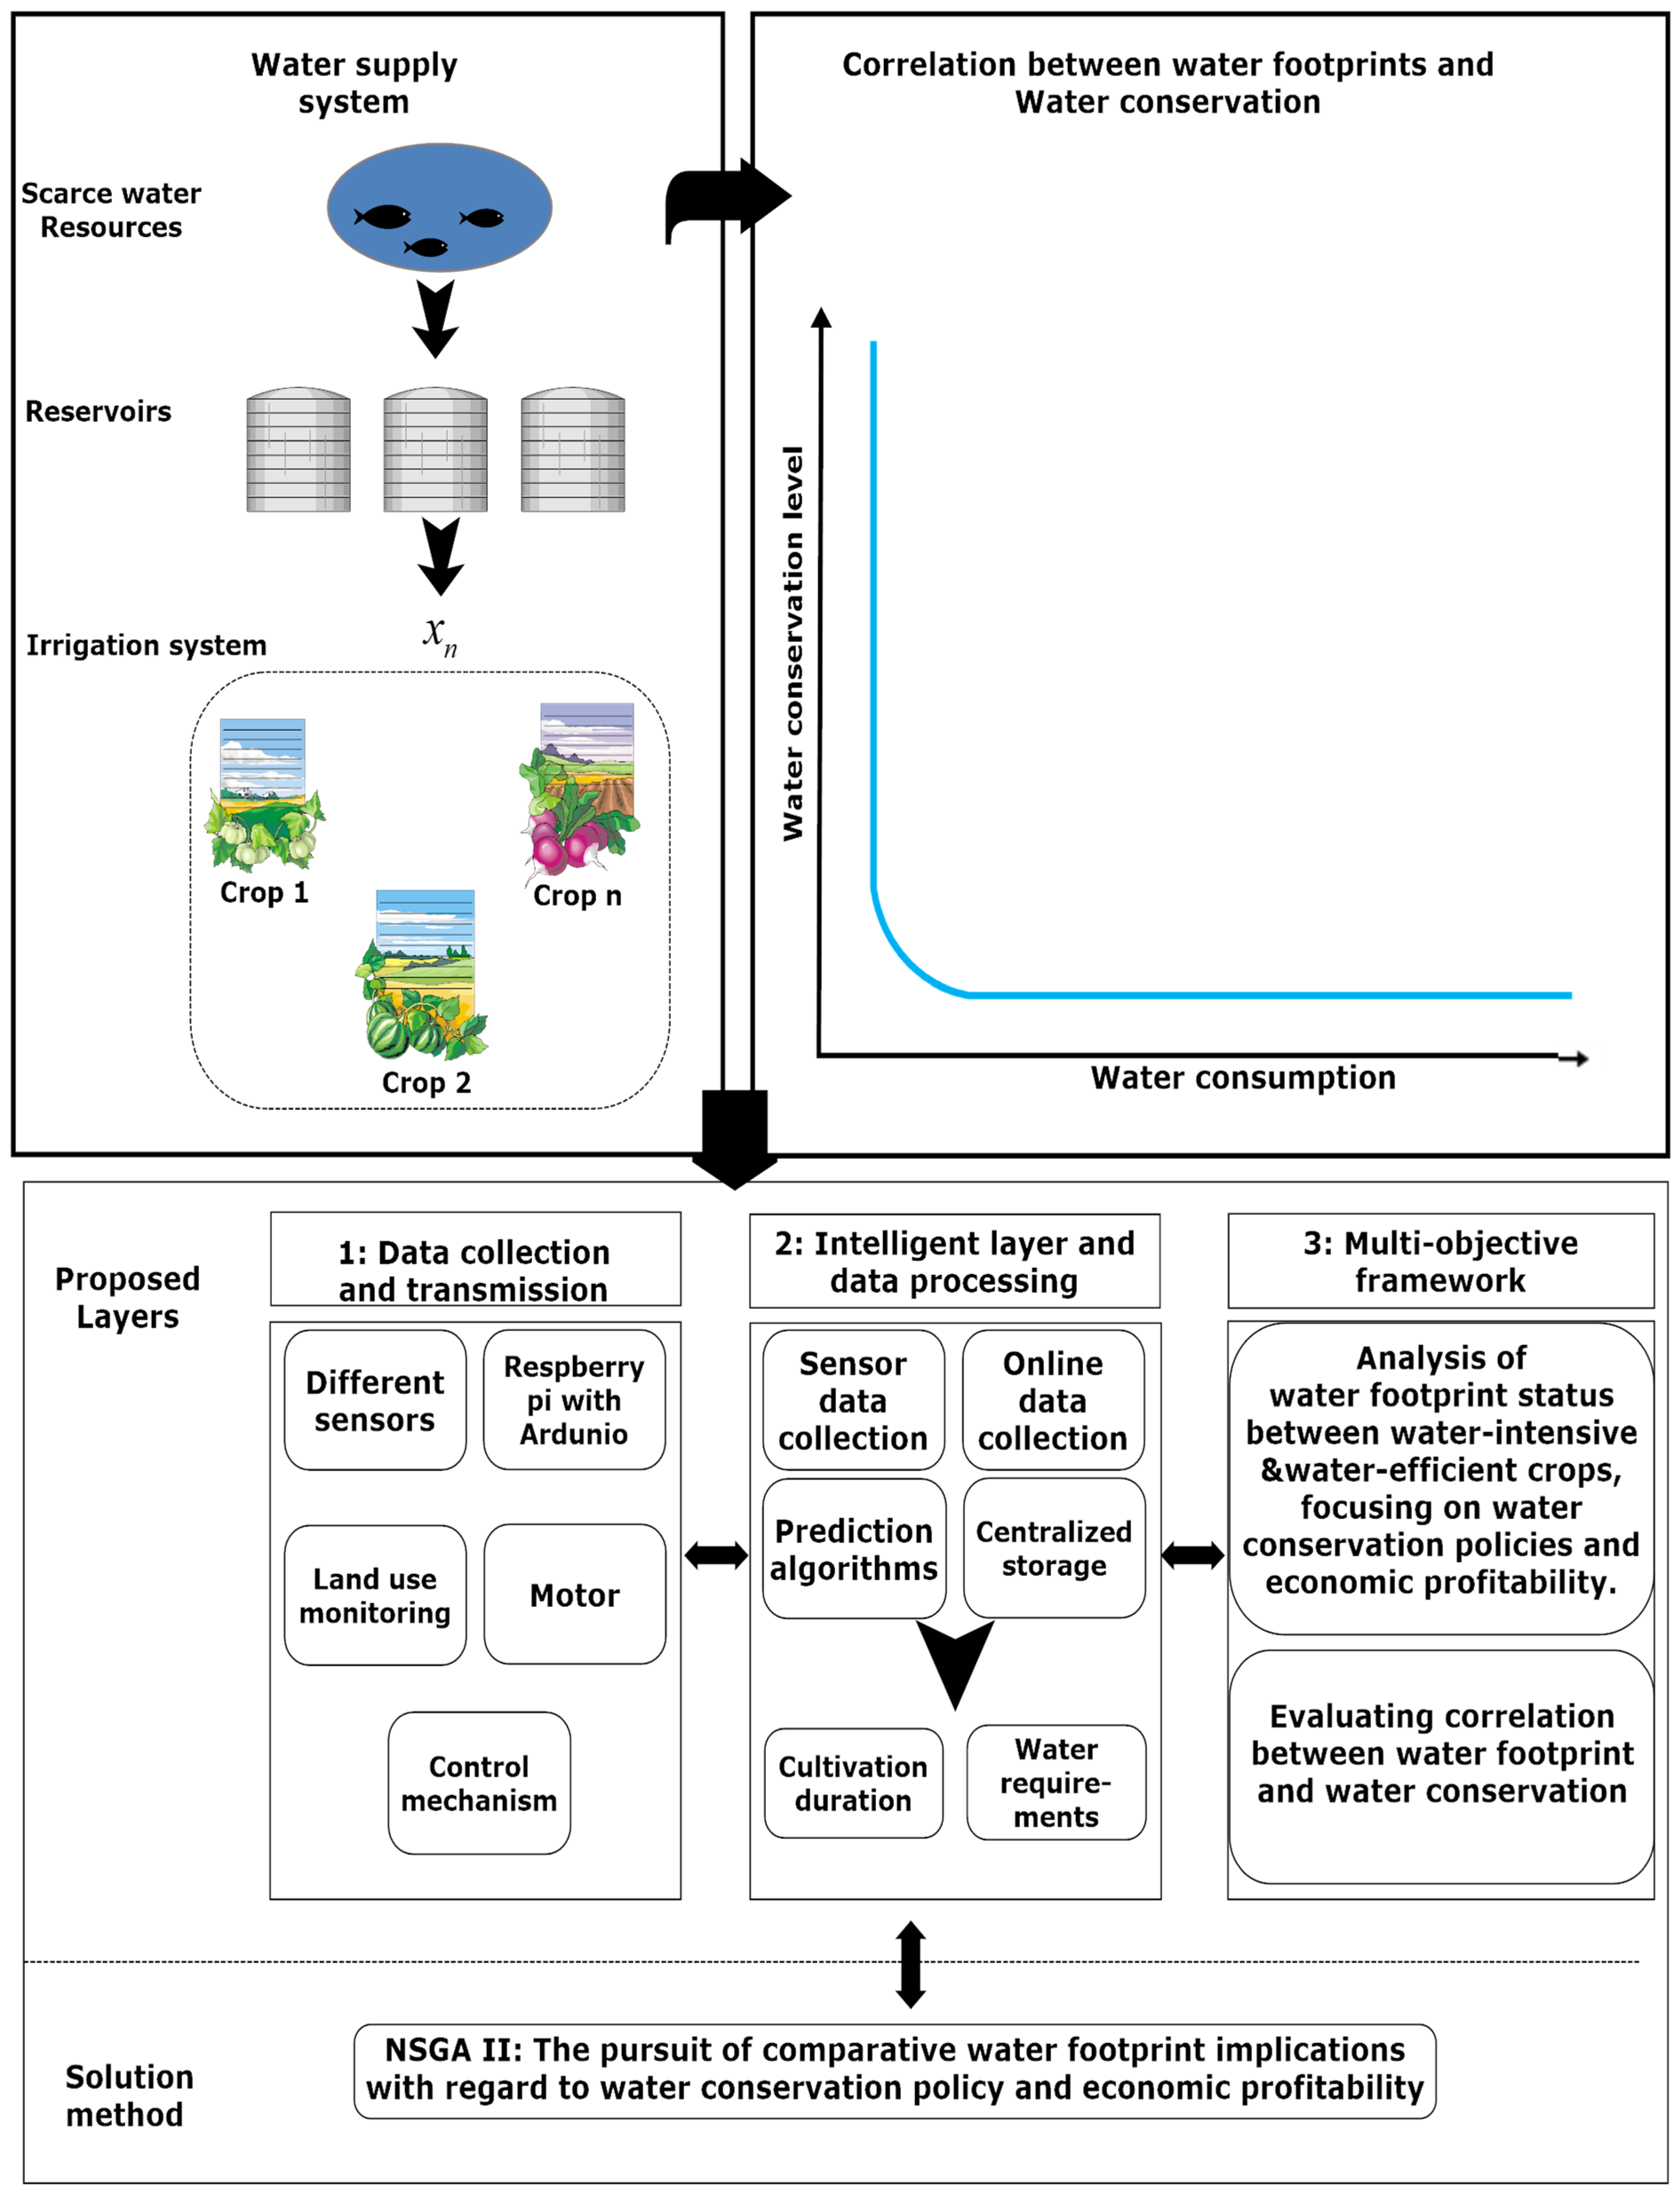
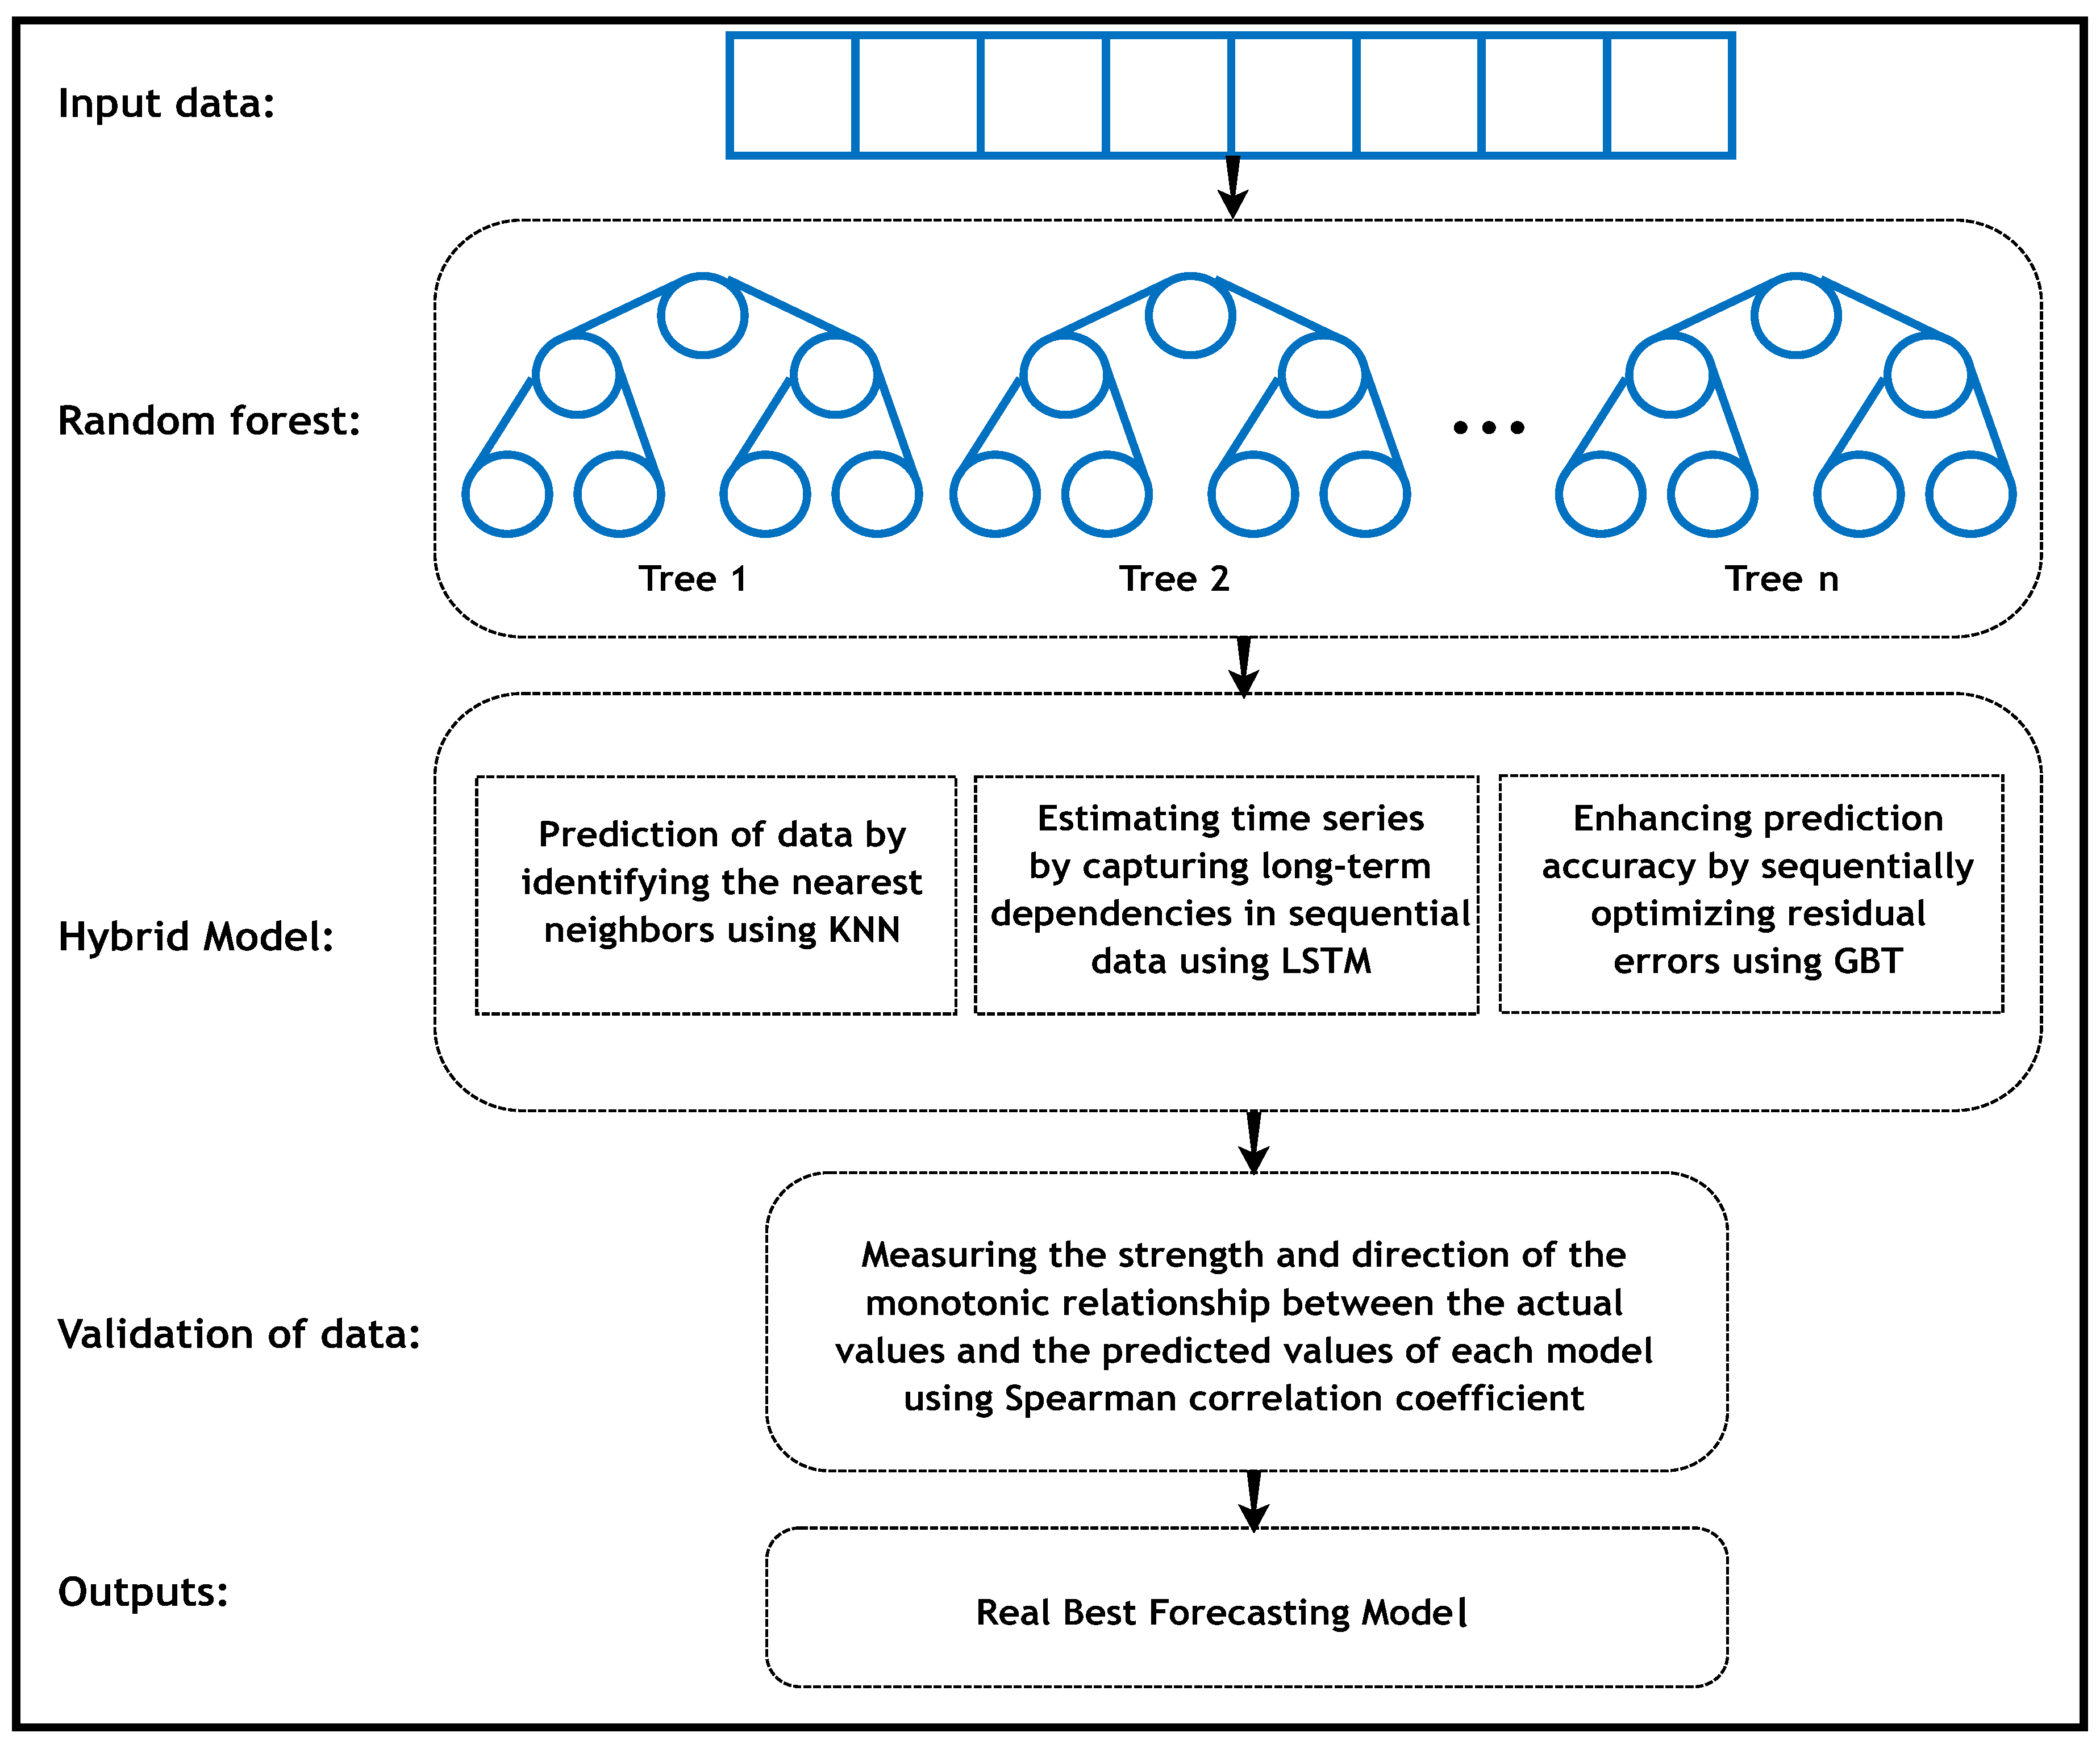
2. Materials and Methods
- KNN (K-Nearest Neighbors) Algorithm
- 2.
- LSTM (Long Short-Term Memory) Algorithm
- 3.
- GBT (Gradient Boosted Tree) Algorithm
3. Case Study
4. Results and Analysis
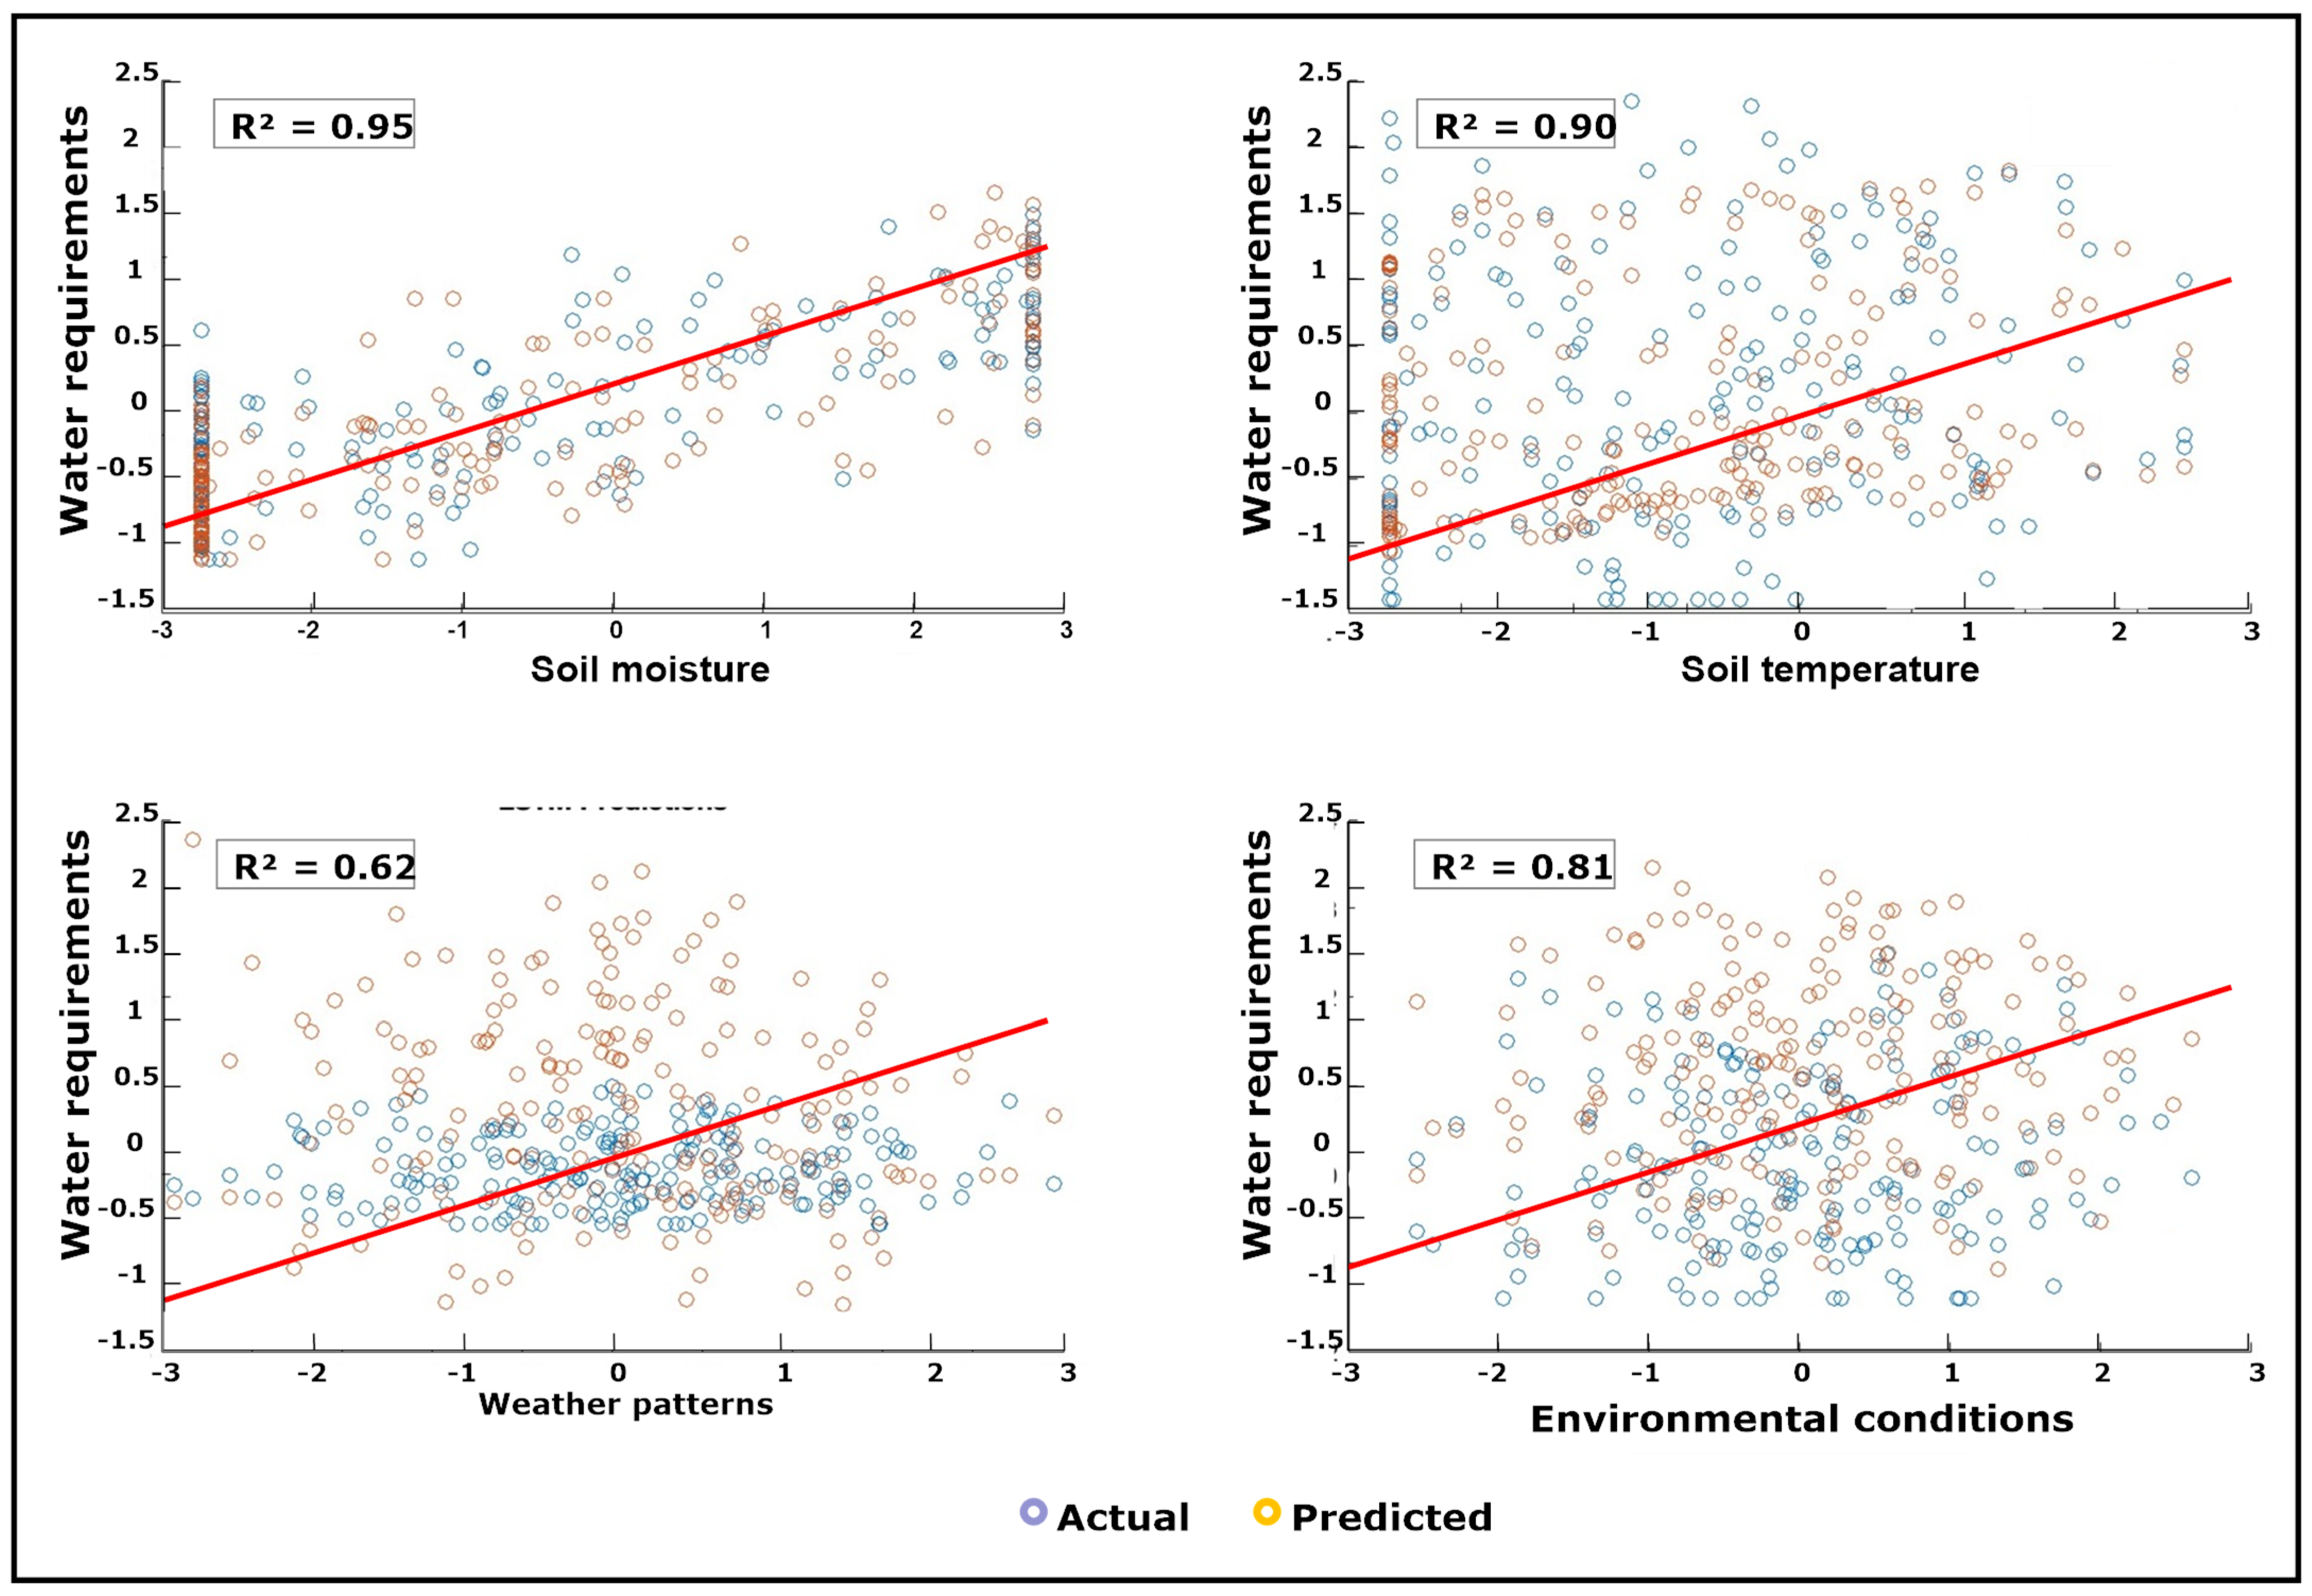
4.1. Analysis of Data Pre-Processing
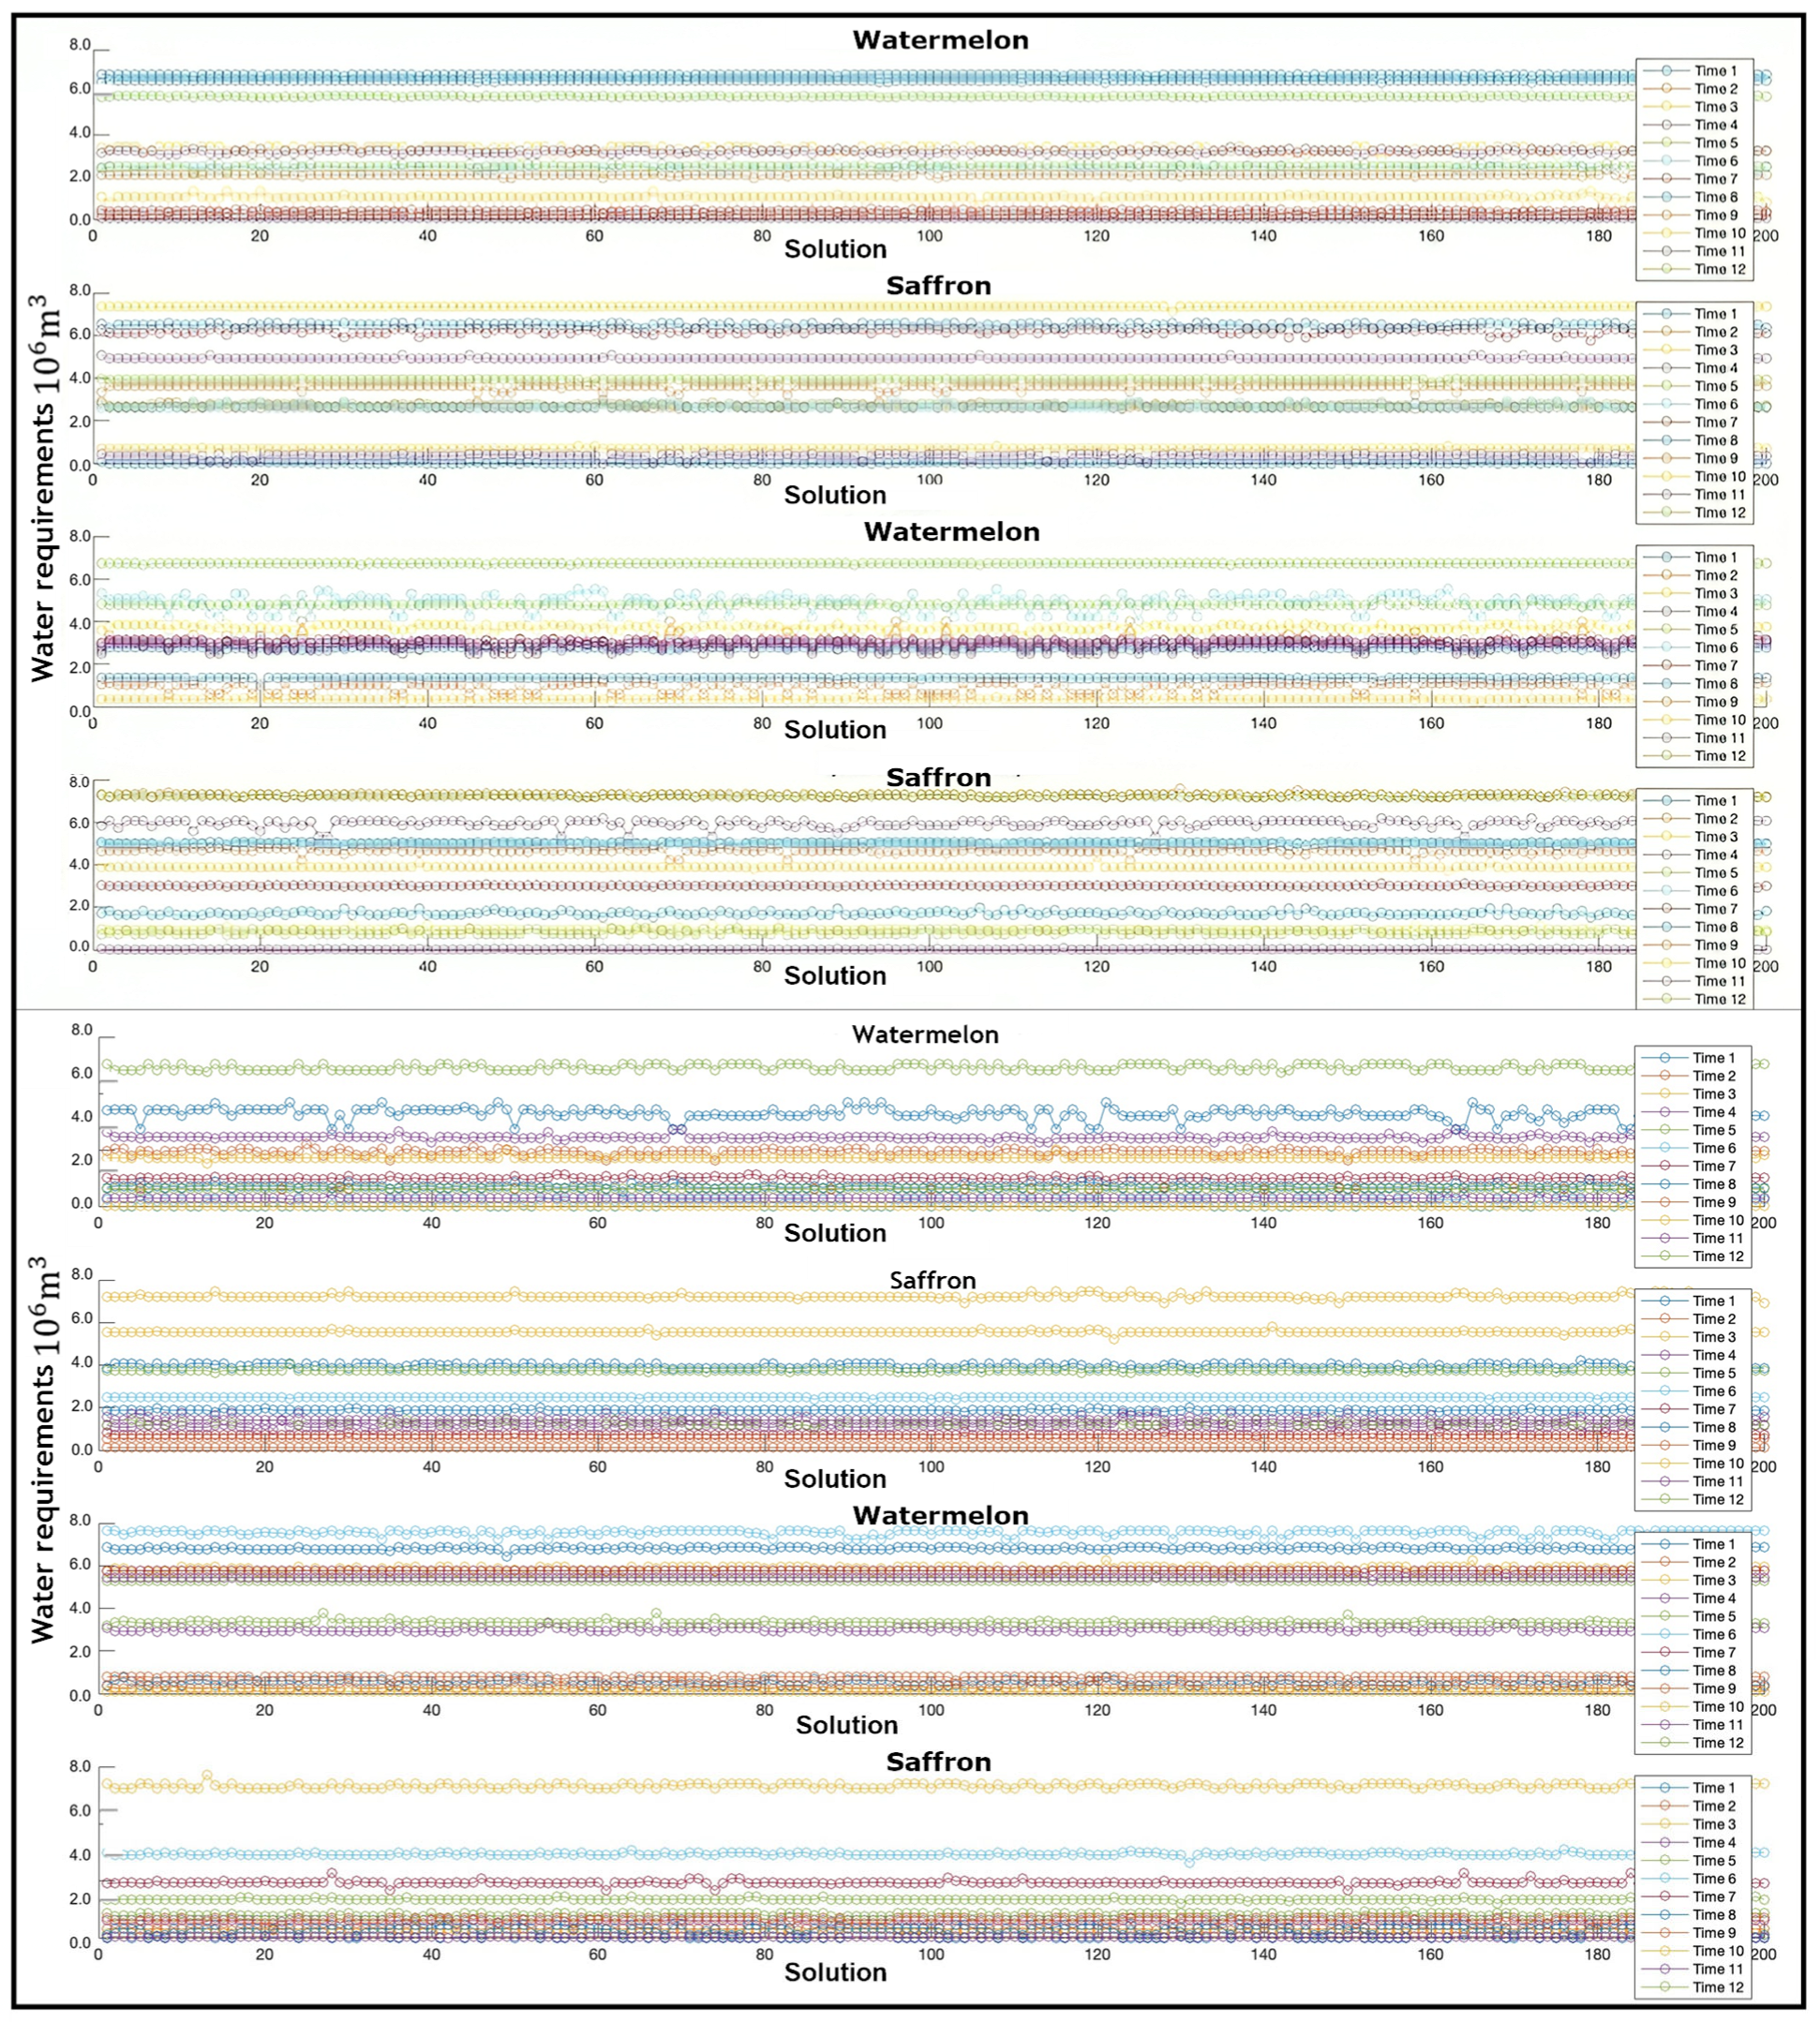
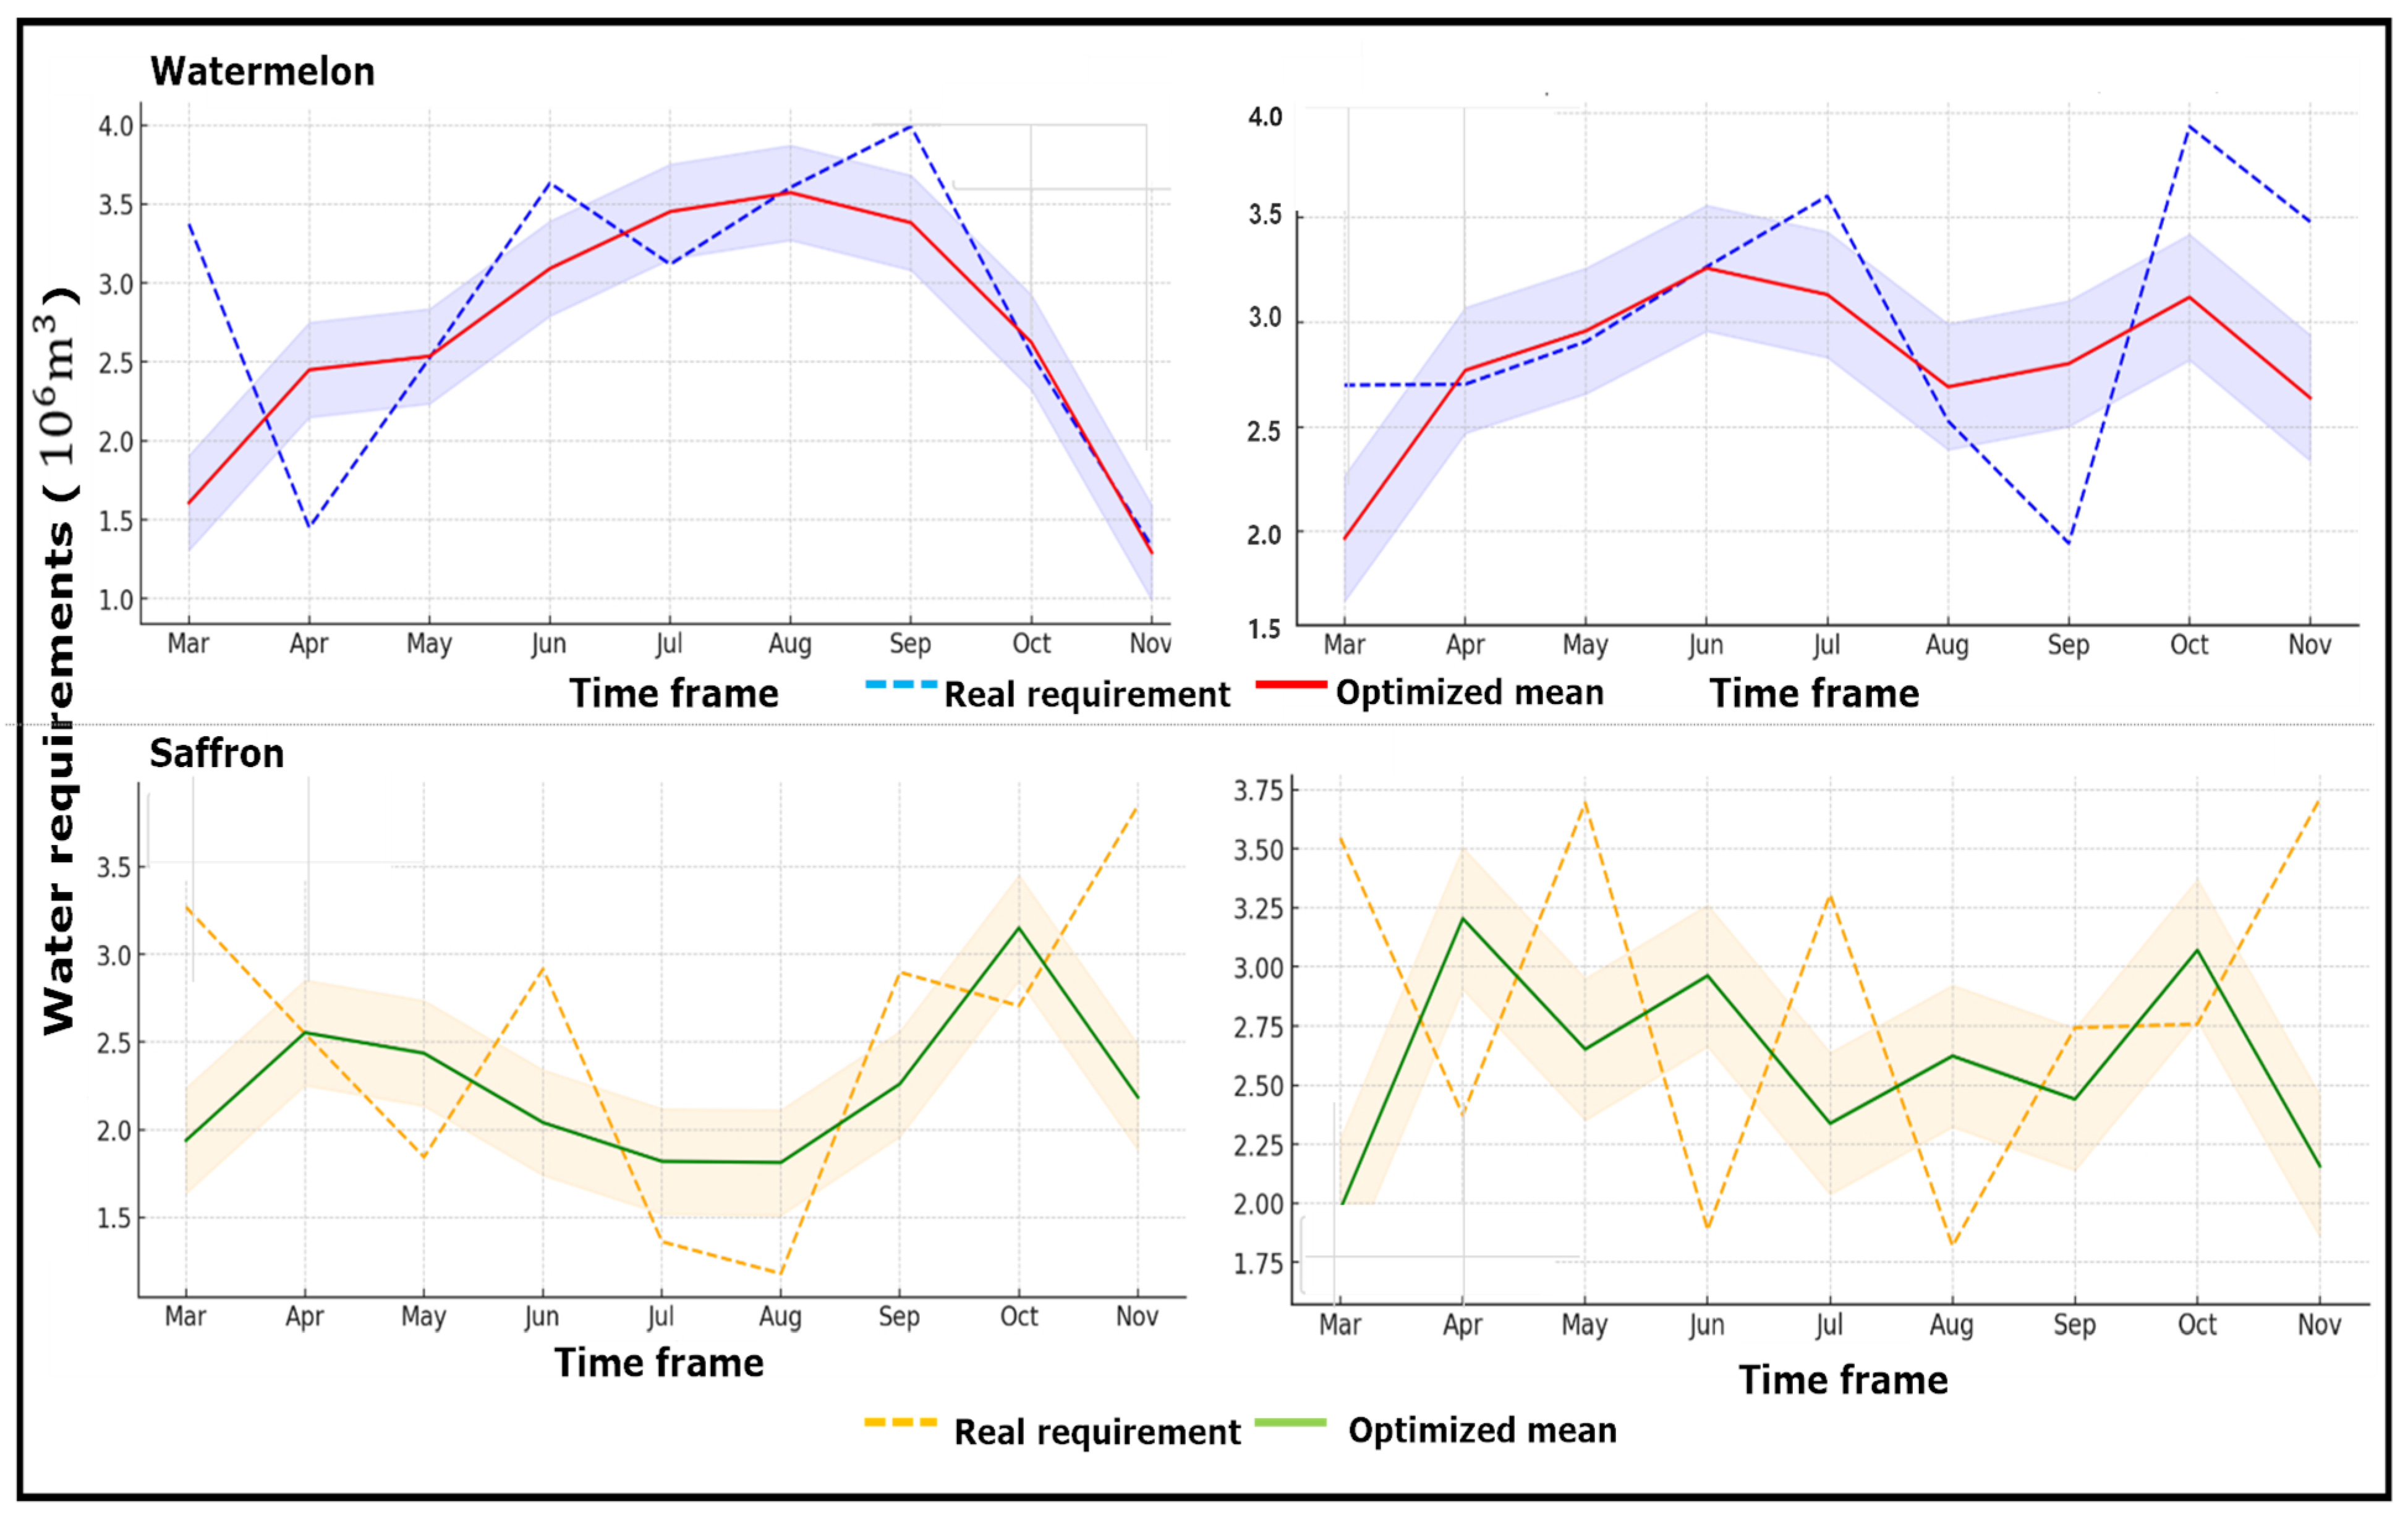
4.2. Analysis of Water Requirements Variability for Crops Across Time Frame
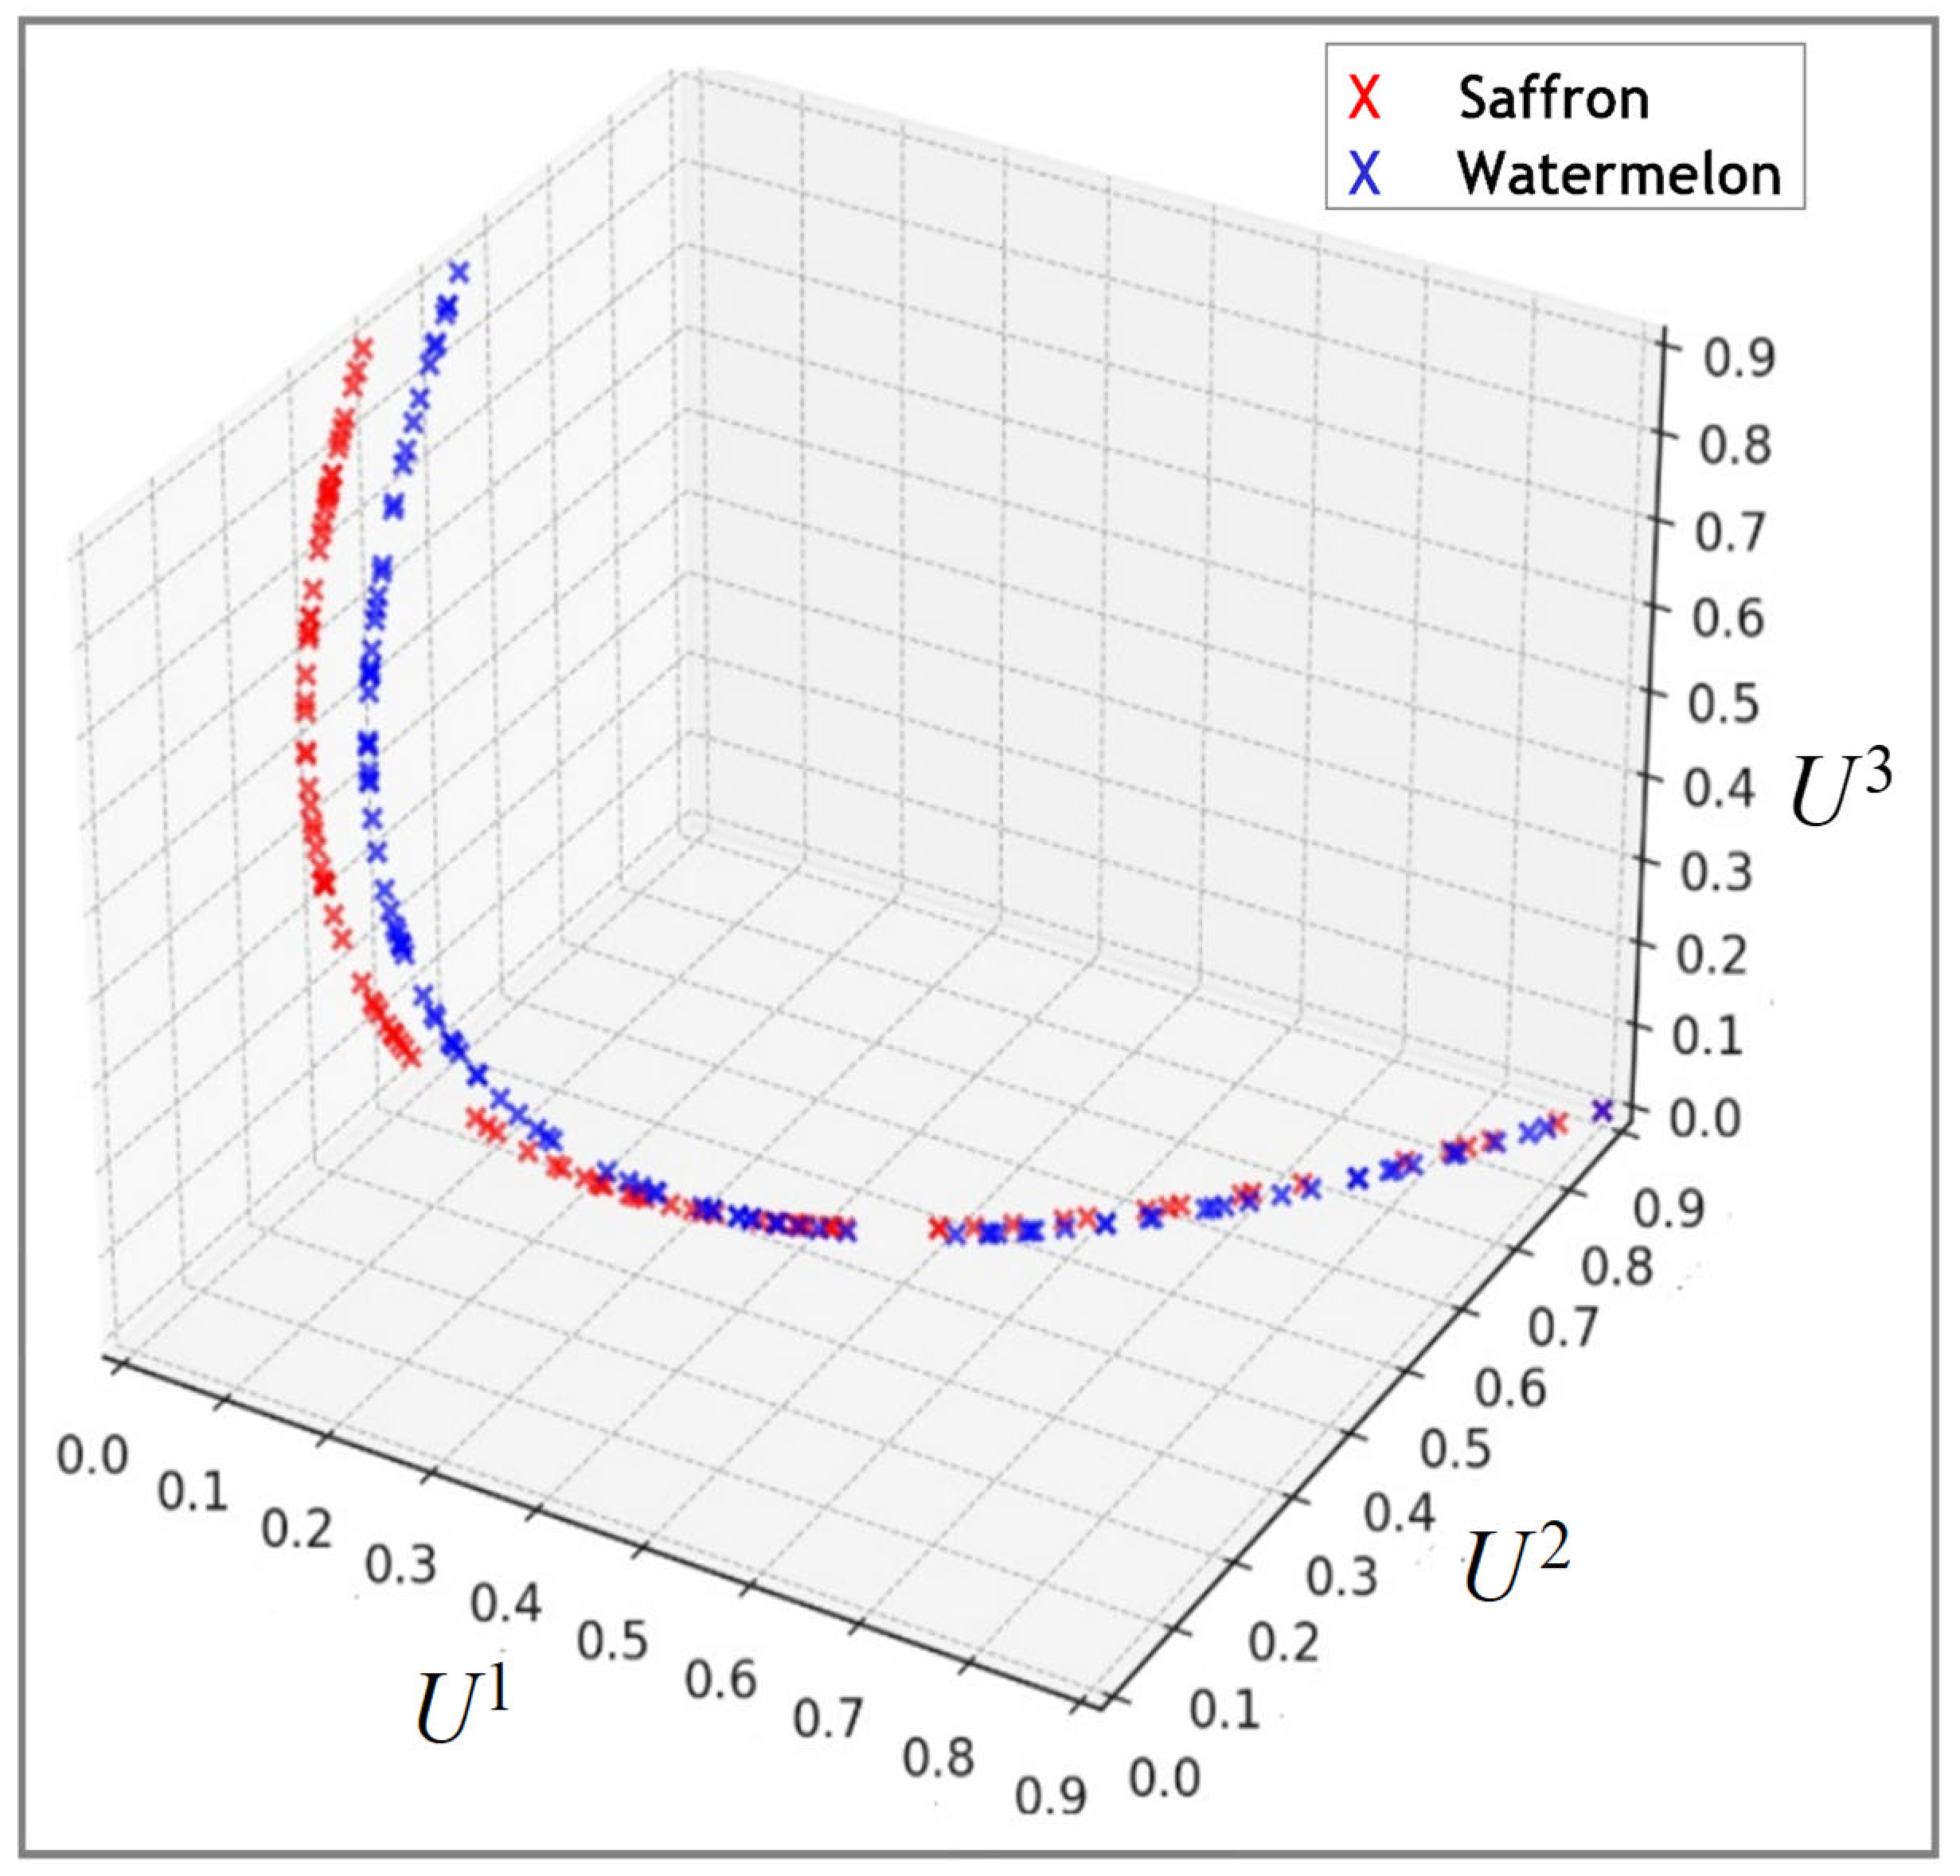
4.3. Analysis of Water Footprint with Regard to Economic Benefits
5. Discussion
5.1. Approach 1: Establish a Water Credit Trading System for Farmers
5.2. Approach 2: Create Digital Water Conservation Platforms with Seasonal Water Balancing
5.3. Approach 3: Promote Vertical Farming for High-Value, Low-Water Crops
6. Conclusions
Author Contributions
Funding
Data Availability Statement
Conflicts of Interest
References
- Mahdi, M.; Xueqian, S.; Yuan, H.; Amani-Beni, M. Enhancing Equitable Water Distribution in Agriculture: A Novel Optimal Framework for Irrigation Equity Index Improvement Under Diverse Adaptation Strategies. Water Resour. Manag. 2024, 38, 2669–2685. [Google Scholar] [CrossRef]
- Xu, Z.; Yao, L.; Zhou, X.; Moudi, M.; Zhang, L. Optimal irrigation for sustainable development considering water rights transaction: A Stackelberg-Nash-Cournot equilibrium model. J. Hydrol. 2019, 575, 628–637. [Google Scholar] [CrossRef]
- He, Y.; Mahdi, M.; Huang, P.; Xie, G.; Galoie, M.; Shafi, M. Investigation of climate change adaptation impacts on optimization of water allocation using a coupled SWAT-bi level programming model. Wetlands 2021, 41, 36. [Google Scholar] [CrossRef]
- Nazari, B.; Liaghat, A.; Akbari, M.R.; Keshavarz, M. Irrigation water management in Iran: Implications for water use efficiency improvement. Agric. Water Manag. 2018, 208, 7–18. [Google Scholar] [CrossRef]
- Mohanraj, I.; Ashokumar, K.; Naren, J.J. Field monitoring and automation using IOT in agriculture domain. Procedia Comput. Sci. 2016, 93, 931–939. [Google Scholar] [CrossRef]
- Yuan, H.; Mahdi, M.; Xueqian, S.; Galoie, M. A novel robust evaluation approach to improve systematic behavior of failure safety in water supply system under various ellipsoid uncertainties. Sci. Rep. 2024, 14, 8746. [Google Scholar] [CrossRef]
- Vianny, D.M.; John, A.; Mohan, S.K.; Sarlan, A.; Ahmadian, A. Water optimization technique for precision irrigation system using IoT and machine learning. Sustain. Energy Technol. Assess. 2022, 52, 102307. [Google Scholar]
- Godwin, N.; Johnson, D.M. A Smart IoT Framework for Climate-Resilient and Sustainable Maize Farming in Uganda. arXiv 2025, arXiv:2501.12483. [Google Scholar]
- Kunt, Y.E. Development of a Smart Autonomous Irrigation System Using Iot and AI. arXiv 2025, arXiv:2506.11835. [Google Scholar]
- Pargo, T.A.; Shirazi, M.A.; Fadai, D. Smart and Efficient IoT-Based Irrigation System Design: Utilizing a Hybrid Agent-Based and System Dynamics Approach. arXiv 2025, arXiv:2502.18298. [Google Scholar]
- Lakhiar, I.A.; Yan, H.; Zhang, C.; Wang, G.; He, B.; Hao, B.; Han, Y.; Wang, B.; Bao, R.; Syed, T.N.; et al. A review of precision irrigation water-saving technology under changing climate for enhancing water use efficiency, crop yield, and environmental footprints. Agriculture 2024, 14, 1141. [Google Scholar] [CrossRef]
- Wilberforce, N.; Mwebaze, J. A framework for IoT-Enabled Smart Agriculture. arXiv 2025, arXiv:2501.17875. [Google Scholar]
- Bernardo, M.; Gatchalian, S.M.; Evangelista, J.; Tejada, R. Development of Artificial Intelligence Algorithm for Smart Irrigation Using Internet of Things (IoT). J. Eng. Emerg. Technol. 2022, 1, 24–36. [Google Scholar] [CrossRef]
- Barbosa, M.W.; Pumpín, M.D. The Effects of Water Footprint Management on Companies’ Reputations and Legitimacy under the Influence of Corporate Social Responsibility and Government Support: Contributions to the Chilean Agri-Food Industry. Water 2024, 16, 2746. [Google Scholar] [CrossRef]
- Yao, L.; Xu, Z.; Moudi, M.; Li, Z. Optimal water allocation in Iran: A dynamic bi-level programming model. Water Supply 2019, 19, 1120–1128. [Google Scholar] [CrossRef]
- Zhu, Y.; Jiang, S.; Han, X.; Gao, X.; He, G.; Zhao, Y.; Li, H. A bibliometrics review of water footprint research in China: 2003–2018. Sustainability 2019, 11, 5082. [Google Scholar] [CrossRef]
- Hong, X.; Basirialmahjough, M.; He, Y.; Moudi, M. Investigation of drought risk using a dynamic optimization framework in regional water allocation procedure with different streamflow scenarios. Front. Environ. Sci. 2022, 10, 813239. [Google Scholar] [CrossRef]
- Mahdi, M. Enhancing Disparity in Water Distribution within Irrigation Systems Aimed at Improving the Conflict Domain under Alternative Perspectives: A Reliable Multi-Objective Framework. Agriculture 2024, 14, 1316. [Google Scholar] [CrossRef]
- Tong, F.; Guo, P. Simulation and optimization for crop water allocation based on crop water production functions and climate factor under uncertainty. Appl. Math. Model. 2013, 37, 7708–7716. [Google Scholar] [CrossRef]
- Ren, C.; Li, Z.; Zhang, H. Integrated multi-objective stochastic fuzzy programming and AHP method for agricultural water and land optimization allocation under multiple uncertainties. J. Clean. Prod. 2019, 210, 12–24. [Google Scholar] [CrossRef]
- Li, M.; Xu, Y.; Fu, Q.; Singh, V.P.; Liu, D.; Li, T. Efficient irrigation water allocation and its impact on agricultural sustainability and water scarcity under uncertainty. J. Hydrol. 2020, 586, 124888. [Google Scholar] [CrossRef]
- Giuliani, M.; Herman, J.D.; Castelletti, A.; Reed, P. Many-objective reservoir policy identification and refinement to reduce policy inertia and myopia in water management. Water Resour. Res. 2014, 50, 3355–3377. [Google Scholar] [CrossRef]
- Deb, K.; Pratap, A.; Agarwal, S.; Meyarivan, T.A. A fast and elitist multiobjective genetic algorithm: NSGA-II. IEEE Trans. Evol. Comput. 2002, 6, 182–197. [Google Scholar] [CrossRef]
- Zhang, Q.; Li, H. MOEA/D: A multiobjective evolutionary algorithm based on decomposition. IEEE Trans. Evol. Comput. 2007, 11, 712–731. [Google Scholar] [CrossRef]
- Ghaemi, Z.; Noshadi, M. Surface water quality analysis using multivariate statistical techniques: A case study of Fars Province rivers, Iran. Environ. Monit. Assess. 2022, 194, 178. [Google Scholar] [CrossRef] [PubMed]
- Sheykhi, V.; Samani, N. Assessment of water quality compartments in Kor River, IRAN. Environ. Monit. Assess. 2020, 192, 532. [Google Scholar] [CrossRef]
- Sajedipour, S.; Zarei, H.; Oryan, S. Estimation of environmental water requirements via an ecological approach: A case study of Bakhtegan Lake, Iran. Ecol. Eng. 2017, 100, 246–255. [Google Scholar] [CrossRef]
- Nasiri, A.; Khosravian, M.; Zandi, R.; Entezari, A.; Baaghide, M. Analysis of physical changes in Fars province water zones related to climatic parameters using remote sensing, Bakhtegan, Tashk, Iran. Egypt. J. Remote Sens. Space Sci. 2023, 26, 851–861. [Google Scholar] [CrossRef]
- Bakhshaee, A.; Castellarin, A.; Haghighi, A.T.; Shustikova, I. The Impact of Land and Water Use Change on Climate-Water-Land-Energy Nexus in Bakhtegan Basin (Iran). Master’s Thesis, Alma Mater Studiorum Università di Bologna, Bologna, Italy, 2019. [Google Scholar]
- Sepaskhah, A.R.; Kamgar-Haghighi, A.A. Saffron irrigation regime. Int. J. Plant Prod. 2009, 3, 1–16. [Google Scholar]
- Chapagain, A.K.; Hoekstra, A.Y. Water footprints of nations. In UNESCO-IHE Value of Water Research Report Series; Unesco-IHE Institute for Water Education: Delft, The Netherlands, 2004. [Google Scholar]
- Alibabaei, K.; Gaspar, P.D.; Assunção, E.; Alirezazadeh, S.; Lima, T.M. Irrigation optimization with a deep reinforcement learning model: Case study on a site in Portugal. Agric. Water Manag. 2022, 263, 107480. [Google Scholar] [CrossRef]
- Dalin, C.; Wada, Y.; Kastner, T.; Puma, M.J. Groundwater depletion embedded in international food trade. Nature 2017, 543, 700–704. [Google Scholar] [CrossRef] [PubMed]


| Sr No | Species Name | Values Watermelon/Saffron | Sr No | Species Name | Values Watermelon/ Saffron |
|---|---|---|---|---|---|
| 1 | Max. water requirement | 600/300 mm per growing season | 5 | Number of nodes | 3000/500,000 per hectare |
| 2 | Duration of Planting and Harvesting Period | Mar/June 2023 | 6 | Coefficients in water production function (a, b, c) | −0.0199, 29.690, −5185/−0.1303, 63.18, −6817 |
| 3 | Max. water requirement/month | 150/65 Liters | 7 | Price (109∗IRR/kg) | 0.018/0.66 |
| 4 | Watering Schedule Duration | 6/20 days |
| Mar Wat/Saf | Apr Wat/Saf | May Wat/Saf | June Wat/Saf | July Wat/Saf | Aug Wat/Saf | Sep Wat/Saf | Oct Wat/Saf | Nov Wat/Saf | |
|---|---|---|---|---|---|---|---|---|---|
| Root moisture (%) | 0.84/0.51 | 0.81/0.53 | 0.88/0.56 | 0.74/0.57 | 0.82/0.5 | 0.73/0.5 | 0.78/0.49 | 0.73/0.43 | 0.7/0.47 |
| Ambient moisture (%) | 0.63/0.38 | 0.59/0.32 | 0.65/0.41 | 0.51/0.39 | 0.64/0.47 | 0.58/0.43 | 0.62/0.51 | 0.53/0.46 | 0.51/0.30 |
| Humidity (%) | 0.31/0.29 | 0.35/0.32 | 0.38/0.39 | 0.38/0.27 | 0.25/0.31 | 0.27/0.36 | 0.18/0.27 | 0.21/0.28 | 0.25/0.32 |
| Rainfall (mm) | 49/37 | 34/41 | 22/38 | 28/24 | 18/26 | 16/19 | 21/13 | 26/17 | 19/11 |
| Maximum watering (Lt) | 35/10 | 35/10 | 35/10 | 40/10 | 40/5 | 35/10 | 25/5 | 25/10 | 25/5 |
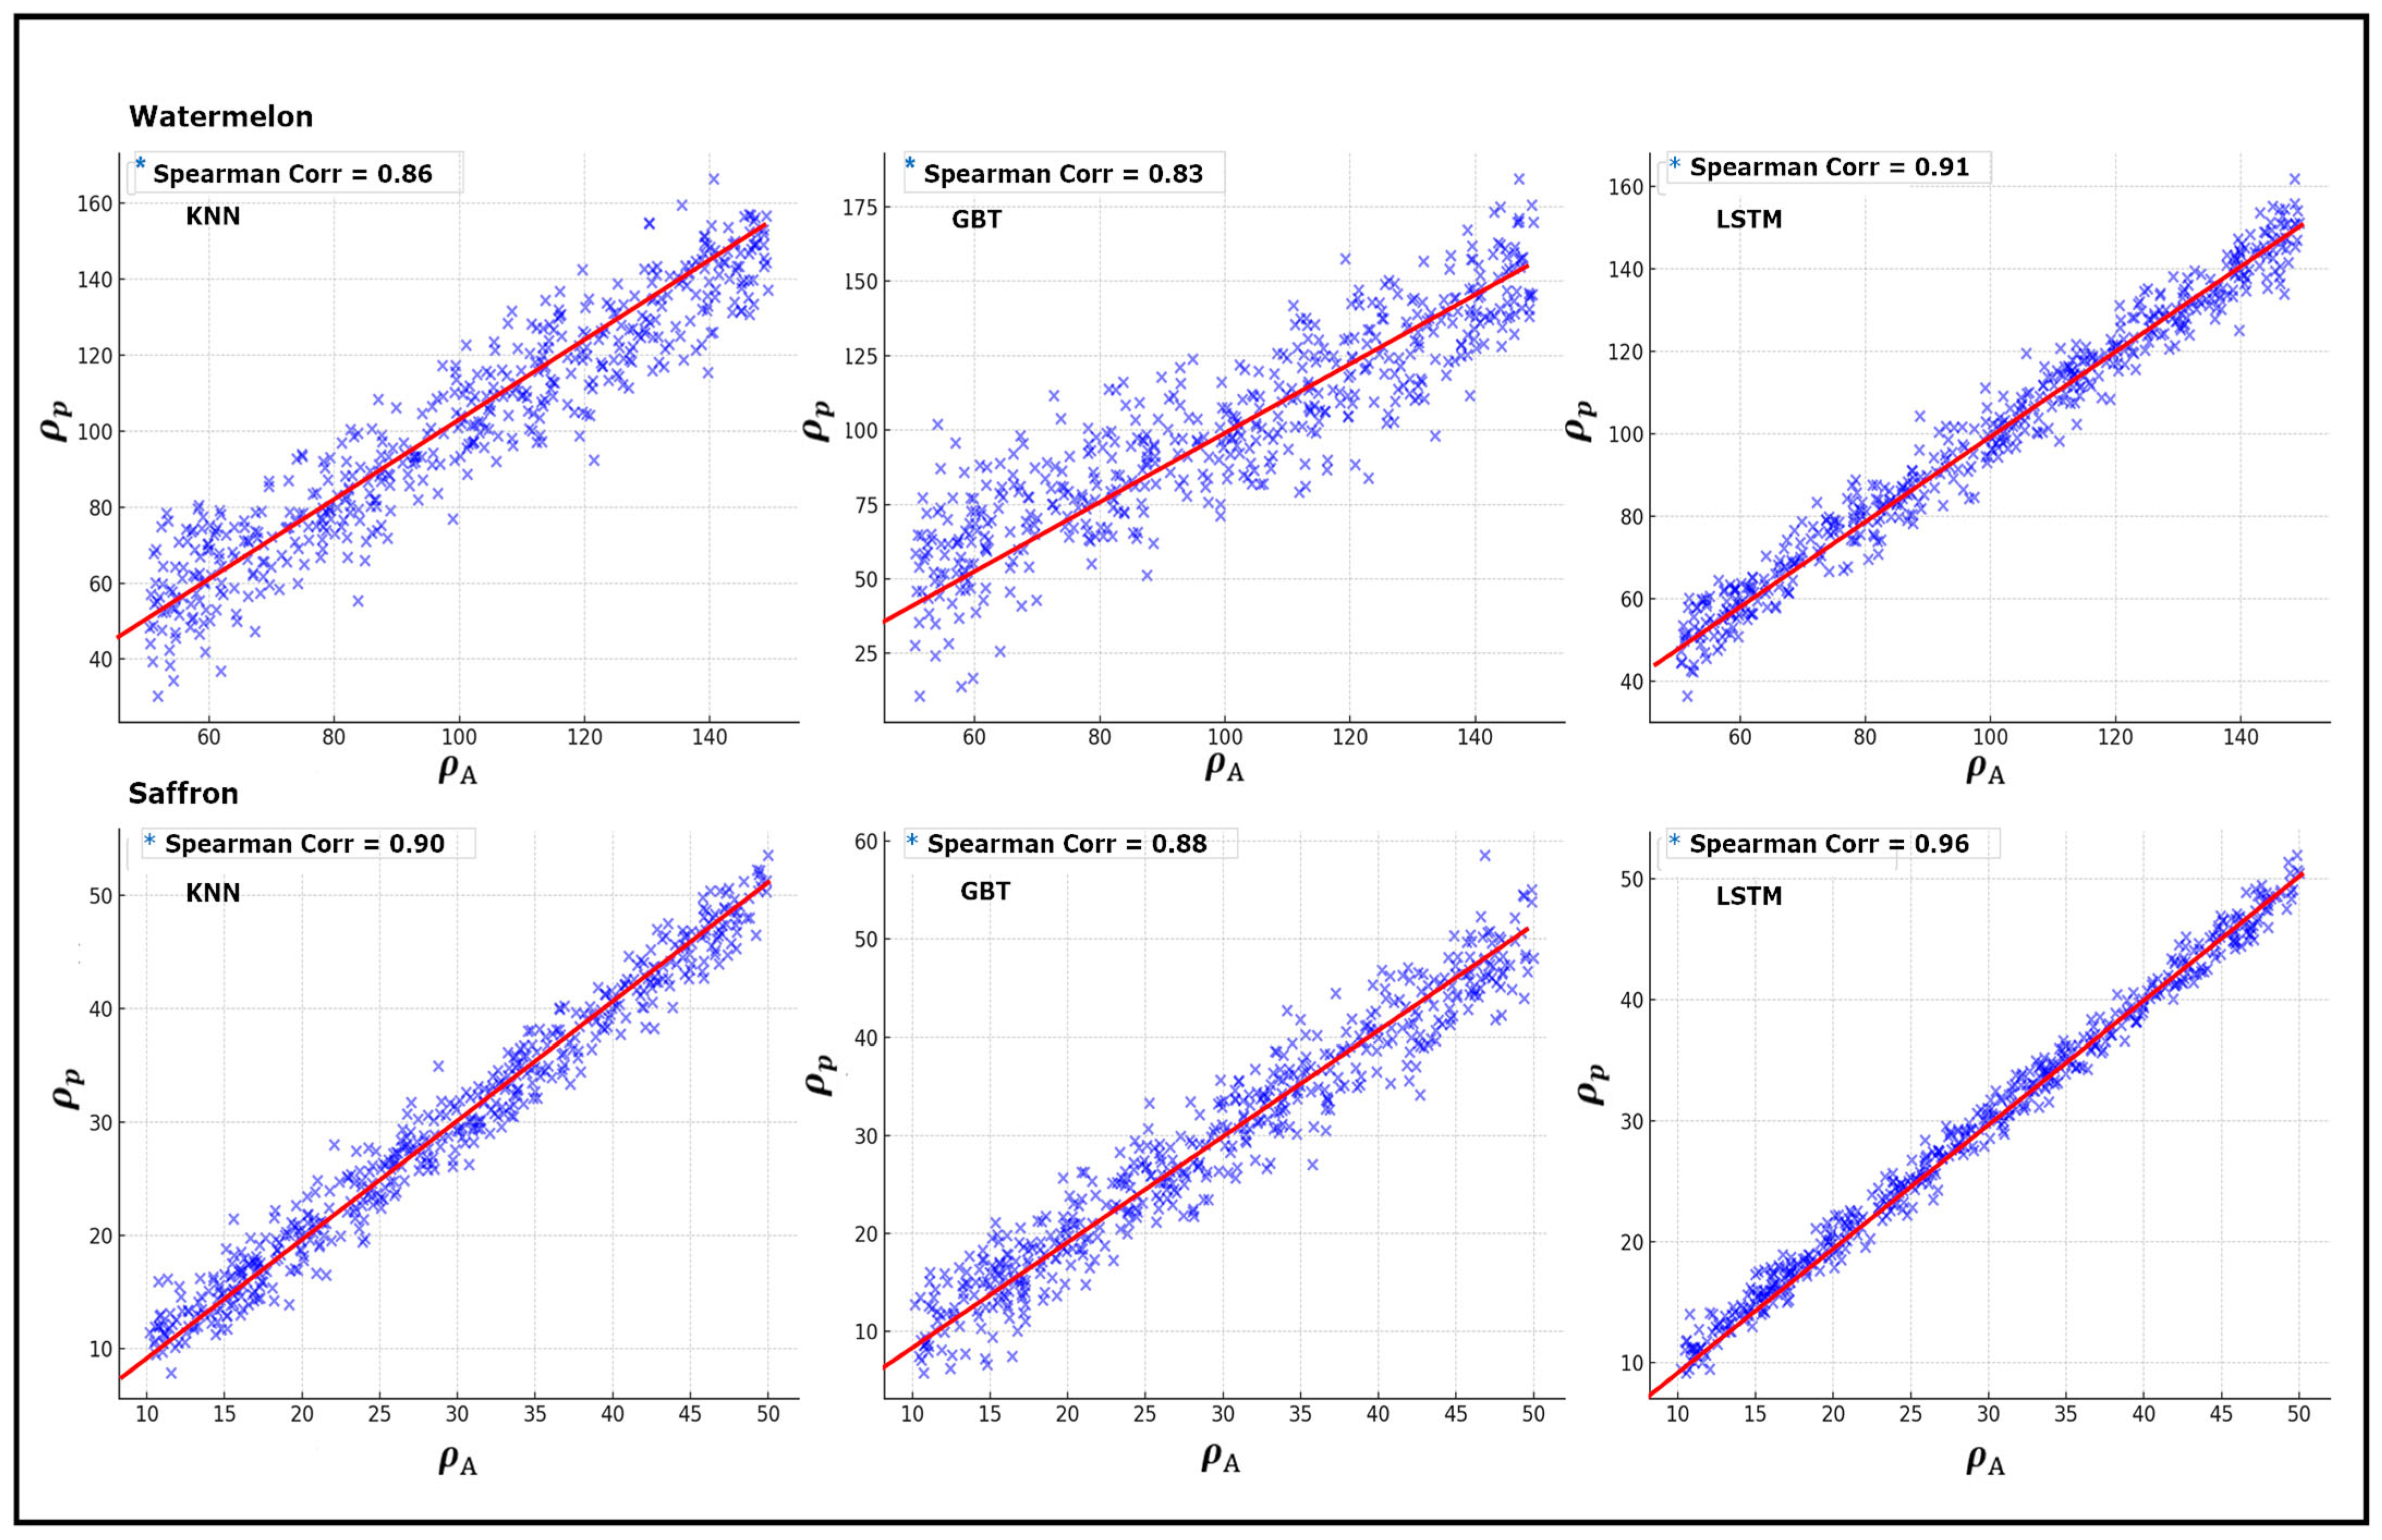
| Epochs | Zone1 S.C Wat/Saf | R2 Wat/Saf | RMSE Wat/Saf | PT(s) Wat/Saf | Zone2 S.C Wat/Saf | R2 Wat/Saf | RMSE Wat/Saf | PT(s) Wat/Saf |
|---|---|---|---|---|---|---|---|---|
| 12 | 0.72/0.78 | 0.94/0.89 | 0.439/0.689 | 13/12 | 0.74/0.69 | 0.94/0.91 | 0.354/0.587 | 15/12 |
| 24 | 0.71/0.81 | 0.95/0.93 | 0.367/0.721 | 14/14 | 0.72/0.87 | 0.92/0.91 | 0.248/0.604 | 14/18 |
| 36 | 0.71/0.69 | 0.93/0.91 | 0.432/0.584 | 22/26 | 0.73/0.84 | 0.91/0.94 | 0.531/0.467 | 27/23 |
| 48 | 0.72/0.76 | 0.97/0.91 | 0.512/0.609 | 36/32 | 0.77/0.67 | 0.95/0.87 | 0.543/0.671 | 28/31 |
| 60 | 0.71/0.75 | 0.96/0.91 | 0.722/0.612 | 34/35 | 0.75/0.71 | 0.94/0.89 | 0.615/0.74 | 26/24 |
| 72 | 0.68/0.79 | 0.99/0.92 | 0.457/0.719 | 35/30 | 0.69/0.76 | 0.98/0.91 | 0.551/0.498 | 38/29 |
| Watermelon | Saffron | |||||
|---|---|---|---|---|---|---|
| Zone 1 | 34.61 | 19.87 | 0.716/0.494 | 0.802/0.351 | 0.318/0.495 | |
Harvesting ( | 30.09 6792 | 34.88 6 | ||||
| Zone 2 | 41.07 | 28.65 | 0.483/0.359 | 0.743/0.398 | 0.508/0.327 | |
Harvesting ( | 32.40 7104 | 39.71 8 |
Disclaimer/Publisher’s Note: The statements, opinions and data contained in all publications are solely those of the individual author(s) and contributor(s) and not of MDPI and/or the editor(s). MDPI and/or the editor(s) disclaim responsibility for any injury to people or property resulting from any ideas, methods, instructions or products referred to in the content. |
© 2025 by the authors. Licensee MDPI, Basel, Switzerland. This article is an open access article distributed under the terms and conditions of the Creative Commons Attribution (CC BY) license (https://creativecommons.org/licenses/by/4.0/).
Share and Cite
Moudi, M.; Xie, D.; Cao, L.; Zhang, H.; Zhang, Y.; Bahramimianrood, B. Water Footprint Through an Analysis of Water Conservation Policy: Comparative Analysis of Water-Intensive and Water-Efficient Crops Using IoT-Driven ML Models. Water 2025, 17, 1964. https://doi.org/10.3390/w17131964
Moudi M, Xie D, Cao L, Zhang H, Zhang Y, Bahramimianrood B. Water Footprint Through an Analysis of Water Conservation Policy: Comparative Analysis of Water-Intensive and Water-Efficient Crops Using IoT-Driven ML Models. Water. 2025; 17(13):1964. https://doi.org/10.3390/w17131964
Chicago/Turabian StyleMoudi, Mahdi, Dan Xie, Lin Cao, Hehuai Zhang, Yunchu Zhang, and Bahador Bahramimianrood. 2025. "Water Footprint Through an Analysis of Water Conservation Policy: Comparative Analysis of Water-Intensive and Water-Efficient Crops Using IoT-Driven ML Models" Water 17, no. 13: 1964. https://doi.org/10.3390/w17131964
APA StyleMoudi, M., Xie, D., Cao, L., Zhang, H., Zhang, Y., & Bahramimianrood, B. (2025). Water Footprint Through an Analysis of Water Conservation Policy: Comparative Analysis of Water-Intensive and Water-Efficient Crops Using IoT-Driven ML Models. Water, 17(13), 1964. https://doi.org/10.3390/w17131964