Review

Remote-Sensing Indicators and Methods for Coastal-Ecosystem Health Assessment: A Review of Progress, Challenges, and Future Directions

1
School of History and Culture, Mudanjiang Normal University, Mudanjiang 157011, China
2
Guangdong Provincial Key Laboratory of Forest Cultivation, Protection and Utilization, Guangzhou 510520, China
3
Guangdong Academy of Forestry, Guangzhou 510520, China
*
Author to whom correspondence should be addressed.
Water 2025, 17(13), 1971; https://doi.org/10.3390/w17131971
Submission received: 20 May 2025 / Revised: 25 June 2025 / Accepted: 26 June 2025 / Published: 30 June 2025
(This article belongs to the Special Issue Remote Sensing in Coastal Water Environment Monitoring)

Abstract

This paper systematically reviews the progress of remote-sensing technology in coastal-ecosystem health assessment. Coastal ecosystems, as transitional zones between land and ocean, play vital roles in maintaining biodiversity, carbon sequestration, and coastal protection, but currently face severe challenges from climate change and human activities. Remote-sensing technology, with its capability for large-scale, long time-series observations, has become a key tool for coastal-ecosystem health assessment. This paper analyzes the technical characteristics and advantages of optical remote sensing, radar remote sensing, and multi-source data fusion in coastal monitoring; constructs a health-assessment framework that includes water-quality indicators, vegetation and ecosystem function indicators, and human disturbance and landscape change indicators; discusses the application of advanced technologies from traditional methods to machine learning and deep learning in data processing; and demonstrates the role of multi-temporal analysis in revealing coastal-ecosystem change trends through typical case studies of mangroves, salt marshes, and coral reefs. Research indicates that, despite the enormous potential of remote-sensing technology in coastal monitoring, it still faces challenges such as sensor limitations, environmental interference, and data processing and validation. Future development should focus on advanced sensor technology, platform innovation, data-processing method innovation, and multi-source data fusion, while strengthening the effective integration of remote-sensing technology with management practices to provide scientific basis for the protection and sustainable management of coastal ecosystems.

1. Introduction

1.1. Importance and Challenges of Coastal-Ecosystem Health Assessment

Coastal ecosystems are transitional zones between land and ocean, encompassing various ecosystem types including mangroves, salt marshes, coral reefs, seagrass beds, and estuaries, which play crucial roles in maintaining biodiversity, carbon sequestration, coastal protection, and resource provision. However, these valuable ecosystems face severe challenges. Research indicates that coastal ecosystems worldwide are experiencing significant degradation. Chen et al. [1] analyzed long-term changes in mangroves in Honduras’ Gulf of Fonseca, finding a net loss of 11.9% over 28 years; Liao et al. [2] documented a 9.3% net reduction in mangrove area in Hainan Island’s protected areas in China from 1987 to 2017; Palandro et al. [3] recorded severe losses of coral cover as high as 79–92% between 1983 and 1999 using long time-series data. These regional studies reflect the widespread pressures facing coastal ecosystems globally.
Climate change and human activities are the primary factors causing coastal-ecosystem degradation. Chen and Kirwan [4] found that coastal forest retreat rates in the U.S. Mid-Atlantic region increased from 3.1 m/year during 1985–2000 to 4.7 m/year during 2001–2020, an acceleration primarily attributed to sea-level rise; while Wang et al. [5] revealed that approximately 60% of tidal wetland changes in Jiangsu Province, China, were directly related to human activities. This combined effect of natural factors and human disturbances makes the assessment of coastal-ecosystem health particularly complex and urgent.
Traditional coastal-ecosystem health assessments primarily rely on field surveys and sample analyses, which, although precise, have obvious limitations. Stelzer et al. [6] pointed out that the limitations of field measurements present significant challenges for coastal monitoring; Moffett et al. [7] also emphasized the notable difficulties in long-term coastal-scale monitoring. These limitations are mainly manifested in limited spatial coverage, poor temporal continuity, inability to monitor inaccessible areas, and high costs and inefficiencies when analyzing large-scale, long-term change trends. Therefore, developing coastal-ecosystem health-assessment methods that can overcome these limitations and provide large-scale, long time-series observational data has become an important direction for current research.
Coastal-ecosystem health assessment also faces challenges in unifying indicator systems and evaluation standards. Different types of coastal ecosystems require specific assessment indicators and methods; for example, mangrove ecosystems need to focus on vegetation coverage, species composition, and canopy structure, while coral reef systems require monitoring of coral coverage, bleaching levels, and fish diversity. This diversity increases the difficulty of establishing a unified assessment framework. Additionally, determining thresholds for ecosystem health status presents challenges, especially in distinguishing between natural variation and anthropogenic disturbance impacts.
Multi-scale integration is another key challenge. The health status of coastal ecosystems is affected by multi-scale factors ranging from global climate change to local pollution sources, requiring consideration of both large-scale environmental changes and small-scale local disturbances. Research by Espriella and Lecours [8] shows that fine analysis of intertidal habitats requires extremely high spatial resolution (3–31 cm), while regional trend analysis requires lower resolution but broader coverage. How to integrate information from different scales to form comprehensive health-assessment results is an important issue that current research needs to address.
Facing these challenges, remote-sensing technology, with its large-scale, long time-series observation capabilities, is becoming an important tool for coastal-ecosystem health assessment. With the continuous development of sensor technology, data-processing methods, and assessment models, remote-sensing technology demonstrates enormous potential in providing comprehensive, timely, and accurate coastal-ecosystem health information, offering important scientific basis for coastal-management and conservation decisions.
However, remote-sensing technology still faces multiple technical challenges in its application to coastal-ecosystem monitoring. Sensor limitations represent fundamental issues: spatial-resolution constraints limit fine-scale observation capabilities, insufficient spectral resolution leads to difficulties in distinguishing similar features, and temporal resolution cannot meet the observation requirements for the highly dynamic nature of coastal environments [9]. Environmental interference factors constitute significant challenges, as the unique atmospheric variations and high water vapor content in coastal areas significantly affect electromagnetic radiation signal transmission quality, suspended particles and dissolved organic matter in water bodies alter water reflectance characteristics, and tidal changes directly impact the visibility of intertidal and shallow water habitats [10]. In terms of data processing and analysis, multi-source data integration faces issues with format, accuracy, and spatiotemporal consistency; the accuracy limitations of complex environmental-classification methods constrain detailed identification; and insufficient sensitivity in change detection affects ecosystem dynamics monitoring [11]. Furthermore, obtaining sufficient and representative ground truth data in coastal environments often faces practical difficulties such as physical accessibility and safety concerns, directly affecting the validation and credibility of research results [6]. The existence of these technical challenges makes the development of more advanced remote-sensing technologies and methodological frameworks an urgent need in current research.
This review provides a systematic analysis of the application progress of remote-sensing technology in coastal-ecosystem health assessment. The scope of the review encompasses the application characteristics of optical remote sensing, radar remote sensing, and multi-source data-fusion technologies in coastal monitoring; the construction of a three-dimensional health-assessment indicator system based on remote sensing for water quality, vegetation function, and human disturbance; the evolution of data-processing techniques from traditional methods to machine learning and deep learning; and case study analyses of typical coastal ecosystems including mangroves, salt marshes, and coral reefs. By integrating research progress from the past decade, this review aims to provide technical pathway guidance for coastal-ecosystem health assessment and promote effective integration between remote-sensing technology and management practices.

1.2. Remote-Sensing Technology Advantages and Scope of This Review

Remote-sensing technology, with its unique characteristics, provides innovative solutions for coastal-ecosystem health monitoring, effectively overcoming the limitations of traditional field survey methods in terms of spatial coverage, temporal continuity, and cost efficiency.

1.2.1. Core Advantages of Remote-Sensing Technology

The main advantages of remote-sensing technology in coastal-ecosystem monitoring are manifested in four aspects:
Large-scale synchronous observation capability. Unlike traditional point-sampling methods, remote sensing can acquire information over large coastal areas within a short time period. Multispectral sensors such as the Landsat series have 30-m spatial resolution, and their long-term data archives provide valuable historical change detection capabilities; while Sentinel-2 MSI possesses 10–60 m spatial resolution and 13 spectral bands, performing particularly well in coastal water-quality monitoring [12].
Long-term continuous time-series data. Castro et al. [13] conducted a 38-year (1984–2022) change analysis of salt marsh coastlines in Portugal’s Aveiro Lagoon using Landsat and Sentinel-2 data; Mu et al. [14] combined multi-source data for long-term monitoring of coastline changes in the eastern Laizhou Bay, China. Such long-term time-series data are crucial for identifying ecosystem change trends, evaluating the effectiveness of management measures, and predicting future development directions.
Diverse platform and sensor synergy. Synthetic aperture radar (SAR) has unique advantages in coastal monitoring due to its all-weather, all-day imaging capability and cloud-penetrating characteristics [15]; unmanned aerial vehicle systems can be flexibly deployed and operate below cloud cover, providing centimeter-level ultra-high spatial resolution [16]; while hyperspectral systems like AVIRIS demonstrate unique advantages in complex coastal environments with hundreds of continuous narrow bands.
Advanced data-fusion and processing capabilities. The U-STFM model developed by Guo et al. [17] successfully downscaled MODIS chlorophyll products from 1-km to 30-m resolution, achieving R 2 values of 0.868–0.881; the multi-resolution collaborative fusion method by Yuan et al. [18] improved wetland classification average accuracy by 9%. Machine-learning methods such as random forest and deep-learning techniques like CNN perform excellently in processing complex data, providing powerful tools for extracting valuable coastal-ecosystem health information from massive remote-sensing data.

1.2.2. Objectives and Scope of This Review

Based on the above technical advantages, remote-sensing technology has become an important tool for coastal-ecosystem health assessment. However, as pointed out by Almar et al. [19], effectively applying these technologies to coastal-management decisions still faces numerous challenges. This review aims to systematically review research progress in remote-sensing technology for coastal-ecosystem health assessment, analyze existing challenges, and prospect future development directions.
Specific objectives include: (1) systematically analyzing the remote-sensing indicator system applied in coastal-ecosystem health assessment; (2) comparing the applicability of different remote-sensing platforms and data sources in monitoring various dimensions of coastal health; (3) exploring the application progress of advanced technologies such as machine learning and deep learning in processing coastal multi-source remote-sensing data; (4) examining solutions for scale effects and data-fusion methods in coastal-ecosystem monitoring; (5) proposing future research development directions, particularly the establishment of comprehensive monitoring methods.
In terms of content scope, this review first systematically introduces the application characteristics and technical progress of optical remote sensing, radar remote sensing, and multi-source data fusion in coastal-ecosystem monitoring. It then deeply explores remote-sensing data-processing and analysis methods, covering traditional methods, machine-learning applications, and key technical issues such as scale effects and data fusion. On this basis, it constructs a remote-sensing-based coastal-ecosystem health-assessment indicator system, including three aspects: water-quality indicators, vegetation and ecosystem function indicators, and human disturbance and landscape change indicators. Through typical case studies of mangroves, salt marshes, coral reefs, and other ecosystems, it demonstrates the practical application of remote-sensing technology in health assessment of different types of coastal ecosystems.
Innovative contributions include: first, systematically integrating the latest technical progress in optical remote sensing, radar remote sensing, and multi-source data fusion; second, constructing a comprehensive indicator system encompassing three dimensions of water quality, vegetation function, and human disturbance; third, deeply exploring the comparative application from traditional methods to artificial intelligence technologies; fourth, particularly focusing on scale effects and data-fusion issues; finally, emphasizing the transformation pathway from scientific research to management applications.
This review focuses on research progress over the past decade, and by integrating research cases from different regions globally and different types of coastal ecosystems, aims to provide a comprehensive and in-depth technical review that serves both academic research and provides reference for coastal-management decisions. As shown in Figure 1, the comprehensive framework for remote-sensing-based coastal-ecosystem health assessment includes four main components: remote-sensing platforms and data sources, data-processing and analysis methods, ecosystem health indicators, and applications and management support, providing the overall research approach for detailed discussions in subsequent chapters.

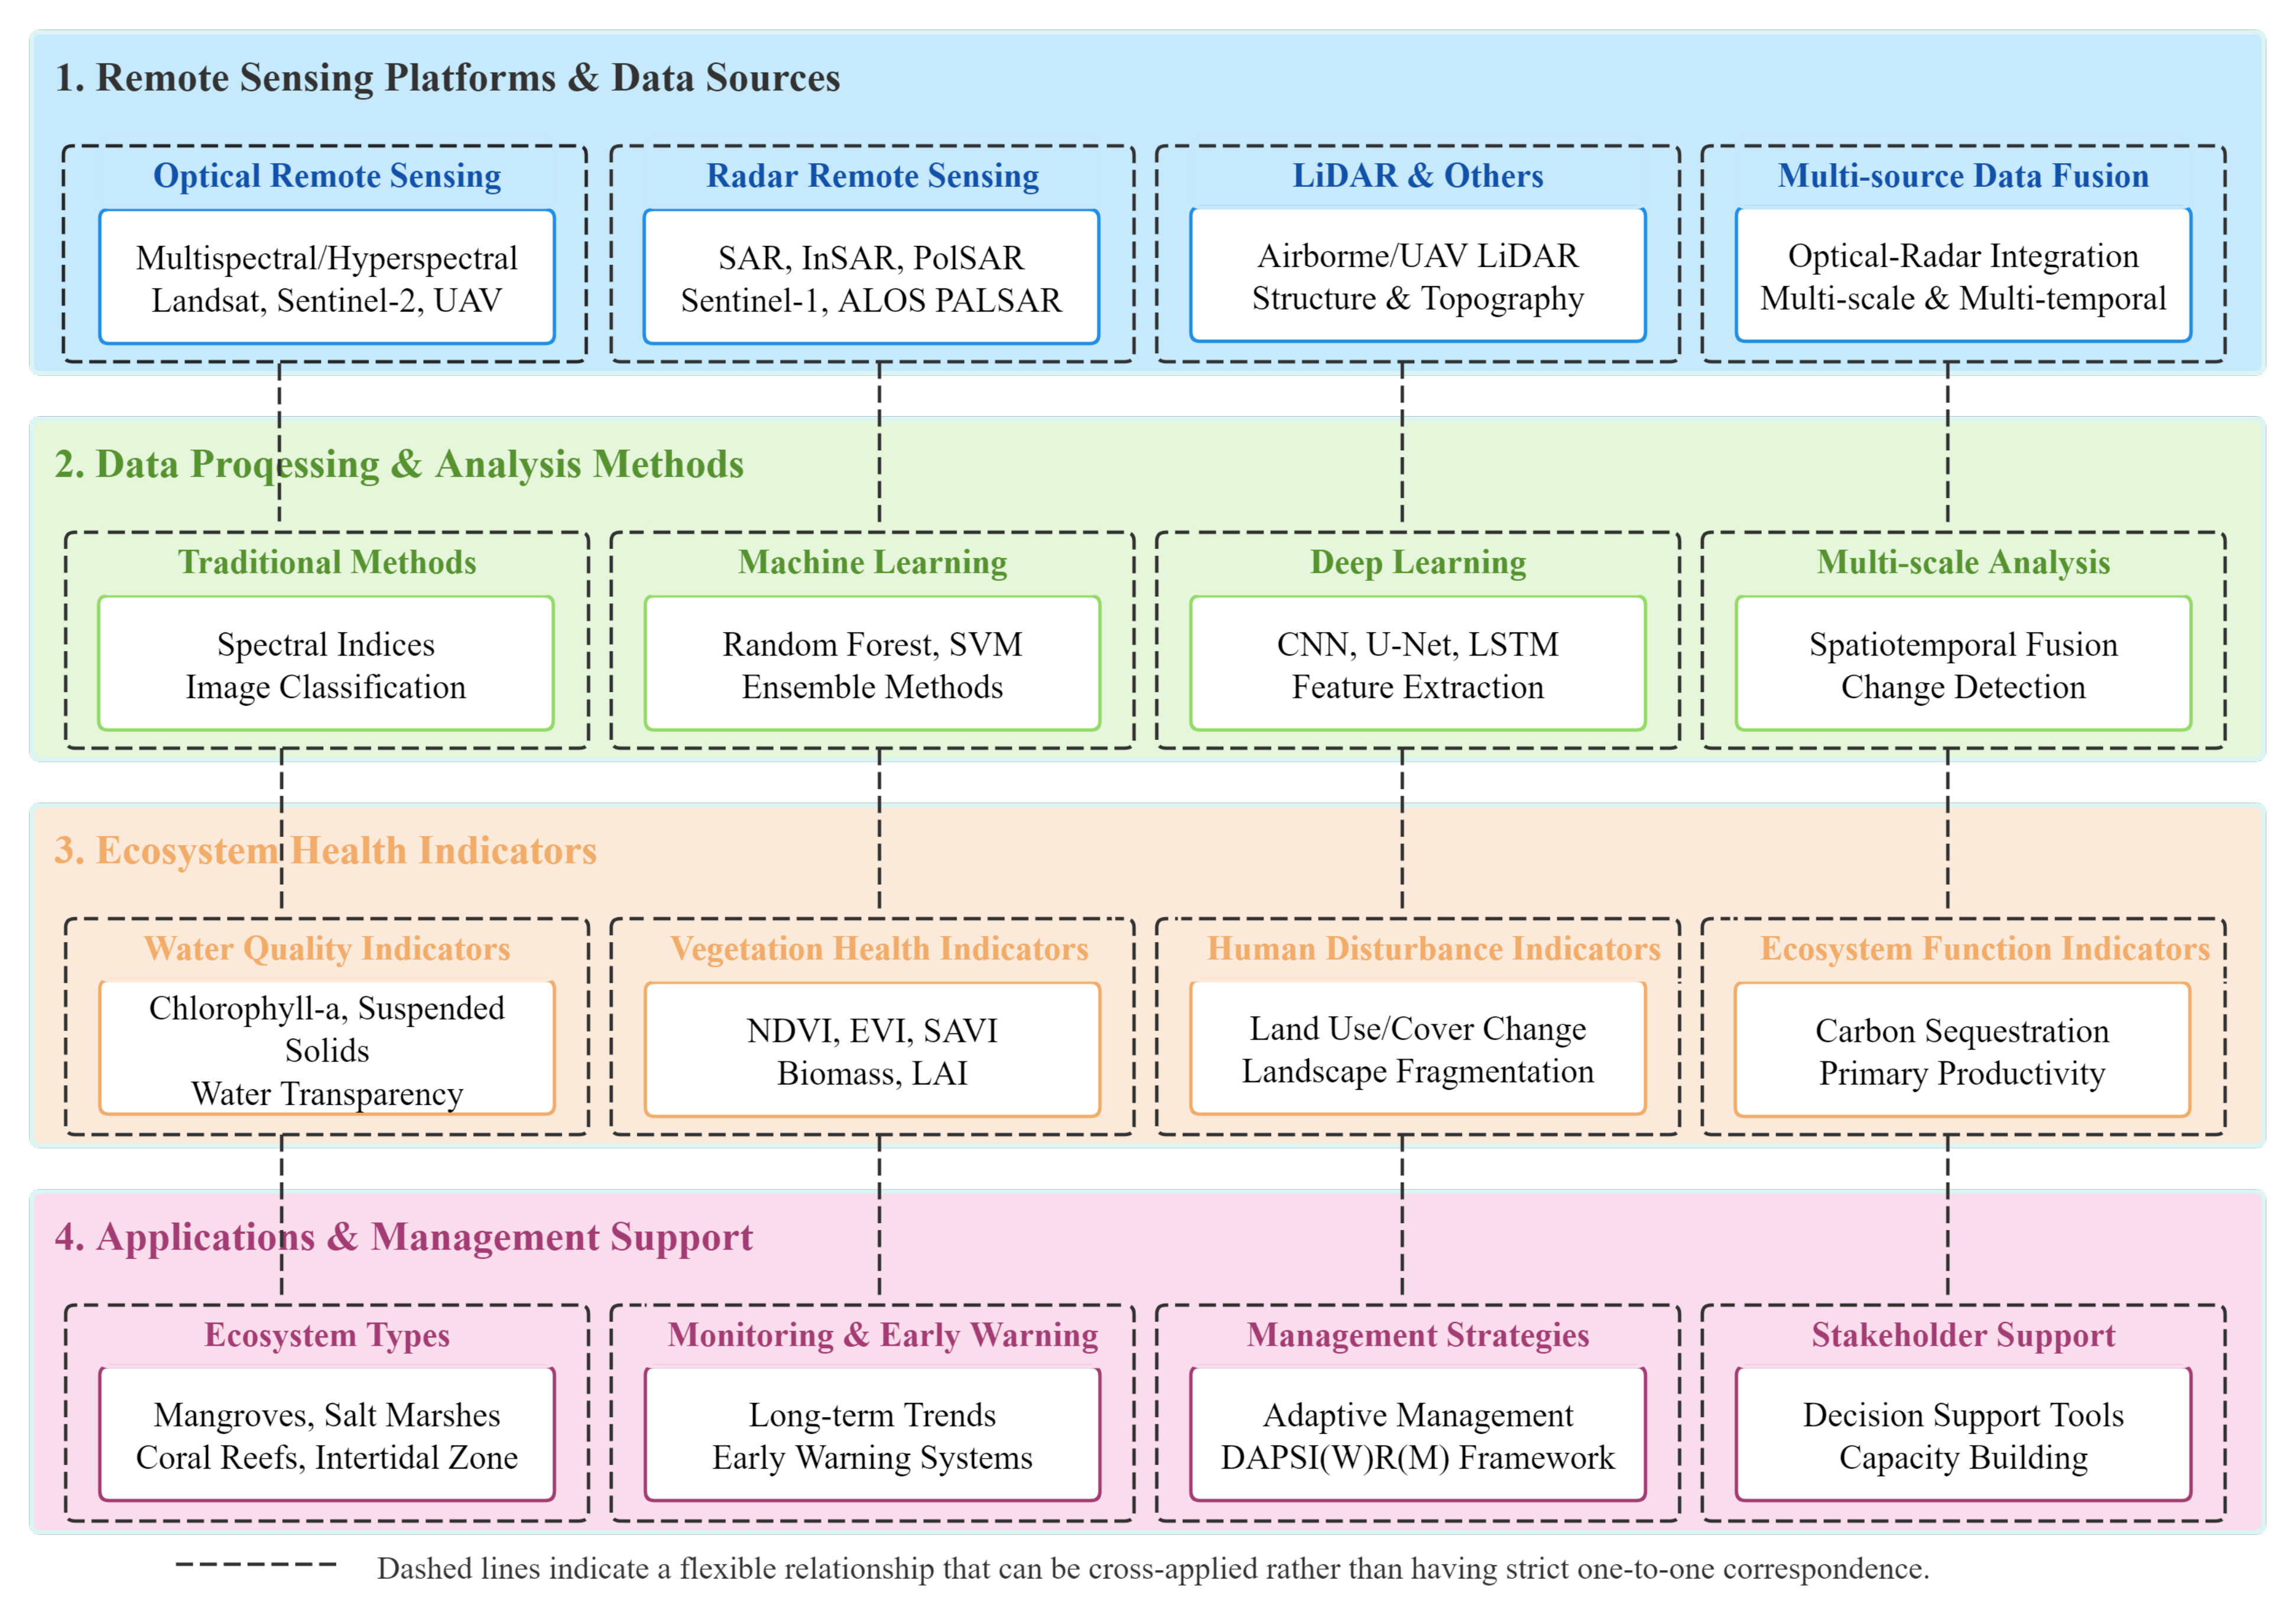
2. Remote-Sensing Platforms and Technologies

Coastal-ecosystem remote-sensing monitoring employs various satellite platforms and sensors, each with distinct advantages and limitations in terms of spatial resolution, temporal resolution, spectral characteristics, and application scenarios. Table 1 outlines the main parameters and application characteristics of commonly used remote-sensing satellite platforms in coastal-ecosystem monitoring.

2.1. Optical Remote-Sensing Technology and Applications

Optical sensors monitor coastal ecosystems by detecting solar radiation reflected from the Earth’s surface. Their working principle is based on the differences in reflectance characteristics of various surface features across the electromagnetic spectrum: water bodies exhibit strong absorption characteristics in the near-infrared band (0.7–1.3 μ m), while vegetation shows strong reflectance in this band, which forms the physical basis for water–land separation. Multispectral sensors capture key ecological information through specific band combinations, such as the “red edge” effect formed by chlorophyll’s strong absorption in the red band (0.6–0.7 μ m) and strong reflectance in the near-infrared band, which is the core mechanism for vegetation health monitoring. Hyperspectral sensors provide detailed spectral information through hundreds of continuous narrow bands (bandwidth typically <10 nm), enabling identification of subtle spectral differences that traditional multispectral sensors cannot distinguish, making them particularly suitable for quantitative analysis of different components in complex coastal waters. The spatial resolution of sensors is jointly determined by the instantaneous field of view (IFOV) and platform altitude, while temporal resolution is influenced by orbital parameters and pointing capabilities.
Optical remote-sensing technology, with its rich spectral information and long-term historical data accumulation, has become the primary means for coastal-ecosystem health monitoring. Literature research indicates that optical sensors dominate coastal-monitoring application studies, with the vast majority of relevant research applying optical remote-sensing data.
Multispectral remote-sensing systems such as the Landsat series, Sentinel-2, and MODIS provide continuous monitoring capabilities for coastal ecosystems through their broad spectral ranges and regular revisit times. Sentinel-2 MSI, with its 10–60 m spatial resolution and 13 spectral bands, particularly the red-edge and near-infrared bands, performs excellently in chlorophyll-a estimation, achieving high accuracy with an R 2 value of 0.91 [12]. The Landsat series provides long-term data archives with 30-m spatial resolution, offering valuable resources for historical change detection. Although MODIS has lower spatial resolution (250–1000 m), its daily observation capability makes it an important tool for large-scale coastal water-quality dynamic monitoring.
Hyperspectral remote-sensing systems demonstrate unique advantages in complex coastal environments due to their more refined spectral resolution. Sensors such as AVIRIS possess hundreds of continuous narrow bands, achieving R 2 values up to 0.98 in chlorophyll-a estimation in estuarine systems [20]. The fine spectral resolution of hyperspectral systems enables the differentiation of similar features and complex water components, performing exceptionally well in optically complex coastal waters where colored dissolved organic matter (CDOM) and chlorophyll-a coexist. For example, in the Chilika Lagoon study, AVIRIS-NG achieved a root mean square error of 2.66 mg/m³ for chlorophyll-a through spectral matching techniques [21], demonstrating the adaptability of hyperspectral systems in complex coastal environments.
Optical sensors mounted on unmanned aerial vehicles (UAVs) are becoming important complementary tools for coastal-ecosystem monitoring. Their advantages lie in flexible deployment, ability to operate below cloud layers, and provision of ultra-high spatial resolution at the centimeter level. In the Saemangeum seawall study in Korea, the RedEdge multispectral UAV system achieved an R 2 of 0.887 for chlorophyll-a [22]. In coastal research in Qingdao, China, bio-optical modeling based on UAV hyperspectral systems significantly improved the accuracy of chlorophyll-a estimation in turbid waters [23]. Performance evaluations show that multispectral UAVs achieve R 2 values ranging from 0.43 to 0.94 in chlorophyll-a estimation and up to 0.87 in suspended solids monitoring [16].
To improve the application effectiveness of optical remote sensing in coastal-ecosystem monitoring, researchers have developed various optimization strategies. Improved atmospheric correction methods have significantly enhanced the accuracy of water-quality parameter estimation in coastal waters [24]. Spatiotemporal fusion models such as U-STFM can downscale MODIS chlorophyll products from 1 km to 30 m resolution, achieving an R 2 of 0.88 [17]. In terms of algorithm development, machine-learning methods like random forest typically outperform traditional empirical algorithms, demonstrating higher accuracy and stability in water-quality parameter estimation [25]. These technological advances provide more reliable data support for water-quality monitoring and vegetation analysis in complex coastal environments, greatly enhancing the practical value of remote-sensing applications.
The application of optical remote sensing in coastal-ecosystem health assessment is evolving from single sensors and simple indices toward multi-source fusion and intelligent algorithms. Multi-temporal and multi-scale analyses can identify environmental change patterns and trends, while the synergistic fusion of optical remote sensing with other data sources (such as SAR and thermal infrared) has become a research focus [18]. The development of specialized algorithms and indices for specific ecosystem types has further improved parameter retrieval accuracy, providing strong technical support for coastal-ecosystem health monitoring.

2.2. Radar Remote-Sensing Technology and Applications

Radar remote-sensing technology, especially synthetic aperture radar (SAR), demonstrates unique advantages in coastal-ecosystem monitoring due to its all-weather, all-time imaging capabilities and cloud penetration ability.
SAR systems achieve imaging by actively transmitting microwave signals and receiving backscattered signals from the Earth’s surface, with working mechanisms fundamentally different from optical sensors. The backscattering intensity of microwave signals is primarily influenced by surface roughness, dielectric constant, and geometric structure: smooth water surfaces produce specular reflection leading to low backscattering, while rough land surfaces generate strong scattering signals, forming the physical basis for water–land separation. Polarimetric SAR obtains four polarization combinations (HH, HV, VH, VV) by transmitting and receiving microwave signals in different polarization directions (horizontal H and vertical V), with different polarizations showing varying sensitivities to vegetation structure: HH polarization primarily reflects surface scattering, VV polarization is sensitive to volume scattering, while cross-polarizations (HV, VH) mainly originate from volume scattering within vegetation canopies. The coherent characteristics of SAR enable interferometric measurements, where millimeter-level surface deformation can be detected by analyzing phase differences between SAR images of the same area acquired at different times. Wavelength selection significantly impacts monitoring capabilities: X-band (3 cm) is suitable for surface feature monitoring, C-band (6 cm) balances penetration and resolution, while L-band (24 cm) possesses stronger vegetation penetration capability, making it suitable for forest structure analysis.
SAR systems listed in Table 1, such as Sentinel-1 and ALOS PALSAR, provide all-weather observation capabilities not available with optical remote sensing.
SAR systems can be classified into various types based on band and polarization characteristics. Conventional SAR systems utilize C-band, L-band, or X-band frequencies for all-weather monitoring and can penetrate vegetation for structural analysis. Polarimetric SAR (PolSAR) enhances target discrimination capabilities through multi-polarization imaging (HH, HV, VV, VH), particularly suitable for vegetation classification and biomass estimation. Interferometric SAR (InSAR) focuses on surface elevation measurement, playing important roles in topographic mapping and subsidence monitoring. Major SAR satellite platforms include Sentinel-1, TerraSAR-X, RADARSAT-2, and ALOS PALSAR, operating at different bands and resolutions, as used in the multi-platform combination in Bartsch et al. [15]’s research. L-band SAR (such as ALOS PALSAR), with its longer wavelength, has advantages in penetrating vegetation canopies, making it particularly suitable for mangrove and wetland studies.
SAR technology is widely applied in coastal-ecosystem monitoring. In the field of coastline change detection, Mazzolini et al. [26] achieved an average accuracy of 12.63 m using an iterative detection method with superpixel segmentation and Otsu algorithm. In intertidal topography mapping research, the improved waterline method proposed by Salameh et al. [27] demonstrated only 19–25 cm errors compared to LiDAR. For wetland and mangrove monitoring, Bian et al. [28] achieved an overall accuracy of 89.79% with a Kappa coefficient of 0.858 in wetland vegetation classification through time-series SAR coherence and intensity analysis. In mangrove damage assessment, the unsupervised logarithmic ratio change detection method developed by Segales et al. [29] achieved 92% detection accuracy for VV polarization data. In water-quality and pollution monitoring, El-Magd et al. [30] successfully identified more than 20 oil pollution incidents in the Suez Canal region over five years using Sentinel-1 SAR oil pollution detection technology, demonstrating the unique advantages and practical application value of SAR technology in environmental pollution monitoring.
SAR data-processing and analysis methods continue to evolve. Traditional processing methods mainly include speckle filtering, geometric correction, and polarization decomposition, but recent research tends toward advanced algorithms and machine-learning methods. Mazzolini et al. [26]’s iterative detection method achieved an average accuracy of 12.63 m in coastline detection, while the unsupervised time-series analysis developed by Haarpaintner and Davids [31] achieved 93% accuracy in low water line detection. Deep-learning applications in SAR data analysis are increasing, with Vásquez-Salazar et al. [32]’s deep-learning despeckle and Otsu method achieving 99% classification accuracy in coastal erosion and accretion detection. Time-series analysis has become an important direction for SAR data processing, with Segales et al. [29] achieving 92% overall accuracy in mangrove damage assessment using cumulative sum analysis.
Fusion of SAR with other data sources is an important approach to enhance monitoring capabilities. The combination of SAR and optical data is most common, as demonstrated by Lamb et al. [33], who achieved over 89% accuracy in wetland mapping by integrating Sentinel-1 SAR with Landsat 8 optical imagery, and Zollini et al. [34], whose method of combining SAR and optical data enabled sub-pixel accuracy in optical images. The integration of SAR with LiDAR data has enhanced the capability to characterize terrain and vegetation structure, while the coordinated use of multiple SAR sensor platforms has also shown advantages, such as Wang et al. [35] achieving accuracy between 81.02% and 88.87% in detecting exposed intertidal organisms using a combination of three SAR platforms. For different application scenarios, the choice of fusion methods varies, requiring targeted design based on research objectives, data availability, and regional characteristics to achieve optimal monitoring results and analytical precision.

2.3. Multi-Source Data-Fusion Technologies

Multi-source remote-sensing data-fusion technology has significant value in coastal-ecosystem monitoring, providing more comprehensive ecosystem information by combining the advantages of different platforms. Research shows that integrating optical, radar, and thermal infrared data can improve land cover classification and provide a holistic view of coastal dynamics.
The fusion of optical and radar data is the most common combination, significantly enhancing coastal environment monitoring capabilities. Lamb et al. [33] fused Sentinel-1 SAR with Landsat 8 optical imagery for wetland and deepwater mapping along the United States Mid-Atlantic and Gulf Coast, demonstrating the effectiveness of such fusion methods. Li et al. [36] integrated Sentinel-1 SAR, Sentinel-2 multispectral images, and AW3D30 DSM data to achieve monthly river network mapping of the Yellow River Basin at 10-m resolution. This method effectively captures the dynamic changes of small rivers, with the extracted total river network length being 3.2 times that of existing global datasets. Dehouck et al. [37] synergistically used optical and radar data in their study of Arcachon Lagoon, France, successfully improving the mapping accuracy of intertidal flats and coastal salt marshes. However, this type of fusion faces challenges of data integration complexity and different resolutions, requiring specialized processing techniques.
The combination of optical and thermal infrared data enables comprehensive ecosystem health assessment and improved water-quality monitoring. This combination is particularly suitable for detecting thermal anomalies and assessing ecosystem stress, as demonstrated by Ferrara et al. [38] who used thermal infrared imagery for hierarchical monitoring of terrestrial discharges into coastal waters near Naples, Italy. While this fusion typically has moderate costs with data often available from the same satellite, it still faces technical challenges such as temporal alignment and resolution differences.
The integration of radar and LiDAR data provides detailed three-dimensional vegetation structure and improved biomass estimation. Allen et al. [39] combined SAR time-series imagery and LiDAR data for coastal wetland mapping in the Alligator River National Wildlife Refuge, North Carolina, showcasing the advantages of this approach. However, such combinations usually require high-level data-processing capabilities, have limited LiDAR data availability, and higher costs.
Multi-sensor comprehensive integration methods (optical + radar + thermal infrared) provide the most complete ecosystem monitoring capabilities, showing strong adaptability to various environmental conditions. Gade et al. [40] employed a multi-sensor approach to monitor water dynamics in the northwestern Mediterranean Sea, demonstrating the value of integrated data sources. Dąbrowska-Zielińska et al. [41] combined ALOS PALSAR (L-band, HV) with optical data to monitor Biebrza Wetlands in northeast Poland, proving the effectiveness of this comprehensive approach. While this comprehensive fusion has high initial costs, it may be cost-effective for comprehensive monitoring, though it requires resolving complex data integration issues and higher expertise.
Despite numerous challenges facing multi-source data-fusion technology, including data format differences, integration complexity, high expertise requirements, and cost issues, its synergistic advantages are significant. With technological advances and methodological innovations, multi-source data fusion is becoming an important development direction for coastal-ecosystem monitoring, providing researchers with more comprehensive and accurate information on coastal-ecosystem health.

3. Data-Processing and Analysis Methods

3.1. Traditional Methods and Indices

Traditional remote-sensing analysis methods, centered on spectral indices and classical image-processing techniques, have established the foundational framework for coastal-ecosystem monitoring.
Water extraction indices serve as the most fundamental analytical tools. The Normalized Difference Water Index (NDWI) utilizes spectral differences between near-infrared and green bands to achieve water–land separation, while the Modified Normalized Difference Water Index (MNDWI), through substitution with shortwave infrared bands, achieves 1:50,000 accuracy standards in coastline mapping [42].
Vegetation monitoring indices play important roles in coastal environment assessment. The Normalized Difference Vegetation Index (NDVI), Soil-Adjusted Vegetation Index (SAVI), and Enhanced Vegetation Index (EVI) are widely applied in seagrass and algae detection. For aquatic environments, specialized indices such as the Water-Adjusted Vegetation Index (WAVI) demonstrate better applicability [43].
Water-quality parameter estimation primarily relies on band ratio methods, including blue/green, red/near-infrared ratios, and the Normalized Difference Chlorophyll Index (NDCI). Combined methods provide reliable results in chlorophyll-a prediction for turbid coastal waters globally. Preprocessing and classification methods include NIR-SWIR atmospheric correction methods that significantly improve reflectance retrieval quality in coastal waters, while the combination of NDWI and K-means clustering proves most effective in coastline extraction.Traditional methods possess advantages of simple computation and efficient processing, but exhibit limitations of high sensitivity and limited adaptability in complex aquatic environments, which has driven the evolutionary development toward modern intelligent technologies.

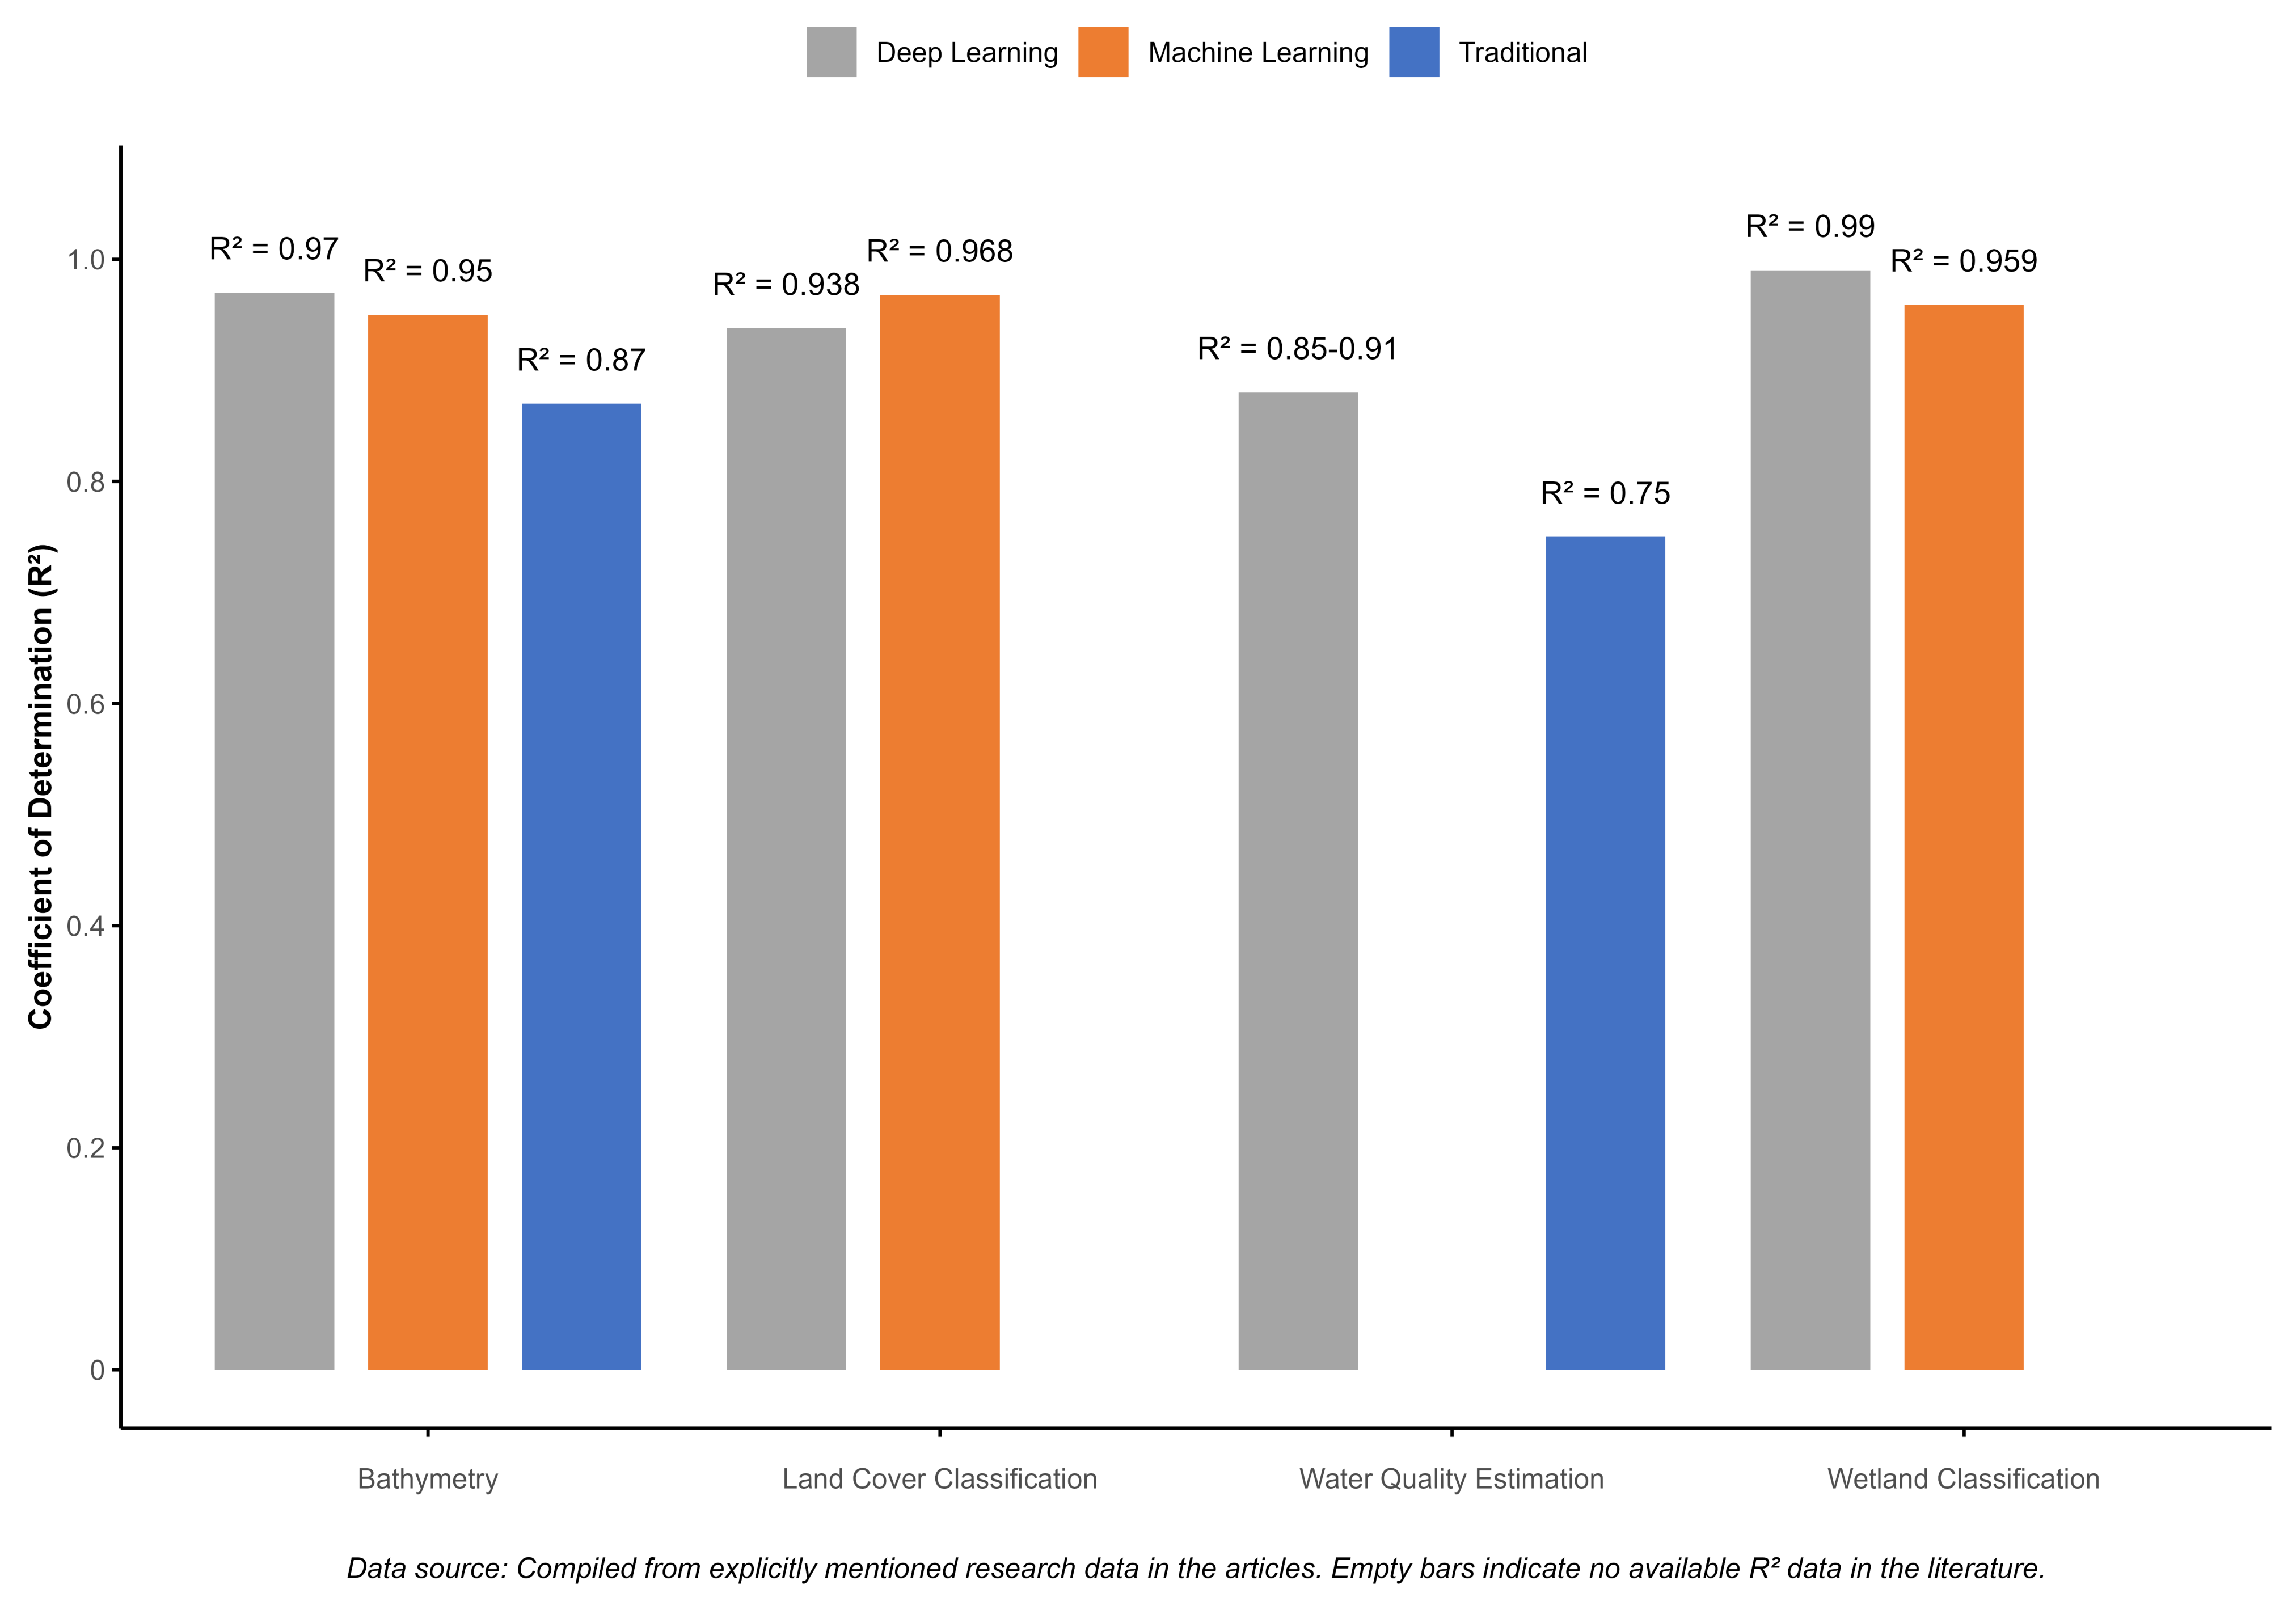
3.2. Machine-Learning and Deep-Learning Applications

Machine-learning and deep-learning technologies provide powerful tools for processing complex coastal remote-sensing data, capable of capturing nonlinear relationships and complex patterns that traditional methods struggle to identify.
Machine-learning applications in coastal remote sensing follow standard data mining workflows but require specialized optimization for remote-sensing data characteristics. The data preprocessing stage includes atmospheric correction, geometric correction, and radiometric standardization, ensuring comparability across data from different times and sensors. Feature engineering is a critical component that extends beyond original spectral bands to include vegetation indices (such as NDVI, EVI), water indices (such as NDWI, MNDWI), texture features (mean, variance, entropy based on gray-level co-occurrence matrices), and geometric features (shape indices, edge density). Training sample selection and quality control directly impact model performance: samples must be representative, balanced, and pure, typically employing stratified random sampling to ensure adequate representation of all categories.
Random forest algorithms excel in handling high-dimensional data and mixed data types, with their decision tree ensemble mechanism effectively processing noise and outliers in remote-sensing data. Support vector machines transform nonlinearly separable problems into linear problems in high-dimensional space through kernel functions, particularly suitable for handling nonlinear relationships in spectral features. Deep-learning methods such as convolutional neural networks (CNNs) automatically extract spatial features through multiple layers of convolution and pooling operations, with convolutional kernels capturing spatial patterns at different scales while pooling operations provide translation invariance. Model training employs backpropagation algorithms to optimize weight parameters, with loss function selection (cross-entropy, mean squared error, etc.) determined by specific tasks. Model validation typically uses cross-validation or independent test set methods, with accuracy assessment metrics including overall accuracy, Kappa coefficient, user accuracy, and producer accuracy.
Machine-learning methods have found extensive application in coastal remote sensing. Random forest algorithms, due to their anti-overfitting capabilities and variable importance assessment functions, perform excellently in coastal monitoring, with Agate et al. [44] achieving over 90% accuracy in marsh extent monitoring. Support vector machines (SVM) also demonstrate outstanding performance in coastal land cover classification, achieving overall accuracy of 97.6% [45]. Gaussian process regression shows significant advantages in water depth measurement, with R 2 values reaching 0.97 [46].
Deep-learning technologies demonstrate unique advantages in complex coastal environment analysis. Convolutional neural networks (CNN) achieve 93.78% accuracy in coastal land cover classification [47]. U-Net combined with ResNet50 architecture attains 93.65% overall accuracy in coastal zone classification [48]. For specific applications, the combination of CNN and Long Short-Term Memory networks (LSTM) achieves 91% overall accuracy in harmful algal bloom detection [49].
To systematically understand the characteristics and applicability of different algorithms, Table 2 compares the performance of various machine-learning and deep-learning algorithms in coastal remote-sensing applications, providing detailed analysis of their application scenarios, accuracy evaluations, data requirements, main advantages, limitations, and typical research cases.
Performance comparison analysis demonstrates that advanced methods outperform traditional methods across multiple application scenarios. To intuitively illustrate this advantage, Figure 2 compares the accuracy performance of traditional methods, machine-learning methods, and deep-learning methods in different coastal remote-sensing application scenarios. The figure clearly shows that in key application scenarios such as land cover classification, water-quality parameter estimation, bathymetry, and wetland classification, machine-learning methods and deep-learning methods generally achieve higher accuracy or determination coefficients than traditional methods. Particularly in bathymetry, the R 2 value (0.97) achieved by Ashphaq et al. [46] using deep-learning methods is significantly higher than traditional methods (0.87), while in wetland classification, deep-learning methods achieve accuracy rates as high as 99%. These quantitative comparison results further confirm the value of advanced data analysis methods in coastal remote-sensing applications.
Machine-learning methods typically perform stably with limited data, while deep learning shows clear advantages when processing large amounts of complex data.
Algorithm selection guidelines are key to improving application effectiveness. Data volume is the primary consideration: when training samples are fewer than 1000, support vector machines and random forests typically perform more stably; when sample sizes exceed 10,000, deep-learning methods show clear advantages. Regarding application scenarios, classification tasks favor random forests or CNNs, while regression predictions (such as bathymetry, water-quality parameters) recommend Gaussian process regression or deep neural networks. Under computational resource constraints, random forests provide the best accuracy-efficiency balance; with sufficient resources, ensemble learning methods can achieve the highest accuracy. Data feature complexity is also an important factor: applications with simple spectral features suit traditional machine learning, while high-resolution images with complex texture and spatial relationships are better suited for convolutional neural networks.
Application challenges and development aspects include the acquisition of high-quality training data as a key limiting factor, particularly for deep-learning applications requiring balanced sample distribution and sufficient labeled data. Multi-source data integration needs to address format, resolution, and temporal consistency issues, with standardized preprocessing workflows being fundamental to ensuring fusion effectiveness. Computational resource requirements increase with method complexity, with cloud platforms like Google Earth Engine providing new solutions to this problem. Model generalization capability presents another challenge, as regionally specific trained models often cannot be directly applied to other areas, requiring support from techniques like transfer learning.
Overall, machine-learning and deep-learning technologies have significantly improved the accuracy and automation level of coastal remote-sensing analysis, particularly in complex scenarios where traditional methods perform poorly. Appropriate algorithm selection and parameter optimization are key to successful application, requiring comprehensive consideration of specific application requirements, data characteristics, and resource conditions.

3.3. Scale Effects and Data Fusion

Coastal-ecosystem remote-sensing monitoring faces complex scale effects, and data-fusion technologies provide effective solutions for overcoming limitations of single data sources.
Types of scale effects primarily include spatial, temporal, spectral, and radiometric dimensions. In terms of spatial scale, fine-scale analysis of intertidal habitats requires extremely high resolution of 3–31 cm, while regional change trend analysis requires lower resolution but larger coverage data [8]. Temporal scale effects are manifested in seasonal variation detection of chlorophyll-a concentrations, requiring matched observation frequencies [57]. Spectral scale plays a crucial role in distinguishing similar coastal habitats, with blue, green, and near-infrared wavelengths being particularly important for seagrass and algae detection [43].
Data-fusion strategies enhance monitoring capabilities by integrating advantages of different sensors. Optical and SAR data fusion is the most common combination, overcoming cloud coverage limitations and enhancing structural information extraction capabilities. Lamb et al. [33] achieved over 89% accuracy in wetland mapping by fusing Sentinel-1 SAR with Landsat 8. Multi-temporal data fusion addresses limitations of single-date observations, with time-series analysis distinguishing seasonal changes from long-term trends. Multi-resolution fusion techniques combine high spatial resolution with high temporal resolution data, such as the U-STFM model developed by Guo et al. [17], which downscaled MODIS chlorophyll products from 1 km to 30 m with R 2 reaching 0.88.
Technical aspects of fusion methods include preprocessing standardization, feature extraction and selection, and fusion-algorithm design. The preprocessing stage requires unified projection coordinate systems, resampling to consistent resolution, and radiometric correction to ensure data comparability. Feature extraction should combine multi-dimensional information including spectral, texture, and shape features while avoiding information redundancy and the curse of dimensionality. For fusion algorithms, pixel-level fusion suits homogeneous sensor data, feature-level fusion suits heterogeneous data sources, and decision-level fusion suits complex environments with high uncertainty. Weight allocation is a critical technical detail, requiring determination of optimal weight combinations based on signal-to-noise ratios, spatial resolution, and application relevance of different sensors.
Ecosystem-specific applications show that different coastal environments require targeted scale considerations. In mangrove research, multi-scale approaches are most effective, combining the regional coverage advantages of satellite data with the fine identification capabilities of UAV data to achieve comprehensive analysis from ecosystem level to individual level. Salt marsh research emphasizes the importance of microtopography, with Donatelli et al. [58] demonstrating that small-scale topographic changes significantly affect hydrological processes, requiring support from high-precision topographic data such as LiDAR. Coastal water-quality monitoring typically uses large-scale information provided by satellite remote sensing combined with field measurements for validation and calibration, with multi-sensor fusion improving estimation accuracy of water-quality parameters in turbid waters.
Major challenges and solutions include data coordination complexity, increased computational resource requirements, and difficulties in validation strategy design. The sub-pixel waterline extraction method by Bishop-Taylor et al. [59] outperforms traditional full-pixel methods, providing insights for solving mixed pixel problems. Cost-benefit analysis shows that utilizing open satellite data and cloud computing platforms is an effective way to reduce costs.
The development of scale integration and data-fusion technologies provides more comprehensive solutions for coastal-ecosystem monitoring. By understanding scale effects and applying appropriate fusion techniques, monitoring accuracy can be significantly improved, providing more reliable scientific basis for coastal management.

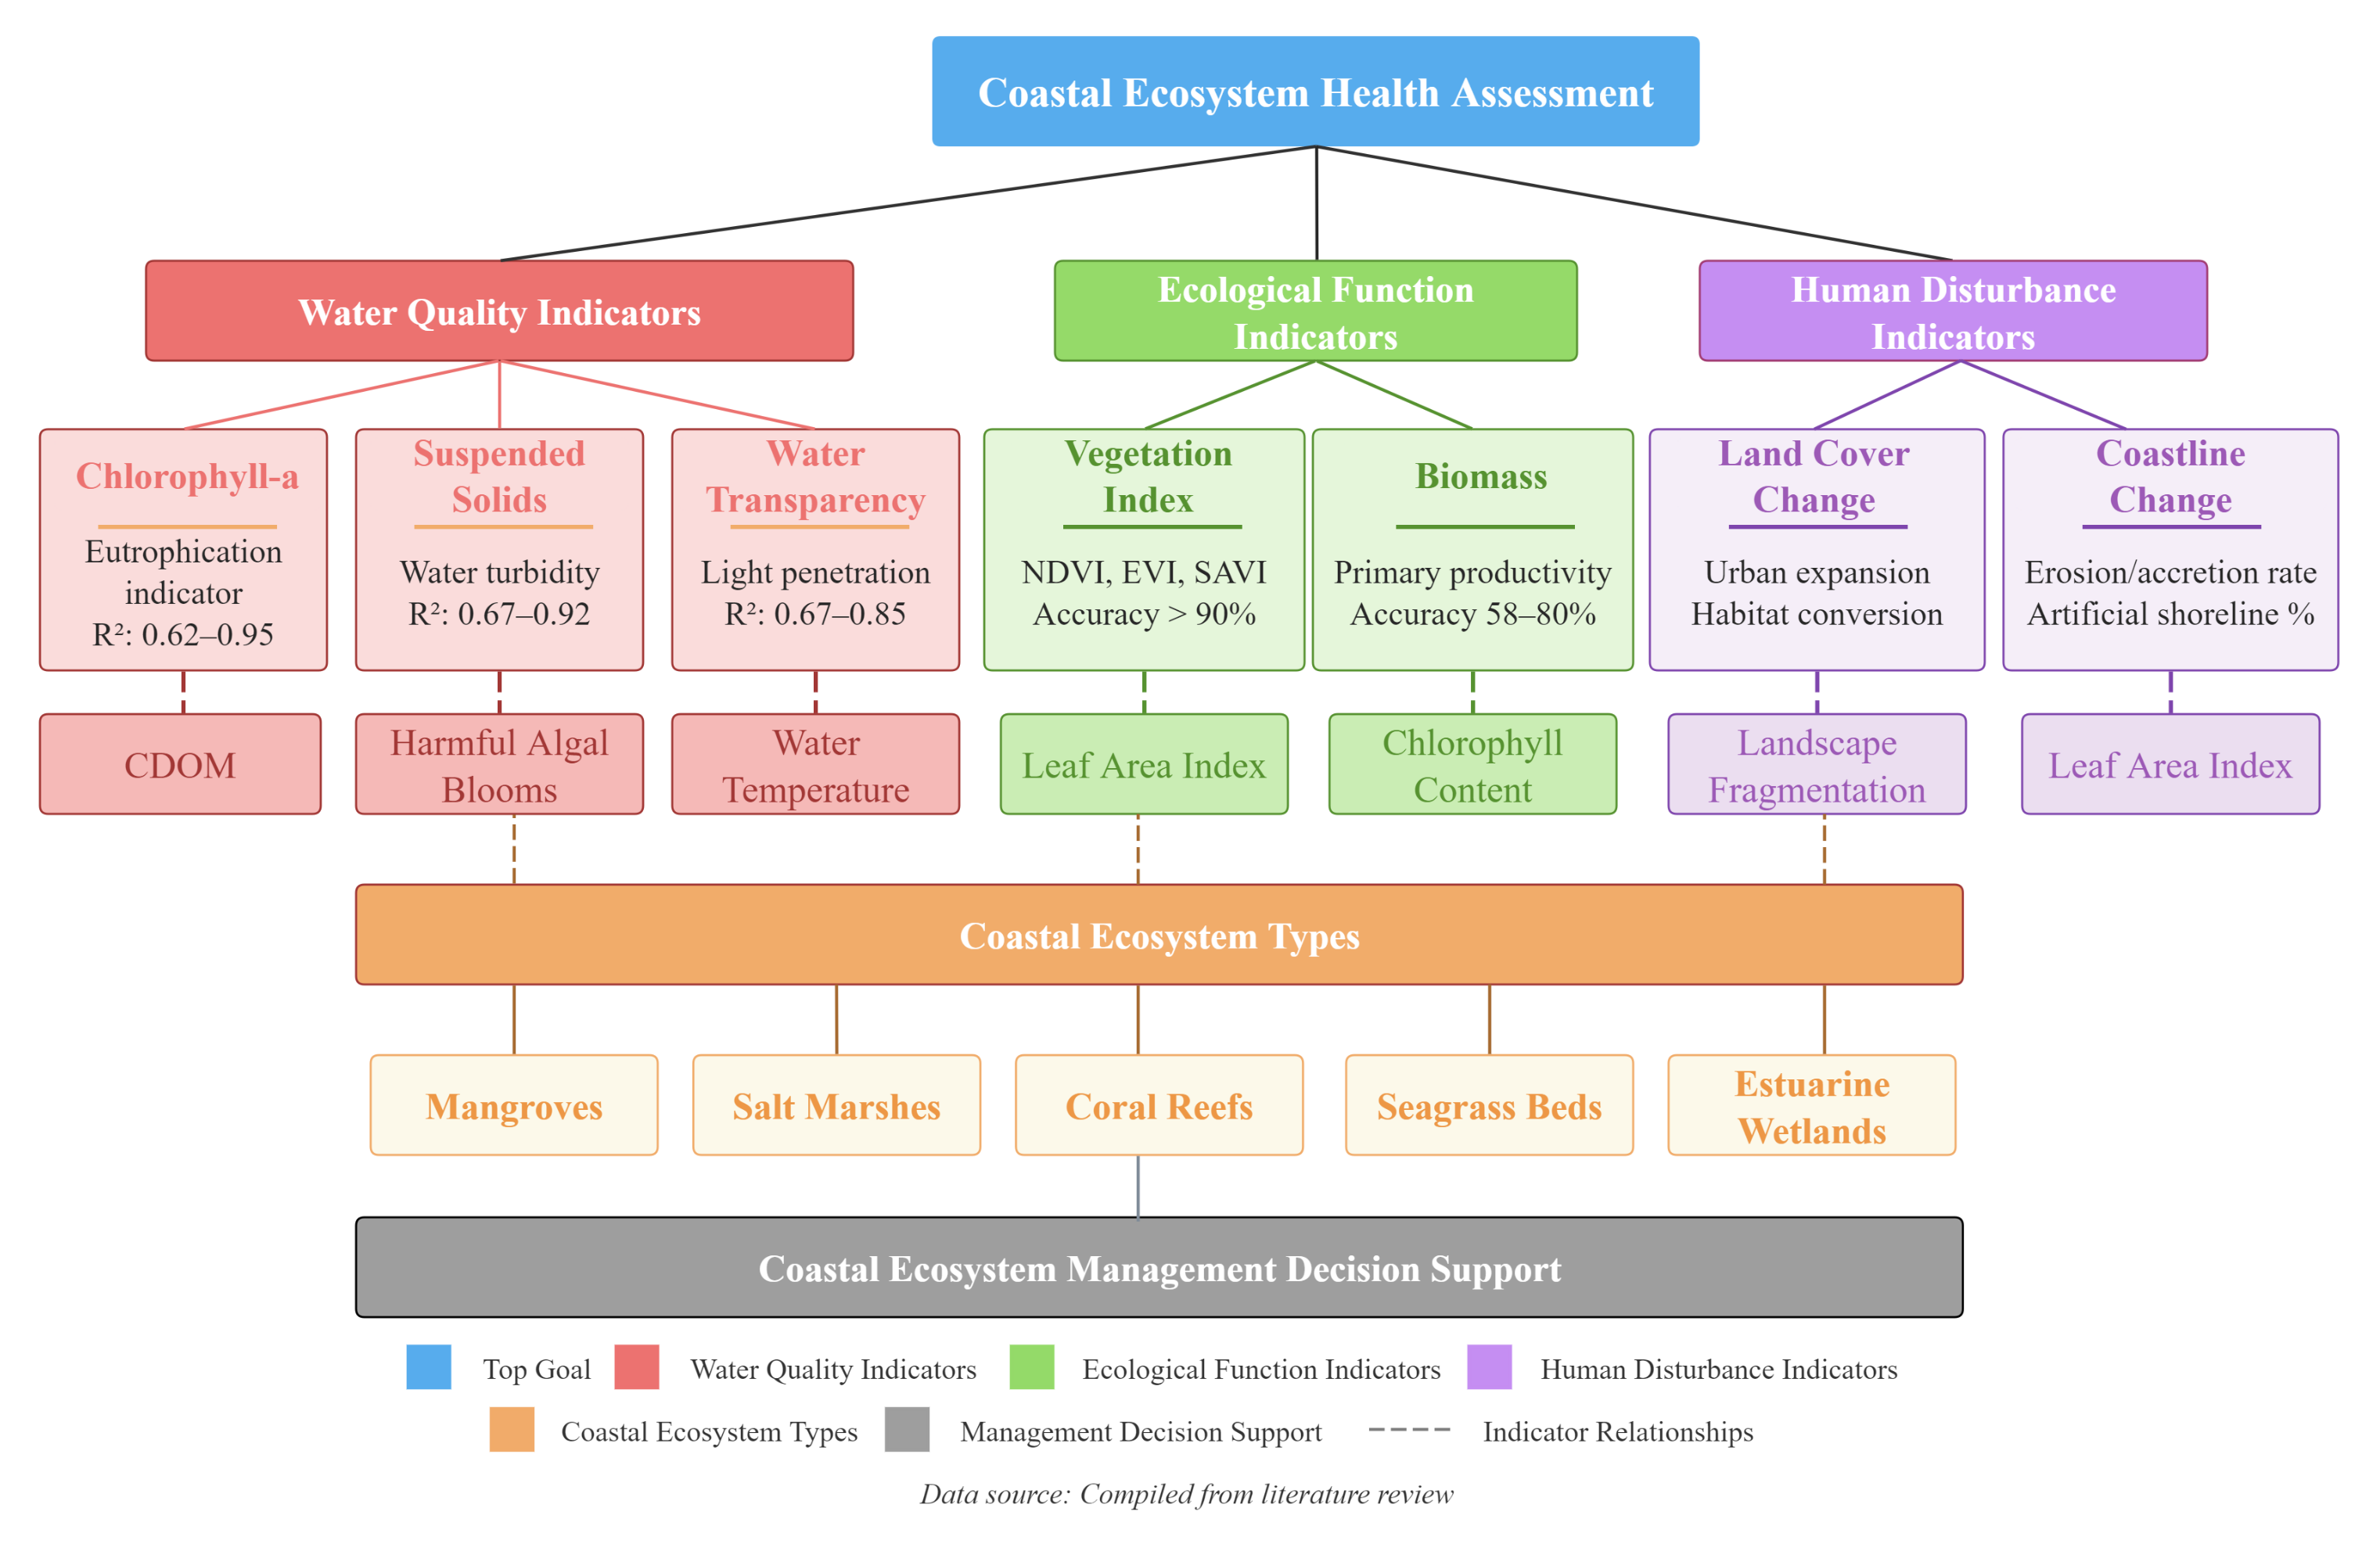
4. Coastal-Ecosystem Health Assessment Indicator System

This study constructs a comprehensive coastal-ecosystem health-assessment indicator system encompassing three major categories: water-quality indicators, vegetation and ecosystem function indicators, and human disturbance and landscape change indicators. Table 3 systematically summarizes the calculation methods, application accuracy, applicable ecosystems, and advantages and limitations of these indicators.
To more intuitively demonstrate the structure of this indicator system and the interrelationships among various indicators, Figure 3 presents how water environment quality indicators, ecological function indicators, and human disturbance indicators interact with each other and are jointly applied to health assessment of different types of coastal ecosystems.

4.1. Water-Quality Parameter Indicators

Water-quality indicators are key parameters for assessing coastal-ecosystem health status, primarily including three core indicators: chlorophyll-a, suspended solids, and water transparency, which can effectively reflect eutrophication status, water turbidity, and light conditions in coastal waters.
Chlorophyll-a is the most widely applied water-quality monitoring indicator. Its remote-sensing estimation is primarily achieved through three methods: band ratio methods, fluorescence line height (FLH), and machine-learning models. Band ratio methods are divided according to water body types into blue/green ratios (suitable for clear to moderately turbid waters) and red/near-infrared ratios (suitable for turbid or high chlorophyll-a environments). Research shows that the FLH method improves effectiveness in complex coastal waters by 106% compared to standard blue-green ratio algorithms [60].
MODIS, Sentinel-2, Sentinel-3, and Landsat are the most commonly used sensors for chlorophyll-a monitoring, with MODIS and Sentinel satellites being most widely used. The accuracy ( R 2 ) of chlorophyll-a remote-sensing estimation ranges from 0.62 to 0.95, significantly higher than other water-quality parameters. Region-specific algorithms can substantially improve chlorophyll-a estimation accuracy, such as the targeted green-red band algorithm that significantly improved chlorophyll-a estimation in coastal waters [61].
Suspended solids indicators are an important component of coastal water-quality monitoring, including total suspended matter (TSM), suspended particulate matter (SPM), and total suspended solids (TSS). Remote-sensing estimation of suspended solids primarily relies on red and near-infrared bands, which are particularly sensitive to the optical properties of suspended materials. Main methods include single-band or band ratio approaches, semi-analytical algorithms, and machine-learning-based models. The semi-analytical algorithm developed by Han et al. [62] is applicable to a wide range of water conditions from clear to highly turbid, while the multi-conditional algorithm proposed by Novoa et al. [63] can automatically select optimal estimation models based on different turbidity ranges. The coefficient of determination ( R 2 ) for suspended solids remote-sensing estimation ranges from 0.67–0.924, with a root mean square error (RMSE) between 3.93–12.7 mg/L. Research shows that semi-analytical algorithms outperform purely empirical methods in retrieving suspended sediments from both hyperspectral and multispectral data [64].
Water transparency is an important indicator for assessing the ability of light to penetrate water bodies, affecting photosynthesis and primary productivity in underwater ecosystems. Transparency is typically characterized through direct indicators (such as Secchi disk depth) or indirect indicators (such as turbidity). Remote-sensing estimation of water transparency employs two approaches: directly estimating Secchi disk depth from remote-sensing reflectance data, or indirectly deriving it through chlorophyll-a and suspended solids estimation results.
Through systematic review and analysis of relevant literature, single-band or band ratio methods can achieve accuracy with R 2 of 0.67–0.82, while integrated models can achieve R 2 of 0.82–0.85. Water transparency indicators have relatively lower accuracy among all water-quality parameters, primarily limited by their indirect measurement nature and characteristics of being influenced by multiple factors. However, as a comprehensive indicator of ecosystem function, transparency has important value for assessing light conditions and primary productivity in coastal waters.
Comprehensive application of multiple water-quality indicators provides more comprehensive assessment of coastal-ecosystem health than single indicators. The interaction between chlorophyll-a and suspended solids is key to understanding complex coastal waters: high suspended sediment concentrations can mask chlorophyll-a signals, while chlorophyll-a concentrations also affect water transparency. Over the past decade, coastal water-quality monitoring has shifted from single-parameter assessment to integrated approaches using multi-sensor data. Machine-learning-derived estimates, multi-sensor fusion products, and hyperspectral indices are widely used to supplement traditional indicators. Cavalli [65] found that water constituent concentrations affect model selection, with locally developed models for specific regions typically having smaller errors than generic models.
Main challenges in water-quality indicator monitoring include: signal interference caused by water optical complexity, complexity of atmospheric correction in coastal areas, effects of land adjacency, and limited availability of in situ data. With the application of new-generation high-resolution sensors (such as Sentinel-3 OLCI), monitoring capabilities for regional and seasonal water-quality changes have significantly improved. Multi-sensor fusion and adaptive algorithms are becoming effective approaches to overcome limitations of single sensors and single algorithms.

4.2. Vegetation and Ecosystem Function Indicators

Vegetation and ecosystem function indicators provide critical information for coastal-ecosystem health assessment, reflecting biomass, productivity, and ecosystem response capacity to disturbances. These indicators demonstrate high effectiveness across different ecosystems including coastal wetlands, mangroves, salt marshes, and seagrass beds.
Vegetation indices are the most fundamental indicators for coastal vegetation monitoring. The normalized difference vegetation index (NDVI) is the most widely applied coastal vegetation monitoring indicator. NDVI achieves detection accuracy exceeding 90% in wetlands, salt marshes, and mangrove forests [66], demonstrating broad applicability. However, NDVI is prone to saturation in dense vegetation and is relatively sensitive to soil background.
The Soil-Adjusted Vegetation Index (SAVI) compensates for soil background effects, achieving 88.24% overall accuracy in coastal environments. The Enhanced Vegetation Index (EVI) shows strong correlation with gross primary productivity (GPP), with a coefficient of determination ( R 2 ) reaching 0.65 in coastal wetlands [67]. Compared to NDVI, EVI is less prone to saturation in dense vegetation. Specialized indices developed for specific coastal ecosystems, such as the Normalized Difference Red Edge Index 2 (NDRE2) and Water-Adjusted Vegetation Index (WAVI), show advantages in mangrove and intertidal vegetation monitoring, respectively.
Biomass and structural parameters are important indicators for assessing ecosystem carbon sequestration capacity. NDVI-based biomass estimation achieves 58–80% accuracy in salt marsh environments but is prone to saturation in high biomass areas. Leaf Area Index (LAI) remote-sensing estimation in tidal salt marshes achieves a coefficient of determination ( R 2 ) of 0.539 with normalized root mean square error (NRMSE) of 0.32 [68].
Ecosystem function assessment can reflect ecosystem health status and environmental responses. EVI shows strong correlation with gross primary productivity measured by eddy covariance (GP P EC ), explaining 65% of GPP variation in coastal wetlands [67], outperforming NDVI. Similarly, in marsh ecosystem research, Yan et al. investigated the impact of climate change on net primary productivity (NPP) changes in the Sanjiang Plain marsh region, finding that temperature contributed most to NPP changes, followed by C O 2 concentration. The study also emphasized the importance of interactions between climate factors, revealing that these interactions often have stronger explanatory power for NPP spatial distribution than single factors, providing an important foundation for comprehensive understanding of wetland ecosystem health.
Remote-sensing estimation of chlorophyll content (Cab) achieves moderate accuracy in tidal salt marshes ( R 2 = 0.488, NRMSE = 0.28), significantly affected by tidal effects [68]. The fraction of absorbed photosynthetically active radiation (fPAR) is directly related to ecosystem productivity, providing important information for vegetation functional state assessment. Specific indices such as WorldView Water Index (WV-WI) and Red Edge-Simple Ratio (RE-SR) perform excellently in coastal wetland restoration monitoring [69], providing detailed evidence of coastal-ecosystem changes.
Disturbance response monitoring is an important aspect of ecosystem health assessment. Remote-sensing indicators can effectively monitor coastal ecosystems’ responses to disturbances. Multi-temporal NDVI was used to assess Louisiana coastal vegetation response to hurricanes, identifying significant decline in vegetation density and vigor in 33% of the study area. Near-infrared/green spectral ratios are effective in detecting salt marsh dieback onset and progression [70], capable of classifying marsh areas into healthy, intermediate, and dead categories, providing important information for early intervention.
Long-term change monitoring shows that multi-temporal Landsat imagery can track coastal-ecosystem change trends over decades [71], identifying cycles of vegetation health decline and recovery. Centennial-scale analysis reveals long-term trends in salt marsh vegetation cover, such as the 50% increase in vegetation cover from 1970 to 2022 studied by Salcedo et al. [72], providing valuable historical context for understanding natural evolution and human intervention effects in coastal ecosystems.
Different coastal ecosystem types require targeted combinations of monitoring methods. High-resolution multispectral imagery combined with vegetation indices shows high effectiveness in mangrove monitoring; multi-temporal analysis performs excellently in tracking long-term salt marsh changes; SAR data combined with multi-temporal analysis can effectively quantify intertidal changes, but tidal stage effects must be considered. The development of modern remote-sensing technology provides increasingly powerful tool support for coastal-ecosystem health assessment.

4.3. Human Disturbance and Landscape Change Indicators

Human disturbance and landscape change indicators provide important information for assessing the degree of human activity interference with coastal ecosystems by quantifying urbanization, land-use conversion, and coastal development impacts. These indicators constitute a complete system for assessing human disturbance, comprehensively reflecting the impact intensity of human activities.
Land cover and land-use change is the most direct indicator for assessing human disturbance. Multi-temporal analysis utilizes multispectral satellite imagery, particularly the Landsat series, to provide long-term time-series data for capturing urban expansion, coastal erosion, and habitat conversion. Classification methods include supervised classification, unsupervised classification, and object-based classification. Ballanti et al. [73] demonstrated that object-based methods combined with hierarchical classification can more precisely identify complex landscape elements in coastal wetlands. Empirical studies show that artificial area growth rates in some coastal regions reach as high as 138.70%, with new land areas formed through land reclamation reaching 900 km2 in certain cases, with these large-scale landscape transformations mainly occurring in densely populated areas.
Coastline change is an important indicator for assessing coastal dynamics and anthropogenic impacts. Combined use of multi-temporal satellite imagery and aerial photographs can effectively track coastline dynamics. Callaghan et al. [74] used Landsat satellite imagery and aerial photographs to assess coastal erosion in South Africa’s False Bay, demonstrating the importance of long-term monitoring. Coastline change analysis is primarily achieved through the digital shoreline analysis system (DSAS), measuring erosion or accretion rates. Ayalke et al. [75] combined NDVI and tasseled cap transformation to analyze the impact of coastal structures on Turkish coastline changes. In development-concentrated areas, land reclamation and artificial coastline construction significantly alter original coastal morphology, affecting hydrological characteristics of coastal ecosystems.
Landscape fragmentation is a key indicator for assessing human disturbance impacts. Remote-sensing data combined with landscape ecological indicators, such as patch density, edge density, and connectivity indices, can quantify spatial pattern changes in ecosystems. Li et al. [76] analyzed landscape changes in coastal bay areas through Landsat imagery analysis, showing that urban expansion leads to significant increases in natural habitat loss and fragmentation. Fragmentation analysis of mangroves and coastal wetlands is particularly important, with research showing that even small-scale disturbances can lead to altered flow patterns, impeded species migration, and degraded ecosystem functions.
Nighttime light data serves as a proxy indicator for human activity intensity, providing a unique perspective for assessing coastal development. Chu et al. [77] combined Landsat with DMSP-OLS nighttime light data to monitor long-term coastline dynamics and human activities in China’s Hangzhou Bay. Nighttime light data are particularly suitable for quantifying spatiotemporal patterns of urban expansion, tourism development, and industrial development, capable of detecting human activities not obvious in daytime optical imagery.
Multi-source data fusion has significant advantages in assessing human disturbance. Niculescu et al. [78] combined Sentinel-1 and Sentinel-2 satellite imagery to assess coastal wetland ecosystem changes in the Danube Delta, demonstrating the potential of combining radar and optical data. Comprehensive indicator systems, including land cover change, landscape indices, and human disturbance intensity, can more comprehensively assess coastal-ecosystem health status.
Remote-sensing technology can not only monitor human disturbance itself but also assess ecosystem responses. Different disturbance types lead to different response patterns: urbanization causes direct habitat loss and enhanced edge effects; agricultural expansion leads to reduced vegetation cover and landscape homogenization; aquaculture development causes mangrove and intertidal zone loss; tourism development affects habitat integrity; pollution from industrial development indirectly affects ecosystem health through changes in water and air quality. High-resolution remote-sensing data can capture these subtle ecosystem responses, providing scientific basis for management and restoration.
Remote-sensing-based human disturbance and landscape change indicators provide important tools for coastal-ecosystem management, not only quantifying the degree and rate of change but also revealing spatial patterns and driving factors, providing scientific support for conservation and sustainable development decisions.

5. Application Cases and Change Analysis

5.1. Typical Ecosystem Health Assessment Cases

Building on the remote-sensing platforms, data-processing methods, and assessment indicator systems discussed in previous sections, this section focuses on the specific applications of these technologies and methods in different types of coastal ecosystems. Since coastal ecosystems such as mangroves, salt marshes, coral reefs, and seagrass beds each have unique physical structures, biological characteristics, and ecological functions, they present different technical requirements and challenges for remote-sensing monitoring. Table 4 systematically summarizes the preferred remote-sensing technologies, key monitoring indicators, achievable monitoring accuracy, main technical challenges, and representative application cases in health assessment of various coastal ecosystems.
Mangrove ecosystem health assessment has become a focus area for remote-sensing applications. Kumar et al. [79] used AVIRIS-NG hyperspectral data (425 bands, 5-m resolution) for classification assessment of Indian mangroves, successfully categorizing 59% of mangrove areas as healthiest status and 11% as less healthy status through comprehensive analysis of multiple vegetation indices (EVI, NDII, PRI, CRI1, VOG1, and MCARI). Bhadra et al. [80] combined Sentinel-2 and Landsat 9 imagery, applying multiple vegetation indices (NDVI, SAVI, OSAVI, and TDVI) for health monitoring of India’s Sundarbans mangroves, finding that freshwater-loving mangroves showed a declining trend while salt-tolerant mangroves showed an increasing trend. Dittmann et al. [87] employed an integrated approach using LiDAR, RGB, and hyperspectral data for health assessment of temperate mangroves affected by extreme high salinity, successfully identifying mangrove mortality areas caused by high salinity. For long-term monitoring, Chen et al. [1] analyzed mangrove changes in Honduras’ Gulf of Fonseca using Landsat data from 1985–2013, combined with the Otsu method and Markov chain model, finding that mangroves in the region showed a net loss of 11.9% and growth of 3.9%.
Research on salt marsh ecosystem health assessment shows that high-resolution satellite imagery and UAV remote sensing have significant advantages in this field. Campbell [81] used sub-meter resolution imagery from Quickbird-2 and WorldView-2 to monitor salt marshes in Jamaica Bay, USA, recording changing rates of salt marsh area across different periods, declining from an annual loss of 13.4 ha during 1989–2003 to 2.1 ha annually during 2003–2013, suggesting that conservation measures may have had positive effects. Lanceman et al. [82] used multispectral UAV imagery (3–12 cm resolution) to monitor wetland restoration processes, recording a significant increase (142%) in salt marsh area within four years, demonstrating the application value of high-resolution UAV remote sensing in small-scale ecological restoration monitoring. Castro et al. [13] conducted a 38-year (1984–2022) change analysis of edge salt marsh coastlines in Portugal’s Aveiro Lagoon using the NDVI threshold method, finding differentiated trends across regions: some areas retreated over 66 m while others advanced about 2 m, demonstrating the spatial heterogeneity of dynamic salt marsh changes.
Coral reef ecosystem health assessment has important significance for ecological protection in the context of global climate change. Collin and Planes [83] achieved high accuracy (96%) in coral health status classification using WorldView-2 high-resolution satellite imagery (0.5-m resolution) combined with spectral diversity indices. Zuo et al. [88] utilized Landsat 8 thermal infrared sensor data to derive fine-scale patterns of sea surface temperature in coral reef habitats of the Xisha Islands, revealing that different geomorphic zones (reef flat, lagoon, and reef slope) exhibited distinct temperature patterns. Their findings indicated that corals in the reef flat and lagoon zones were more susceptible to bleaching-level thermal stress than other areas, demonstrating how high-resolution thermal data can provide critical information for targeted coral reef conservation strategies. Yamano [89] compared the performance of multiple sensors in coral reef health assessment, finding that hyperspectral sensor data outperformed conventional multispectral data in capturing subtle health changes in coral reefs. In terms of long-term change monitoring, Palandro et al. [3] used Landsat time-series data (1983–1999) to record a significant decline of 79–92% in coral coverage, providing scientific basis for understanding the effects of long-term environmental pressure on coral reef systems.
Important progress has also been made in health assessment of other coastal ecosystems. Cingano et al. [85] analyzed seagrass communities in Italy’s Grado and Marano lagoons using Landsat 5 and 8 data with random forest algorithms, recording a significant 39% increase in seagrass coverage area (an increase of 14.16 km2) between 1999–2019, demonstrating positive recovery trends in some coastal ecosystems. Regarding tidal wetlands, Wang et al. [90] and Peng et al. [91] respectively used continuous change detection and classification (CCDC) methods to assess the health status of tidal wetlands in Jiangsu Province and the Liaohe Estuary in China, showing that tidal wetlands in Jiangsu Province decreased by 23.43% and coastal wetlands in the Liaohe Estuary decreased by 14.8% between 1990–2020, reflecting the severe pressure faced by wetlands in China’s coastal areas. In beach ecosystem assessment, Mu et al. [14] analyzed coastline changes in eastern Laizhou Bay, China, by combining Landsat and Sentinel-2 data, recording 12,025.42 ha of expansion and 261.21 ha of erosion, demonstrating the complexity of coastal dynamic processes.
Multi-source data fusion demonstrates significant advantages in typical ecosystem health assessment. Zhu et al. [54] analyzed coastline changes in Jiaozhou Bay using a U-Net semantic segmentation model, combining Landsat and GF-1 high-resolution data, finding that artificial coastlines increased from 33.72% in 1987 to 59.33% in 2022, demonstrating the effectiveness of combining remote sensing with deep learning in monitoring anthropogenic changes. Williamson et al. [92] developed a coral reef stress exposure index using Google Earth Engine, achieving efficient monitoring of large-scale coral reef health status.
These case studies not only demonstrate the broad application potential of remote-sensing technology in coastal-ecosystem health assessment but also reveal the response patterns of different ecosystems to environmental changes. High-resolution multispectral imagery, hyperspectral data, radar data, and their fusion methods, combined with advanced data-processing algorithms, provide effective approaches for comprehensive assessment of coastal-ecosystem health status.

5.2. Multi-Temporal Analysis and Change Trends

Multi-temporal remote-sensing analysis is a key technical approach for assessing the long-term health status and dynamic changes of coastal ecosystems. Through systematic analysis of satellite imagery spanning multiple years or even decades, researchers can identify natural change patterns of ecosystems, evaluate human activity impacts, and predict future change trends.
The technical means and analysis methods of multi-temporal analysis have continuously evolved with the development of remote-sensing technology. Early research mainly relied on visual interpretation of aerial photographs, such as Santos et al. [93] analyzing the long-term impact of oil pollution on Brazilian mangroves using aerial photographs from 1962–2003. With the development of satellite remote sensing, Landsat series data became the primary data source due to its long time span and consistency. Data-processing and change-detection methods have also evolved from simple to complex; Wang et al. [5] and Peng et al. [91] used continuous change detection and classification (CCDC) methods to analyze dynamic changes in China’s coastal tidal wetlands; Yang et al. [86] applied the DECODE algorithm to analyze changes in coastal tidal wetlands in the northeastern United States between 1986–2020, identifying a reduction trend of approximately 2.6 km2 annually. In coastline change detection, the digital shoreline analysis system (DSAS) is widely applied, as demonstrated by Dewidar and Frihy [94] analyzing coastline changes in the northeastern Nile Delta of Egypt between 1972–2007, finding differentiated change rates ranging from −43 m/year to +15 m/year across different regions.
Multi-temporal analysis reveals complex change patterns in coastal ecosystems. Mangrove ecosystems generally show declining trends, but with significant regional differences. Chen et al. [1] analyzed mangrove changes in Honduras’ Gulf of Fonseca between 1985–2013, finding a net loss of 11.9% over 28 years, with only 3.9% growth. Research by Liao et al. [2] on protected areas in China’s Hainan Island found a net reduction of 9.3% in mangrove area between 1987–2017. However, Thi et al. [95] studying mangrove coastline changes in Vietnam’s Mui Ca Mau found that the East Sea side retreated by an average of 33.24 m annually, while the Gulf of Thailand side advanced by 40.65 m annually, indicating the important influence of local ocean dynamics and sedimentation processes.
Multi-temporal analysis of salt marsh ecosystems similarly presents complex change patterns. Campbell’s [81] research shows that although there is an overall decreasing trend, the rate of decrease has declined from 13.4 ha annually during 1989–2003 to 2.1 ha annually during 2003–2013, suggesting positive effects of conservation measures. Lanceman et al. [82] recorded significant changes with salt marsh area increasing by 142% within four years in some wetland restoration areas. Salt marsh coastline changes exhibit obvious spatial heterogeneity; the research of Castro et al. [13] shows significant differences in salt marsh coastline changes across different regions within the same lagoon system, with some areas retreating over 60 m while others advancing several meters.
Coral reef ecosystems generally show significant degradation trends. Palandro et al. [3] analyzed changes in coral coverage between 1983–1999, recording severe losses of 79–92%. In contrast, some seagrass ecosystems show growth trends; Cingano et al. [85] found that seagrass community coverage in Italy increased by 39% (14.16 km2) between 1999–2019. Changes in tidal wetlands and coastal beaches show distinct regional differences; Wang et al. [5] found that tidal wetlands in China’s Jiangsu Province decreased by 23.43% between 1990–2020, while Mu et al.’s [14] research on eastern Laizhou Bay coastline in China recorded unbalanced changes with significant land area expansion and minimal erosion. Multi-temporal analysis also reveals key driving factors for coastal-ecosystem changes.
Natural driving factors mainly include climate change, sea-level rise, and ocean dynamic processes. Chen and Kirwan [4] found that coastal forest retreat rates in the U.S. Mid-Atlantic region increased from 3.1 m/year during 1985–2000 to 4.7 m/year during 2001–2020, primarily attributed to sea-level rise. Human activity is another important driving factor; Wang et al. [5] estimated that approximately 60% of observed tidal wetland changes in Jiangsu Province, China, were directly related to human activities. Coastal infrastructure construction also produces significant impacts; Zoysa et al. [96] analyzed coastline changes caused by port construction in Sri Lanka, recording 40 ha of erosion and 84.44 ha of accretion. The combined influence of multiple factors often leads to non-linear ecosystem responses; as Rondon et al.’s [97] research found, changes in mangrove coverage vary significantly across different countries, reflecting complex interactions between policies, economic development, and environmental protection.
Multi-temporal analysis faces various technical challenges. Temporal resolution limitation is one of the main issues; most studies can only obtain data at annual or longer intervals, making it difficult to capture seasonal changes or short-term event impacts. Data consistency is also a key challenge; sensor changes, atmospheric condition differences, and resolution inconsistencies can all affect change detection accuracy. Researchers have developed various innovative methods to address these challenges. Integrated time-series analysis techniques, such as Biçe et al. [98] combining wavelet analysis and empirical mode decomposition methods to analyze temporal patterns of coastal wetland vegetation biomass. Cloud platform-based large-scale data processing provides new pathways for multi-temporal analysis; Williamson et al. [92] developed a coral reef stress exposure index using Google Earth Engine. Applications of deep-learning methods in multi-temporal image processing have also made significant progress; Zhu et al. [54] used a U-Net semantic segmentation model to analyze coastline changes in Jiaozhou Bay.
The ultimate goal of multi-temporal analysis is to provide scientific basis for coastal-ecosystem management. Successful cases indicate that long-term monitoring data can effectively support conservation decisions and restoration planning. Campbell’s [81] research provides quantitative evidence for evaluating the effectiveness of conservation measures. Marzialetti et al. [99] monitoring of 25-year land-use changes in Italian Mediterranean coastal wetlands directly assessed the effectiveness of nature reserve management. Multi-temporal analysis also helps predict future changes; Chen et al. [1] combined Markov chain models to predict future mangrove distribution, providing guidance for proactive conservation management.
In summary, multi-temporal remote-sensing analysis has become a core tool for coastal-ecosystem health assessment. Through systematic integration of long time-series data, researchers can comprehensively grasp the spatiotemporal patterns of ecosystem changes, reveal key driving factors, and provide scientific basis for conservation management. With the continuous development of remote-sensing technology and constant innovation in data-processing methods, multi-temporal analysis will play an increasingly important role in future coastal-ecosystem health assessments.

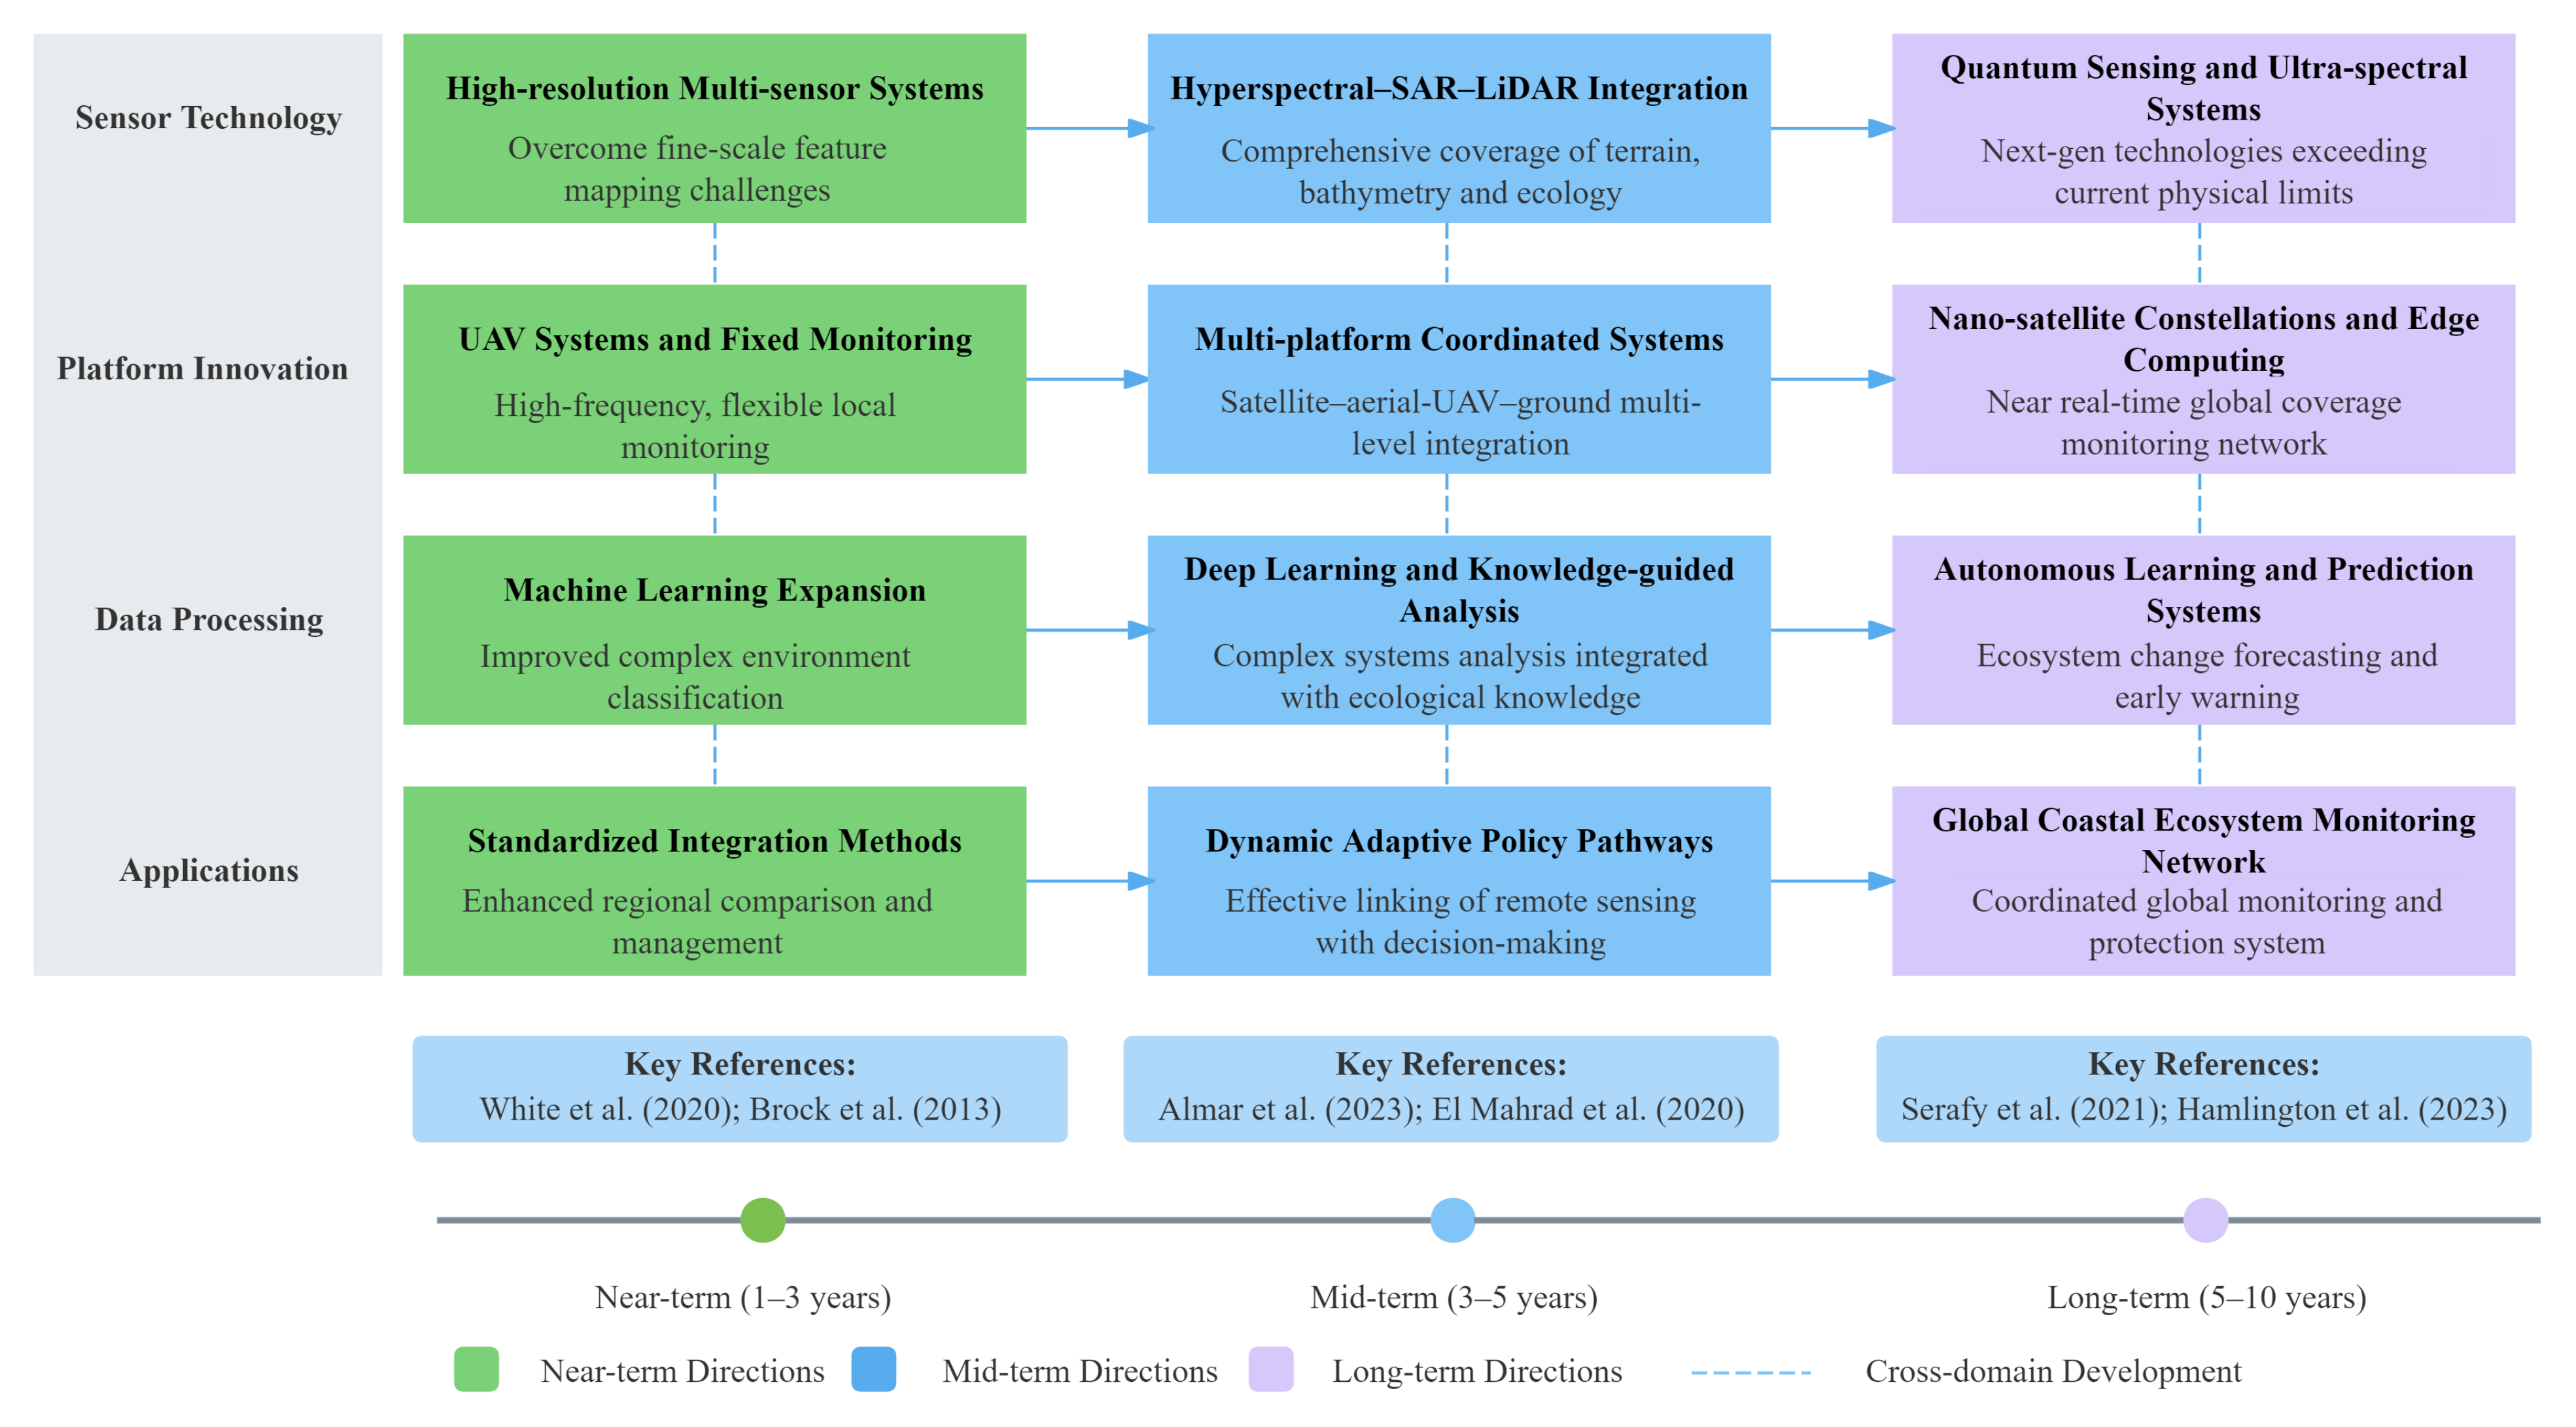
6. Challenges and Prospects

6.1. Prospects for New Technologies and Methods

With technological advancement and deepening scientific understanding, the field of coastal-ecosystem remote-sensing monitoring is witnessing the development of a series of innovative technologies and methods. These emerging technologies promise to address current technical challenges, enhance monitoring accuracy and practicality, and provide more reliable scientific support for coastal-ecosystem health assessment.
High-resolution multi-sensor systems represent an important development direction for coastal remote-sensing technology. Integrating high spatial, spectral, and temporal resolution data is a key approach to enhancing coastal-ecosystem monitoring capabilities [9]. In particular, the development of ultra-high-resolution satellite sensors shows promise in overcoming difficulties in mapping fine-scale features, providing more detailed observation data for complex ecosystems such as mangroves and coastal wetlands. Hyperspectral remote-sensing technology demonstrates enormous potential in addressing insufficient spectral resolution issues; with the development of hyperspectral sensors, the ability to distinguish similar features in coastal environments will significantly improve, especially for underwater habitat-detection capability [100]. Advances in LiDAR technology bring new opportunities for coastal topography and bathymetry measurement, particularly bathymetric LiDAR systems with underwater penetration capabilities that can simultaneously acquire coastal land topography and shallow sea depth information. Synthetic aperture radar (SAR) technology, especially polarimetric SAR, is opening new pathways to overcome limitations of optical remote sensing, capable of penetrating cloud and vegetation canopies to provide important information about forest structure and surface characteristics [11].
Platform innovation and deployment strategy development bring new opportunities for coastal remote sensing. The rapid development of UAV platforms provides advantages in flexibility and high spatiotemporal resolution, particularly suitable for high-resolution data acquisition in localized studies [101]. With the miniaturization and lightweighting of specialized sensors, UAVs carrying multispectral, hyperspectral, and even small LiDAR systems have become a reality. Fixed monitoring systems demonstrate unique value in continuous, high-frequency observation of coastal dynamic processes; fixed video cameras and scanning LiDAR systems can provide continuous monitoring data of coastal processes. Multi-platform collaborative observation is becoming an effective approach to address limitations of single platforms; by integrating data from satellites, aircraft, UAVs, and ground-based sensors, complementary information can be acquired at different spatial scales [10]. The development of microsatellite and nanosatellite constellations opens new pathways for improving temporal resolution, potentially achieving daily or even higher frequency monitoring.
Data-processing and analysis method innovation is key to enhancing information extraction capabilities. The application of machine-learning algorithms represents an important development direction; despite current challenges such as requiring large training datasets, they demonstrate enormous potential in automatic feature extraction and classification accuracy improvement [19]. Object-based classification techniques are gradually overcoming limitations of traditional pixel-based classification methods; although computationally intensive and requiring high-resolution data, they achieve higher accuracy in complex coastal environments [11]. Improvements in atmospheric-correction algorithms are crucial for enhancing remote-sensing data quality in coastal waters; methods developed by Nazeer and Nichol [24] significantly improved the accuracy of water-quality parameter estimation in coastal waters. Development of multi-temporal analysis techniques will enhance understanding of coastal dynamics and change trends; with historical data accumulation and refinement of time-series analysis methods, multi-temporal analysis will more accurately distinguish between natural variation and anthropogenic impacts [7].
Data-fusion and system integration innovations provide new ideas for comprehensive monitoring. Advancements in multi-source data-fusion algorithms are overcoming technical barriers to data integration; fusion methods combining optical, SAR, and LiDAR data in particular show promise in providing more comprehensive understanding of coastal environments [100]. Open-source platforms and data sharing initiatives offer new approaches to addressing data availability issues; projects such as the Group on Earth Observations (GEO) AquaWatch initiative demonstrate the potential of enhancing data accessibility through collaboration [102]. Development of standardized integration methods will promote regional comparison and coordinated management; application of frameworks such as Drivers, Activities, Pressures, State Changes, Impacts (on Welfare), and Responses (Measures) (DAPSI(W)R(M)) helps structure the use of remote-sensing data in assessing coastal environmental changes [10]. Dynamic adaptive policy pathway methods provide innovative models for using satellite data in management decisions, particularly applicable to sea-level rise adaptation and similar fields [103].
Application expansion and capacity building innovations are driving the transformation of remote-sensing results into practical value. Development of customized remote-sensing products for specific management needs is a key direction for enhancing application value; matching remote-sensing products with specific coastal-management needs, such as kelp harvest regulation or mangrove protection, is an important pathway to achieving successful applications [104]. International cooperation and knowledge transfer programs offer hope for addressing global imbalances; North–South and South–South cooperation are important mechanisms for promoting globally balanced application of remote-sensing technology [10]. Citizen science and crowdsourced data collection methods are expanding the boundaries of traditional remote sensing; utilizing consumer devices such as smartphones for crowdsourced data collection has very high scalability potential [101]. Development of multidisciplinary approaches brings new perspectives to addressing the complexity of coastal ecosystems; integrating remote sensing with numerical models is an effective approach to address coastal-ecosystem complexity [19].
Overall, the field of coastal-ecosystem remote-sensing monitoring is experiencing rapid innovation in technologies and methods, with these development directions promising to address current challenges at different time scales. Advanced sensor technology and platform innovation provide a foundation for enhancing data acquisition capabilities; progress in data-processing and analysis methods is expected to improve information extraction accuracy and efficiency; data-fusion and system integration innovations will promote more comprehensive ecosystem monitoring; while application expansion and capacity building will ensure these technological advances translate into practical management value. The combination of these development directions indicates that coastal-ecosystem remote-sensing monitoring is moving toward a new phase of greater precision, comprehensiveness, and practicality.
To intuitively demonstrate future development directions of coastal-ecosystem remote-sensing monitoring, Figure 4 provides a technology roadmap organized along a timeline, covering four dimensions: sensor technology, platform innovation, data-processing methods, and application practices, from short-term (1–3 years) to long-term (5–10 years) development trends. This roadmap not only displays independent development trajectories in various fields but also presents synergistic development relationships between different technological directions through dotted line connections, providing researchers and managers with clear prospects for technological development.

6.2. Management-Oriented Application Recommendations

Effective coastal-ecosystem management requires closely integrating remote-sensing technology with management needs, transforming scientific monitoring results into practical decision support tools. Based on existing research, this section proposes a series of management-oriented application recommendations aimed at promoting the practical application of remote-sensing technology in coastal-ecosystem health assessment and management.
Establishing remote-sensing-supported coastal master planning mechanisms is an important pathway to strengthen management applications. Research shows that satellite Earth observation data has been successfully applied to the West African Coastal Areas (WACA) platform for coastal master planning [19]. It is recommended that management departments incorporate remote-sensing technology into regular planning processes, utilizing its advantages of spatial comprehensiveness and temporal continuity to provide scientific basis for coastal-area land-use planning, ecological redline delineation, and development restriction zone identification. Connecting remote-sensing applications with international agreements and sustainable development frameworks is an effective strategy for enhancing policy consistency; Earth observation applications can support decision making aligned with international agreements [105]. Developing dynamic adaptive policy pathways is a forward-looking strategy for addressing climate change impacts; integrating satellite monitoring into sea-level rise adaptation planning can enhance the scientific foundation of decision making [103].
Optimizing remote-sensing applications for resource management is an important direction for improving management efficiency. Satellite monitoring has been successfully applied to kelp forest harvest regulation on North America’s west coast [104]; natural resource management departments are advised to develop specialized remote-sensing monitoring protocols and indicator systems for sustainable resource utilization management. Applying remote-sensing technology to ecosystem restoration and protection planning can enhance conservation effectiveness; research by Kumar et al. [79] and Bhadra et al. [80] demonstrates the application value of remote-sensing technology in mangrove health assessment and protection planning. Developing remote-sensing-based risk- and disaster-management systems is an effective means to enhance community resilience; satellite Earth observation applied to risk and disaster management in West African coastal areas has achieved positive results [19]. Integrating remote-sensing data for water resource quality management is fundamental work for ensuring ecological health; integrating satellite data with field measurements can improve the efficiency and accuracy of water-quality assessment [102].
Constructing long-term stable coastal-monitoring networks is a fundamental guarantee for reliable management decisions. Establishing continuous observation systems is crucial for long-term monitoring [101]; management agencies are advised to establish multi-level monitoring networks comprising satellite, aerial, and ground observation sites. Establishing data sharing and integration platforms is an important pathway to enhance data value; developing open-source platforms and data sharing initiatives can effectively address data availability and accessibility issues [102]. Adopting multi-platform collaborative observation strategies to obtain more comprehensive coastal ecological information; integrating data from multiple platforms can acquire complementary information at different spatial scales and temporal frequencies [10]. Developing citizen science projects as effective supplements to professional remote-sensing monitoring; crowdsourced data collection methods have very high scalability potential [101].
Strengthening local application capabilities of remote-sensing technology is key to realizing technological value. Investing in capacity building and infrastructure development is an important approach to addressing barriers to technology application [10]; management agencies are advised to establish specialized remote-sensing application training programs to cultivate local technical talent. Promoting close collaboration between remote-sensing experts and managers is an important link to improve application effectiveness; close collaboration between remote-sensing experts and coastal managers is a success factor in matching data with management objectives [104]. Developing regional capacity building networks to promote technology and knowledge sharing; capacity building and knowledge exchange among regional practitioners are crucial for improving remote-sensing application levels [19]. Establishing demonstration projects to showcase the practical value of remote-sensing technology; demonstrating remote-sensing value through pilot projects and case studies is an effective method to enhance institutional acceptance [10].
Establishing remote-sensing-based management effectiveness assessment systems is the foundation for achieving adaptive management. Remote-sensing technology can effectively support management tasks such as kelp restoration planning and climate change impact assessment [104]; management agencies are advised to establish standardized remote-sensing indicator systems for evaluating protected area effectiveness, ecological restoration outcomes, and water-quality improvement levels. Developing management scenario simulation tools to support anticipatory decision making and integrating remote sensing with numerical models is an effective approach to addressing coastal-ecosystem complexity [19]. Promoting cross-scale management coordination is an important strategy for improving overall management effectiveness; remote-sensing technology can simultaneously provide information at different spatial scales, supporting multi-level management from local to regional [10]. Establishing long-term monitoring and retrospective analysis mechanisms to accumulate management experience is effective; retrospective analysis based on 40 years of monitoring data has provided valuable experience for Australia’s Narrabeen-Collaroy coastal management [101].
Overall, management-oriented remote-sensing application recommendations emphasize combining technological advantages with practical management needs, promoting the transformation of remote-sensing technology from scientific tools to effective support for practical management decisions through measures in multiple aspects including policy framework construction, specific management task applications, data acquisition and management optimization, capacity building and technology transfer, and management assessment and adaptive learning. Implementation of these recommendations requires joint efforts from research institutions, management departments, communities, and international organizations to fully realize the potential of remote-sensing technology in coastal-ecosystem health assessment and sustainable management.

7. Conclusions and Prospects

This study provides a systematic review of the application of remote-sensing technology in coastal-ecosystem health assessment, deeply analyzing the technological development trajectory, current application status, and future development trends. Through integrating research achievements and practical cases from around the globe, this study makes important original contributions in theoretical framework, technological integration, and methodological innovation.
In terms of assessment framework construction, this study is the first to propose a three-dimensional indicator system for coastal-ecosystem health assessment, organically integrating water-quality parameters, vegetation function, and human disturbance indicators, breaking through the limitations of previous single-dimensional monitoring. This framework systematically addresses the key problem that traditional methods cannot comprehensively assess complex coastal environments, providing standardized assessment protocols for different types of coastal ecosystems and filling the theoretical gap in comprehensive assessment methods in this field. Research shows that the three-dimensional assessment system can more accurately reflect the true health status of coastal ecosystems, providing a reliable basis for scientific management.
In terms of technological evolution analysis, this study systematically dissects the complete development process of coastal remote sensing from traditional spectral indices to artificial intelligence technologies, deeply revealing the working mechanisms, applicable conditions, and performance boundaries of different technical methods. Through quantitative comparative analysis of extensive empirical data, the study clearly demonstrates the significant performance advantages of deep-learning methods in complex applications such as coastal zone classification, achieving 93.65% accuracy, representing a 15–20% improvement over traditional methods. This systematic technical analysis and quantitative assessment from basic mechanisms to practical applications has pioneering significance in this field, providing scientific guidance for technology selection and method optimization.
In terms of data-fusion innovation, this study constructs a multi-source data-fusion strategy system specifically for coastal-ecosystem monitoring, effectively breaking through the inherent limitations of single data sources in spatiotemporal coverage and information extraction through organic integration of optical, radar, and multi-platform observation data. Research proves that multi-source fusion technology can improve monitoring accuracy by 10–30%, significantly enhancing monitoring capabilities in complex coastal environments. This fusion strategy not only solves technical challenges but also establishes a complete technical chain from data acquisition to information extraction, providing systematic solutions for comprehensive coastal-ecosystem monitoring.
In terms of application transformation, this study innovatively constructs a transformation framework from scientific monitoring to management applications, proposing remote-sensing application strategies and implementation pathways oriented toward actual management needs. Through in-depth analysis of the matching relationship between technical capabilities and management requirements, the study achieves effective integration between remote-sensing technology and coastal-management practices, providing operational implementation plans for the complete application chain from “observation” to “understanding” to “action”.
Despite significant progress, coastal-ecosystem health remote-sensing assessment still faces multiple challenges. Data integration complexity, environmental interference factors, insufficient technical standardization, and transformation barriers from scientific research to management applications remain key issues constraining development in this field. Particularly in complex coastal environments, signal mixing problems and technical difficulties in multi-scale data fusion require further breakthroughs. Meanwhile, differences in data standards and assessment protocols across regions also limit comparative studies and collaborative management on a global scale.
Looking toward the future, the development of coastal-ecosystem health remote-sensing assessment should focus on three key directions. First, establishing more comprehensive standardized assessment systems, combining remote-sensing observations with field validation to form universal assessment protocols applicable to different coastal-ecosystem types. Second, deepening the integration of artificial intelligence technologies with traditional ecological models, improving monitoring accuracy and automation levels in complex coastal environments through advanced algorithms such as machine learning and deep learning. Finally, constructing global coastal-monitoring networks using unified data standards and processing workflows to promote cross-regional comparative studies and international cooperation.
Technological development trends indicate that high-resolution multi-sensor fusion, cloud computing platform applications, and artificial intelligence algorithm optimization will become key development directions in the next five to ten years. Breakthroughs in new-generation sensor technologies are expected to resolve current limitations in spatial resolution, spectral resolution, and temporal resolution, while advanced algorithm applications will significantly improve the accuracy and efficiency of information extraction. Meanwhile, the development of open data sharing and cloud computing platforms will substantially lower technical application barriers, promoting widespread application of remote-sensing technology in coastal management.
Effective integration between science and management is the key link in realizing the application value of remote-sensing technology. Future research should pay more attention to the practicality and operability of technical achievements, strengthen cooperation with coastal-management departments, and establish effective mechanisms for transforming scientific monitoring results into management decisions. Through developing user-friendly application platforms and decision support tools, complex remote-sensing technology can be transformed into practical information that managers can understand and apply, truly achieving the goal of scientific technology serving coastal-ecosystem protection and sustainable management.
This study provides comprehensive theoretical foundation and practical guidance for coastal-ecosystem health remote-sensing assessment through systematic integration of international frontier progress and innovative framework construction. With continuous technological advancement and expanding application fields, remote-sensing technology will inevitably play an increasingly important role in coastal-ecosystem protection, climate change response, and sustainable development, contributing scientific strength to building beautiful coasts where humans and nature coexist harmoniously.

Author Contributions

Conceptualization, L.Z.; methodology, L.Z. and X.F.; formal analysis, L.Z. and S.X.; investigation, L.Z.; resources, L.Z.; data curation, L.Z. and X.F.; writing—original draft preparation, L.Z.; writing—review and editing, X.F. and S.X.; visualization, S.X.; supervision, L.Z.; project administration, L.Z.; funding acquisition, L.Z. and X.F. All authors have read and agreed to the published version of the manuscript.

Funding

This research was funded by the Doctoral Research Startup Fund of Mudanjiang Normal University, grant numbers MNUB202406 and MNUB202407, and the Higher Education Teaching Reform Project of Heilongjiang Province, grant number SJGYB2024679.

Data Availability Statement

No new data were created in this study. All data analyzed in this review are from previously published literature cited within the manuscript.

Conflicts of Interest

The authors declare no conflicts of interest.

References

  1. Chen, C.F.; Son, N.T.; Chang, N.B.; Chen, C.R.; Chang, L.Y.; Valdez, M.; Centeno, G.; Thompson, C.A.; Aceituno, J.L. Multi-Decadal Mangrove Forest Change Detection and Prediction in Honduras, Central America, with Landsat Imagery and a Markov Chain Model. Remote Sens. 2013, 5, 6408–6426. [Google Scholar] [CrossRef]
  2. Liao, J.; Zhen, J.; Zhang, L.; Metternicht, G. Understanding Dynamics of Mangrove Forest on Protected Areas of Hainan Island, China: 30 Years of Evidence from Remote Sensing. Sustainability 2019, 11, 5356. [Google Scholar] [CrossRef]
  3. Palandro, D.; Andrefouet, S.; Muller-Karger, F.; Dustan, P. Coral Reef Change Detection Using Landsats 5 and 7: A Case Study Using Carysfort Reef in the Florida Keys. In Proceedings of the Igarss 2001, Scanning the Present and Resolving the Future, IEEE 2001 International Geoscience and Remote Sensing Symposium (Cat. No.01ch37217), Sydney, Australia, 9–13 July 2001; Volume 2, pp. 625–627. [Google Scholar] [CrossRef]
  4. Chen, Y.; Kirwan, M.L. A phenology- and trend-based approach for accurate mapping of sea-level driven coastal forest retreat. Remote Sens. Environ. 2022, 281, 113229. [Google Scholar] [CrossRef]
  5. Wang, H.; Zhou, Y.; Wu, J.; Wang, C.; Zhang, R.; Xiong, X.; Xu, C. Human activities dominate a staged degradation pattern of coastal tidal wetlands in Jiangsu province, China. Ecol. Indic. 2023, 154, 110579. [Google Scholar] [CrossRef]
  6. Stelzer, K.; Brockmann, C.; Murphy, D.; Krämer, U. Applicability of Remote Sensing in Monitoring Coastal Zones. In Geographie der Meere und Küsten; Schernewski, G., Dolch, T., Eds.; Coastline Reports; EUCC: Warnemünde, Germany, 2004; Volume 1, pp. 249–253. [Google Scholar]
  7. Moffett, K.B.; Nardin, W.; Silvestri, S.; Wang, C.; Temmerman, S. Multiple Stable States and Catastrophic Shifts in Coastal Wetlands: Progress, Challenges, and Opportunities in Validating Theory Using Remote Sensing and Other Methods. Remote Sens. 2015, 7, 10184–10226. [Google Scholar] [CrossRef]
  8. Espriella, M.C.; Lecours, V. Optimizing the Scale of Observation for Intertidal Habitat Classification through Multiscale Analysis. Drones 2022, 6, 140. [Google Scholar] [CrossRef]
  9. Brock, J.C.; Danielson, J.J.; Purkis, S. Emerging methods for the study of coastal ecosystem landscape structure and change. Int. J. Remote Sens. 2013, 34, 6283–6285. [Google Scholar] [CrossRef]
  10. El Mahrad, B.; Newton, A.; Icely, J.D.; Kacimi, I.; Abalansa, S.; Snoussi, M. Contribution of Remote Sensing Technologies to a Holistic Coastal and Marine Environmental Management Framework: A Review. Remote Sens. 2020, 12, 2313. [Google Scholar] [CrossRef]
  11. Maurya, K.; Mahajan, S.; Chaube, N. Remote sensing techniques: Mapping and monitoring of mangrove ecosystem—A review. Complex Intell. Syst. 2021, 7, 2797–2818. [Google Scholar] [CrossRef]
  12. Chen, J.; Chen, S.; Fu, R.; Wang, C.; Li, D.; Peng, Y.; Wang, L.; Jiang, H.; Zheng, Q. Remote Sensing Estimation of Chlorophyll-A in Case-II Waters of Coastal Areas: Three-Band Model Versus Genetic Algorithm—Artificial Neural Networks Model. IEEE J. Sel. Top. Appl. Earth Obs. Remote Sens. 2021, 14, 3640–3658. [Google Scholar] [CrossRef]
  13. Castro, I.J.; Dias, J.M.; Lopes, C.L. Assessing Shoreline Changes in Fringing Salt Marshes from Satellite Remote Sensing Data. Remote Sens. 2023, 15, 4475. [Google Scholar] [CrossRef]
  14. Mu, K.; Tang, C.; Tosi, L.; Li, Y.; Zheng, X.; Donnici, S.; Sun, J.; Liu, J.; Gao, X. Coastline Monitoring and Prediction Based on Long-Term Remote Sensing Data—A Case Study of the Eastern Coast of Laizhou Bay, China. Remote Sens. 2024, 16, 185. [Google Scholar] [CrossRef]
  15. Bartsch, A.; Ley, S.; Nitze, I.; Pointner, G.; Vieira, G. Feasibility Study for the Application of Synthetic Aperture Radar for Coastal Erosion Rate Quantification Across the Arctic. Front. Environ. Sci. 2020, 8, 143. [Google Scholar] [CrossRef]
  16. Zhang, Y.; Jing, W.; Deng, Y.; Zhou, W.; Yang, J.; Li, Y.; Cai, Y.; Hu, Y.; Peng, X.; Lan, W.; et al. Water quality parameters retrieval of coastal mariculture ponds based on UAV multispectral remote sensing. Front. Environ. Sci. 2023, 11, 1079397. [Google Scholar] [CrossRef]
  17. Guo, S.; Sun, B.; Zhang, H.K.; Liu, J.; Chen, J.; Wang, J.; Jiang, X.; Yang, Y. MODIS ocean color product downscaling via spatio-temporal fusion and regression: The case of chlorophyll-a in coastal waters. Int. J. Appl. Earth Obs. Geoinf. 2018, 73, 340–361. [Google Scholar] [CrossRef]
  18. Yuan, Y.; Meng, X.; Sun, W.; Yang, G.; Wang, L.; Peng, J.; Wang, Y. Multi-Resolution Collaborative Fusion of SAR, Multispectral and Hyperspectral Images for Coastal Wetlands Mapping. Remote Sens. 2022, 14, 3492. [Google Scholar] [CrossRef]
  19. Almar, R.; Stieglitz, T.; Addo, K.A.; Ba, K.; Ondoa, G.A.; Bergsma, E.W.J.; Bonou, F.; Dada, O.; Angnuureng, D.; Arino, O. Coastal Zone Changes in West Africa: Challenges and Opportunities for Satellite Earth Observations. Surv. Geophys. 2023, 44, 249–275. [Google Scholar] [CrossRef]
  20. Lunetta, R.S.; Knight, J.F.; Paerl, H.W.; Streicher, J.J.; Peierls, B.L.; Gallo, T.; Lyon, J.G.; Mace, T.H.; Buzzlli, C.P. Measurement of water colour using AVIRIS imagery to assess the potential for an operational monitoring capability in the Pamlico Sound Estuary, USA. Int. J. Remote Sens. 2009, 30, 3291–3314. [Google Scholar] [CrossRef]
  21. Ali, S.M.; Gupta, A.; Raman, M.; Sahay, A.; Motwani, G.; Muduli, P.R.; Krishna, A.V.; Tirkey, A. Improved estimates of bio-optical parameters in optically complex water using hyperspectral remote sensing data. Int. J. Remote Sens. 2021, 42, 3056–3073. [Google Scholar] [CrossRef]
  22. Baek, J.Y.; Jo, Y.H.; Kim, W.; Lee, J.S.; Jung, D.; Kim, D.W.; Nam, J. A New Algorithm to Estimate Chlorophyll-A Concentrations in Turbid Yellow Sea Water Using a Multispectral Sensor in a Low-Altitude Remote Sensing System. Remote Sens. 2019, 11, 2257. [Google Scholar] [CrossRef]
  23. Gai, Y.; Yu, D.; Zhou, Y.; Yang, L.; Chen, C.; Chen, J. An Improved Model for Chlorophyll-a Concentration Retrieval in Coastal Waters Based on UAV-Borne Hyperspectral Imagery: A Case Study in Qingdao, China. Water 2020, 12, 2769. [Google Scholar] [CrossRef]
  24. Nazeer, M.; Nichol, J.E. Selection of atmospheric correction method and estimation of Chlorophyll-a (Chl-a) in coastal waters of Hong Kong. In Proceedings of the 2014 Third International Workshop on Earth Observation and Remote Sensing Applications (EORSA), Changsha, China, 11–14 June 2014; pp. 374–378. [Google Scholar] [CrossRef]
  25. Hafeez, S.; Wong, M.S.; Ho, H.C.; Nazeer, M.; Nichol, J.; Abbas, S.; Tang, D.; Lee, K.H.; Pun, L. Comparison of Machine Learning Algorithms for Retrieval of Water Quality Indicators in Case-II Waters: A Case Study of Hong Kong. Remote Sens. 2019, 11, 617. [Google Scholar] [CrossRef]
  26. Mazzolini, M.; Manzoni, M.; Monti-Guarnieri, A.V.; Petrushevsky, N. SAR-Based Coastline Detection and Monitoring. Int. Arch. Photogramm. Remote Sens. Spat. Inf. Sci. 2021, XLIII-B3-2021, 327–334. [Google Scholar] [CrossRef]
  27. Salameh, E.; Frappart, F.; Turki, I.; Laignel, B. Intertidal Topography Mapping Using the Waterline Method from Sentinel-1 & -2 Images: The Examples of Arcachon and Veys Bays in France. ISPRS J. Photogramm. Remote Sens. 2020, 163, 98–120. [Google Scholar] [CrossRef]
  28. Bian, S.; Xie, C.; Tian, B.; Guo, Y.; Zhu, Y.; Yang, Y.; Zhang, M.; Yang, Y.; Ruan, Y. Classification of plants based on time-series SAR coherence and intensity data in Yancheng coastal wetland. Int. J. Remote Sens. 2025, 46, 859–881. [Google Scholar] [CrossRef]
  29. Segales, J.M.; Paz, E.M.; Cauba, A.G., Jr. A-PoRM SIPLAS: Assessing The Post-Disaster Recovery Of Mangrove Forest In Siargao Island Protected Landscape And Seascape (SIPLAS) Area Using Sentinel-1 SAR Data. Int. Arch. Photogramm. Remote Sens. Spat. Inf. Sci. 2024, XLVIII-5-2024, 105–116. [Google Scholar] [CrossRef]
  30. Abou El-Magd, I.; Zakzouk, M.; Abdulaziz, A.M.; Ali, E.M. The Potentiality of Operational Mapping of Oil Pollution in the Mediterranean Sea near the Entrance of the Suez Canal Using Sentinel-1 SAR Data. Remote Sens. 2020, 12, 1352. [Google Scholar] [CrossRef]
  31. Haarpaintner, J.; Davids, C. Mapping Atmospheric Exposure of the Intertidal Zone with Sentinel-1 CSAR in Northern Norway. Remote Sens. 2021, 13, 3354. [Google Scholar] [CrossRef]
  32. Vásquez-Salazar, R.D.; Cardona-Mesa, A.A.; Valdés-Quintero, J.; Olmos-Severiche, C.; Gómez, L.; Travieso-González, C.M.; Díaz-Paz, J.P.; Espinosa-Ovideo, J.E.; Diez-Rendón, L.; Garavito-González, A.F.; et al. Detection of Coastal Erosion and Progradation in the Colombian ‘Atrato River’ Delta by Using Sentinel-1 Synthetic Aperture Radar Data. Remote Sens. 2024, 16, 552. [Google Scholar] [CrossRef]
  33. Lamb, B.T.; Tzortziou, M.A.; McDonald, K.C. A Fused Radar–Optical Approach for Mapping Wetlands and Deepwaters of the Mid–Atlantic and Gulf Coast Regions of the United States. Remote Sens. 2021, 13, 2495. [Google Scholar] [CrossRef]
  34. Zollini, S.; Dominici, D.; Alicandro, M.; Cuevas-González, M.; Angelats, E.; Ribas, F.; Simarro, G. New Methodology for Shoreline Extraction Using Optical and Radar (SAR) Satellite Imagery. J. Mar. Sci. Eng. 2023, 11, 627. [Google Scholar] [CrossRef]
  35. Wang, W.; Gade, M.; Yang, X. Detection of Bivalve Beds on Exposed Intertidal Flats Using Polarimetric SAR Indicators. Remote Sens. 2017, 9, 1047. [Google Scholar] [CrossRef]
  36. Li, P.; Zhang, Y.; Liang, C.; Wang, H.; Li, Z. High Spatiotemporal Resolution River Networks Mapping on Catchment Scale Using Satellite Remote Sensing Imagery and DEM Data. Geophys. Res. Lett. 2024, 51, e2023GL107956. [Google Scholar] [CrossRef]
  37. Dehouck, A.; Lafon, V.; Baghdadi, N.; Marieu, V. Use of optical and radar data in synergy for mapping intertidal flats and coastal salt-marshes (Arcachon lagoon, France). In Proceedings of the 2012 IEEE International Geoscience and Remote Sensing Symposium, Munich, Germany, 22–27 July 2012; pp. 2853–2856. [Google Scholar] [CrossRef]
  38. Ferrara, C.; Lega, M.; Fusco, G.; Bishop, P.; Endreny, T. Characterization of Terrestrial Discharges into Coastal Waters with Thermal Imagery from a Hierarchical Monitoring Program. Water 2017, 9, 500. [Google Scholar] [CrossRef]
  39. Allen, T.; Wang, Y.; Gore, B.; Swords, J.; Newcomb, D. Coastal Wetland Mapping Using Time Series SAR Imagery and LIDAR: Alligator River National Wildlife Refuge, North Carolina. In Proceedings of the Pecora 18—Forty Years of Earth Observation…Understanding a Changing World, Herndon, VA, USA, 14–17 November 2011. [Google Scholar]
  40. Gade, M.; Barale, V.; Snaith, H. Multisensor monitoring of plume dynamics in the northwestern Mediterranean Sea. J. Coast. Conserv. 2003, 9, 91–96. [Google Scholar] [CrossRef]
  41. Dabrowska-Zielinska, K.; Budzynska, M.; Tomaszewska, M.; Bartold, M.; Gatkowska, M.; Malek, I.; Turlej, K.; Napiorkowska, M. Monitoring Wetlands Ecosystems Using ALOS PALSAR (L-Band, HV) Supplemented by Optical Data: A Case Study of Biebrza Wetlands in Northeast Poland. Remote Sens. 2014, 6, 1605–1633. [Google Scholar] [CrossRef]
  42. Wicaksono, A.; Khakhim, N.; Pratama, D.; Musthofa, A.; Lazuardi, W. Geometric Accuracy Comparison of Shorelines Derived from Multitemporal Sentinel-2A Imagery with Various Image Spectral Transformations (Case Study: Marine Deposition Coasts in Bantul Regency, Yogyakarta, Indonesia). Int. J. Geoinform. 2021, 17, 27–40. [Google Scholar]
  43. Bannari, A.; Ali, T.S.; Abahussain, A. The capabilities of Sentinel-MSI (2A/2B) and Landsat-OLI (8/9) in seagrass and algae species differentiation using spectral reflectance. Ocean Sci. 2022, 18, 361–388. [Google Scholar] [CrossRef]
  44. Agate, J.; Ballinger, R.; Ward, R.D. Satellite remote sensing can provide semi-automated monitoring to aid coastal decision-making. Estuarine, Coast. Shelf Sci. 2024, 298, 108639. [Google Scholar] [CrossRef]
  45. Lemenkova, P. Artificial Intelligence for Computational Remote Sensing: Quantifying Patterns of Land Cover Types around Cheetham Wetlands, Port Phillip Bay, Australia. J. Mar. Sci. Eng. 2024, 12, 1279. [Google Scholar] [CrossRef]
  46. Ashphaq, M.; Srivastava, P.K.; Mitra, D. Satellite-Derived Bathymetry in Dynamic Coastal Geomorphological Environments Through Machine Learning Algorithms. Earth Space Sci. 2024, 11, e2024EA003554. [Google Scholar] [CrossRef]
  47. Feng, Q.; Yang, J.; Zhu, D.; Liu, J.; Guo, H.; Bayartungalag, B.; Li, B. Integrating Multitemporal Sentinel-1/2 Data for Coastal Land Cover Classification Using a Multibranch Convolutional Neural Network: A Case of the Yellow River Delta. Remote Sens. 2019, 11, 1006. [Google Scholar] [CrossRef]
  48. Liu, P.; Wang, C.; Ye, M.; Han, R. Coastal Zone Classification Based on U-Net and Remote Sensing. Appl. Sci. 2024, 14, 7050. [Google Scholar] [CrossRef]
  49. Hill, P.R.; Kumar, A.; Temimi, M.; Bull, D.R. HABNet: Machine Learning, Remote Sensing-Based Detection of Harmful Algal Blooms. IEEE J. Sel. Top. Appl. Earth Obs. Remote Sens. 2020, 13, 3229–3239. [Google Scholar] [CrossRef]
  50. Balogun, A.L.; Yekeen, S.T.; Pradhan, B.; Althuwaynee, O.F. Spatio-Temporal Analysis of Oil Spill Impact and Recovery Pattern of Coastal Vegetation and Wetland Using Multispectral Satellite Landsat 8-OLI Imagery and Machine Learning Models. Remote Sens. 2020, 12, 1225. [Google Scholar] [CrossRef]
  51. Munizaga, J.; García, M.; Ureta, F.; Novoa, V.; Rojas, O.; Rojas, C. Mapping Coastal Wetlands Using Satellite Imagery and Machine Learning in a Highly Urbanized Landscape. Sustainability 2022, 14, 5700. [Google Scholar] [CrossRef]
  52. Alevizos, E. A Combined Machine Learning and Residual Analysis Approach for Improved Retrieval of Shallow Bathymetry from Hyperspectral Imagery and Sparse Ground Truth Data. Remote Sens. 2020, 12, 3489. [Google Scholar] [CrossRef]
  53. Liu, X.; Fatoyinbo, T.E.; Thomas, N.M.; Guan, W.W.; Zhan, Y.; Mondal, P.; Lagomasino, D.; Simard, M.; Trettin, C.C.; Deo, R.; et al. Large-Scale High-Resolution Coastal Mangrove Forests Mapping Across West Africa With Machine Learning Ensemble and Satellite Big Data. Front. Earth Sci. 2021, 8, 560933. [Google Scholar] [CrossRef]
  54. Zhu, Y.; Li, Z.; Zhao, Z.; Lu, L.; Yang, S.; Wang, Z. Spatio-temporal changes of coastline in Jiaozhou Bay from 1987 to 2022 based on optical and SAR data. Front. Mar. Sci. 2023, 10, 1233410. [Google Scholar] [CrossRef]
  55. Pahlevan, N.; Smith, B.; Schalles, J.; Binding, C.; Cao, Z.; Ma, R.; Alikas, K.; Kangro, K.; Gurlin, D.; Hà, N.; et al. Seamless retrievals of chlorophyll-a from Sentinel-2 (MSI) and Sentinel-3 (OLCI) in inland and coastal waters: A machine-learning approach. Remote Sens. Environ. 2020, 240, 111604. [Google Scholar] [CrossRef]
  56. Zaabar, N.; Niculescu, S.; Kamel, M.M. Application of Convolutional Neural Networks With Object-Based Image Analysis for Land Cover and Land Use Mapping in Coastal Areas: A Case Study in Ain Témouchent, Algeria. IEEE J. Sel. Top. Appl. Earth Obs. Remote Sens. 2022, 15, 5177–5189. [Google Scholar] [CrossRef]
  57. Devlin, J.M.; da Silva, T.E.; Petus, C.; Wenger, A.; Zeh, D.; Tracey, D.; Álvarez-Romero, G.J.; Brodie, J. Combining in-situ water quality and remotely sensed data across spatial and temporal scales to measure variability in wet season chlorophyll-a: Great Barrier Reef lagoon (Queensland, Australia). Ecol Process 2013, 2, 31. [Google Scholar] [CrossRef]
  58. Donatelli, C.; Passalacqua, P.; Jensen, D.; Oliver-Cabrera, T.; Jones, C.E.; Fagherazzi, S. Spatial Variability in Salt Marsh Drainage Controlled by Small Scale Topography. J. Geophys. Res. Earth Surf. 2023, 128, e2023JF007219. [Google Scholar] [CrossRef]
  59. Bishop-Taylor, R.; Sagar, S.; Lymburner, L.; Alam, I.; Sixsmith, J. Sub-Pixel Waterline Extraction: Characterising Accuracy and Sensitivity to Indices and Spectra. Remote Sens. 2019, 11, 2984. [Google Scholar] [CrossRef]
  60. Moreno-Madriñán, M.J.; Fischer, A.M. Performance of the MODIS FLH algorithm in estuarine waters: A multi-year (2003–2010) analysis from Tampa Bay, Florida (USA). Int. J. Remote Sens. 2013, 34, 6467–6483. [Google Scholar] [CrossRef]
  61. Abbas, M.M.; Melesse, A.M.; Scinto, L.J.; Rehage, J.S. Satellite Estimation of Chlorophyll-a Using Moderate Resolution Imaging Spectroradiometer (MODIS) Sensor in Shallow Coastal Water Bodies: Validation and Improvement. Water 2019, 11, 1621. [Google Scholar] [CrossRef]
  62. Han, B.; Loisel, H.; Vantrepotte, V.; Mériaux, X.; Bryère, P.; Ouillon, S.; Dessailly, D.; Xing, Q.; Zhu, J. Development of a Semi-Analytical Algorithm for the Retrieval of Suspended Particulate Matter from Remote Sensing over Clear to Very Turbid Waters. Remote Sens. 2016, 8, 211. [Google Scholar] [CrossRef]
  63. Novoa, S.; Doxaran, D.; Ody, A.; Vanhellemont, Q.; Lafon, V.; Lubac, B.; Gernez, P. Atmospheric Corrections and Multi-Conditional Algorithm for Multi-Sensor Remote Sensing of Suspended Particulate Matter in Low-to-High Turbidity Levels Coastal Waters. Remote Sens. 2017, 9, 61. [Google Scholar] [CrossRef]
  64. Zhou, X.; Marani, M.; Albertson, J.D.; Silvestri, S. Hyperspectral and Multispectral Retrieval of Suspended Sediment in Shallow Coastal Waters Using Semi-Analytical and Empirical Methods. Remote Sens. 2017, 9, 393. [Google Scholar] [CrossRef]
  65. Cavalli, R.M. Local, Daily, and Total Bio-Optical Models of Coastal Waters of Manfredonia Gulf Applied to Simulated Data of CHRIS, Landsat TM, MIVIS, MODIS, and PRISMA Sensors for Evaluating the Error. Remote Sens. 2020, 12, 1428. [Google Scholar] [CrossRef]
  66. Sukojo, B.M.; Arindi, Y.N. Analisa Perubahan Kerapatan Mangrove Berdasarkan Nilai Normalized Difference Vegetation Index Menggunakan Citra Landsat 8 (Studi Kasus: Pesisir Utara Surabaya). Geoid 2019, 14, 1–5. [Google Scholar] [CrossRef]
  67. Kang, X.; Yan, L.; Zhang, X.; Li, Y.; Tian, D.; Peng, C.; Wu, H.; Wang, J.; Zhong, L. Modeling Gross Primary Production of a Typical Coastal Wetland in China Using MODIS Time Series and CO2 Eddy Flux Tower Data. Remote Sens. 2018, 10, 708. [Google Scholar] [CrossRef]
  68. Meng, L.; Huang, Y.; Zhu, N.; Chen, Z.; Li, X. Mapping properties of vegetation in a tidal salt marsh from multi-spectral satellite imagery using the SCOPE model. Int. J. Remote Sens. 2021, 42, 422–444. [Google Scholar] [CrossRef]
  69. Rummell, A.J.; Leon, J.X.; Borland, H.P.; Elliott, B.B.; Gilby, B.L.; Henderson, C.J.; Olds, A.D. Watching the Saltmarsh Grow: A High-Resolution Remote Sensing Approach to Quantify the Effects of Wetland Restoration. Remote Sens. 2022, 14, 4559. [Google Scholar] [CrossRef]
  70. Ramsey, E., III; Rangoonwala, A. Canopy Reflectance Related to Marsh Dieback Onset and Progression in Coastal Louisiana. Photogramm. Eng. Remote Sens. 2006, 72, 641–652. [Google Scholar] [CrossRef]
  71. Benevides, J.; Silva, A.; Benevides, D.J.; Bezerra, L.E. Comparative Space-Temporal Study of the Spectral Response of the Vegetation of the APA of the Curu River Estuary and Surroundings Using Multispectral Images. Geosaberes 2023, 14, 1–20. [Google Scholar] [CrossRef]
  72. Salcedo, J.M.; Alhama, I.; Alcaraz, M.; Álvarez-Rogel, J.; Jiménez-Valera, J.A. Using Remote Sensing to Assess the Vegetation Cover of a Protected Salt Marsh Subjected to Artificial Recharge and Groundwater Abstractions during the Period 1925–2022 (Alicante, SE Spain). Sustainability 2024, 16, 973. [Google Scholar] [CrossRef]
  73. Ballanti, L.; Byrd, K.B.; Woo, I.; Ellings, C. Remote Sensing for Wetland Mapping and Historical Change Detection at the Nisqually River Delta. Sustainability 2017, 9, 1919. [Google Scholar] [CrossRef]
  74. Callaghan, K.; Engelbrecht, J.; Kemp, J. The Use of Landsat and Aerial Photography for the Assessment of Coastal Erosion and Erosion Susceptibility in False Bay, South Africa. South. Afr. J. Geomat. 2015, 4, 65–79. [Google Scholar] [CrossRef]
  75. Ayalke, Z.G.; Şişman, A.; Akpinar, K. Shoreline extraction and analyzing the effect of coastal structures on shoreline changing with remote sensing and geographic information system: Case of Samsun, Turkey. Reg. Stud. Mar. Sci. 2023, 61, 102883. [Google Scholar] [CrossRef]
  76. Li, J.; Liu, Y.; Pu, R.; Yuan, Q.; Shi, X.; Guo, Q.; Song, X. Coastline and landscape changes in bay areas caused by human activities: A comparative analysis of Xiangshan Bay, China and Tampa Bay, USA. J. Geogr. Sci. 2018, 28, 1127–1151. [Google Scholar] [CrossRef]
  77. Chu, L.; Oloo, F.; Sudmanns, M.; Tiede, D.; Hölbling, D.; Blaschke, T.; Teleoaca, I. Monitoring long-term shoreline dynamics and human activities in the Hangzhou Bay, China, combining daytime and nighttime EO data. Big Earth Data 2020, 4, 242–264. [Google Scholar] [CrossRef]
  78. Niculescu, S.; Lardeux, C.; Hanganu, J. Alteration and Remediation of Coastal Wetland Ecosystems in the Danube Delta: A Remote-Sensing Approach. In Coastal Wetlands: Alteration and Remediation; Finkl, C.W., Makowski, C., Eds.; Springer International Publishing: Cham, Switzerland, 2017; pp. 513–553. [Google Scholar] [CrossRef]
  79. Kumar, T.; Kaur, P.; Chandrasekar, K.; Bandyopadhyay, S. Aviris-ng Hyperspectral Data For Mapping Mangrove Forests And Their Health Spatially: A Case Study Of Indian Sundarbans. J. Trop. For. Sci. 2020, 32, 317–331. [Google Scholar] [CrossRef]
  80. Bhadra, T.; Banerjee, S.; Ghosh, S.; Saha, A.; Mukherjee, K.; Sardar, R.; Roy, S.; Das, R. Monitoring The Mangroves Of Indian Sundarbans Using Geospatial Techniques. Int. Arch. Photogramm. Remote Sens. Spat. Inf. Sci. 2023, XLVIII-1/W2-2023, 405–412. [Google Scholar] [CrossRef]
  81. Campbell, A.D. Monitoring Salt Marsh Condition and Change with Satellite Remote Sensing. Ph.D. Dissertation, University of Rhode Island, Kingston, RI, USA, 2018. Open Access Dissertations. p. 793. [Google Scholar]
  82. Lanceman, D.; Sadat-Noori, M.; Gaston, T.; Drummond, C.; Glamore, W. Blue carbon ecosystem monitoring using remote sensing reveals wetland restoration pathways. Front. Environ. Sci. 2022, 10, 924221. [Google Scholar] [CrossRef]
  83. Collin, A.; Planes, S. Enhancing Coral Health Detection Using Spectral Diversity Indices from WorldView-2 Imagery and Machine Learners. Remote Sens. 2012, 4, 3244–3264. [Google Scholar] [CrossRef]
  84. Leiper, I.A.; Phinn, S.R.; Roelfsema, C.M.; Joyce, K.E.; Dekker, A.G. Mapping Coral Reef Benthos, Substrates, and Bathymetry, Using Compact Airborne Spectrographic Imager (CASI) Data. Remote Sens. 2014, 6, 6423–6445. [Google Scholar] [CrossRef]
  85. Cingano, P.; Vuerich, M.; Petruzzellis, F.; Orzan, L.; Trotta, G.; Casolo, V.; Asquini, E.; Bacaro, G.; Boscutti, F. Seagrasses on the move: Tracing the multi-decadal species distribution trends in lagoon meadows using Landsat imagery. Ecol. Inform. 2024, 82, 102685. [Google Scholar] [CrossRef]
  86. Yang, X.; Zhu, Z.; Qiu, S.; Kroeger, K.D.; Zhu, Z.; Covington, S. Detection and characterization of coastal tidal wetland change in the northeastern US using Landsat time series. Remote Sens. Environ. 2022, 276, 113047. [Google Scholar] [CrossRef]
  87. Dittmann, S.; Mosley, L.; Stangoulis, J.; Nguyen, V.L.; Beaumont, K.; Dang, T.; Guan, H.; Gutierrez-Jurado, K.; Lam-Gordillo, O.; McGrath, A. Effects of Extreme Salinity Stress on a Temperate Mangrove Ecosystem. Front. For. Glob. Change 2022, 5, 859283. [Google Scholar] [CrossRef]
  88. Zuo, X.L.; Yu, K.F.; Qin, B.N.; Duan, X.P.; Yao, Z.F.; Su, F.Z. Deriving fine-scale patterns of sea surface temperature in coral reef habitats using the Landsat 8 thermal infrared sensor. Front. Mar. Sci. 2023, 10, 1293414. [Google Scholar] [CrossRef]
  89. Yamano, H.; Tamura, M.; Kunii, Y.; Hidaka, M. Hyperspectral Remote Sensing and Radiative Transfer Simulation as a Tool for Monitoring Coral Reef Health. Mar. Technol. Soc. J. 2002, 36, 4–13. [Google Scholar] [CrossRef]
  90. Wang, Y.; Wang, X.; Khan, S.; Zhou, D.; Ke, Y. Evaluation of mangrove restoration effectiveness using remote sensing indices—A case study in Guangxi Shankou Mangrove National Natural Reserve, China. Front. Mar. Sci. 2023, 10, 1280373. [Google Scholar] [CrossRef]
  91. Peng, J.; Liu, S.; Lu, W.; Liu, M.; Feng, S.; Cong, P. Continuous Change Mapping to Understand Wetland Quantity and Quality Evolution and Driving Forces: A Case Study in the Liao River Estuary from 1986 to 2018. Remote Sens. 2021, 13, 4900. [Google Scholar] [CrossRef]
  92. Williamson, M.J.; Tebbs, E.J.; Thompson, H.J.; Dawson, T.P.; Head, C.E.I.; Jacoby, D.M.P. Application of Earth Observation Data and Google Earth Engine for Monitoring Coral Reef Exposure to Environmental Stressors. Preprints 2021. [Google Scholar] [CrossRef]
  93. Santos, L.C.M.; Cunha-Lignon, M.; Schaeffer-Novelli, Y.; Cintrón-Molero, G. Long-term effects of oil pollution in mangrove forests (Baixada Santista, Southeast Brazil) detected using a GIS-based multitemporal analysis of aerial photographs. Braz. J. Oceanogr. 2012, 60, 159–170. [Google Scholar] [CrossRef]
  94. Dewidar, K.M.; Frihy, O.E. Automated techniques for quantification of beach change rates using Landsat series along the North-eastern Nile Delta, Egypt. J. Oceanogr. Mar. Sci. 2010, 1, 28–39. [Google Scholar]
  95. Tran Thi, V.; Tien Thi Xuan, A.; Phan Nguyen, H.; Dahdouh-Guebas, F.; Koedam, N. Application of remote sensing and GIS for detection of long-term mangrove shoreline changes in Mui Ca Mau, Vietnam. Biogeosciences 2014, 11, 3781–3795. [Google Scholar] [CrossRef]
  96. Zoysa, S.; Basnayake, V.; Samarasinghe, J.T.; Gunathilake, M.B.; Kantamaneni, K.; Muttil, N.; Pawar, U.; Rathnayake, U. Analysis of Multi-Temporal Shoreline Changes Due to a Harbor Using Remote Sensing Data and GIS Techniques. Sustainability 2023, 15, 7651. [Google Scholar] [CrossRef]
  97. Rondon, M.; Ewane, E.B.; Abdullah, M.M.; Watt, M.S.; Blanton, A.; Abulibdeh, A.; Burt, J.A.; Rogers, K.; Ali, T.; Reef, R.; et al. Remote sensing-based assessment of mangrove ecosystems in the Gulf Cooperation Council countries: A systematic review. Front. Mar. Sci. 2023, 10, 1241928. [Google Scholar] [CrossRef]
  98. Biçe, K.; Schalles, J.; Sheldon, J.E.; Alber, M.; Meile, C. Temporal patterns and causal drivers of aboveground plant biomass in a coastal wetland: Insights from time-series analyses. Front. Mar. Sci. 2023, 10, 1130958. [Google Scholar] [CrossRef]
  99. Marzialetti, F.; Cesarini, G.; Acosta, A.; Battisti, C. Testing effectiveness in nature reserve management using GIS-based tools: A 25 years monitoring of land use change in a Mediterranean coastal wetland. Wetl. Ecol. Manag. 2024, 32, 423–435. [Google Scholar] [CrossRef]
  100. White, L.; Ryerson, R.A.; Pasher, J.; Duffe, J. State of Science Assessment of Remote Sensing of Great Lakes Coastal Wetlands: Responding to an Operational Requirement. Remote Sens. 2020, 12, 3024. [Google Scholar] [CrossRef]
  101. Splinter, K.D.; Harley, M.D.; Turner, I.L. Remote Sensing Is Changing Our View of the Coast: Insights from 40 Years of Monitoring at Narrabeen-Collaroy, Australia. Remote Sens. 2018, 10, 1744. [Google Scholar] [CrossRef]
  102. El Serafy, G.Y.; Schaeffer, B.A.; Neely, M.B.; Spinosa, A.; Odermatt, D.; Weathers, K.C.; Baracchini, T.; Bouffard, D.; Carvalho, L.; Conmy, R.N.; et al. Integrating Inland and Coastal Water Quality Data for Actionable Knowledge. Remote Sens. 2021, 13, 2899. [Google Scholar] [CrossRef]
  103. Hamlington, B.D.; Tripathi, A.; Rounce, D.R.; Weathers, M.; Adams, K.H.; Blackwood, C.; Carter, J.; Collini, R.C.; Engeman, L.; Haasnoot, M.; et al. Satellite monitoring for coastal dynamic adaptation policy pathways. Clim. Risk Manag. 2023, 42, 100555. [Google Scholar] [CrossRef]
  104. Cavanaugh, K.C.; Bell, T.; Costa, M.; Eddy, N.E.; Gendall, L.; Gleason, M.G.; Hessing-Lewis, M.; Martone, R.; McPherson, M.; Pontier, O.; et al. A Review of the Opportunities and Challenges for Using Remote Sensing for Management of Surface-Canopy Forming Kelps. Front. Mar. Sci. 2021, 8, 753531. [Google Scholar] [CrossRef]
  105. Politi, E.; Paterson, S.K.; Scarrott, R.; Tuohy, E.; O’Mahony, C.; Cámaro-García, W.C. Earth observation applications for coastal sustainability: Potential and challenges for implementation. Anthr. Coasts 2019, 2, 306–329. [Google Scholar] [CrossRef]
Figure 1. Integrated remote-sensing framework for coastal-ecosystem health assessment.
Water 17 01971 g001
Figure 2. Accuracy comparison between traditional methods and artificial intelligence methods in coastal remote-sensing applications.
Water 17 01971 g002
Figure 3. Architecture of remote-sensing-based coastal-ecosystem health-assessment indicator system.
Water 17 01971 g003
Figure 4. Future development directions and technology roadmap for remote-sensing monitoring of coastal ecosystems [9,10,19,100,102,103].
Water 17 01971 g004
Table 1. Parameter comparison and application characteristics of commonly used remote-sensing satellite platforms in coastal-ecosystem monitoring.
Satellite PlatformSensorSpatial Resolution (m)Temporal Resolution (Days)Spectral RangeSpectral ResolutionCoastal Application AdvantagesMain Limitations
Optical Remote-Sensing Systems
Landsat 8/9OLI/TIRS30 (Vis-NIR)
15 (Pan)
100 (Thermal)
16 (single)
8 (combined)
0.43–12.51 μ m11 bandsRich historical data;
long-term coastline monitoring;
medium resolution for regional assessment.
Cloud coverage;
lower temporal resolution;
limited water penetration.
Sentinel-2MSI10 (Visible)
20 (Red Edge)
60 (Atm. corr.)
5 (dual sat.)0.44–2.19 μ m13 bandsRed edge bands for vegetation;
high temporal resolution;
detailed analysis;free data.
Less history (2015+);
no thermal bands;
cloud cover effects.
MODISTerra/Aqua250 (B1–2)
500 (B3–7)
1000 (Others)
10.4–14.4 μ m36 bandsDaily observation;
long time series;
wide-area monitoring;
water-quality dynamics.
Low spatial resolution;
mixed pixels;
not for small-scale studies.
WorldView-2/3WV110WV-2:
0.46 (Pan)
1.84 (MS)
WV-3:
0.31 (Pan)
1.24 (MS)
WV-2:
2.5–5
WV-3:
1.1 (point)
0.4–1.04 μ m8 bands
(WV-2)
16 bands
(WV-3)
Ultra-high resolution;
detailed features;
small area studies;
water depth.
High cost;
small coverage;
unstable acquisition;
complex processing.
Sentinel-3OLCI300≤2 (dual sat.)0.4–1.02 μ m21 bandsOcean color optimized;
global monitoring;
high frequency;
water-quality accuracy.
Lower spatial resolution;
mixed coastal pixels;
land boundary effects.
UAV
Systems
Multi/
RGB
0.01–0.2Flexible0.4–0.9 μ m4–6 bandsUltra-high resolution;
flexible;
below clouds;
small area details.
Limited coverage;
wind constraints;
regulations;
processing workload.
Radar Remote-Sensing Systems
Sentinel-1C-SAR5 × 20 (IW)6 (dual sat.)C-band
(5.4 GHz)
VV, VH,
HH, HV
All-weather;
cloud penetration;
coastline/wetland monitoring;
tidal observation.
Speckle noise;
complex interpretation;
processing requirements.
ALOS-2PALSAR-23–10 (High)
100 (ScanSAR)
14L-band
(1.2 GHz)
Single/
Dual/
Quad pol . 1
Strong penetration;
mangrove/wetland monitoring;
biomass;
deformation.
Low temporal resolution;
high cost;
processing requirements.
Note: 1 pol.: polarization, including single, dual, and quad polarization modes.
Table 2. Performance comparison of machine-learning and deep-learning algorithms in coastal remote-sensing applications.
Algorithm TypeSpecific AlgorithmApplication ScenariosAccuracy AssessmentData RequirementsMain AdvantagesMain LimitationsTypical Studies
Traditional machine learningRandom forestLand cover classification;
wetland mapping;
water-quality parameter estimation.
Overall accuracy: 90–96.80%Medium-scale training samples;
multi-source features
Strong capability in handling high-dimensional data;
resistance to overfitting;
provides variable importance assessment;
high computational efficiency.
Limited capability in complex boundary classification;
relatively weak interpretability.
Agate et al. [44]
Balogun et al. [50]
Munizaga et al. [51]
Support vector machine (SVM)Land cover classification;
water-quality parameter inversion;
mangrove monitoring.
Overall accuracy: up to 97.6%
R value: approximately 0.9
Smaller sample sets;
moderate feature dimensions
Excellent performance with small samples;
robust boundary decisions;
can handle non-linear problems through kernel functions.
Higher computational complexity;
difficult parameter optimization;
limited capacity for large-scale data processing.
Lemenkova [45]
Hafeez et al. [25]
Gaussian process regression (GPR)Bathymetry;
parameter inversion;
coastal topography.
R 2 : up to 0.97
RMSE: as low as 1.23 m
Small to medium-scale training samples;
high-quality labels
Provides prediction uncertainty estimates;
adapts to non-linear relationships;
excellent interpolation performance.
Computational cost increases rapidly with sample size;
difficulty handling large datasets.
Ashphaq et al. [46]
Alevizos [52]
Ensemble learningMangrove mapping;
wetland classification;
coastline change.
Overall accuracy: 95–99%Multi-source data;
medium-sized training samples
Integrates advantages of multiple algorithms;
improves classification prediction accuracy;
strong robustness.
High computational resource requirements;
complex parameter tuning;
potential for overfitting.
Liu et al. [53]
Deep learningConvolutional neural network (CNN)Land cover classification;
coastal zone classification;
water-quality monitoring.
Overall accuracy: 93.78%Large training samples;
high computational resources
Automatic feature extraction;
utilization of spatial context;
strong ability to process complex multi-source data.
Requires large training datasets;
high computational resource demands;
black-box characteristics.
Feng et al. [47]
Liu et al. [48]
U-NetCoastal zone classification;
wetland mapping;
coastline extraction.
Overall accuracy: 93.65%Medium training samples;
high-resolution imagery
Strong semantic segmentation capability;
accurate boundary preservation;
multi-scale feature fusion.
Complex training process;
difficult model tuning;
risk of overfitting.
Liu et al. [48]
Zhu et al. [54]
Hybrid deep networks (CNN-LSTM)Harmful algal bloom detection;
spatiotemporal dynamic analysis;
change prediction.
Overall accuracy: 91%Time-series data;
large sample size
Combines spatial features with time series;
dynamic prediction capability;
multi-modal data integration.
High network complexity;
long training cycles;
difficult parameter optimization.
Hill et al. [49]
Mixture density networks (MDN)Chlorophyll-a retrieval;
water-quality parameter estimation.
MAE and bias reduced by 40–60%Large multi-source training dataProvides probabilistic distribution predictions;
uncertainty quantification;
adapts to complex non-linear relationships.
Complex network structure;
difficult to understand and interpret;
high computational cost.
Pahlevan et al. [55]
Deep learningHybrid methods (CNN + OBIA)Coastal land-use mapping;
complex environment classification.
Overall accuracy: 93.5%High-resolution imagery;
segmentation parameters.
Combines object and pixel advantages;
hierarchical analysis;
strong adaptability to heterogeneous landscapes.
Complex implementation;
sensitive segmentation parameters;
difficult method standardization.
Zaabar et al. [56]
Application scenario comparisonBathymetryTraditional methods: R 2 = 0.87
Gaussian process regression: R 2 = 0.95–0.97
Gaussian process regression and deep learning perform better in complex terrains and turbid waters;
better handling of non-linear relationships;
provides uncertainty estimates.
Land-cover classificationTraditional methods: 85–90%
CNN methods: >93%
CNN-based methods show significant advantages in processing spatial context;
better performance in complex and mixed pixel environments;
but require more computational resources and training data.
Water-quality parameter estimationTraditional empirical methods: R 2 = 0.7–0.8
Machine-learning methods: R 2 = 0.85–0.91
Ensemble methods and deep learning better capture complex relationships;
improved estimation accuracy in turbid waters;
reduced bias;
but require model structure adjustments for different water body types.
Table 3. Classification and characteristics of the main remote-sensing indicator system for coastal-ecosystem health assessment.
Indicator CategorySpecific IndicatorsCalculation Method/Remote- Sensing Data SourceApplication AccuracyApplicable EcosystemsAdvantagesLimitations
Water-quality indicatorsChlorophyll-a
(Chl-a)
Blue/green ratio method;
red/near-infrared ratio method;
fluorescence line height (FLH);
machine-learning models.
R 2 = 0.62 0.95 Estuaries;
shallow seas;
coral reefs;
lakes.
Eutrophication status assessment;
primary productivity indication;
water biological activity evaluation.
Accuracy decreases in turbid waters;
affected by suspended solids;
requires regionalized algorithms.
Suspended matter
(TSM/SPM/TSS)
Single-band or band ratio methods;
semi-analytical algorithms;
multi-condition algorithms;
machine-learning-based models.
R 2 = 0.67 0.92
RMSE = 3.93–12.7 mg/L
Estuaries;
tidal flats;
shallow seas;
harbors.
Sediment dynamics monitoring;
turbidity assessment;
human activity impact analysis.
Saturation in high-concentration waters;
optimal model selection needed for concentration ranges.
Water transparency (SD/turbidity)Direct estimation of Secchi disk depth;
indirect estimation based on Chl-a and suspended matter.
R 2 = 0.67 0.85 Seagrass beds;
coral reefs;
clear coastal waters.
Underwater light condition assessment;
underwater ecosystem health evaluation.
Lower accuracy;
affected by multiple factors;
indirect measurement characteristics.
Vegetation and ecosystem function indicatorsVegetation indices (NDVI/EVI/ SAVI)NDVI = (NIR − Red)/(NIR + Red)
EVI = 2.5 × [(NIR − Red)/(NIR + 6 × Red − 7.5 × Blue + 1)]
SAVI = (NIR − Red)/(NIR + Red + L) × (1 + L)
Detection accuracy >90%Mangroves;
salt marshes;
wetlands;
coastal vegetation.
Vegetation vigor assessment;
photosynthetic efficiency indication;
ecosystem function evaluation.
NDVI saturates in C
affected by soil background;
sensitive to tidal state.
Biomass estimationEmpirical relationships based on NDVI;
radar backscattering coefficient-based;LiDAR point cloud analysis.
Accuracy 58–80%
Percentage cover conversion
R 2 = 0.89–0.96
Mangroves;
salt marshes;
seagrass;
wetlands.
Carbon sequestration assessment;
productivity indication;
structural complexity analysis.
Saturation in high biomass areas;
spatial heterogeneity impact;
field calibration needed.
Leaf area index (LAI)Inversion based on vegetation indices;
radiation transfer models;
machine-learning methods.
R 2 = 0.539
NRMSE = 0.32
Mangroves;
dalt marshes;
coastal vegetation.
Photosynthetic surface area assessment;
ecosystem function indicator;
canopy structure analysis.
Significantly affected by tides;
reduced accuracy in closed canopies;
field validation required.
Ecosystem productivity (GPP/fPAR)Correlation analysis between EVI and gross primary productivity;
fraction of photosynthetically active radiation absorption estimation.
R 2 = 0.65
(GPP-EVI)
Salt marshes;
wetlands;
mangroves.
Ecosystem functional state assessment;
carbon cycle analysis;
health status indication.
Auxiliary meteorological data needed;
large regional differences in model parameters;
seasonal fluctuations.
Human disturbance and landscape change indicatorsLand cover/land-use changeMulti-temporal remote-sensing classification;
change detection;
supervised/unsupervised classification;
object-based classification.
Overall accuracy
80–95%
All coastal ecosystems.Landscape transformation assessment;
urbanization impact analysis;
habitat loss monitoring.
Mixed pixel problems;
non-uniform classification systems;
temporal consistency difficulties.
Coastline changeWaterline method;
multi-temporal image analysis;
digital shoreline analysis system (DSAS);
NDVI/MNDWI threshold method.
Average accuracy ≈ 12.63 m
detection rate ≈ 96%
Beaches;
headlands;
estuaries;
intertidal zones.
Erosion/accretion assessment;
sea-level rise impact analysis;
coastal engineering effect monitoring.
Heavily influenced by tidal state;
ambiguous definition;
seasonal change interference.
Landscape fragmentationLandscape ecology index calculation;
patch density;
edge density;
connectivity indices.
Dependent on base classification accuracyMangroves;
coastal wetlands;
estuarine systems.
Habitat integrity assessment;
ecosystem connectivity analysis;
human disturbance evaluation.
Spatial resolution limitations;
subjective edge definition;
difficult ecological meaning interpretation.
Nighttime light intensityDMSP-OLS/VIIRS nighttime light data analysis;
multi-temporal change detection.
Used as proxy indicator of human activity intensityUrbanized coasts;
tourist coastlines;
ports.
Urban expansion monitoring;
development intensity assessment;
spatiotemporal pattern analysis of human activities.
Lower spatial resolution;
light spillover effect;
cannot distinguish activity types.
Table 4. Applicable remote-sensing technologies and monitoring accuracy for different coastal ecosystem types.
Ecosystem TypePreferred Remote- Sensing TechnologyKey Monitoring IndicatorsMonitoring AccuracyMain ChallengesTypical Application Cases
Mangrove ecosystemHigh-resolution multispectralVegetation indices (EVI, NDII, PRI, CRI1, VOG1, and MCARI); canopy coverage; health status.59% of regions classified as healthiest
11% classified as less healthy
Difficulty in species differentiation; tidal state influences; mixed pixel issues.Kumar et al. [79]: AVIRIS-NG hyperspectral data (425 bands, 5 m resolution) for classification and assessment of Indian mangroves.
SAR (L-band)Tree height; biomass; structural parameters; sediment characteristics; moisture conditions.Overall accuracy: 89.79%
Kappa coefficient: 0.858
Speckle noise interference; complex interpretation of backscattering; professional requirements for data processing.Bian et al. [28]: Time-series SAR coherence and intensity analysis for wetland vegetation classification.
Multi-source fusion MethodsVegetation indices (NDVI, SAVI, OSAVI, and TDVI); species trends; ecological health status.Net mangrove loss: 11.9%
Mangrove gain: 3.9%
Other accuracy data not specifically provided
Temporal inconsistency of data sources; complex fusion algorithms; validation difficulties.Bhadra et al. [80]: combining Sentinel-2 and Landsat 9, finding decreasing trends in freshwater-loving mangroves and increasing trends in salt-tolerant mangroves.
Salt marsh ecosystemSub-meter resolution optical imagerySalt marsh area; coastline changes; vegetation coverage; temporal change rates.Annual change rate: decreased from 13.4 ha/year to 2.1 ha/year lossHigh cost; cloud cover limitations; rough surface shadow issues.Campbell [81]: Quickbird-2 and WorldView-2 sub-meter resolution imagery for monitoring salt marshes in Jamaica Bay, USA.
Multispectral UAVMicro-topography; hydrological patterns; vegetation health status; restoration process monitoring.Spatial resolution: 3–12 cm
Salt marsh area increase: 142% (within four years)
Small coverage area; flexible deployment; can operate below cloud cover.Lanceman et al. [82]: multispectral UAV imagery (3–12 cm resolution) for monitoring wetland restoration processes.
Long time-series LandsatNDVI thresholds; coastline dynamics; salt marsh changes; spatial differences.Regional retreat: >66 m
Regional advance: approximately 2 m
Resolution limitations; severe mixed pixel issues; temporary water body confusion.Castro et al. [13]: NDVI threshold method for 38-year (1984–2022) coastline change analysis of salt marshes in Aveiro Lagoon, Portugal.
Coral reef ecosystemHigh-resolution satellite imageryCoral coverage; coral bleaching degree; coral types; spectral diversity index.Health status classification accuracy: 96%Water absorption and scattering; water depth limitations; complex atmospheric correction.Collin and Planes [83]: WorldView-2 high-resolution satellite imagery (0.5 m resolution), combined with spectral diversity index.
Hyperspectral sensorsCoral health status; pigment changes; algal coverage; surface reflection characteristics.Specific accuracy data not clearly providedMassive data volume; complex processing; feature extraction difficulties.Leiper [84]: hyperspectral sensor data outperforms conventional multispectral data in capturing subtle health changes in coral reefs.
Long-term time-series monitoringLong-term changes in coral coverage; bleaching event impacts; recovery conditions.Coral coverage decline: 79–92%Sensor consistency; water-quality change interference; tidal state impacts.Palandro et al. [3]: Landsat time-series data (1983–1999) recording significant decline in coral coverage.
Seagrass bed ecosystemMultispectral remote sensingCoverage area; density; distribution patterns; biomass.Seagrass coverage area increase: 39% (14.16 km²)Water depth limitations; water transparency dependency; substrate interference.Cingano et al. [85]: Landsat 5 and 8 data, using random forest algorithm for analysis of seagrass communities in Grado and Marano Lagoons, Italy.
Specialized band combinationsBlue, green, and near-infrared wavelengths; differentiation between algae and seagrass.Percentage cover conversion R 2 : 0.96 and 0.89Strong site specificity; local calibration needed; seasonal change interference.Bannari et al. [43]: study of various vegetation indices found blue, green, and near-infrared wavelengths particularly important for seagrass and algae detection.
Estuary and intertidal systemsSAR and optical fusionIntertidal zone range; sediment types; hydrodynamic processes; waterline extraction.Waterline method accuracy error: 19–25 cmStrong tidal phase dependency; topographic slope influence; SAR speckle interference.Salameh et al. [27]: improved waterline method showing only 19–25 cm error compared to LiDAR.
Continuous change detection algorithmsDynamic changes; land-cover transitions; topographic evolution; ecological transition zones.Annual reduction trend: approximately 2.6 km²/yearShort-term fluctuation interference; seasonal noise; algorithm complexity.Yang et al. [86]: DECODE algorithm for analyzing changes in tidal wetlands in the northeastern United States from 1986 to 2020.
Disclaimer/Publisher’s Note: The statements, opinions and data contained in all publications are solely those of the individual author(s) and contributor(s) and not of MDPI and/or the editor(s). MDPI and/or the editor(s) disclaim responsibility for any injury to people or property resulting from any ideas, methods, instructions or products referred to in the content.

