
Quantitative Detection of Floating Debris in Inland Reservoirs Using Sentinel-1 SAR Imagery: A Case Study of Daecheong Reservoir

 , ,
, ,  and
and 
Abstract
1. Introduction
2. Study Area and Materials
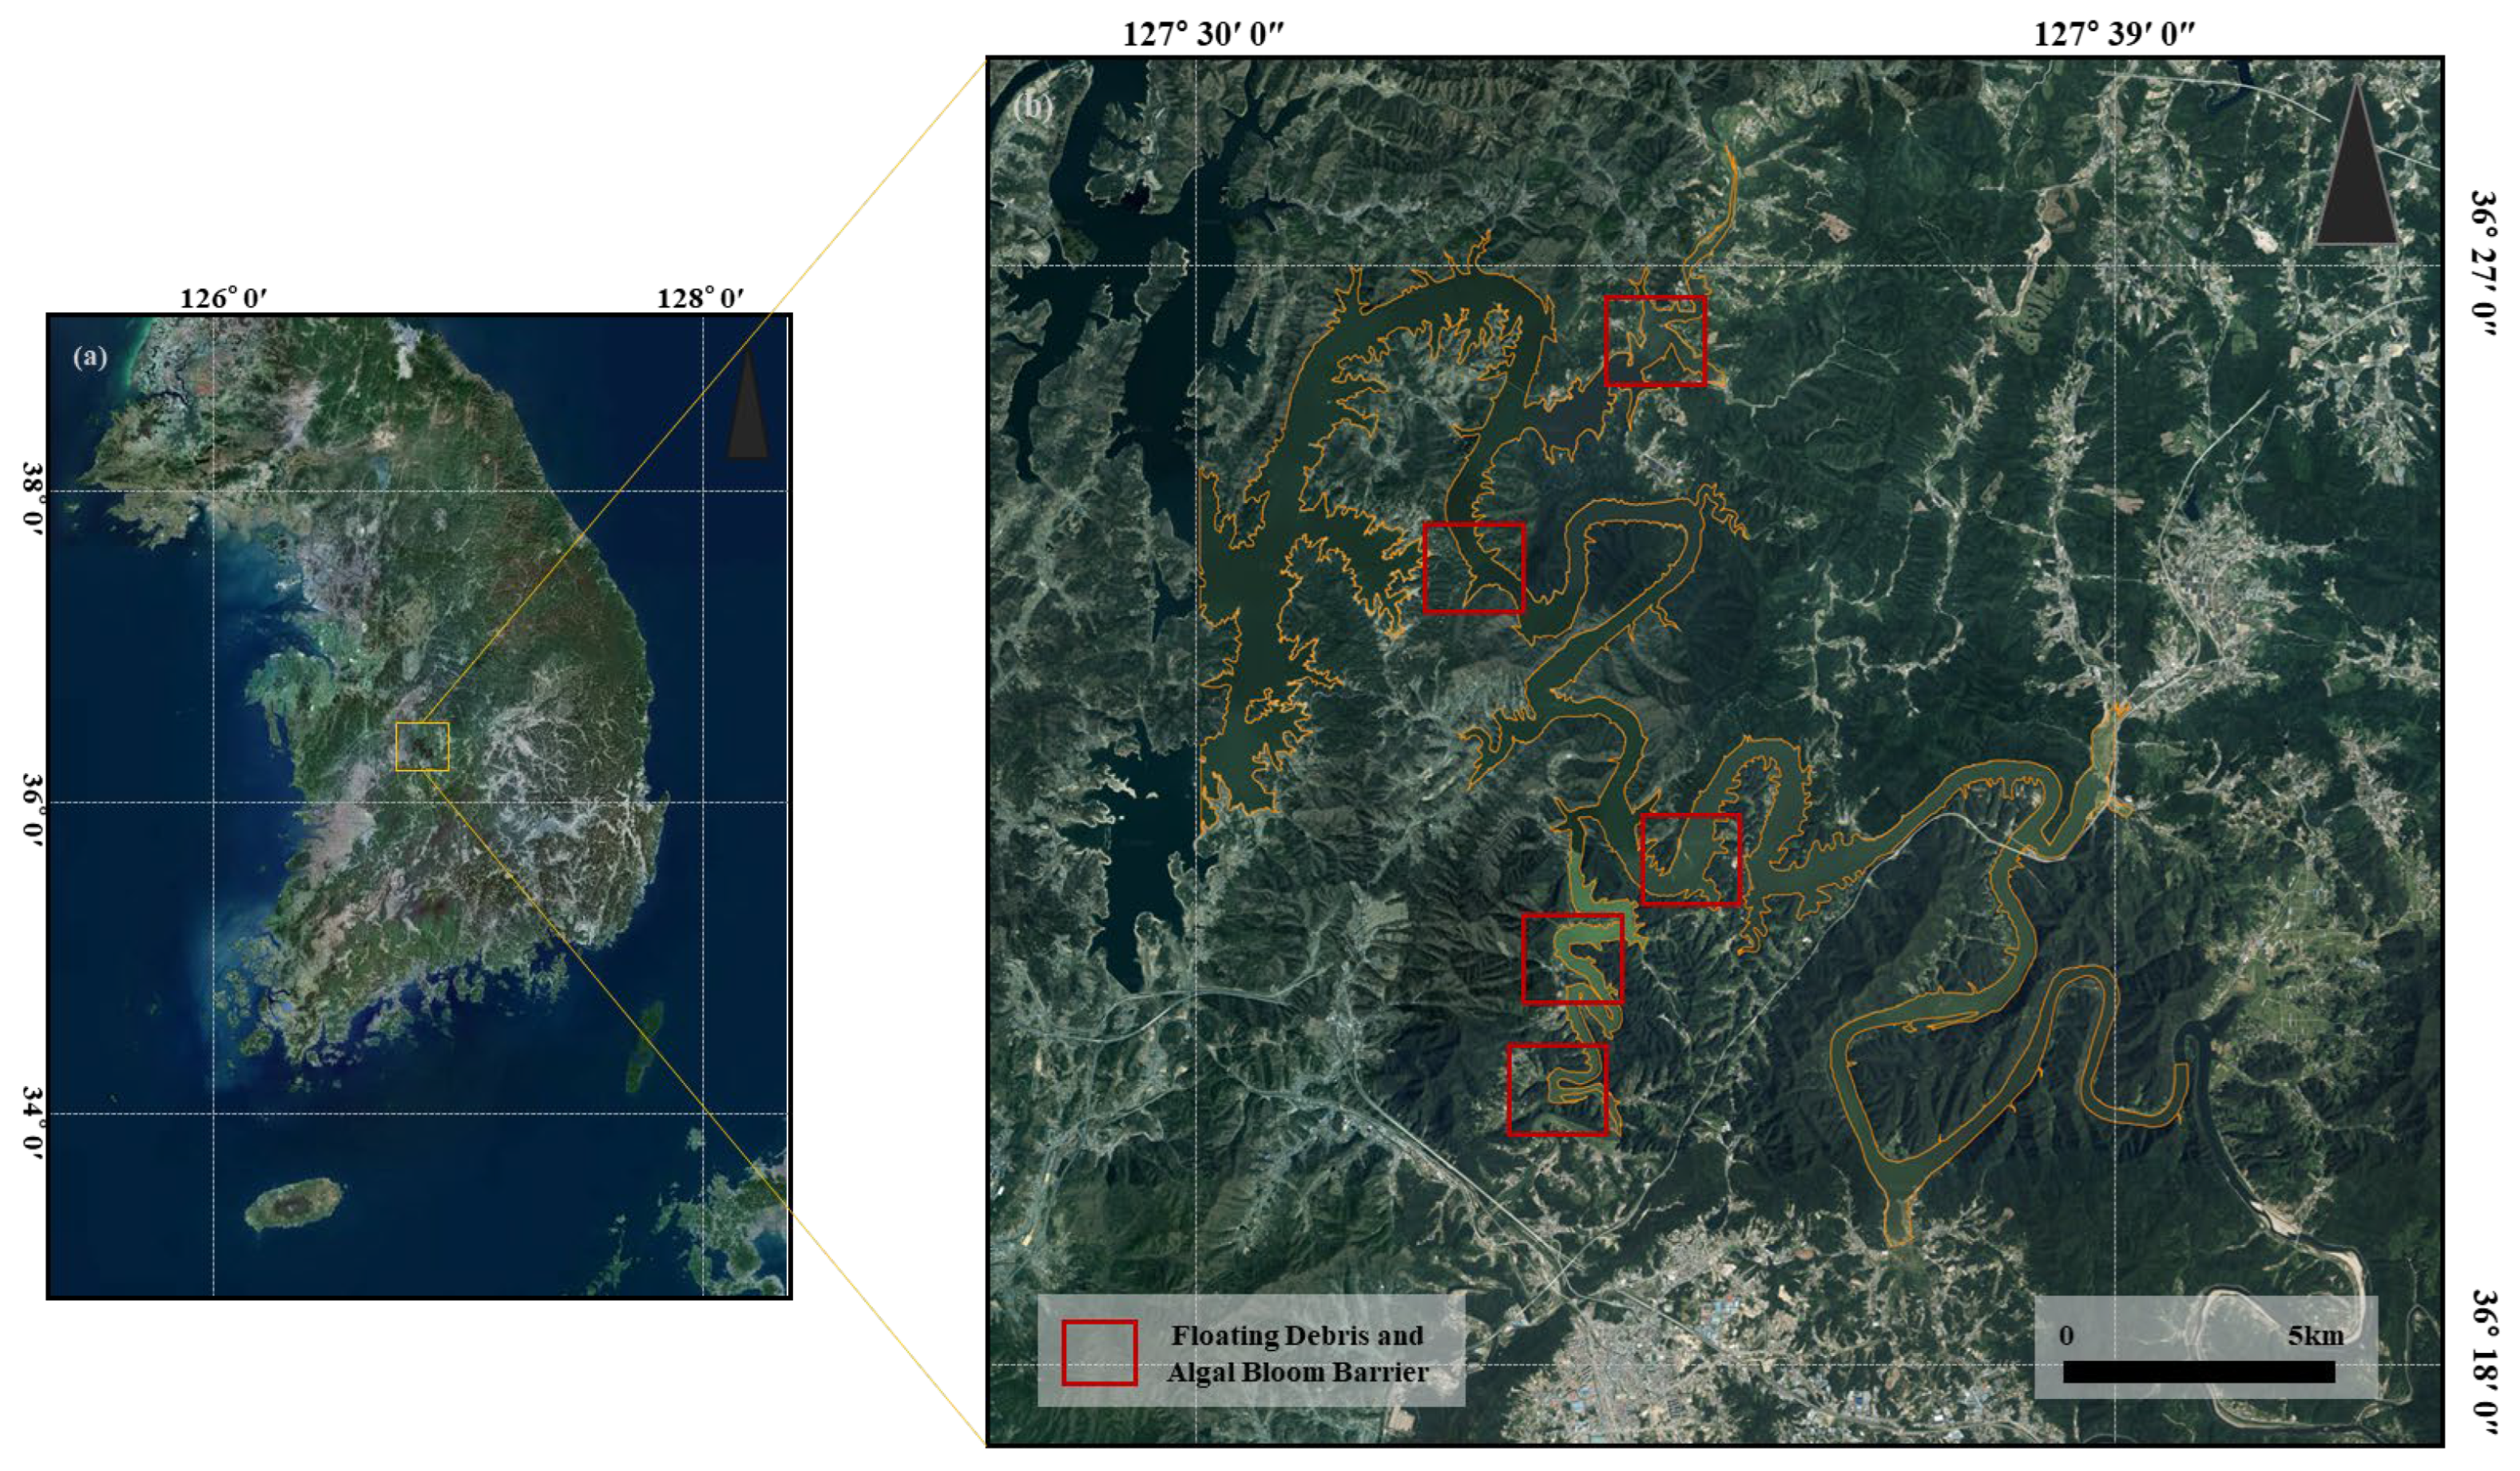
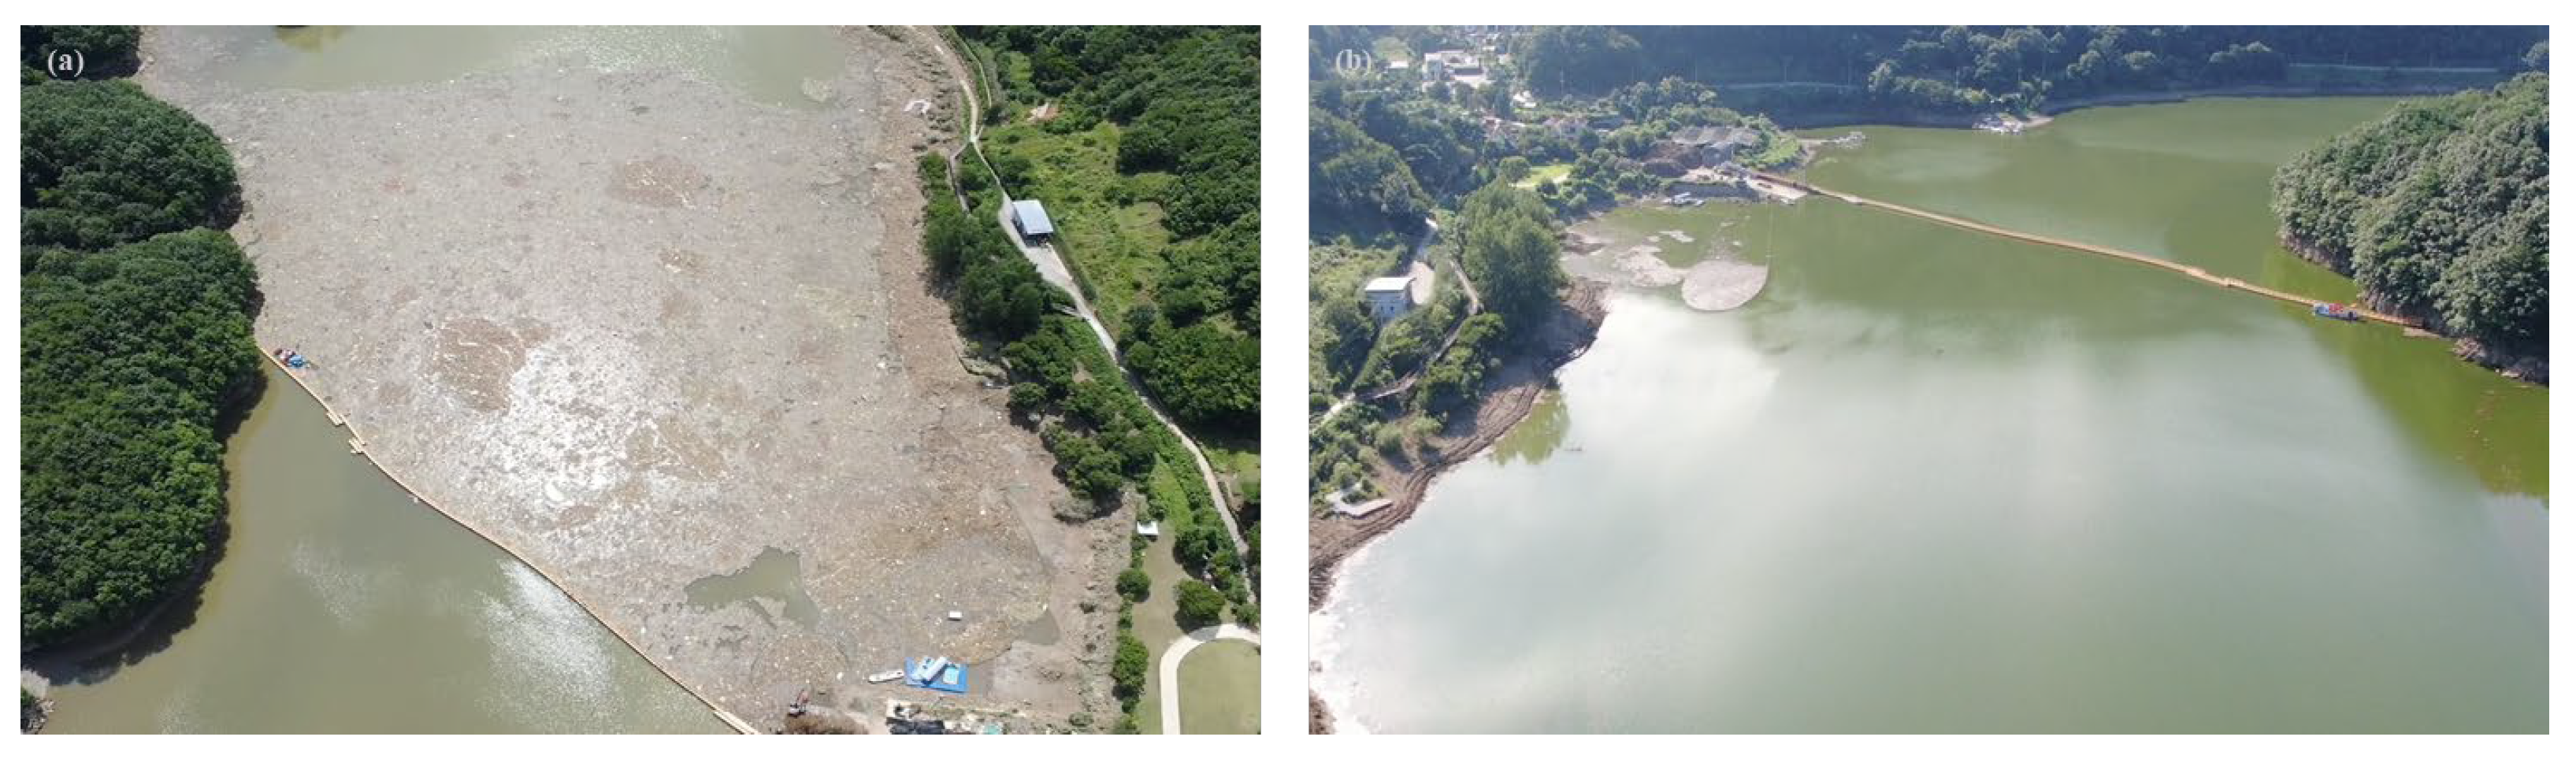
2.1. Study Area
2.2. Dataset
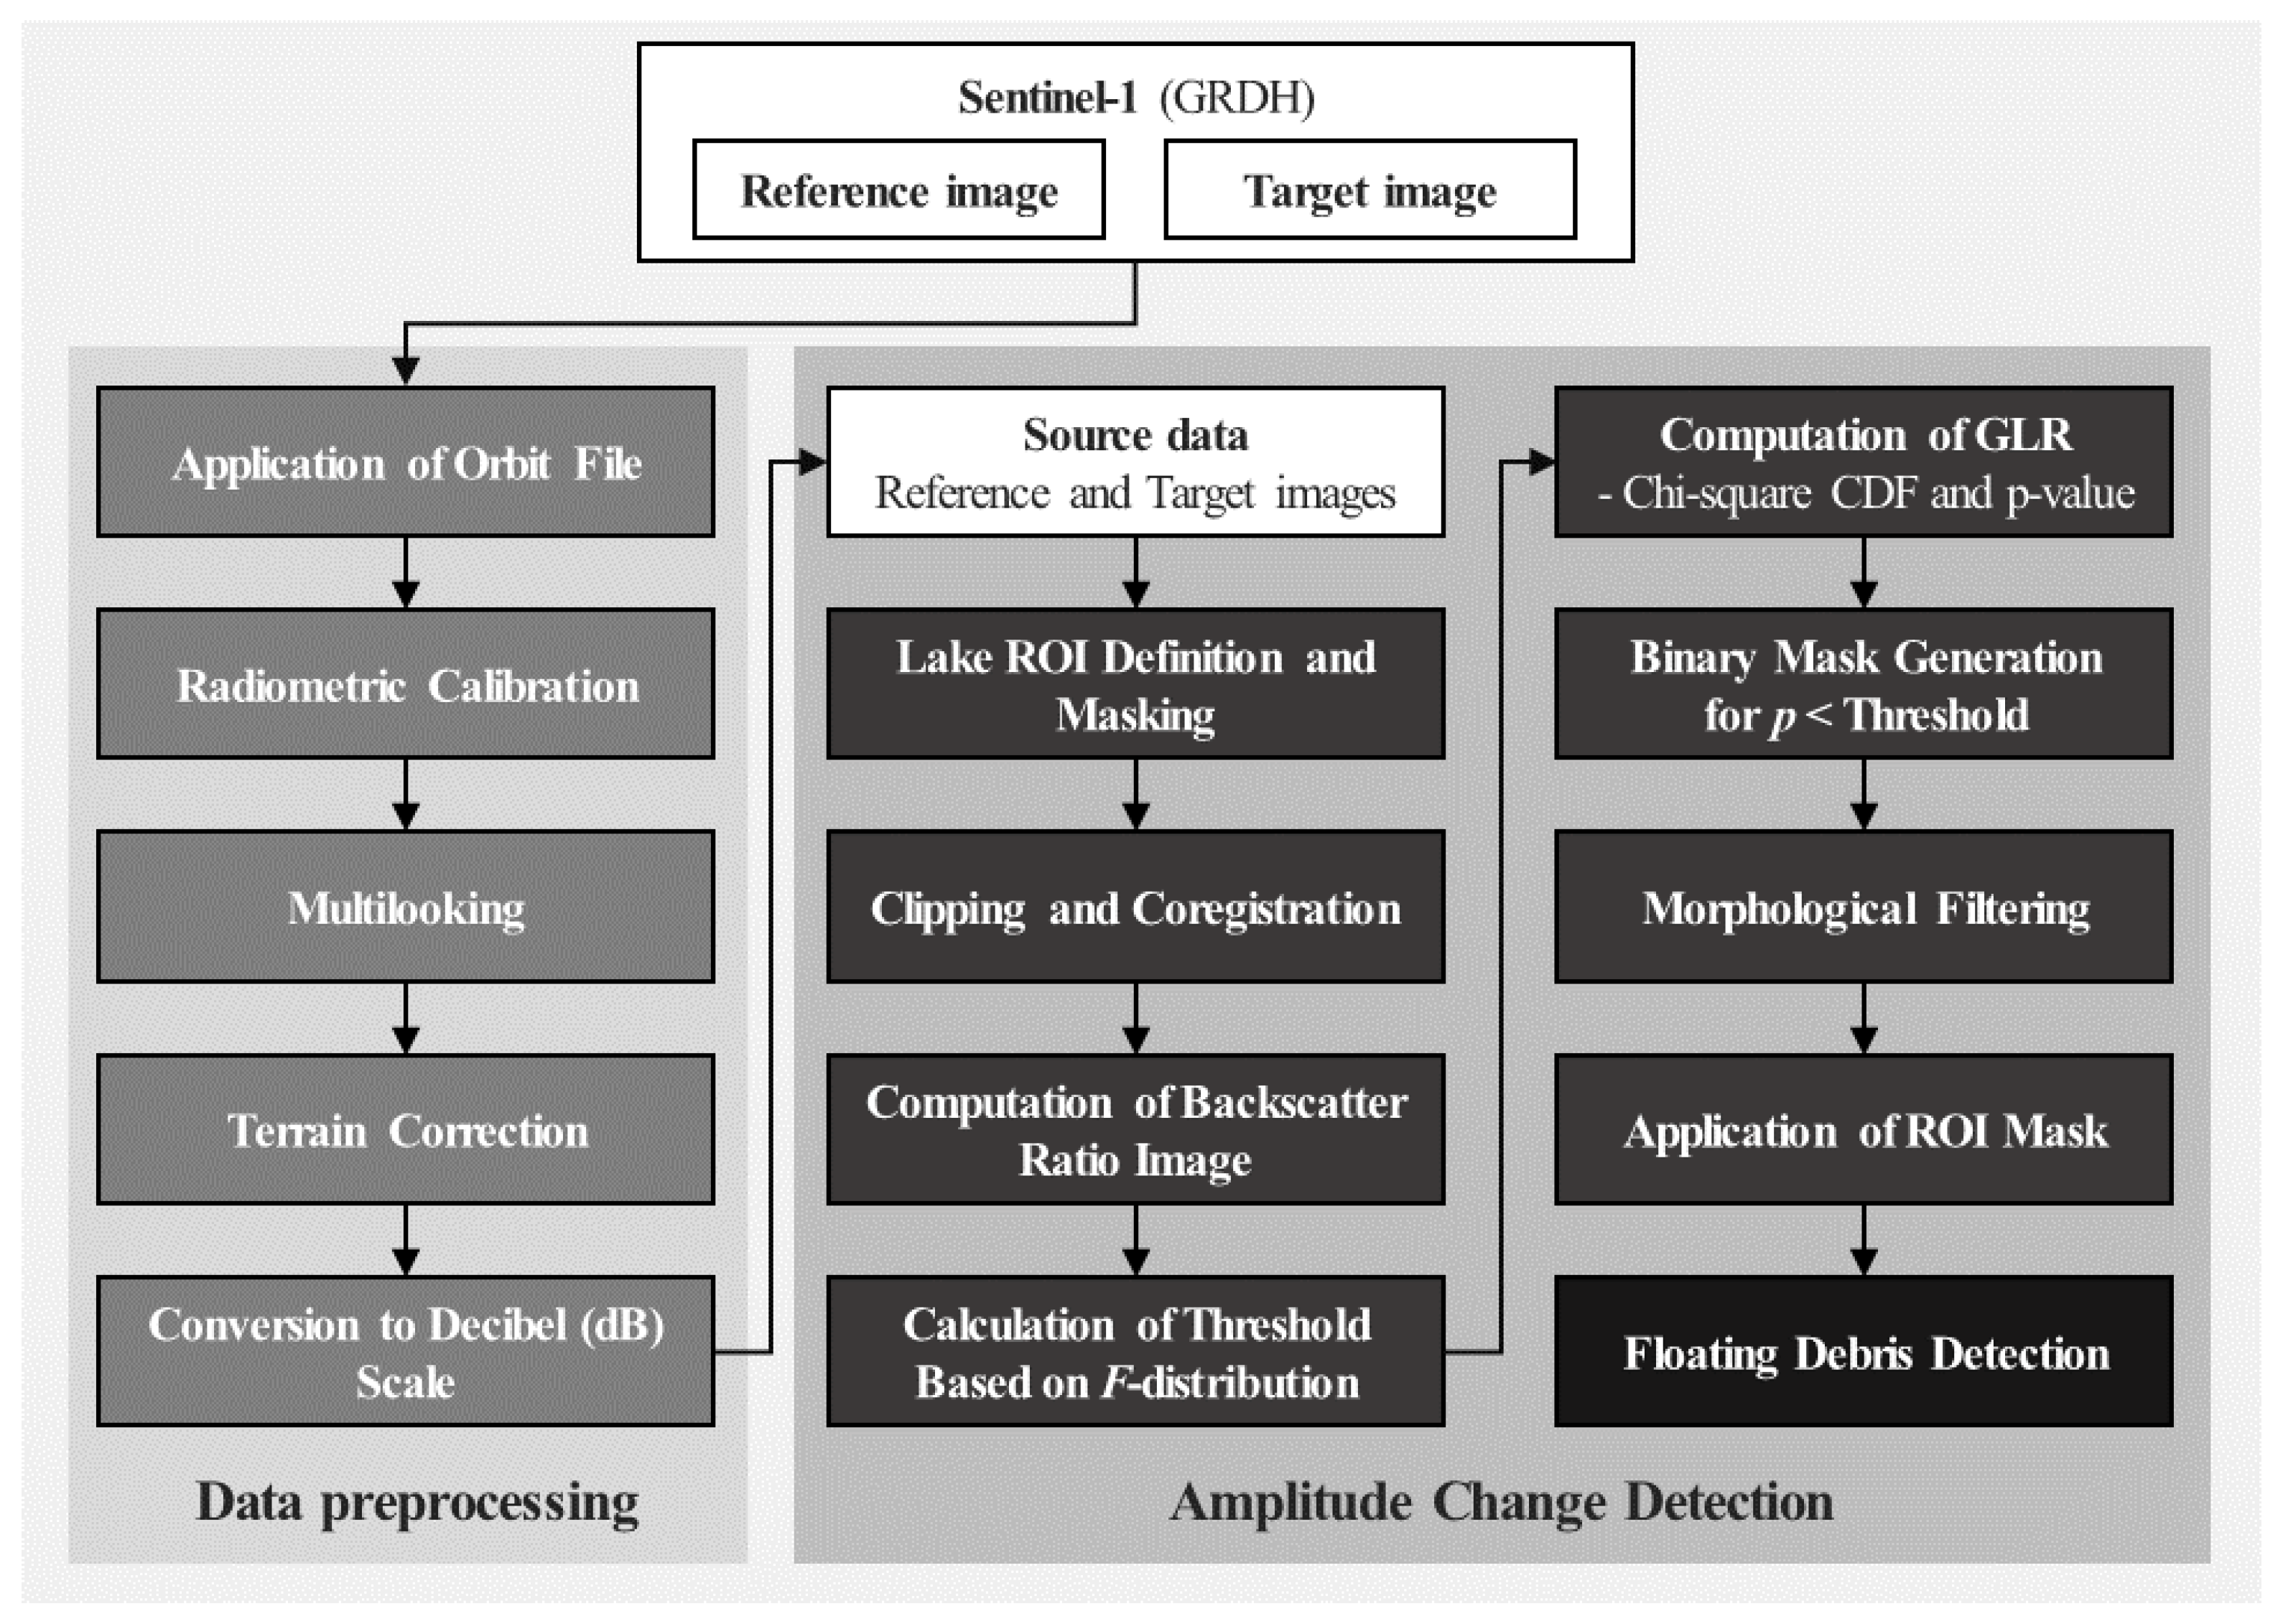
3. Methodology
4. Results and Discussions
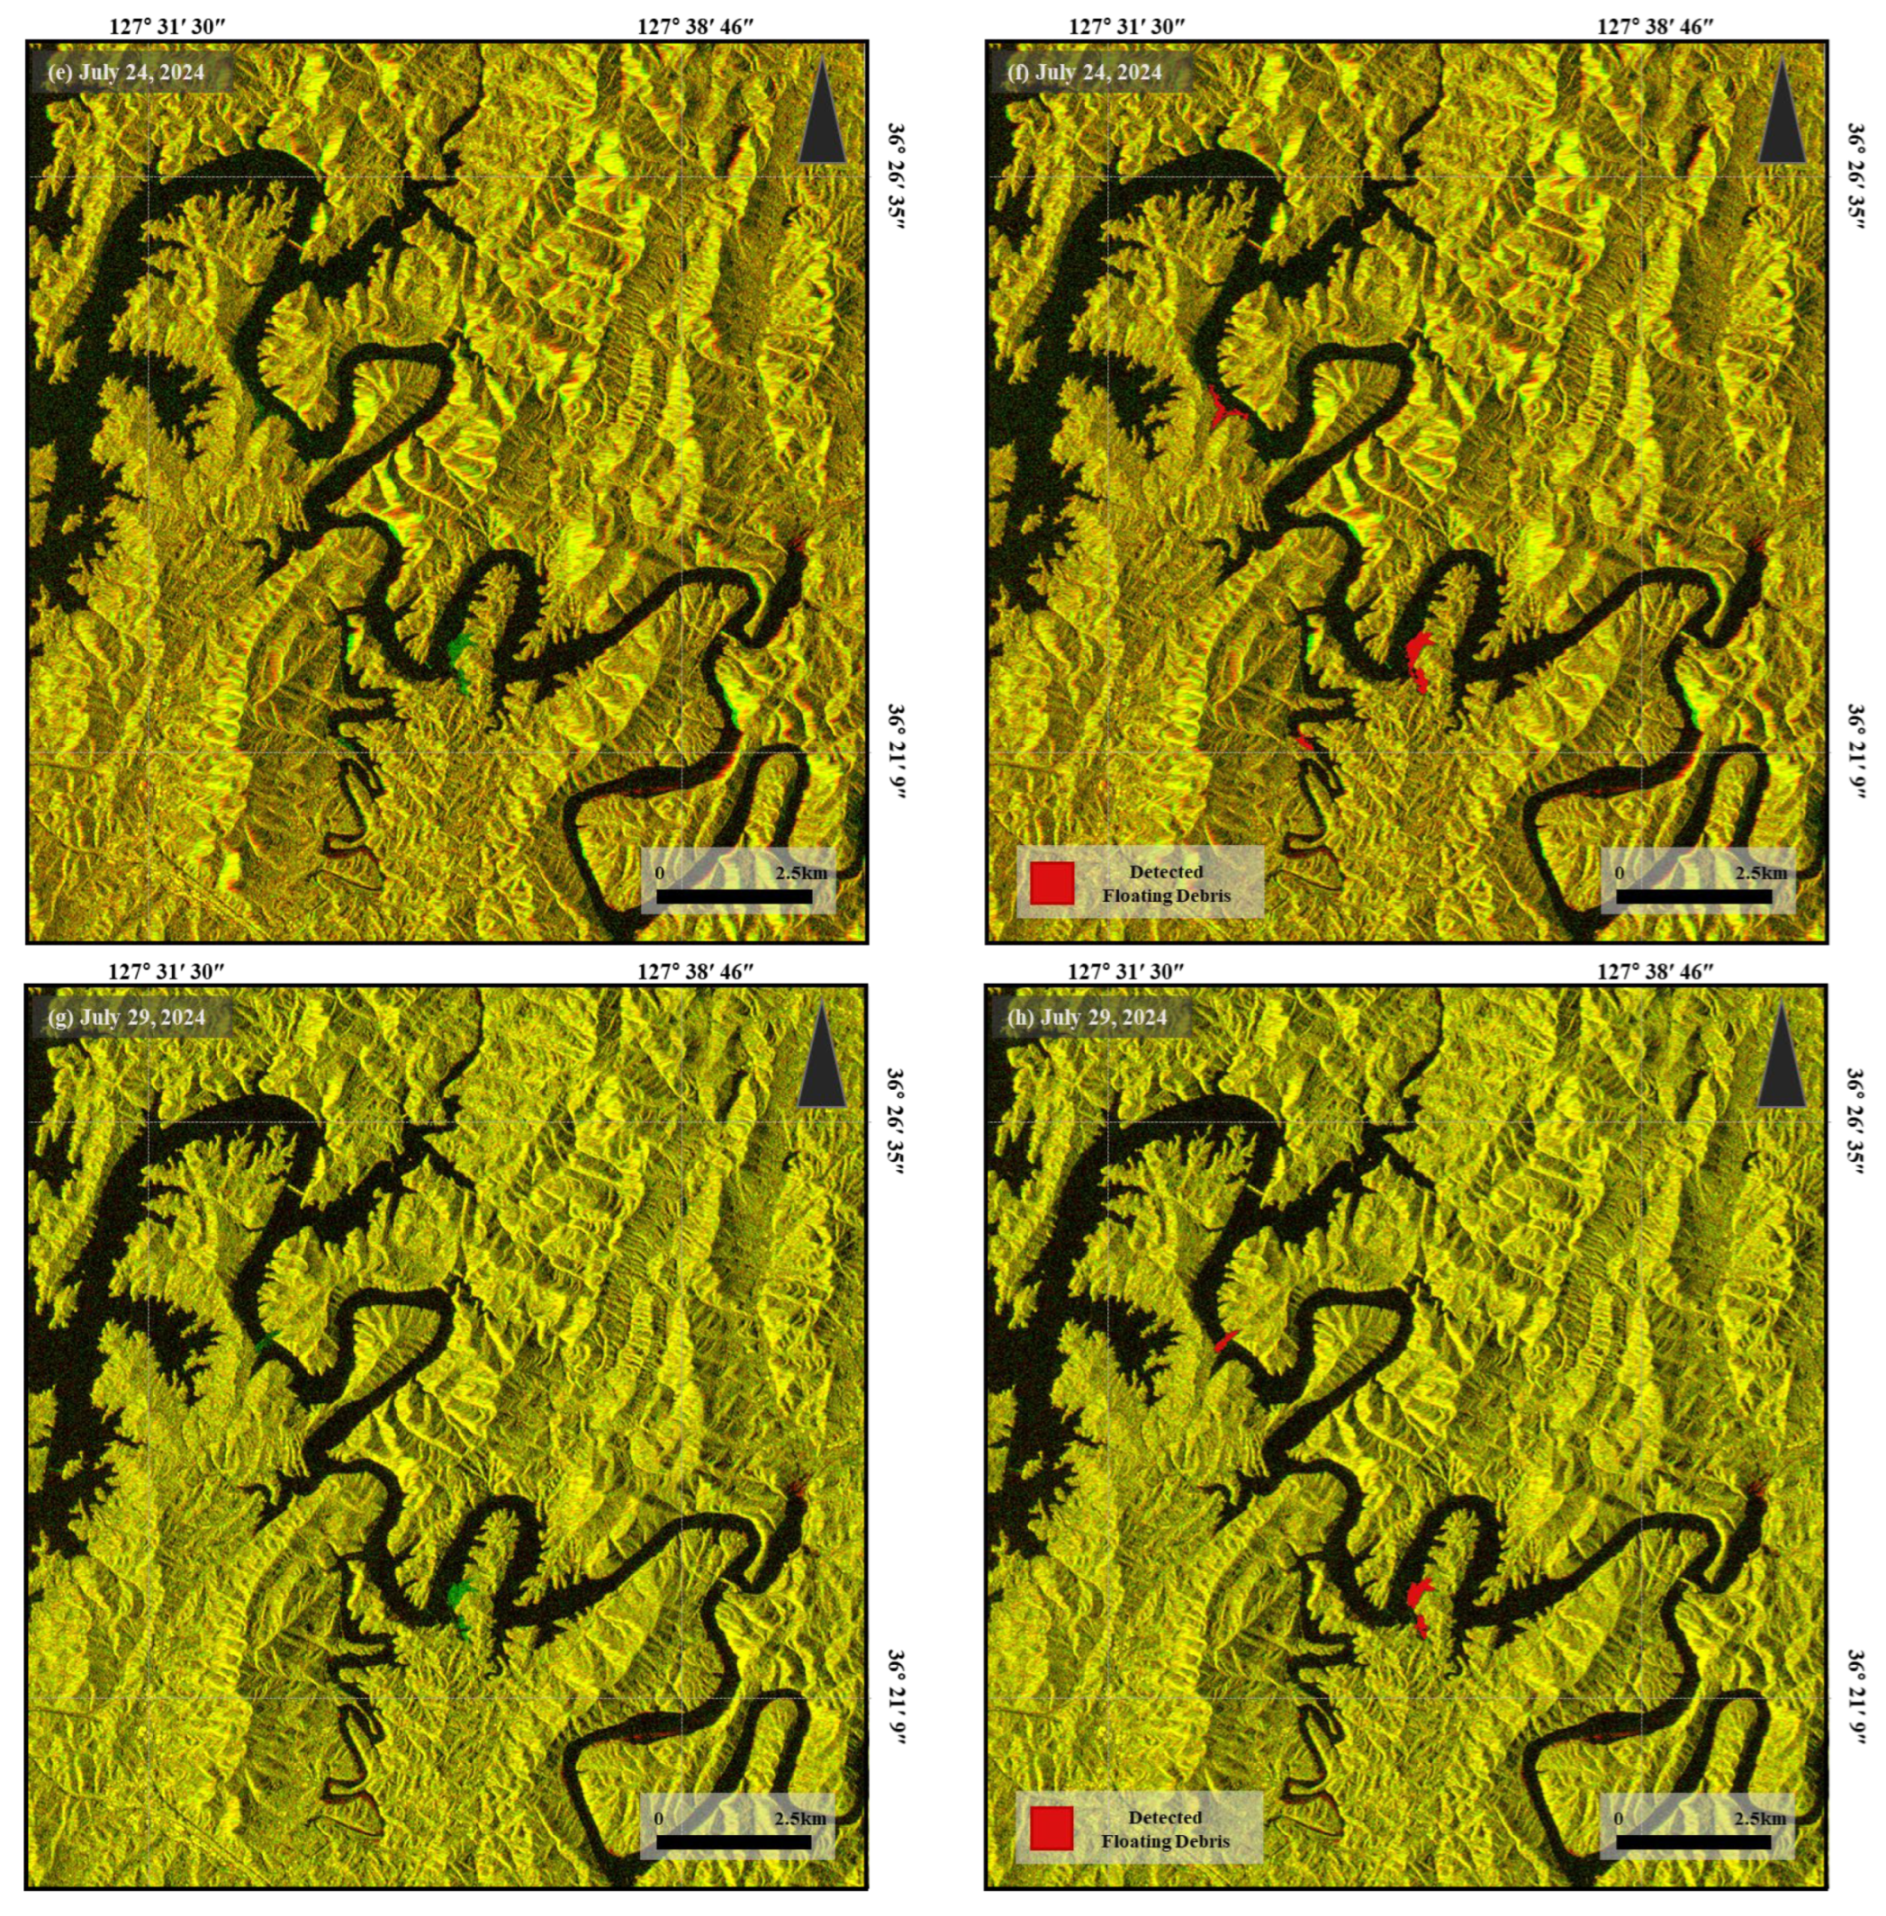
4.1. Results of Floating Debris Detection
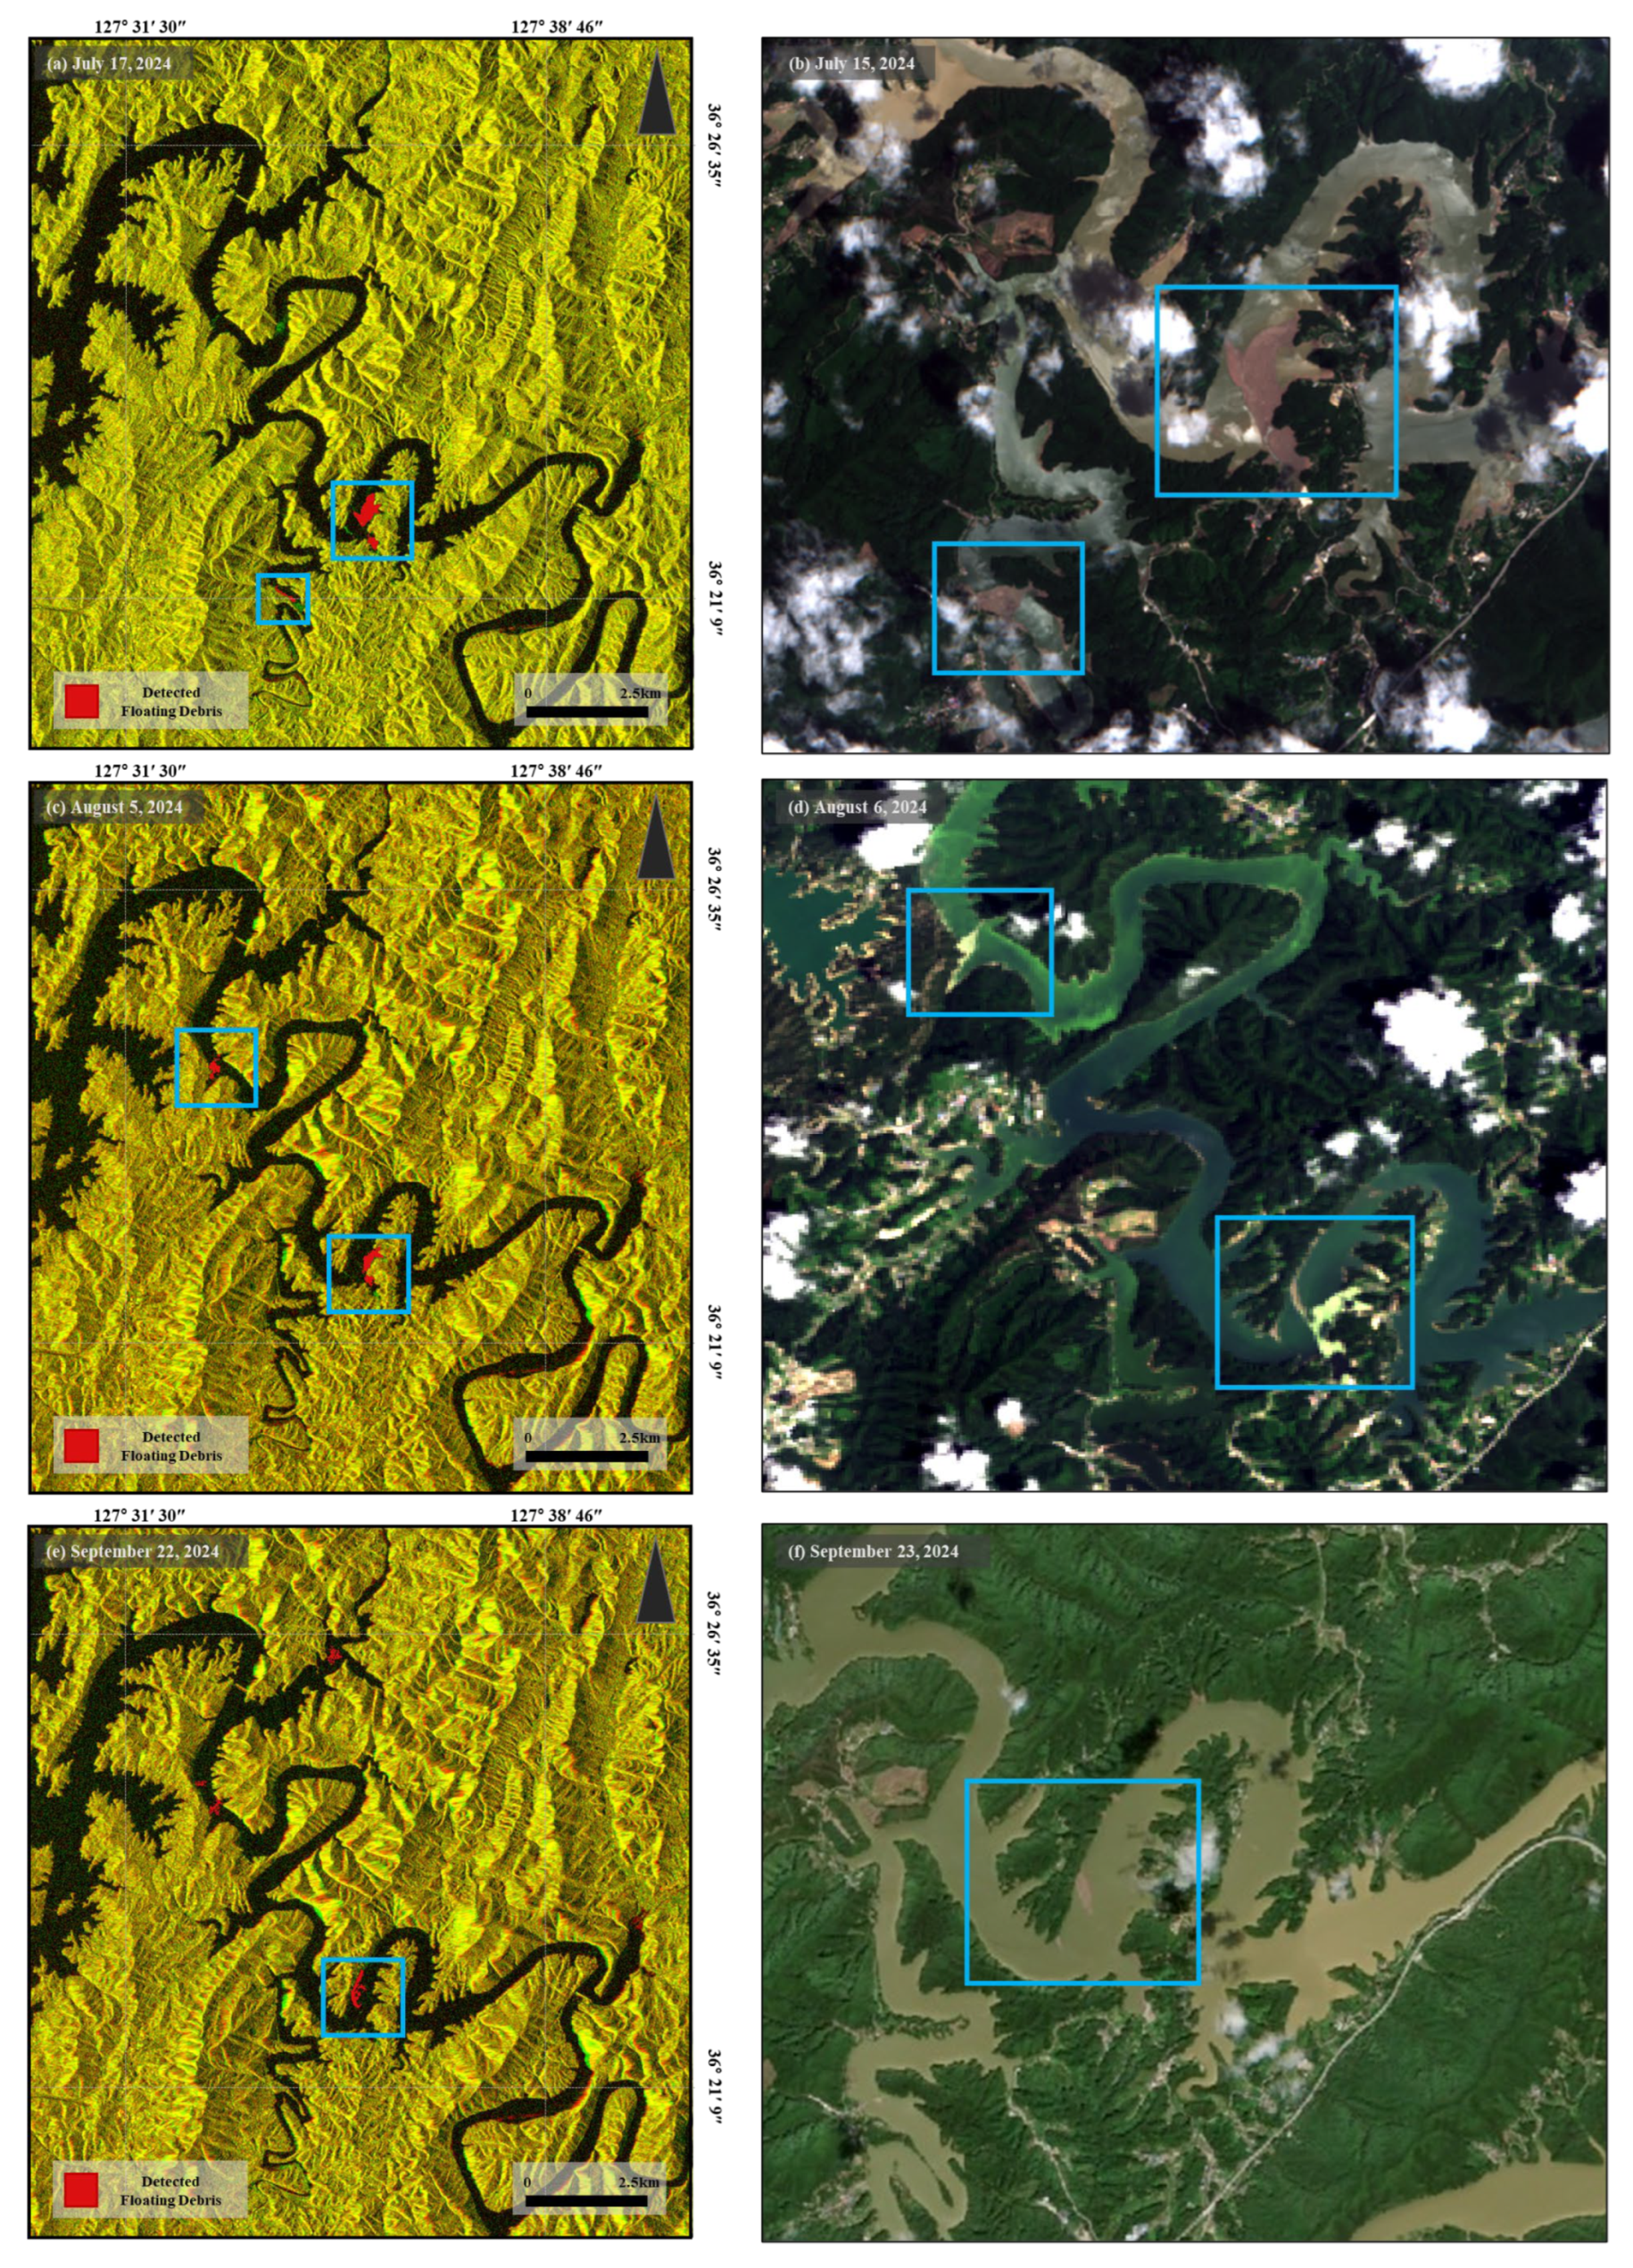
4.2. Visual Interpretation and Evaluation
5. Conclusions
Author Contributions
Funding
Data Availability Statement
Acknowledgments
Conflicts of Interest
References
- Kim, S.-W.; Cho, Y.-H.; Chae, M.-H.; KiL, G.-B.; Seok, K.-S. Characteristics of organic matters in small streams into the daecheong reservoir. J. Environ. Anal. Health Toxicol. 2020, 23, 155–164. [Google Scholar] [CrossRef]
- Brito, B.C.; Forsberg, B.R.; Kasper, D.; Amaral, J.H.; de Vasconcelos, M.R.; de Sousa, O.P.; Cunha, F.A.; Bastos, W.R. The influence of inundation and lake morphometry on the dynamics of mercury in the water and plankton in an amazon floodplain lake. Hydrobiologia 2017, 790, 35–48. [Google Scholar] [CrossRef]
- Ministry of Environment. Completion of Floating Debris Removal Following Heavy Rainfall [Press Release]. 12 September 2024. Available online: https://www.korea.kr/briefing/pressReleaseView.do?newsId=156650459 (accessed on 29 April 2025).
- Park, Y.; Kim, S.; Chon, K.; Lee, H.; Kim, J.H.; Shin, J.-K. Impacts of heavy rain and floodwater on floating debris entering an artificial lake (daecheong reservoir, korea) during the summer. Desalination Water Treat. 2021, 219, 399–404. [Google Scholar] [CrossRef]
- Hansen, M.; Howd, P.; Sallenger, A.; Lillycrop, J.; Farris, G.; Smith, G.; Crane, M.; Demas, C.; Robbins, L.; Lavoie, D. Estimation of post-katrina debris volume: An example from coastal mississippi. In Science and the storms: The USGS response to the hurricanes of 2005 (No. 1306); US Geological Survey: Reston, VA, USA, 2007; pp. 43–48. [Google Scholar]
- Hu, C.; Murch, B.; Barnes, B.B.; Wang, M.; Maréchal, J.-P.; Franks, J.; Johnson, D.; Lapointe, B.; Goodwin, D.; Schell, J. Sargassum watch warns of incoming seaweed. Eos 2016, 97, 10–15. [Google Scholar] [CrossRef]
- Topouzelis, K.; Papakonstantinou, A.; Garaba, S.P. Detection of floating plastics from satellite and unmanned aerial systems (plastic litter project 2018). Int. J. Appl. Earth Obs. Geoinf. 2019, 79, 175–183. [Google Scholar] [CrossRef]
- Basu, B.; Sannigrahi, S.; Sarkar Basu, A.; Pilla, F. Development of novel classification algorithms for detection of floating plastic debris in coastal waterbodies using multispectral sentinel-2 remote sensing imagery. Remote Sens. 2021, 13, 1598. [Google Scholar] [CrossRef]
- Hu, C. Remote detection of marine debris using satellite observations in the visible and near infrared spectral range: Challenges and potentials. Remote Sens. Environ. 2021, 259, 112414. [Google Scholar] [CrossRef]
- King, M.D.; Platnick, S.; Menzel, W.P.; Ackerman, S.A.; Hubanks, P.A. Spatial and temporal distribution of clouds observed by modis onboard the terra and aqua satellites. IEEE Trans. Geosci. Remote Sens. 2013, 51, 3826–3852. [Google Scholar] [CrossRef]
- Xue, K.; Ma, R.; Cao, Z.; Shen, M.; Hu, M.; Xiong, J. Monitoring fractional floating algae cover over eutrophic lakes using multisensor satellite images: Modis, viirs, goci, and olci. IEEE Trans. Geosci. Remote Sens. 2022, 60, 1–15. [Google Scholar] [CrossRef]
- Meng, L.; Yan, C.; Lv, S.; Sun, H.; Xue, S.; Li, Q.; Zhou, L.; Edwing, D.; Edwing, K.; Geng, X. Synthetic aperture radar for geosciences. Rev. Geophys. 2024, 62, e2023RG000821. [Google Scholar] [CrossRef]
- Yoon, D.; Yu, H.-e.; Lee, M.-J. Detection of floating debris in the lake using statistical properties of synthetic aperture radar pulses. Geo Data 2023, 5, 185–194. [Google Scholar] [CrossRef]
- Zhang, Y.; Zhang, G.; Zhu, T. Seasonal cycles of lakes on the tibetan plateau detected by sentinel-1 sar data. Sci. Total Environ. 2020, 703, 135563. [Google Scholar] [CrossRef] [PubMed]
- Guo, Z.; Wu, L.; Huang, Y.; Guo, Z.; Zhao, J.; Li, N. Water-body segmentation for sar images: Past, current, and future. Remote Sens. 2022, 14, 1752. [Google Scholar] [CrossRef]
- Horritt, M.; Mason, D.; Luckman, A. Flood boundary delineation from synthetic aperture radar imagery using a statistical active contour model. Int. J. Remote Sens. 2001, 22, 2489–2507. [Google Scholar] [CrossRef]
- Liang, J.; Liu, D. A local thresholding approach to flood water delineation using sentinel-1 sar imagery. ISPRS J. Photogramm. Remote Sens. 2020, 159, 53–62. [Google Scholar] [CrossRef]
- Qi, L.; Wang, M.; Hu, C.; Holt, B. On the capacity of sentinel-1 synthetic aperture radar in detecting floating macroalgae and other floating matters. Remote Sens. Environ. 2022, 280, 113188. [Google Scholar] [CrossRef]
- Seo, S.; Park, Y.-G.; Kim, K. Tracking flood debris using satellite-derived ocean color and particle-tracking modeling. Mar. Pollut. Bull. 2020, 161, 111828. [Google Scholar] [CrossRef]
- Duarte, M.M.; Azevedo, L. Automatic detection and identification of floating marine debris using multispectral satellite imagery. IEEE Trans. Geosci. Remote Sens. 2023, 61, 1–15. [Google Scholar] [CrossRef]
- Veci, L.; Prats-Iraola, P.; Scheiber, R.; Collard, F.; Fomferra, N.; Engdahl, M. In The Sentinel-1 Toolbox. In Proceedings of the IEEE International Geoscience and Remote Sensing Symposium (IGARSS), Quebec City, QC, Canada, 13–18 July 2014; IEEE: New York, NY, USA, 2014; pp. 1–3. [Google Scholar]
- Park, J.; Kang, K.-m. Research of water-related disaster monitoring using satellite bigdata based on google earth engine cloud computing platform. Korean J. Remote Sens. 2022, 38, 1761–1775. [Google Scholar]
- K-water. Water Safety Services. Available online: https://www.kwater.or.kr/eng/busi/resoPage.do?s_mid=1179 (accessed on 11 May 2025).
- V-World. Available online: https://www.vworld.kr/dtmk/dtmk_ntads_s002.do?searchKeyword=%ED%98%B8%EC%86%8C&searchSvcCde=&searchOrganization=&searchBrmCode=&searchTagList=&searchFrm=&pageIndex=1&gidmCd=&gidsCd=&sortType=00&svcCde=MK&dsId=20250121DS00020&listPageIndex=1 (accessed on 11 May 2025).
- Ministry of Environment. Installation of an Algal Bloom Containment Boom in the Chudong Area of Daecheong Reservoir [Press Release]. Available online: https://www.me.go.kr/gg/web/board/read.do?menuId=2290&boardMasterId=237&boardCategoryId=&boardId=355751 (accessed on 11 May 2025).
- K-water. Floating Debris Collection Records of Daecheong Reservoir, 2015–2024; K-water: Daejeon, Republic of Korea, 2024; Unpublished internal document obtained via information disclosure request. [Google Scholar]
- European Union/ESA/Copernicus. Sentinel-1 Sar Grd: C-Band Synthetic Aperture Radar Ground Range Detected, Log Scaling. Available online: https://developers.google.com/earth-engine/datasets/catalog/COPERNICUS_S1_GRD (accessed on 11 May 2025).
- Sentinel Hub. Available online: https://docs.sentinel-hub.com/api/latest/data/sentinel-1-grd/ (accessed on 11 May 2025).
- Gulácsi, A.; Kovács, F. Sentinel-1-imagery-based high-resolution water cover detection on wetlands, aided by google earth engine. Remote Sens. 2020, 12, 1614. [Google Scholar] [CrossRef]
- Conradsen, K.; Nielsen, A.A.; Skriver, H. Determining the points of change in time series of polarimetric sar data. IEEE Trans. Geosci. Remote Sens. 2016, 54, 3007–3024. [Google Scholar] [CrossRef]
- Rocamora, C.; Puerto, H.; Abadía, R.; Brugarolas, M.; Martínez-Carrasco, L.; Cordero, J. Floating debris in the low segura river basin (spain): Avoiding litter through the irrigation network. Water 2021, 13, 1074. [Google Scholar] [CrossRef]
- de Fockert, A.; Eleveld, M.; Bakker, W.; Felício, J.M.; Costa, T.; Vala, M.; Marques, P.; Leonor, N.; Moreira, A.; Costa, J. Assessing the detection of floating plastic litter with advanced remote sensing technologies in a hydrodynamic test facility. Sci. Rep. 2024, 14, 25902. [Google Scholar] [CrossRef] [PubMed]
- Ran, Q.; Su, D.; Li, P.; He, Z. Experimental study of the impact of rainfall characteristics on runoff generation and soil erosion. J. Hydrol. 2012, 424, 99–111. [Google Scholar] [CrossRef]


| Year | Daecheong Dam [Tons] | Yongdam Dam [Tons] | Boryeong Dam [Tons] |
|---|---|---|---|
| 2015 | 421 | 116 | 3 |
| 2016 | 25,519 | 1071 | 200 |
| 2017 | 1390 | 220 | 15 |
| 2018 | 2527 | 2003 | 461 |
| 2019 | 403 | 47 | 0 |
| 2020 | 10,661 | 3044 | 703 |
| 2021 | 1357 | 223 | 15 |
| 2022 | 2702 | 25 | 337 |
| 2023 | 4129 | 704 | 309 |
| 2024 | 4433 | 539 | 155 |
| Sentinel-1A UTC | Relative Orbit | Polarisation | Direction | Sentinel-2/Landsat 8-9 |
|---|---|---|---|---|
| 11 June 2024 09:32:03 | 127 | VV, VH | Ascending | 11 June 2024 (L9) |
| 23 June 2024 09:32:03 | 127 | VV, VH | Ascending | - |
| 30 June 2024 09:23:59 | 54 | VV, VH | Ascending | - |
| 5 July 2024 09:32:02 | 127 | VV, VH | Ascending | - |
| 12 July 2024 09:23:58 | 54 | VV, VH | Ascending | 13 July 2024 (L9) |
| 17 July 2024 09:32:01 | 127 | VV, VH | Ascending | 15 July 2024 (S2) |
| 24 July 2024 09:23:58 | 54 | VV, VH | Ascending | - |
| 29 July 2024 09:32:01 | 127 | VV, VH | Ascending | - |
| 5 August 2024 09:23:58 | 54 | VV, VH | Ascending | 4 August 2024 (S2) 6 August 2024 (L8) |
| 10 August 2024 09:32:01 | 127 | VV, VH | Ascending | 9 August 2024 (S2) |
| 17 August 2024 09:23:58 | 54 | VV, VH | Ascending | 19 August 2024 (S2) |
| 22 August 2024 09:32:01 | 127 | VV, VH | Ascending | - |
| 29 August 2024 09:23:58 | 54 | VV, VH | Ascending | 29 August 2024 (S2) |
| 3 September 2024 09:32:02 | 127 | VV, VH | Ascending | 3 September 2024 (S2) |
| 10 September 2024 09:23:58 | 54 | VV, VH | Ascending | 8 September 2024 (S2) |
| 15 September 2024 09:32:02 | 127 | VV, VH | Ascending | |
| 22 September 2024 09:23:59 | 54 | VV, VH | Ascending | 23 September 2024 (L8) |
| 27 September 2024 09:32:02 | 127 | VV, VH | Ascending | - |
| Sentinel-1A | p-Value | Floating Debris Area (km2) | Precipitation * | ||
|---|---|---|---|---|---|
| Daily | 5-Day Accumulated | 10-Day Accumulated | |||
| 11 June 2024 | 0.7195 | 0 | 0 | 4.75 | 4.75 |
| 23 June 2024 | 0.7200 | 0 | 3.49 | 16.42 | 21.72 |
| 30 June 2024 | 0.7376 | 0.0659 | 32.89 | 68.53 | 84.95 |
| 5 July 2024 | 0.7185 | 0 | 5.05 | 63.1 | 131.63 |
| 12 July 2024 | 0.7365 | 0.3828 | 0.1 | 269.88 | 331.87 |
| 17 July 2024 | 0.7210 | 0.3380 | 1.12 | 47.2 | 317.08 |
| 24 July 2024 | 0.7366 | 0.4504 | 2.99 | 31.48 | 104.26 |
| 29 July 2024 | 0.7189 | 0.2741 | 0 | 11.08 | 42.56 |
| 5 August 2024 | 0.7363 | 0.2476 | 11.9 | 13.53 | 19.55 |
| 10 August 2024 | 0.7187 | 0.0703 | 0 | 0.07 | 13.6 |
| 17 August 2024 | 0.7367 | 0.1655 | 0 | 0.04 | 0.15 |
| 22 August 2024 | 0.7206 | 0 | 2.64 | 12.21 | 12.25 |
| 29 August 2024 | 0.7358 | 0.0016 | 0.71 | 4.94 | 22.26 |
| 3 September 2024 | 0.7180 | 0 | 0 | 0.1 | 5.04 |
| 10 September 2024 | 0.7366 | 0 | 0 | 1.95 | 2.1 |
| 15 September 2024 | 0.7193 | 0 | 0.04 | 20.64 | 22.59 |
| 22 September 2024 | 0.7375 | 0.2508 | 0.07 | 209.58 | 209.71 |
| 27 September 2024 | 0.7183 | 0 | 0 | 0 | 209.58 |
| Image Acquisition Date | Precision | Recall | F1 Score | IoU | Detected Area (km2) | Reference Area (km2) | |
|---|---|---|---|---|---|---|---|
| Detection Image | Reference Image | ||||||
| 12 July | 13 July | 0.9247 | 0.6239 | 0.7451 | 0.5938 | 0.3828 | 0.5673 |
| 17 July | 15 July | 0.8901 | 0.6127 | 0.7258 | 0.5696 | 0.338 | 0.4911 |
| 5 August | 4 August | 0.6481 | 0.6657 | 0.6568 | 0.4889 | 0.2476 | 0.2411 |
| 5 August | 6 August | 0.809 | 0.6023 | 0.6905 | 0.5273 | 0.2476 | 0.3326 |
| 10 August | 9 August | 0.0269 | 0.0099 | 0.0144 | 0.0073 | 0.0703 | 0.1915 |
| 17 August | 19 August | 0.6026 | 0.581 | 0.5916 | 0.4201 | 0.1655 | 0.1717 |
| 22 August | 29 August | 0 | 0 | 0 | 0 | 0.0016 | 0 |
| 3 September | 3 September | 0 | 0 | 0 | 0 | 0 | 0.0036 |
| 10 September | 8 September | 0 | 0 | 0 | 0 | 0 | 0 |
| 22 September | 23 September | 0.2825 | 0.6017 | 0.3845 | 0.238 | 0.2508 | 0.1177 |
Disclaimer/Publisher’s Note: The statements, opinions and data contained in all publications are solely those of the individual author(s) and contributor(s) and not of MDPI and/or the editor(s). MDPI and/or the editor(s) disclaim responsibility for any injury to people or property resulting from any ideas, methods, instructions or products referred to in the content. |
© 2025 by the authors. Licensee MDPI, Basel, Switzerland. This article is an open access article distributed under the terms and conditions of the Creative Commons Attribution (CC BY) license (https://creativecommons.org/licenses/by/4.0/).
Share and Cite
Lee, S.; Jeong, B.; Yoon, D.; Lee, J.; Lee, J.; Heo, J.; Lee, M.-J. Quantitative Detection of Floating Debris in Inland Reservoirs Using Sentinel-1 SAR Imagery: A Case Study of Daecheong Reservoir. Water 2025, 17, 1941. https://doi.org/10.3390/w17131941
Lee S, Jeong B, Yoon D, Lee J, Lee J, Heo J, Lee M-J. Quantitative Detection of Floating Debris in Inland Reservoirs Using Sentinel-1 SAR Imagery: A Case Study of Daecheong Reservoir. Water. 2025; 17(13):1941. https://doi.org/10.3390/w17131941
Chicago/Turabian StyleLee, Sunmin, Bongseok Jeong, Donghyeon Yoon, Jinhee Lee, Jeongho Lee, Joonghyeok Heo, and Moung-Jin Lee. 2025. "Quantitative Detection of Floating Debris in Inland Reservoirs Using Sentinel-1 SAR Imagery: A Case Study of Daecheong Reservoir" Water 17, no. 13: 1941. https://doi.org/10.3390/w17131941
APA StyleLee, S., Jeong, B., Yoon, D., Lee, J., Lee, J., Heo, J., & Lee, M.-J. (2025). Quantitative Detection of Floating Debris in Inland Reservoirs Using Sentinel-1 SAR Imagery: A Case Study of Daecheong Reservoir. Water, 17(13), 1941. https://doi.org/10.3390/w17131941