Abstract
Land use/land cover (LULC) changes significantly affect hydrological processes in watersheds. In this study, the Soil and Water Assessment Tool (SWAT+) model was employed to investigate the hydrological response to LULC changes in the İznik Lake Watershed, a region of significant environmental and social importance in the Marmara Region of Türkiye. This study provides a novel understanding of water balance dynamics of the İznik Lake Watershed through hydrological modeling. The SWAT+ model was calibrated and validated against observed monthly flow data from two gauging stations using three objective functions: Nash–Sutcliffe efficiency (NSE), Kling–Gupta efficiency (KGE), and the percent bias (PBIAS). The model was utilized to evaluate the impacts of LULC change on water balance components such as surface runoff, percolation, lateral flow, water yield, and evapotranspiration. The results revealed that the expansion of urban areas and reduction in forest land have led to an increase in surface runoff and a decrease in lateral flow and percolation, which in turn have impacted the overall water yield of the watershed. The findings of this study can inform land use planning and management decisions to mitigate the negative impacts of LULC changes on water resources in the İznik Lake Watershed and similar regions.
1. Introduction
Land use management of watersheds is crucial and can profoundly impact the hydrologic cycle and water supply. Türkiye is one of the countries experiencing water scarcity due to rapid population growth, industrialization, and agricultural activities, particularly in the Marmara Region, which includes the İznik Lake Watershed [1,2]. İznik Lake, the biggest lake in the Marmara Region and the fifth largest freshwater lake in Türkiye, has been facing significant challenges, including water pollution and a marked decline in water levels in recent years, primarily due to global warming and human activity in the basin [3,4,5].
Factors such as the increasing global population, industrial development, water resource pollution, changing living conditions, land use, and climate change jeopardize water quality [6,7,8]. Rapid population growth and urbanization, land degradation, changes in land use patterns, the need for irrigation, and the results of climate change have emphasized the importance of protecting and managing water resources [9]. Numerous researchers have documented the effect of land use/land cover (LULC) change on the hydrologic cycle [10,11,12,13]. Changes in land use significantly influence surface runoff generation and streamflow patterns [14,15]. Some studies have highlighted the relationship between floods, landscape modifications, housing, and population dynamics [16,17,18]. Human activities, soil conservation, water conservancy projects, and land cover changes may create results that multiply or negate each other’s effects [19,20]. High rates of soil erosion have been reported to cause increased surface runoff [21], and a decrease in forest cover heightens the risk of flooding [22,23]. Babar and Ramesh [24] also emphasized the effect of LULC change by modeling evapotranspiration (ET) and runoff. The results showed a decrease in ET, while the runoff increased. Deforestation, urbanization, and agricultural expansion are typical examples of LULC changes that alter the natural hydrological cycle [22]. These changes often lead to increased surface runoff, reduced groundwater recharge, and altered streamflow patterns, which can have serious consequences for water resource management and the ecosystem.
Hydrological models are effective tools for understanding, predicting, and managing water resources [25]. Modeling studies have advantages for analyzing water resource-related problems and aid in the development of solutions to current and prospective issues for long-term management of water resources. The Soil and Water Assessment Tool (SWAT) model and its upgraded version, SWAT+, are extensively used hydrological models utilized to understand the impact of land use, land cover changes, and climate change on water bodies over large and complex watersheds. The SWAT+ model incorporates detailed land management practices, improved simulation of landscape and hydrological processes, and better representation of land use/land cover (LULC) effects [26]. The model’s ability to integrate spatial data, such as soil characteristics, topography, climate, and LULC, makes it an ideal tool for assessing hydrological responses to LULC changes at the watershed scale. Studies have shown that SWAT+ can effectively simulate the hydrological impacts of urbanization, deforestation, and agricultural practices on watershed hydrology [27].
Several studies around the world have investigated the impacts of LULC change on runoff and hydrological processes through hydrological modeling. For example, Marhaento et al. [28] investigated the changes in water balance in the Samin catchment using the SWAT model. Ware et al. [29] focused on the hydrological response to LULC changes in the Anyang watershed, utilizing the SWAT model. Another study by Khorn et al. [30] highlighted the influence of LULC changes on runoff and other hydrological parameters in the upper Prek Thnot watershed, also using the SWAT model.
In contrast, previous research carried out within the İznik Lake Watershed has primarily focused on the geology of the lake [31,32,33], water quality [34,35], water levels of the lake [5], pollution sources [3,4], the influence of natural environment and land use in relation to basin management and planning [36,37], and river hydrology [38].
However, no previous study to date has examined the potential impacts of LULC changes on runoff and other hydrological parameters through hydrological modeling, specifically in the İznik Lake Watershed. The study site, İznik Lake Watershed, is an important watershed in Türkiye, characterized by diverse land use patterns, including agriculture, forestry, and urban areas. Therefore, understanding the hydrological reaction to LULC changes in this basin is crucial for better management practices.
The primary goal of the present study is to explore the effects of LULC change on flow and water balance components in the İznik Lake Watershed using the SWAT+ model. Furthermore, this study aims to find the most suitable simulation setup for this watershed and to improve a comprehensive evaluation of how LULC changes affect its hydrological dynamics. The results of this study can support the development of efficient methods for water resource management to mitigate the possible negative impacts of LULC changes on the basin’s hydrology.
2. Materials and Methods
2.1. Study Area
The study site is the İznik Lake Watershed, settled in the Marmara Region of northwestern Türkiye (Figure 1). The area of the watershed is 1400 km2 and is located between latitudes 40°20′ and 40°35′ N and longitudes 29°10′ and 29°55′ E. It lies primarily within the borders of Bursa Province, with portions extending into Kocaeli and Yalova provinces. To the west of the basin are Erikli Mountain and Gemlik Bay, while Samanlı and Karlık Mountains are situated to the north [37]. According to the Köppen–Geiger climate classification, the region’s climate is a Csa climate type, characterized by hot, dry summers and cool, wet winters. Depending on the long-term climate records in the basin, the average annual temperature values were observed around 14 °C. The elevation of the basin ranges between 0 and 1300 m, which plays an important role in the distribution of temperature and precipitation conditions within the basin. The temperatures are 14 °C close to the lake and its surroundings, while lower temperatures around 8 °C were observed in the higher parts of the basin. The estimated long-term average annual precipitation in the basin is 630 mm [37]. The aridity index of UNEP for the Marmara region ranges from 0.80 to 1.00, indicating a humid climate [39]. The natural vegetation of the basin is characterized by deciduous oak-dominated forest, with shrublands and grassland. However, a significant portion of the basin has been transformed into agricultural land, particularly olive cultivation, vineyards, and orchards [3,36]. The dominant soil types in the basin are brown forest soil, red brown mediterranean soil, rendzina, alluvial, and colluvial soils. The watershed is popular in supporting agriculture, industry, tourism, and fishing. The lake, which has an elliptical shape, spans a surface area of 313 km2, an average depth of 40 m, and a maximum depth of 80 m. The perimeter of the lake is 80 km, resulting in a shoreline development index (DL) of approximately 1.27. The length and width of the lake are 32 km and 12 km, respectively [33,34]. İznik Lake is an alkaline, warm monomictic type of lake with a tectonic origin. The area is located along the southern part of the North Anatolian Fault Zone. There are older rock units in the mountains around the lake, while in the lake itself, there are younger sedimentary layers and alluvial deposits. Thermal stratification occurs in summer, while there is complete mixing in winter with no ice cover. The thermocline forms at depths of 15–20 m, and bottom water becomes anaerobic until mixing occurs [33]. The lake is surrounded by picnic areas, sightseeing spots, and tourist facilities and is characterized by a rich flora. In recognition of its ecological and cultural significance, İznik Lake was declared a “natural protected area” in 1990 [4].
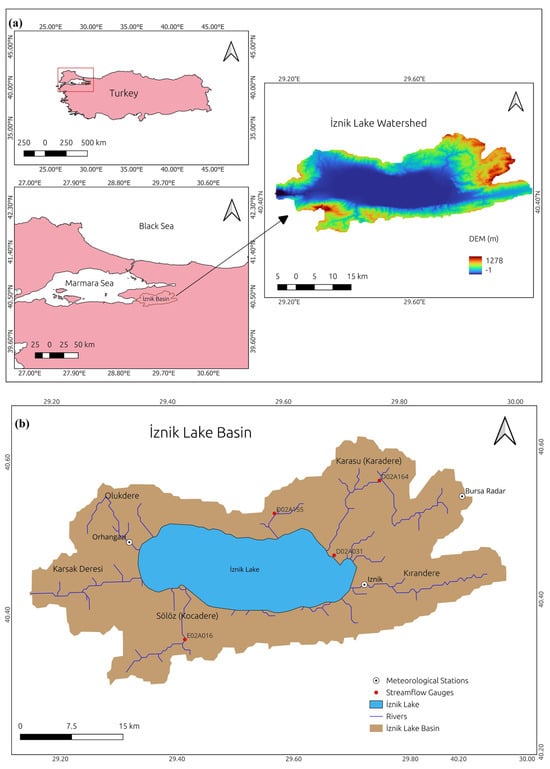
Figure 1.
(a) Study site and topographic map; (b) meteorological stations, streams, and gauging stations.
The main streams feeding the lake are Sölöz (Findicak), Olukdere, Kırandere, and Karasu (Karadere), with the Karsak stream carrying the lake’s water to the Marmara Sea. Among these, Karadere in the northeast and Findicak in the southwest are the most significant. Karadere Stream is the largest, with a catchment area of 273 km2 and a mean flow rate of 2.4 m3/sec, while Sölöz Stream has a catchment area of 92 km2 and a mean flow rate of 1.06 m3/sec [3]. Although many large and small rivers feed the lake, most are short and seasonal [37]. The İznik Dam, under construction since 2017, is in the northeast part of the study area.
2.2. Study Methodology
The approach utilized in this research is depicted in Figure 2. Once the necessary spatial and temporal data for the model were gathered, the SWAT+ model was configured for the İznik Lake Watershed. Observed flow data were utilized to calibrate and validate the model. After the calibration step, four land use scenarios were performed to quantify the hydrological changes in the watershed.
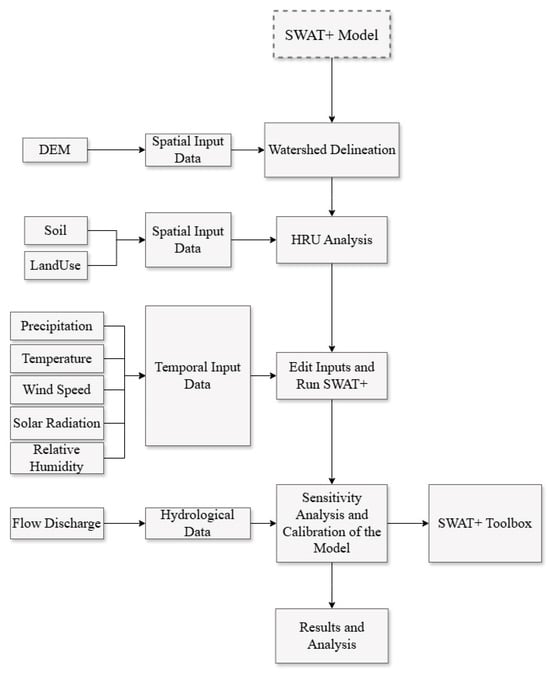
Figure 2.
Study methodology.
Each land use scenario was incorporated into the SWAT+ model by creating a corresponding land use file that defines the land use classifications and their associated SWAT+ codes. This file allowed SWAT+ to assign appropriate land use types to each HRU within the basin. Since hydrological processes are heavily impacted by management techniques (e.g., planting, harvesting, irrigation, tillage, fertilization), selecting appropriate practices is crucial. SWAT+ handled these practices based on its internal database and decision rules. For this research, the SWAT+ model’s decision tables (DTs) were used. The implementation of DTs in SWAT+ is well-documented, with several studies, such as Arnold et al. [40] and Nkwasa et al. [41] demonstrating their ability to enhance the realism and adaptability of hydrological and agricultural management simulations. By incorporating dynamic, condition-driven rule sets, such as rainfall-triggered crop phenology, automated irrigation, and reservoir operations, DTs improve the flexibility and accuracy of model simulations.
2.3. The SWAT+ Hydrological Model
SWAT+ is an updated and expanded version of the original SWAT model, offering greater flexibility and modularity in watershed simulations [42]. The watershed is initially divided into sub-basins, and these sub-basins are further delineated into hydrological response units (HRUs) according to unique combinations of slope, land use, and soil type. This study utilized the QGIS interface for the SWAT+ model, with QGIS version 3.28.4 Firenze (Long-Term Release).
The SWAT+ model performs simulations for each HRU through the water balance equation [11] as follows:
where SWt is the final soil water content (mm H2O), SW0 is the initial soil water content on day i (mm H2O), Rday is the amount of precipitation on day i (mm H2O), Qsurf is the amount of surface runoff on day i (mm H2O), Ea is the amount of evapotranspiration on day i (mm H2O), wseep is the amount of water entering the vadose zone from the soil profile on day i (mm H2O), Qgw is the amount of return flow on day i (mm H2O), and t is the time (days) [43].
2.4. Model Inputs
Since SWAT+ is a powerful tool for hydrological modeling, its application requires detailed and accurate input data, including high-resolution LULC maps, soil data, and climate records. Inaccuracies in these inputs can introduce significant uncertainties into the model predictions [27]. Additionally, calibrating and validating the model for specific regions, like the İznik Lake Watershed, can be challenging due to the complex interactions between various hydrological processes.
The main inputs of the SWAT+ model can be categorized as spatial and temporal data [42]. Spatial datasets, such as soil data, land use data, and digital elevation models (DEMs), are used to create the smallest computational units known as hydrological response units (HRUs). Runoff is predicted separately for each HRU, and then the total runoff for the watershed is calculated [43]. For temporal input data, precipitation, wind speed, solar radiation, relative humidity, and maximum and minimum air temperatures are required. The current study utilized data obtained from different sources to model the hydrological behaviour of the İznik Lake Watershed (Table 1).

Table 1.
Input data sources.
The digital elevation model (DEM) is one of the most critical datasets for watershed delineation and stream network determination since the model requires it to predict the topography of the basin (slope classes, channel length, width, and depth) [44]. In this study, the Shuttle Radar Topography Mission dataset (srtm 1 Arc-Second Global) with a 30 m × 30 m resolution was used to generate watershed characteristics and drainage networks [45]. As shown in Figure 1, the elevation of the basin varies from −1 m to 1278 m.
Land use/land cover (LULC) data is another crucial input for simulating hydrological parameters in the watershed. In this research, the historical LULC data were provided from the Coordination of Information on the Environment (CORINE) Land Cover dataset [46] covering the years 1990, 2000, 2012, and 2018 with a 100 m × 100 m spatial resolution. The data is accessible in both vector and raster formats.
Another essential component of the SWAT+ model is soil data, which has a direct impact on infiltration, runoff, and other key processes of hydrological modeling. In recent years, the availability of regional-scale soil datasets has increased, improving the reliability of environmental modeling. Szabo et al. [47] cataloged open-access soil datasets applicable to environmental modeling in the European Union and emphasized the importance of estimating missing soil properties from local datasets to ensure consistency and accuracy. In this study, the Major Soil Groups (BTG) map of Türkiye, created at a 1:100,000 scale by the General Directorate of Rural Services in the 1970s, was utilized. These maps have undergone updates and modifications over time [48]. In order to integrate the soil data into the model, the BTG soil data were pre-processed using QGIS. The required soil parameters (e.g., hydrologic group, soil texture, sand, clay, and silt content, and soil erodibility factor) were derived from soil sample analysis conducted in the Bursa region [49,50,51]. These studies classified soil characteristics based on BTG maps. The same classification approach was applied to assign soil properties to the İznik Lake Watershed. The watershed contains various soil types, including brown forest soil, red-brown Mediterranean soil, rendzina, alluvial, and colluvial soils (Table 2). The soil types and their spatial distributions within the İznik Lake Watershed are shown in Figure 3.
Table 2.
BTG soil types of the İznik Lake Watershed.
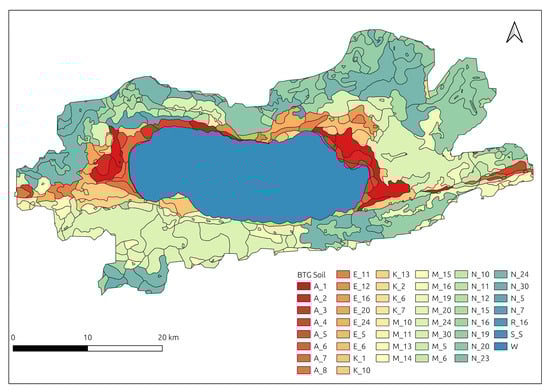
Figure 3.
Major soil groups (BTG) map of the İznik Lake Watershed.
Meteorological data is a crucial input for the SWAT+ model, as it directly influences the water balance and hydrological parameters of the watershed. The model requires the following meteorological inputs: wind speed, solar radiation, relative humidity, minimum and maximum air temperatures, and daily precipitation. In this study, wind speed and solar radiation data were sourced from NASA Prediction of Worldwide Energy Resources [52], while the other weather parameters were sourced from the General Directorate of Meteorology from 2007 to 2022.
Among the three meteorological stations located within the basin (İznik, Bursa Radar, and Orhangazi), the İznik station was utilized in this study due to its more comprehensive and continuous data availability. Figure 4 shows the yearly total precipitation distribution of two stations: data from 2014 to 2022 for the İznik and Orhangazi stations.
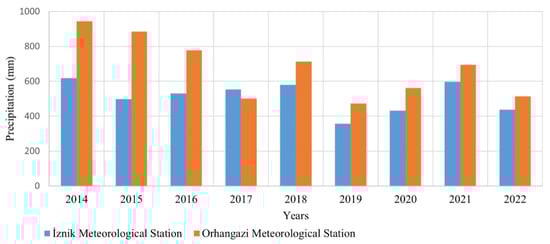
Figure 4.
Yearly total precipitation data of the İznik and Orhangazi meteorological stations.
Calibration and validation of the model depend on observed streamflow data. In this study, daily and monthly streamflow records from four stations within the watershed—D02A031 Karadere-Çakırca, D02A155 Canavardere-İznik, D02A164 Karadere-Tacir, and E02A016 Fındıcak-Bayırköy—were obtained from the General Directorate of State Hydraulic Works (DSİ), as presented in Table 3. The locations of the gauge stations are illustrated in Figure 1. The SWAT+ model was calibrated and validated using monthly streamflow data from the Fındıcak-Bayırköy and Karadere-Çakırca (D02A031) stations, as they have the longest and most reliable data records within the basin.
Table 3.
Streamflow gauging stations within the İznik Lake Watershed.
2.5. Model Setup
The SWAT+ model was configured for the İznik Lake Watershed utilizing the input data described in the preceding sections. Watershed delineation, HRU definition, and the incorporation of weather station data are the key steps in setting up the model.
As the first step, watershed delineation was performed using DEM data, resulting in 13 sub-basins according to the flow direction [53]. Each sub-basin was subsequently divided into HRUs, which represent unique combinations of land use, soil type, and slope. In this study, no threshold was applied during HRU creation, meaning that all possible HRUs were retained to ensure a detailed representation of spatial heterogeneity. While this approach reflects the model’s capability to capture the effects of land use and soil variability, it also increases computational demand. As a result, the model generated 259 landscape units (LSUs) and 8969 HRUs (Figure 5).
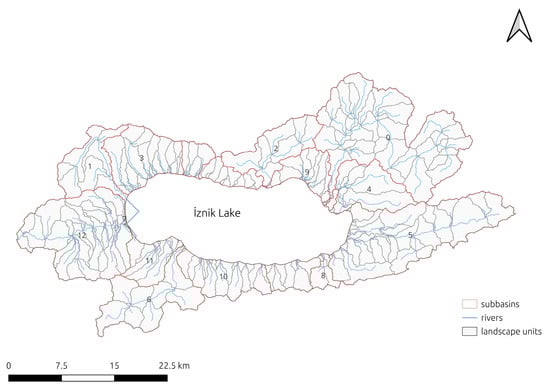
Figure 5.
İznik Lake Watershed sub-basins, rivers, and LSUs.
2.6. Calibration and Validation of the Model
In hydrological modeling, calibration is crucial for reducing discrepancies between observed and simulated streamflow data. The more reliable the calibration is, the more accurate the model’s predictions. In this research, the SWAT+ model was calibrated and validated using observed monthly streamflow data from two streamflow gauging stations: Karadere-Çakırca and Fındıcak-Bayırköy. Model runs were conducted for the period from 2007 to 2021, comprising a warm-up period from 2007 to 2009, a calibration period from 2010 to 2016, and a validation period from 2017 to 2021. In this study, we used the SWAT+ Toolbox version 2.0 for sensitivity analysis, calibration, and validation to enhance the model’s performance.
Initially, several sensitivity analyses were carried out to identify the most sensitive parameters. This step helps to reduce the number of parameters to be calibrated. The Sobol method [54] was used for sensitivity analysis to evaluate the effect of various model parameters on the predicted streamflow. Previous studies were consulted to identify the sensitive parameters [55,56,57,58,59]. Based on these approaches, 11 parameters were identified as the most sensitive for streamflow simulation. The calibration was conducted using both manual adjustments and automated techniques. The sensitivity ranking and the fitted values are listed in Table 4, with the three most sensitive parameters being the percolation coefficient (perco), depth of the soil layer (z), and SCS curve number (Cn2), respectively.
Table 4.
Calibrated SWAT+ model parameters.
The automatic calibration of the model was conducted using the Latin Hypercube Sampling Iterations (CALSI) method, one of the optimization algorithms available in the SWAT+ Toolbox. During the calibration process, model parameters were iteratively adjusted until a satisfactory level of agreement between observed and simulated streamflow data was achieved. Automatic calibration was supplemented with manual calibration. First, the key parameters were added one at a time to understand their individual effects on the model results. The performance of the model was further improved by analyzing the effects of combined parameter changes. Ultimately, the combination of automatic and manual calibration techniques facilitated the determination of an optimal parameter set, improving the alignment between the modeled and observed streamflow data.
In this study, three commonly used statistical parameters: Nash–Sutcliffe model efficiency (NSE), Kling–Gupta efficiency (KGE), and the percent bias (PBIAS) were chosen to evaluate the model performance [60,61,62]. NSE was chosen for its ability to evaluate the overall agreement between observed and simulated data [63]. KGE was included as it decomposes the model performance into correlation, bias, and variability [64]. Lastly, PBIAS was utilized to evaluate the degree to which the model overestimates or underestimates simulated streamflow [60]. These three metrics were calculated and utilized to assess the ability of the model to accurately simulate streamflow under different conditions. The equations for NSE, PBIAS, and KGE are given as follows:
where and are the observed and the modeled flow and is the mean value of observed and modeled flow, respectively, for a specific time (t), r is the Pearson correlation coefficient between the observed and modeled, σ is the standard deviation, and µ is the mean. Table 5 shows model performance ratings of these error indicators.
Table 5.
Model performance ratings [60,61,62].
3. Results and Discussion
3.1. Calibration and Validation Results
The comparison of observed and simulated flow during the calibration and validation periods for each gauging station is illustrated in Figure 6 with the calculated error statistics. Based on the statistical metrics, PBIAS values fall within the “Very Good” range, except for the validation period at the Fındıcak station. KGE ranges from 0.53 to 0.76, indicating “Satisfactory” to “Good” performance during calibration and validation. The NSE values were 0.47 and 0.51 for the Karadere station, indicating “Satisfactory” model performance, while they were 0.44 and 0.40 for the Fındıcak station. The results suggest a model performance ranging from satisfactory to very good based on PBIAS and KGE values. However, NSE values at the Fındıcak station were slightly below the recommended threshold of 0.50. This may be attributed to uncertainties in precipitation input data, as the İznik meteorological station is located close to the Karadere gauging station but far from the Fındıcak station, potentially leading to lower model performance at the latter.
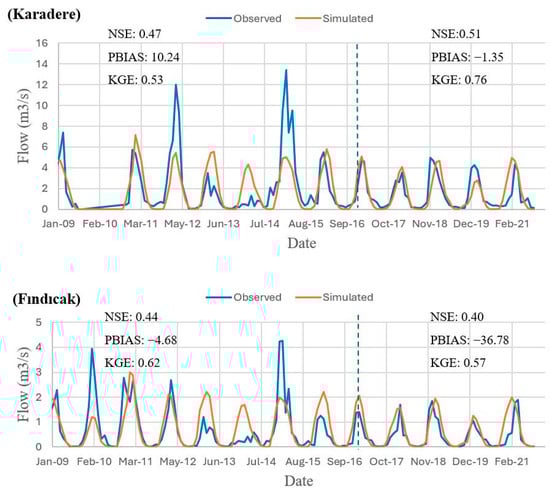
Figure 6.
Comparison of the observed and the modeled monthly streamflow for the Karadere-Çakırca and Fındıcak Bayırköy gauging stations (the dotted vertical line represents the boundary between the calibration and the validation periods).
The largest discrepancies between the modeled and the observed values were mostly during peak flow periods, particularly in March–April 2012 and February–April 2015 at the Karadere station, as well as in January 2010, and January–February 2015 at the Fındıcak gauging station. The model also overestimated the low observed flows from December 2013 to February 2014 for both stations. The observed flow and the precipitation data are consistent with each other during the peak flow periods in the Karadere and Fındıcak stations. Additionally, the streamflow was measured to be low in the early months of 2014, when low precipitation was observed during the same periods, supporting the consistency between the observed flow and precipitation data. Her and Jeong [65] highlighted potential prediction issues in the SWAT+ model, showing multiple peaks in sub-daily hydrographs due to its newly implemented HRU-level flow routing scheme. A study conducted in the Uruguay River Basin using the SWAT+ model reported a systematic underestimation of peak discharges, despite adequate flow fluctuation representation [66]. On the other hand, the model simulated the low flows well during the simulation for both stations, except for the overestimation in early 2014. The observed flows were smaller than 1 m3/s while the simulated values were between 2 and 4 m3/s during this winter period of 2014. The high flow estimates during low-flow periods may be attributed to the inaccurate modeling of the snowmelt processes. Errors in temperature or solar radiation data can lead to such discrepancies [67,68]. In another study by Kardhana et al. [69], the limitations of the SWAT+ model in watershed management and water resource optimization, particularly under low-flow conditions, were discussed. In general, the SWAT+ model was able to capture the seasonal dynamics of the hydrology in the watershed reasonably well, reproducing the annual cycle of streamflow and the timing of high and low flow periods.
3.2. LULC Change Analysis
The calibrated SWAT+ model was further utilized to investigate the impact of LULC changes on the hydrology of the watershed. LULC scenarios for the years 1990, 2000, 2012, and 2018 were used to quantify the changes. The spatial distribution of LULC changes over the years is presented in Figure 7. The major LULC classes in the watershed are agricultural areas (36.6%), forest (28.8%), bushlands, and grass (10.6%), as detailed in Table 6. The remaining areas in the watershed are residential (1.1%), transportation and mining (0.5%), commercial and industrial (0.3%), and wetlands (0.3%).
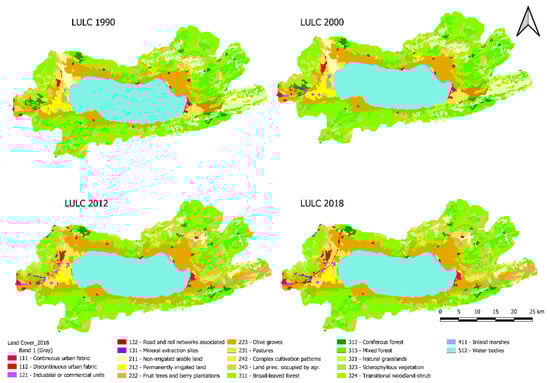
Figure 7.
LULC map of the İznik Lake Watershed for the years 1990, 2000, 2012, and 2018.
Table 6.
LULC changes in the İznik Lake Watershed for the period 1990–2018.
The results showed that the transportation and mining areas increased dramatically from 0 to 730 ha, while commercial and industrial areas expanded by 461.5% (from 130 ha to 730 ha) during the same period. Residential areas also increased by 27.3% (from 1100 ha to 1400 ha), while wetlands expanded by 25.8% (from 310 ha to 390 ha). On the contrary, bushlands and grasslands decreased by 8.2% (from 15,900 ha to 14,600 ha), and the forested areas declined by 7.9% (from 43,200 ha to 39,800 ha). Agricultural lands, however, experienced a 7.0% increase (from 47,300 ha to 50,600 ha) over the same period.
3.3. Hydrological Response to LULC Changes
The hydrological response of the watershed to the LULC changes was assessed by running the SWAT+ model for four different LULC scenarios, all based on 2007–2021 climate data. The simulated average annual water balance components are presented in Table 7, along with their graphical representations in Figure 8a,b. The results indicate that the expansin of transportation/mining areas, commercial/industrial zones, and residential areas, coupled with the decline in forested land, resulted in a 22.3% increase in surface runoff and a 7.5% decrease in percolation, despite precipitation remaining constant at 751 mm/year between 1990 and 2018. On the other hand, evapotranspiration (et) increased by 0.4%, while lateral flow and water yield decreased by 1.5% and 0.2%, respectively. The results demonstrate that the increase in impervious surfaces, such as transportation/mining, commercial/industrial, and residential areas, has contributed to elevated surface runoff and evapotranspiration. Meanwhile, the expansion of agricultural lands and the reduction in forest cover have led to a decline in lateral flow and percolation over time.
Table 7.
Average annual impacts of LULC changes on hydrological components in the İznik Lake Watershed. The percentage change in each water balance component was calculated using the formula (Clc2018 − Clc_1990) × 100/Clc1990. This formula expresses the relative change from 1990 to 2018 as a percentage of the 1990 value, where Clc refers to the CORINE Land Cover classification.
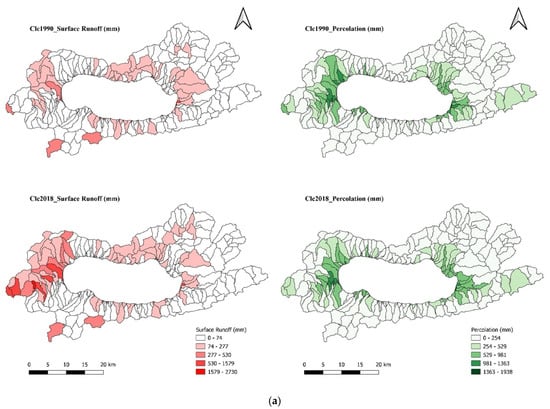
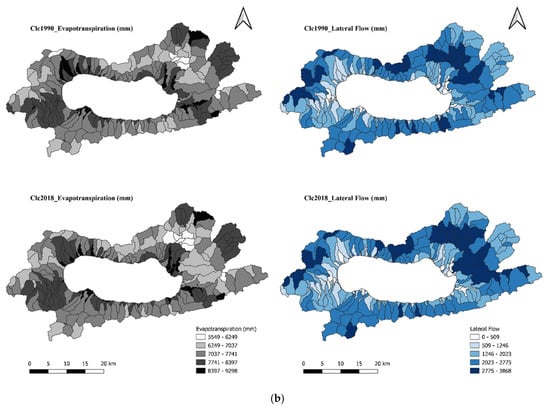
Figure 8.
(a) Spatial distribution of surface runoff and percolation under the Clc1990 and Clc2018 land use scenarios. (b) Spatial distribution of evaporation and lateral flow under the Clc1990 and Clc2018 land use scenarios.
The results of this study demonstrate the significant impact of LULC changes in the İznik Lake Watershed between 1990 and 2018. The expansion of impervious areas (transportation/mining, commercial/industrial, and residential) and the loss of forest land led to increased surface runoff and reduced groundwater recharge, lateral flow, and water yield. The SWAT+ model simulations effectively captured these hydrological dynamics, offering insights for future water management in the basin. One of the key strengths of this study is the use of detailed historical LULC data to quantify the effects of land use change on the watershed’s hydrology. Additionally, the use of observed meteorological data from the basin further strengthens the study by ensuring that the model inputs closely reflect the actual climate conditions. This increases the accuracy and reliability of the hydrological simulations. Furthermore, the use of the SWAT+ model enhances the study, as it is a powerful tool capable of modeling complex interactions between climate, land cover, and hydrology across large watersheds over long periods. Also, the calibration and validation of the model against observed streamflow data from two-gauge stations increases the model’s reliability, as it ensures that the simulated flows align with real-world measurements, enhancing the overall accuracy of the results. However, some limitations should be noted. Although the SWAT+ model showed good performance in simulating seasonal flows, it exhibited limitations in accurately capturing extreme events, particularly peak flows during periods of intense precipitation. In addition to this, the study did not consider groundwater abstractions or the effect of agricultural practices, such as irrigation and fertilizer application, on watershed hydrology.
The findings of this study are consistent with previous studies that have reported hydrological alterations resulting from LULC changes, especially the effects of urbanization and deforestation on surface runoff, groundwater recharge, and overall water availability. Sertel et al. [70] applied the SWAT model to the Büyükçekmece Water Basin of İstanbul, indicating that LULC change, specifically urbanization, resulted in reductions in actual evapotranspiration, percolation, and base flow and an increase in surface runoff. Another study conducted in İzmir, Türkiye, emphasized the importance of permeability in built-up areas [71]. According to Awotwi et al. [72], urbanization and mining activities were found to be the primary drivers of alterations in water balance components in the Pra River Basin of Ghana. Hua [73] predicted future LULC changes in the Malacca River Watershed, Malaysia, using the CA-Markov model, and highlighted that the ongoing urbanization will likely lead to more severe environmental degradation, including higher pollution levels in the river. Li et al. [74] stated that the shrinkage of woodland contributed to a slight increase in streamflow during the dry season.
The results of this study have significant implications for water resources management and planning in the İznik Lake Watershed and more broadly in Türkiye. Considering the adverse impacts of LULC changes on the hydrology of the basin, it is essential to develop and implement sustainable land use policies and best management practices that minimize further urbanization and maintain the natural vegetation cover. These changes are particularly concerning given the ongoing challenges of water scarcity and climate change in the region. Our findings highlight the clear need for integrated lake basin management strategies that combine land use planning, water quality monitoring, and active stakeholder involvement to protect İznik Lake from the combined effects of human activities and possible climate change. Additionally, reducing land use loss will also play a critical role in addressing the “nature crisis” as highlighted by the Intergovernmental Science-Policy Platform on Biodiversity and Ecosystem Services (IPBES) reports. The degradation of ecosystems, driven largely by land use change, is a major factor behind biodiversity loss and reduced ecosystem services. By increasing forests and permeable surfaces, controlling urban expansion, and preserving natural habitats, the watershed can better regulate its hydrological cycle, protect biodiversity, and ensure the long-term sustainability of water resources.
4. Conclusions
The rapid urbanization and LULC changes observed in many regions around the world present substantial challenges to the sustainable management of water resources. Previous studies in the İznik Lake Watershed have not sufficiently examined the long-term impacts of LULC change on hydrological processes, highlighting a critical research gap. This study bridges this gap by employing the advanced SWAT+ hydrological model, a newer and more robust iteration of the widely used SWAT model, to assess the impact of LULC changes on the watershed’s hydrology between 1990 and 2018.
The SWAT+ model was calibrated and validated using observed monthly streamflow data from two gauging stations, achieving satisfactory to very good performance based on multiple statistical metrics, including NSE, KGE, and PBIAS. Despite the NSE values being slightly lower (between 0.40 and 0.51) during the calibration and validation periods, the model’s overall performance was assessed as satisfactory to very good based on PBIAS and KGE values.
Our results revealed that between 1990 and 2018, significant LULC changes, particularly the expansion of built-up areas and the loss of forest cover, caused notable hydrological shifts. Surface runoff increased by 22.3%, percolation decreased by 7.5%, and lateral flow decreased by 1.5% under the same climatic conditions. Meanwhile, water yield showed a slight decrease of 0.2%, and evapotranspiration increased by 0.4%, reflecting a small but noticeable variation. These findings underscore the profound impact of LULC dynamics on key components of the water balance. Integrating LULC change into hydrological models, such as SWAT+, will provide valuable insights for developing adaptive water management strategies in Türkiye and other parts of the world experiencing rapid urbanization and land use changes. Furthermore, the calibration parameters and methodological framework adopted in this study can serve as a valuable reference for researchers and practitioners applying the SWAT+ model to similar watersheds, particularly in areas experiencing rapid urbanization and land use change.
Author Contributions
Conceptualization, A.Ç.T. and A.A.; methodology A.Ç.T. and A.A.; software, A.Ç.T.; validation, A.Ç.T., A.A., A.B. and K.T.A.; formal analysis, A.Ç.T.; investigation, A.Ç.T. and A.A.; data curation, A.Ç.T.; writing—original draft preparation, A.Ç.T.; writing—review and editing, A.Ç.T., A.A., A.B. and K.T.A.; visualization, A.Ç.T.; supervision, A.A., A.B. and K.T.A. All authors have read and agreed to the published version of the manuscript.
Funding
This research received no external funding.
Data Availability Statement
The original contributions presented in this study are included in the article. Further inquiries can be directed to the corresponding author.
Acknowledgments
We would like to thank the General Directorate of Meteorology (MGM) and the General Directorate of State Hydraulic Works (DSI) for providing the data that significantly contributed to this study. The authors would like to express their gratitude to Ertuğrul Aksoy and Gökhan Özsoy for their valuable contributions to the preparation of the soil data.
Conflicts of Interest
The authors declare no conflicts of interest.
References
- Altınbilek, D.H.; Hatipoglu, M.A. Water Resources Development. In Water Resources of Turkey; Harmancioglu, N., Altinbilek, D., Eds.; World Water Resources; Springer: Cham, Switzerland, 2020; Volume 2, pp. 61–84. [Google Scholar]
- Hanedar, A.; Girgin, E.; Karaaslan, Y.; Tanik, A. Evolving a Methodology for Assessing Pesticide Pressure on Water Bodies under Data Scarce Conditions: A Case Study on the Marmara Basin in Türkiye. Sustainability 2024, 16, 2086. [Google Scholar] [CrossRef]
- Meşeli, A. Environmental Problems in the Lake İznik Basin. J. Dicle Univ. Ziya Gökalp Fac. Educ. 2010, 14, 134–148. [Google Scholar]
- Oktem, Y.A.; Gumus, M.; Yilmaz, G.B. The Potential Sources of Pollution Affecting the Water Quality of Lake Iznik. Int. J. Mech. Mechatron. Eng. 2012, 2, 225–233. [Google Scholar]
- Erkoç, M.H.; Doğan, U.; Keser, B.; Bayram, B. Effect of Climate Change on Water Level and Surface Area of Lake Iznik (NW Türkiye). In Proceedings of the EGU General Assembly, Vienna, Austria, 14–19 April 2024. [Google Scholar]
- Kundu, S.; Khare, D.; Mondal, A. Past, present and future land use changes and their impact on water balance. J. Environ. Manag. 2017, 197, 582–596. [Google Scholar] [CrossRef]
- Bucak, T.; Trolle, D.; Andersen, H.E.; Thodsen, H.; Erdoğan, Ş.; Levi, E.E.; Filiz, N.; Jeppesen, E.; Beklioğlu, M. Future water availability in the largest freshwater Mediterranean lake is at great risk as evidenced from simulations with the SWAT model. Sci. Total Environ. 2017, 581–582, 413–425. [Google Scholar] [CrossRef] [PubMed]
- Liang, J.; Liu, Q.; Zhang, H.; Li, X.; Qian, Z.; Lei, M.; Li, X.; Peng, Y.; Li, S.; Zeng, G. Interactive effects of climate variability and human activities on blue and green water scarcity in rapidly developing watershed. J. Clean. Prod. 2020, 265, 121834. [Google Scholar] [CrossRef]
- Aydin, F.; Erlat, E.; Türkeş, M. Impact of climate variability on the surface of Lake Tuz (Turkiye), 1985–2016. Reg. Environ. Change 2020, 20, 68. [Google Scholar] [CrossRef]
- Santos, R.M.B.; Sanches Fernandes, L.F.; Vitor Cortes, R.M.; Leal Pacheco, F.A. Hydrologic Impacts of Land Use Changes in the Sabor River Basin: A Historical View and Future Perspectives. Water 2019, 11, 1464. [Google Scholar] [CrossRef]
- Basu, A.S.; Gill, L.W.; Pilla, F.; Basu, B. Assessment of Variations in Runoff Due to Landcover Changes Using the SWAT Model in an Urban River in Dublin, Ireland. Sustainability 2022, 14, 534. [Google Scholar] [CrossRef]
- Keleş Özgenç, E. Evaluation using the SWAT model of the effects of land use land cover changes on hydrological processes in the Gala Lake Basin, Turkey. Environ. Qual. Manag. 2024, 34, e22238. [Google Scholar] [CrossRef]
- Wang, S.; Liu, Y.; Wang, W.; Zhao, G.; Liang, H. Interpretable machine learning guided by physical mechanisms reveals drivers of runoff under dynamic land use changes. J. Environ. Manag. 2024, 367, 121978. [Google Scholar] [CrossRef]
- Erena, S.H.; Worku, H. Dynamics of land use land cover and resulting surface runoff management for environmental flood hazard mitigation: The case of Dire Daw city, Ethiopia. J. Hydrol. Reg. Stud. 2019, 22, 100598. [Google Scholar] [CrossRef]
- Bitew, M.M.; Kebede, H.H. Effect of land use land cover change on stream flow in Azuari watershed of the Upper Blue Nile Basin, Ethiopia. Sustain. Water Resour. Manag. 2024, 10, 112. [Google Scholar] [CrossRef]
- Ka’zmierczak, A.; Cavan, G. Surface water flooding risk to urban communities: Analysis of vulnerability, hazard and exposure. Landsc. Urban Plan. 2011, 103, 185–197. [Google Scholar] [CrossRef]
- Miller, J.D.; Hutchins, M. The impacts of urbanisation and climate change on urban flooding and urban water quality: A review of the evidence concerning the United Kingdom. J. Hydrol. Reg. Stud. 2017, 12, 345–362. [Google Scholar] [CrossRef]
- Viero, D.P.; Order, G.; Matticchio, B.; Defina, A.; Tarolli, P. Floods, landscape modifications and population dynamics in anthropogenic coastal lowlands: The Polesine (northern Italy) case study. Sci. Total Environ. 2019, 651, 1435–1450. [Google Scholar] [CrossRef] [PubMed]
- Ye, X.; Zhang, Q.; Liu, J.; Li, X.; Xu, C.Y. Distinguishing the relative impacts of climate change and human activities on variation of streamflow in the Poyang Lake catchment, China. J. Hydrol. 2013, 494, 83–95. [Google Scholar] [CrossRef]
- Borrelli, P.; Robinson, D.A.; Fleischer, L.R.; Lugato, E.; Ballabio, C.; Alewell, C.; Meusburger, K.; Modugno, S.; Schütt, B.; Ferro, V.; et al. An assessment of the global impact of 21st century land use change on soil erosion. Nat. Commun. 2017, 8, 2013. [Google Scholar] [CrossRef]
- Tibebe, D.; Bewket, W. Surface runoff and soil erosion estimation using the SWAT model in the Keleta watershed, Ethiopia. Land Degrad. Dev. 2011, 22, 551–564. [Google Scholar] [CrossRef]
- Fohrer, N.; Haverkamp, S.; Eckhardt, K.; Frede, H.G. Hydrologic response to land use changes on the catchment scale. Phys. Chem. Earth Part B Hydrol. Ocean. Atmos. 2001, 26, 577–582. [Google Scholar] [CrossRef]
- Eva, E.A.; Marzen, L.J. Impact of Land Use and Land Cover Changes on the Stream Flow and Water Quality of Big Creek Lake Watershed South Alabama, USA. Environ. Sci. Proc. 2022, 15, 9. [Google Scholar]
- Babar, S.; Ramesh, H. Streamflow response to land use-land cover change over the Nethravathi River Basin, India. J. Hydrol. Eng. 2015, 20, 1943–5584. [Google Scholar] [CrossRef]
- Aragaw, H.M.; Goel, M.K.; Mishra, S.K. Hydrological responses to human-induced land use/land cover changes in the Gidabo River basin, Ethiopia. Hydrolog. Sci. J. 2021, 66, 640–655. [Google Scholar] [CrossRef]
- Bieger, K.; Arnold, J.G.; Rathjens, H.; White, M.J.; Bosch, D.D.; Allen, P.M.; Volk, M.; Srinivasan, R. Introduction to SWAT+, A Completely Restructured Version of the Soil and Water Assessment Tool. J. Am. Water Resour. Assoc. 2017, 53, 115–130. [Google Scholar] [CrossRef]
- Arnold, J.G.; Kiniry, J.R.; Srinivasan, R.; Williams, J.R.; Haney, E.B.; Neitsch, S.L. Soil & Water Assessment Tool: Input/Output Documentation; Version 2012 TR-439; Texas Water Resources Institute: Collage Station, TX, USA, 2012; pp. 1–650. [Google Scholar]
- Marhaento, H.; Booij, M.J.; Rientjes, T.H.M.; Hoekstra, A.Y. Attribution of changes in the water balance of a tropical catchment to land use change using the SWAT model. Hydrol. Process. 2017, 31, 2029–2040. [Google Scholar] [CrossRef]
- Ware, H.H.; Chang, S.W.; Lee, J.E.; Chung, I.-M. Assessment of Hydrological Responses to Land Use and Land Cover Changes in Forest-Dominated Watershed Using SWAT Model. Water 2024, 16, 528. [Google Scholar] [CrossRef]
- Khorn, N.; Ismail, M.H.; Nurhidayu, S.; Kamarudin, N.; Sulaiman, M.S. Land use/land cover changes and its impact on runoff using SWAT model in the upper Prek Thnot watershed in Cambodia. Environ. Earth Sci. 2022, 81, 466. [Google Scholar] [CrossRef]
- Franz, S.; Schwark, L.; Brüchmann, C.; Scharf, B.; Klingel, R.; Alstine, J.D.V.; Çagatay, N.; Ülgen, U.B. Results from a Multi-disciplinary Sedimentary Pilot Study of Tectonic Lake Iznik (NW Turkey)–Geochemistry and Paleolimnology of the Recent Past. J. Paleolimno. 2006, 35, 715–736. [Google Scholar] [CrossRef]
- Erginal, A.E.; Kıyak, N.G.; Ozturk, M.Z.; Avcıoğlu, M.; Bozcu, M.; Yiğitbaş, E. Cementation characteristics and age of beachrocks in a fresh-water environment, Lake İznik, NW Turkey. Sediment. Geol. 2012, 243, 148–154. [Google Scholar] [CrossRef]
- Viehberg, F.A.; Ulgen, U.B.; Damcı, E.; Franz, S.O.; On, S.A.; Roaser, P.A.; Çağatay, M.N.; Litt, T.; Melles, M. Seasonal hydro chemical changes and spatial sedimentological variations in Lake İznik (NW Turkiye). Quater. Inter. 2012, 274, 102–111. [Google Scholar] [CrossRef]
- Oğuz, A.; Albay, R.A.; Koker, L.; Gurevin, C.; Dorak, Z.; Albay, M. Driving factors affecting the phytoplankton functional groups in a deep Alkaline Lake. Turk. J. Bot. 2020, 44, 633–646. [Google Scholar] [CrossRef]
- Dorak, Z.; Gaygusuz, Ö.; Köker, L.; Albay, M.; Akçaalan, R. Environmental factors affecting the spatio-temporal distribution of zooplankton functional groups in a deep alkaline lake. Hydrobiologia 2024, 1, 21. [Google Scholar] [CrossRef]
- Akbulak, C. Investigation of Land Use on Selected Villages in the İznik Lake Basin. J. Geogr. 2007, 15, 24–43. [Google Scholar]
- Garipağaoğlu, N.; Uzun, M. The Effects of Natural Environment Conditions, Changes and Possible Risks on Watershed Management and Planning in Basin of Iznik Lake. East. Geogr. Rev. 2019, 24, 1–24. [Google Scholar]
- Sezer Güney, B.; Karaer, F. Estimation of Solöz River Water Balance Components and Rainfall Runoff Pattern with WEAP Model 1. Water 2025, 17, 1129. [Google Scholar] [CrossRef]
- Sahin. An aridity index defined by precipitation and specific humidity. J. Hydrol. 2012, 444, 199–208. [Google Scholar]
- Arnold, J.G.; Bieger, K.; White, M.J.; Srinivasan, R.; Dunbar, J.A.; Allen, P.M. Use of Decision Tables to Simulate Management in SWAT+. Water 2018, 10, 713. [Google Scholar] [CrossRef]
- Nkwasa, A.; Chawanda, C.; Jägermeyr, J.; Griensven, A. Improved representation of agricultural land use and crop management for large-scale hydrological impact simulation in Africa using SWAT+. Hydrol. Earth Syst. Sci. 2022, 26, 71–89. [Google Scholar] [CrossRef]
- Arnold, J.G.; Srinivasan, R.; Muttiah, R.S.; Williams, J.R. Large Area Hydrologic Modeling and Assessment Part I: Model Development1. J. Am. Water Resour. Assoc. 1998, 34, 73–89. [Google Scholar] [CrossRef]
- Neitsch, S.L.; Arnold, J.G.; Kiniry, J.R.; Williams, J.R. Soil and Water Assessment Tool Theoretical Documentation: Version 2009; Texas Water Resources Institute Technical Report No: 406; Texas A&M University System: College Station, TX, USA, 2011. [Google Scholar]
- Hussain, S.; Niyazi, B.; Elfeki, A.M.; Masoud, M.; Wang, X.; Awais, M. SWAT-Driven Exploration of Runoff Dynamics in Hyper-Arid Region, Saudi Arabia: Implications for Hydrological Understanding. Water 2024, 16, 2043. [Google Scholar] [CrossRef]
- USGS Earth Explorer. Available online: https://earthexplorer.usgs.gov/ (accessed on 14 December 2023).
- Copernicus. Available online: https://land.copernicus.eu/pan-european/corine-land-cover (accessed on 18 March 2024).
- Szabó, B.; Kassai, P.; Plunge, S.; Nemes, A.; Braun, P.; Strauch, M.; Witing, F.; Mészáros, J.; Čerkasova, N. Addressing soil data needs and data gaps in catchment-scale environmental modelling: The European perspective. SOIL 2024, 10, 587–617. [Google Scholar] [CrossRef]
- Özsoy, G.; Aksoy, E. Genesis and Classification of some Mollisols Developed under Forest Vegetation in Bursa, Turkey. Int. J. Agric. Biol. 2012, 14, 75–80. [Google Scholar]
- Özsoy, G. Determination of the Potential Erosion Risk Using Remote Sensing (RS) and Geographic Information System (GIS) Techniques. Ph.D. Thesis, Bursa Uludağ University, Bursa, Türkiye, 2007. [Google Scholar]
- Aksoy, E.; Özsoy, G.; Dirim, M.S.; Tümsavaş, Z.; Alacalı, İ.; Ata, R. Determination of the Potential Erosion Risk Using Remote Sensing (RS) and Geographic Information System (GIS) Techniques; Project Report UÜBAP Z-2003/96; Bursa Uludağ University: Bursa, Türkiye, 2007. [Google Scholar]
- Ozcan, B. Determining the Land Degradation and Temporal Changes of Bursa by Using the Corine Erosion Model. Master’s Thesis, Bursa Uludağ University, Bursa, Türkiye, 2021. [Google Scholar]
- NASA Prediction of Worldwide Energy Resources. Available online: https://power.larc.nasa.gov (accessed on 6 June 2024).
- Li, L.; Yang, J.; Wu, J. A Method of Watershed Delineation for Flat Terrain Using Sentinel-2A Imagery and DEM: A Case Study of the Taihu Basin. ISPRS Int. J. Geo-Inf. 2019, 8, 528. [Google Scholar] [CrossRef]
- Sobol, I.M. Sensitivity Estimates for Nonlinear Mathematical Models. Math. Model. Comput. Exp. 1993, 1, 407. [Google Scholar]
- Shuler, C.K.; Dulai, H.; Leta, O.T.; Fackrell, J.; Welch, E.; El-Kadi, A.I. Understanding surface water-groundwater interaction, submarine groundwater discharge, and associated nutrient loading in a small tropical island watershed. J. Hydrol. 2020, 585, 124342. [Google Scholar] [CrossRef]
- Zhang, H.; Wang, B.; Liu, D.L.; Zhang, M.; Leslie, L.M.; Yu, Q. Using an improved SWAT model to simulate hydrological responses to land use change: A case study of a catchment in tropical Australia. J. Hydrol. 2020, 585, 124822. [Google Scholar] [CrossRef]
- Akbaş, A.; Freer, J.; Özdemir, H.; Bates, P.D.; Turp, M.T. What about reservoirs? Questioning anthropogenic and climatic interferences on water availability. Hydrol. Process. 2020, 34, 5441–5455. [Google Scholar] [CrossRef]
- Zeiger, S.J.; Owen, M.R.; Pavlowsky, R.T. Simulating nonpoint source pollutant loading in a karst basin: A SWAT modeling application. Sci. Total Environ. 2021, 785, 147295. [Google Scholar] [CrossRef]
- Ren, D.; Engel, B.; Mercado, J.A.V.; Guo, T.; Liu, Y.; Huang, G. Modeling and assessing water and nutrient balances in a tile-drained agricultural watershed in the U.S. Corn Belt. Water Res. 2022, 210, 117976. [Google Scholar] [CrossRef]
- Moriasi, D.N.; Arnold, J.G.; Van Liew, M.W.; Bingner, R.L.; Harmel, R.D.; Veith, T.L. Model Evaluation Guidelines for systematic quantification of accuracy in watershed simulations. Trans. ASABE 2007, 50, 885–900. [Google Scholar] [CrossRef]
- Thiemig, V.; Rojas, R.; Zambrano-Bigiarini, M.A. Hydrological Evaluation of Satellite-based Rainfall Estimates Over the Volta and Baro-Akobo Basin. J. Hydrol. 2013, 499, 324–338. [Google Scholar] [CrossRef]
- Kouchi, D.H.; Esmaili, K.; Faridhosseini, A.; Sanaeinejad, S.H.; Khalili, D.; Abbaspour, K.C. Sensitivity of Calibrated Parameters and Water Resource Estimates on Different Objective Functions and Optimization Algorithms. Water 2017, 9, 384. [Google Scholar] [CrossRef]
- Nash, J.E.; Sutcliffe, J.V. River Flow Forecasting through Conceptual Models Part I—A Discussion of Principles. J. Hydrol. 1970, 10, 282–290. [Google Scholar] [CrossRef]
- Gupta, H.V.; Kling, H.; Yılmaz, K.K.; Martinez, G.F. Decomposition of the mean squared error and NSE performance criteria: Implications for improving hydrological modelling. J. Hydrol. 2009, 377, 80–91. [Google Scholar] [CrossRef]
- Her, Y.; Jeong, J. SWAT+ Versus SWAT2012: Comparison of sub-daily urban runoff simulations. Trans. ASABE 2018, 61, 1287–1295. [Google Scholar] [CrossRef]
- Barresi Armoa, O.L.; Sauvage, S.; Houska, T.; Bieger, K.; Schürz, C.; Sánchez Pérez, J.M. Representation of Hydrological Components under a Changing Climate—A Case Study of the Uruguay River Basin Using the New Version of the Soil and Water Assessment Tool Model (SWAT+). Water 2023, 15, 2604. [Google Scholar] [CrossRef]
- Debele, B.; Srinivasan, R.; Ashvani, G. Comparison of Process-Based and Temperature-Index Snowmelt Modeling in SWAT. Water Resour. Manag. 2010, 24, 1065–1088. [Google Scholar] [CrossRef]
- Myers, D.; Ficklin, D.L.; Robeson, S.M. Incorporating rain-on-snow into the SWAT model results in more accurate simulations of hydrologic extremes. J. Hydrol. 2021, 603, 126972. [Google Scholar] [CrossRef]
- Kardhana, H.; Lihawa, A.W.I.; Rohmat, F.I.W.; Wulandari, S.; Harjupa, W.; Adiprawita, W.; Kardena, E.; Kusuma, M.S.B. Water Balance Analysis in the Majalaya Watershed: Two-Step Calibration and Application of the SWAT+ Model for Low-Flow Conditions. Water 2024, 16, 3498. [Google Scholar] [CrossRef]
- Sertel, E.; Imamoglu, M.Z.; Cuceloglu, G.; Erturk, A. Impacts of Land Cover/Use Changes on Hydrological Processes in a Rapidly Urbanizing Mid-latitude Water Supply Catchment. Water 2019, 11, 1075. [Google Scholar] [CrossRef]
- Alkan, M.Ö.; Hepcan, Ş. Water Sensitive spatial planning in terms of sustainable stormwater management: The case of Bornova Stream Catchment (Izmir), Turkey. Urban Water J. 2022, 20, 1317–1330. [Google Scholar] [CrossRef]
- Awotwi, A.; Anornu, G.K.; Quaye-Ballard, J.A.; Annor, T.; Forkuo, E.K.; Harris, E.; Agyekum, J.; Terlabie, J.L. Water balance responses to land-use/land-cover changes in the Pra River Basin of Ghana, 1986–2025. Catena 2019, 182, 104129. [Google Scholar] [CrossRef]
- Hua, A.K. Application of Ca-Markov model and land use/land cover changes in Malacca River Watershed, Malaysia. Appl. Ecol. Environ. Res. 2017, 15, 605–622. [Google Scholar] [CrossRef]
- Li, Y.; Chang, J.; Luo, L.; Wang, Y.; Guo, A.; Ma, F.; Fan, J. Spatiotemporal impacts of land use land cover changes on hydrology from the mechanism perspective using SWAT model with time-varying parameters. Hydrol. Res. 2018, 50, 244–261. [Google Scholar] [CrossRef]
Disclaimer/Publisher’s Note: The statements, opinions and data contained in all publications are solely those of the individual author(s) and contributor(s) and not of MDPI and/or the editor(s). MDPI and/or the editor(s) disclaim responsibility for any injury to people or property resulting from any ideas, methods, instructions or products referred to in the content. |
© 2025 by the authors. Licensee MDPI, Basel, Switzerland. This article is an open access article distributed under the terms and conditions of the Creative Commons Attribution (CC BY) license (https://creativecommons.org/licenses/by/4.0/).