Article

Transient Effects of Air and Oxygen Nanobubbles on Soil Moisture Retention and Soil–Substance Interactions in Compost-Amended Soil

by
Arvydas Povilaitis
and
Yeganeh Arablousabet
*
Department of Water Engineering, Vytautas Magnus University, K. Donelaičio g. 58, 44248 Kaunas, Lithuania
*
Author to whom correspondence should be addressed.
Water 2025, 17(13), 1923; https://doi.org/10.3390/w17131923 (registering DOI)
Submission received: 2 June 2025 / Revised: 20 June 2025 / Accepted: 25 June 2025 / Published: 27 June 2025
(This article belongs to the Section Soil and Water)

Abstract

This study examined the impact of watering with air and oxygen nanobubble-saturated water (NBSW) on soil moisture retention, electrical conductivity (EC), nutrient leaching, and CO2 emissions in sandy loam (SL) and silty clay loam (SCL) soils amended with composted sludge (CS). The results revealed that air nanobubbles (air NBs) had greater stability, while oxygen nanobubbles (ONBs) showed lower stability but higher oxygen diffusion potential. Soil moisture under NBSW treatment was more sensitive to changes in ambient conditions and tended to decrease due to higher evaporation compared to conventional water. NBSW was more effective in enhancing moisture in SL soil than in SCL soil. Overall, the results revealed that the application of NBSW tended to increase soil compaction due to stimulation of microbial activity; however, air NBs may temporarily reduce compaction and enhance soil–water interactions. Additionally, NBSW increased soil EC due to increased dissolved ion concentration, with effects more apparent in SL soil than in SCL. This may indicate increased nutrient availability for plant uptake. Notably, NBSW, particularly ONB, showed quick but short-lived changes in soil physical and microbial properties, and soil texture played a significant role in treatment results. Furthermore, the leaching of nutrients and heavy metals remained negligible across all treatments. The study confirms that using NB in controlled environments is more practical for boosting short-term plant growth than improving long-term soil water retention to support more sustainable agriculture systems.

1. Introduction

The application of fine bubble water technology in agricultural irrigation has recently demonstrated great potential. Fine bubble water is defined as water that contains microbubbles (MBs) with dimensions between 100 μm and 1 μm and/or nanobubbles (NBs) with dimensions less than 1 μm [1,2]. High mass transfer efficiency [3], high zeta potential, long stability in waters [4], and the ability to produce mild levels of hydroxyl radicals (•OH) during their collapse [5,6] are unique characteristics that set apart NBs from macro-bubbles and micro-bubbles (MBs). Various forms of NBs, such as air, N2, O2, H2, Ar, and CO2 indicate potential for a diversified gas supply and highlight their versatility and broad applicability in various kinds of industries [7,8,9]. It is reported that the type of gas used in NB suspensions impacts their zeta potential. Zeta potential levels are directly related to the gas solubility and diffusion characteristics [10].
Soil-related benefits have also been observed with various gases. It was highlighted that air NBs improve soil aeration and moisture retention, particularly in sandy loam soils [11,12]. Oxygen nanobubbles (ONBs) have demonstrated the potential to improve soil aeration, increase dissolved oxygen, and shift microbial activity by affecting redox-sensitive soil processes [13]. Increasing oxygen content can help reduce hypoxia and anoxia in the rhizosphere [14]. Other research by Zou et al. demonstrated that oxygenation is a viable method to control the microbial community by transferring oxygen to the crop root zone [15]. Moreover, oxygenated water has been shown to increase the production and quality of tomatoes [16], maize [17], cotton [18], and cucumbers [19]. Reactive oxygen species (ROS) produced by NBs at appropriate levels have been shown in previously published studies to act as signal molecules and enhance plant development [14,18,20,21,22]. Liu et al. found that low concentrations of H2O2 and air NB water promoted barley seed germination through influencing the expression of the peroxidase gene, where •OH radicals increased cell survival and proliferation [5]. Other studies have mostly attributed the increase in plant growth to the dissolved oxygen (DO) provided by NBs [23,24]. For example, NBs used for oxygenation in drip irrigation systems have been shown to enhance maize or corn growth and improve root development [14].
In parallel, as a sustainable alternative to chemical fertilizers, sewage sludge (SS) is an ideal fertilizer for its high organic matter (OM) and nutritional content [25]. OM can enhance soil physical characteristics such as aeration and water-holding capacity [16,17], as well as increase the availability of essential nutrients such as phosphorus (P) [18]. Furthermore, sludge contains significant amounts of nitrogen (N), and when appropriately recycled by introducing it into the soil as composted sewage sludge (CSS), its residual impact may give gradual N release to crops [26]. It has been reported that incorporating CSS into sandy loam soils significantly improved physicochemical and hydrological properties, including electrical conductivity (EC) [27], pH [28,29], aggregate stability, bulk density, porosity, moisture content at field capacity and wilting point, and available phosphorus [30,31,32]. Other studies have proven that using sludge improves the soil quality by increasing OM, total N, and, notably, levels of key micronutrients such as copper and zinc. Applying composted sludge (CS) in combination with nanobubble saturated water (NBSW) may yield synergistic benefits for both soil fertility and plant growth. This synergy may arise from the nutrient-rich OM in CS, while NBSW can enhance oxygen availability and facilitate the release of nutrients. These advantages are mostly influenced by soil texture, environmental conditions, and application technique [33,34].
Most research has focused on the effects of NBs on plant growth, while comparatively little attention has been given to the processes occurring within the soil itself. This presents a challenge, as the mechanisms governing NB behavior in different soil types remain poorly understood. Although progress has been made in NB technology, gaps persist in understanding the long-term effects of commonly used oxygen and air NBs on soils with varying textural compositions. These effects may further vary when NBs are combined with organic additives such as CS, which may influence the interaction between OM and soil structure. Furthermore, it remains unclear whether NBSW provides longer-lasting improvements in soil water dynamics and nutrient retention compared to conventional watering. Addressing these aspects is essential for maximizing the application of air and oxygen NBs in agricultural practices and understanding their potential soil-related benefits. In this study, air and oxygen NBSWs were selected due to their availability and environmental compatibility. The objectives of this study were to (1) investigate the impact of air and oxygen NBSWs on soil moisture dynamics and retention in silty clay loam (SCL) and sandy loam (SL) soils amended with CS in comparison with conventional watering; (2) quantify water losses through leaching and evaluate the quality of both water input and leached-out substances in composted sludge-amended soils treated with air and oxygen NBs compared to conventional water; and (3) analyze the temporal effects of NB watering and the changes in soil moisture and leaching dynamics, particularly in response to switching between oxygen and air nanobubbles.

2. Materials and Methods

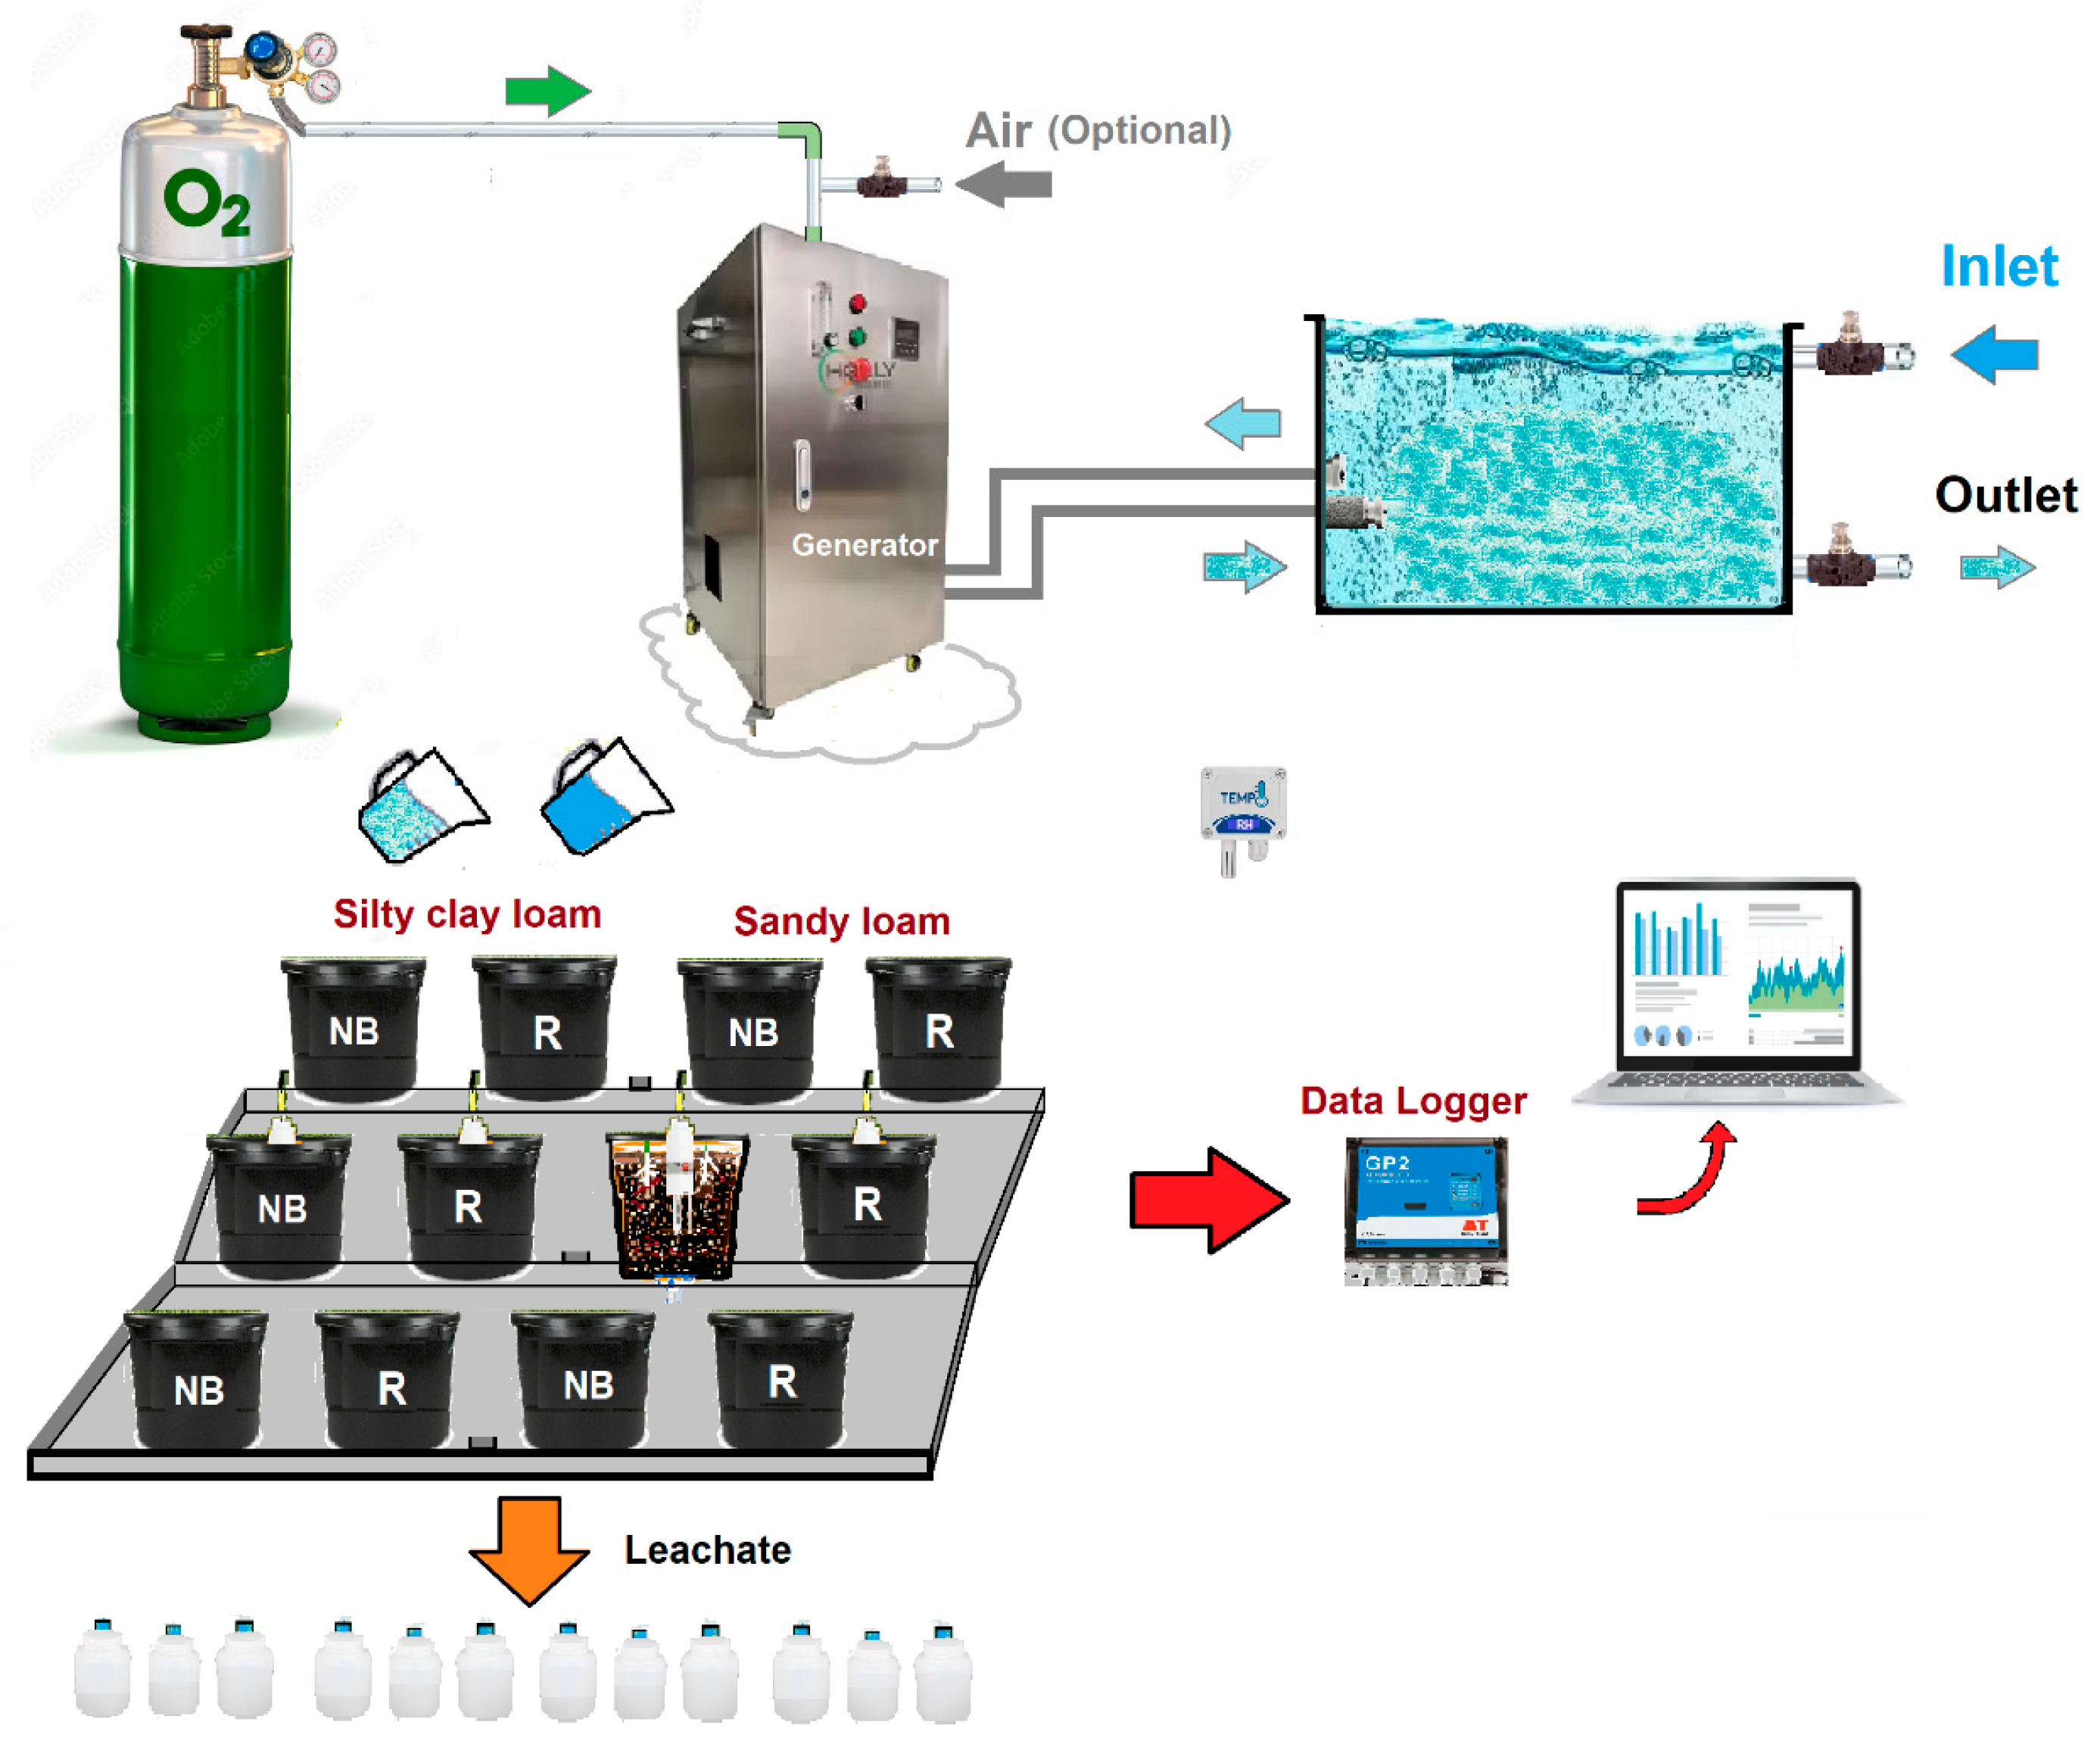
2.1. Experimental Design and Treatments

This study builds on a previous experimental phase that employed some similar equipment and methods [12]. Two parallel experiments (E1 and E2) were performed at Vytautas Magnus University in Kaunas, Lithuania, from 5 June 2024 to 26 May 2025. Each experiment included a single soil type and six soil buckets, divided into two scenarios with three replicates each: scenarios 1 and 2 in E1, and scenarios 3 and 4 in E2. Each bucket was 22 cm in height and 0.060 m2 in surface area. In Experiment 1 (E1), SCL soil was used, while Experiment 2 (E2) utilized SL, all of which included a mixture of composted sludge.
To ensure homogenization, the air-dried soils were thoroughly blended and passed through a 10 mm sieve using a high-volume vessel, after which the mixtures were transferred into individual buckets. Following this, 200 g of air-dried composted sludge (equivalent to approximately 33 t/ha), sieved through a 7.5 mm mesh, was incorporated into each soil bucket and thoroughly mixed. Although no plants were grown, the compost amendment was applied to reflect the conditions typical for cultivating perennial grasses. In the final stage, three replicates were created for each treatment by weighing the compost-amended buckets with equal soil moisture content, each filled to a total volume of 12 L. The buckets were then covered with paper and incubated for one week at room temperature. Moisture sensors were placed vertically at the center of each bucket, positioned between one-third and two-thirds of the total 22 cm bucket height. Soil moisture dynamics in the deeper layers, at approximately two-thirds of the bucket depth, was recorded at 3 h intervals, while in the top 0–6 cm (upper third of the height) it was measured every 1 to 2 days. Table 1 summarizes further details on soil types, compost composition, watering treatments, and chemical properties across each of four scenarios.
To ensure consistency by applying the same amount of water and to establish a uniform baseline near field capacity, all buckets were watered one day before the start of measurements with an equal volume (2.7 L) of either NBSW or conventional water, based on initial soil moisture content. Although field capacity was only reached in the sandy loam, due to differences in soil texture, this approach ensured that the amount of water in the soil at the start of measurements was consistent across scenarios within the same experiment. Subsequently, three manual watering treatments were designed for each experiment to compare the effects of ambient air NBSW and ONB versus conventional water across different soil types amended with CS. Water loss was assessed through soil moisture monitoring using sensors, combined with the periodic weighing of the buckets prior to each watering event. To produce NBSW, the same water used for conventional watering was saturated with either ambient air NBs or ONBs through a pressurized gas–liquid mixing process, using the HLYZ-002 nanobubble generator (HOLLY Technology, PRC). According to the ZetaView® nanoparticle tracking analysis, the nanobubbles ranged in size from 75.7 nm to 274.7 nm, and 84.4% of the bubbles were smaller than 200 nm. For ONB generation, a compressed oxygen cylinder filled with high-pressure oxygen (50 L, 315 bar, EN ISO 14175-01-0) was used to supply oxygen to the NB generator. Each NB generation event with 40 L of water lasted 10 min. Watering was performed manually for up to 1.0 h per session, with between 0.5 and 3.0 L (average 1.0 L) of water applied per bucket. The frequency of watering was irregular and occurred only when the soil moisture content in at least one scenario within each experiment dropped by more than 20% from the level recorded at the start of measurements. A normalization approach was used to apply equal watering volumes across all treatments, based on a variable target moisture content and the estimated amount of water required for each scenario to reach this target. Accordingly, for each event, a single standardized watering volume—selected as the average, minimum, or maximum—was applied equally to all buckets, ensuring consistent watering despite differences in moisture content at the time of application. Higher volumes, up to 3.0 L, were only applied occasionally to induce leaching. After each watering, the water that drained from the soil buckets was collected in bottles that were attached to their bases for further analysis. The scheme of the experimental setup is shown in Figure 1.

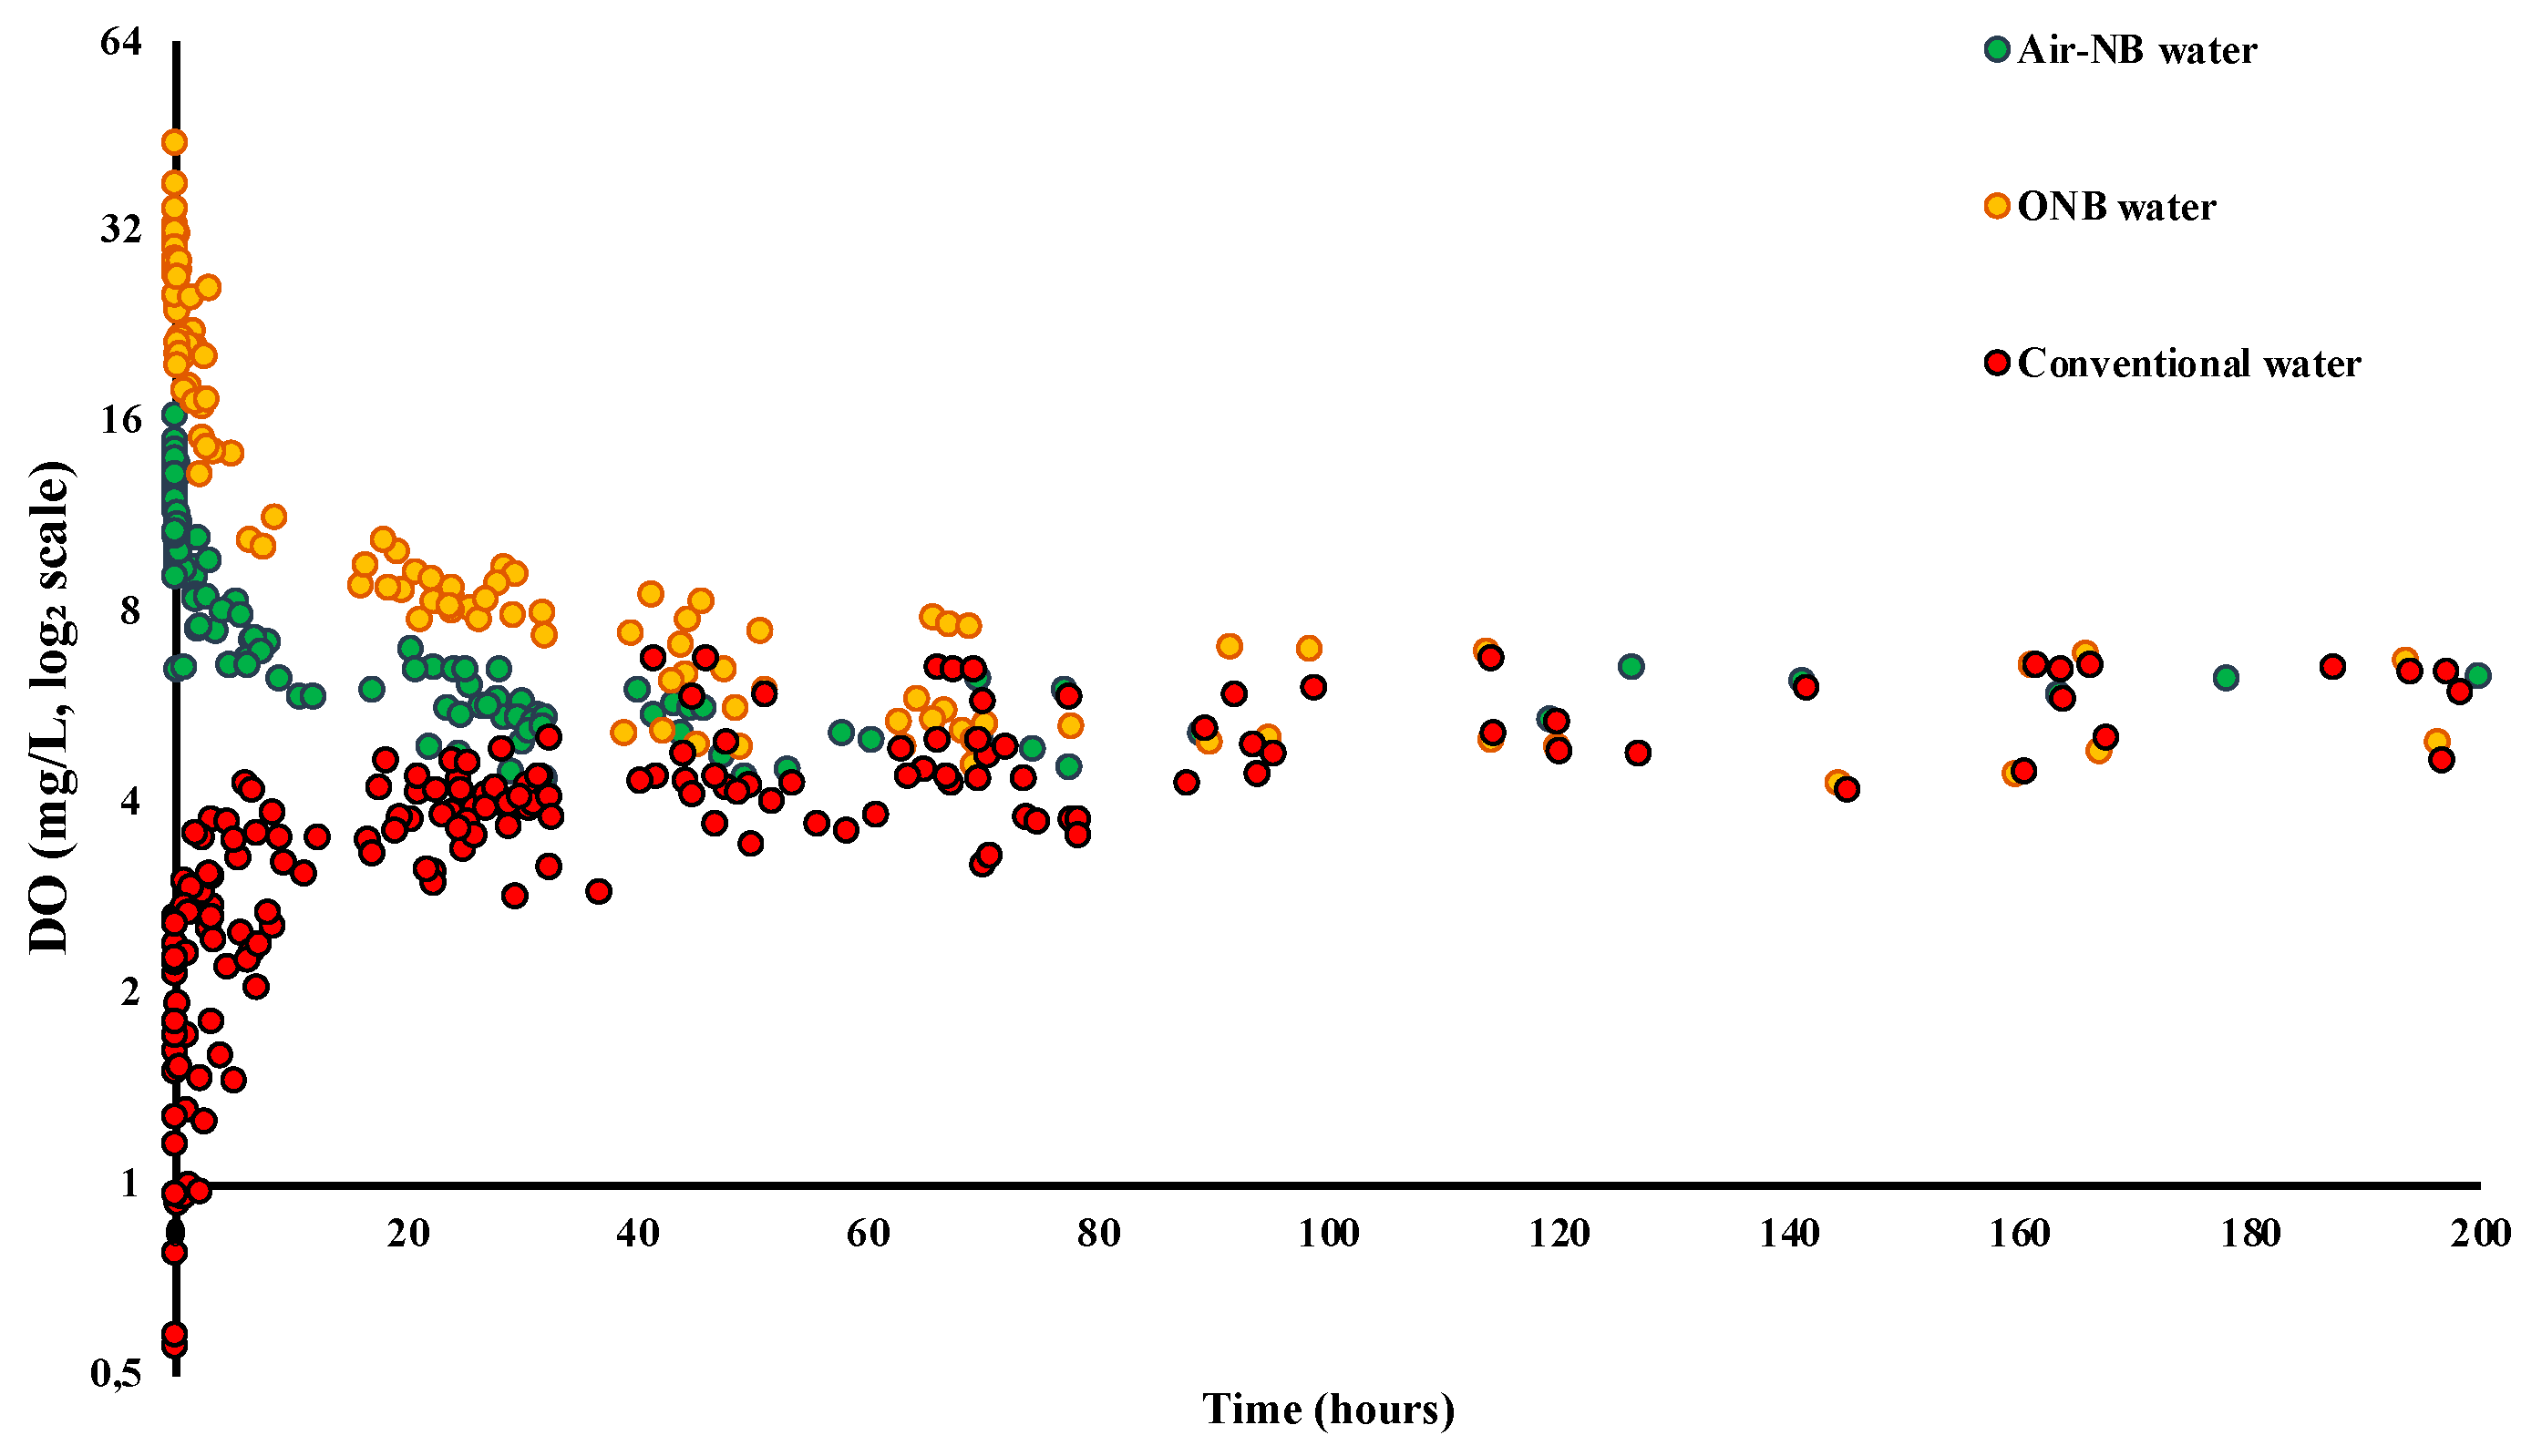
2.2. Dissolved Oxygen Decay

A dissolved oxygen (DO) decay/depletion test was conducted prior to soil watering to indirectly assess the stability of NBs by analyzing the DO decay dynamics, which indicate their collapse, dissolution, or gas release behavior in the prepared water types. An equal volume (4.0 L) of each water sample was stored under identical conditions, and the DO content was monitored over a 0 to 200 h period using a portable meter (HI 98193, Hanna® Instruments, Leighton Buzzard, UK). Measurements were taken at irregular intervals, with time reported in hours and minutes to ensure an accurate representation of the decay. In the NBSW treatments, the primary aim was to determine the manner of gradual DO decrease over time, whereas in conventional water, the emphasis was on increasing dissolved oxygen via diffusion from the ambient air until its concentration reached a maximum, with DO levels eventually equalizing between both treatments. The obtained data allowed for the approximation of the equilibrium crossing point, when DO levels across different water types stabilized. This analysis provided greater clarity on the temporal oxygen availability, which may influence soil moisture behavior and microbiological activity throughout the experimental treatments.

2.3. Soil Moisture Measurements

Soil moisture was recorded every 3 h using ML3 ThetaProbe soil moisture sensors (Delta-T Devices, Cambridge, UK), positioned vertically into the deeper layers and connected to a GP2 data logger (Delta-T Devices). To assess the effect of NB gas type on soil moisture dynamics, the NB treatment was switched throughout specific time intervals. Air NBs were applied between 5 June and 16 August 2024, followed by ONBs from 17 August to 7 November 2024. The treatment then switched to air NBs from 8 November 2024 to 6 February 2025, then returned to ONBs from 7 February 2025 to 15 May. From 16 May 2025, onward, air NBs reintroduced as the last phase of the experiments. Furthermore, environmental factors such as air temperature and relative humidity were also recorded at intervals every 3 h. In both experiments, all buckets received an identical total water input of 26 L. In addition, leachate water was collected and analyzed following each watering session in order to quantify water loss.

2.4. Soil pH and Compaction Tests

To assess the impact of different water types on soil compaction, the cone penetrometer tests were conducted at irregular intervals under varying soil moisture conditions using a BK-PE1 handheld penetrometer (Biobase®, Jinan, China). Moreover, a portable meter, GroLine HI981030 (Hanna@ instruments), was used to test the pH of the soil across different scenarios on a regular basis. The soil electrical conductivity (EC), temperature, and moisture content in the upper 0–6 cm topsoil layer were measured using a digital sensor probe WET-2 (ICT International, Armidale, Australia). The ML3 ThetaProbe and WET-2 soil moisture sensors were intercalibrated prior to the start of the experiments to ensure measurement consistency and data comparability.

2.5. Soil Water Leachate and CO2 Emissions

To assess nutrient loss and other constituents (nitrate (NO3), nitrite (NO2), sulfate (SO42−), phosphate (PO43−), calcium (Ca2+), potassium (K+), magnesium (Mg2+), total iron (Fe3+), manganese (Mn2+), chromium (Cr3+), copper (Cu2+), total dissolved solids (TDSs), chemical oxygen demand (COD), pH, and free chlorine) leached from the soil after each watering event, a controlled bucket-based leaching experiment was set up, and both the applied water and the leached-out water were subjected to chemical analysis. Separate containers were used to collect the leachate draining from the bottom of each bucket, and water leached out from each soil bucket under the same scenario was thoroughly collected and mixed to generate a composite sample. In addition to leachate analysis, soil CO2 emissions were periodically measured using a soil respiration meter (SRM-3501T, Biobase, China) to assess respiration dynamics under varying water treatments.
Therefore, the measurements of NO3, NO2, SO42−, and Fe3+ were recorded using a MaxiDirect MD600 photometer (Lovibond®, Amesbury, UK) with corresponding powder reagents [12]. When NO3 levels exceeded 177 mg/L (equal to 40 mg/L of N), a Horiba LAQUAtwin NO3 meter (Horiba Ltd., Kyoto, Japan) was used for improved accuracy. TDS and pH were measured with a portable multimeter (HI9813-51, Hanna® Instruments Ltd., Leighton Buzzard, UK), which had a TDS range of 0–2000 mg/L. The amounts of Ca2+, K+, and Mg2+ were also determined using the HI-83099 multi-parameter photometer. The amount of PO43− was assessed using an HI-713 colorimeter, while COD was measured with the HI-83099-02 COD photometer. Additionally, the HI-83099-02 portable photometer (Hanna® Instruments Ltd., UK) was also used in combination with high-range reagent kits to quantify heavy metals such as Mn2+, Cr3+, Cu+, and free chlorine.

2.6. Statistical Analysis

To evaluate the differences between treatment groups across different soil types and water conditions, statistical analyses were conducted using the PAST software program (version 4.0). The non-parametric Kruskal–Wallis test was employed to identify statistically significant differences among the groups.

3. Results

3.1. Dissolved Oxygen Decay

The dissolved oxygen (DO) dynamics varied substantially across water types over the 0–100 h monitoring period (Figure 2). In air-NB water, DO concentrations ranged from 16.4 to 4.4 mg/L from the beginning until it reached the minimum, while in ONB water, it ranged from 44.5 to 4.3 mg/L. Conventional waters exhibited an increasing DO range from 0.56 to 6.8 mg/L. The most significant differences were observed in the first 1–3 h after NB generation. Importantly, between 60 and 70 h, the dissolved oxygen (DO) levels in all three water types reached equilibrium, despite their initially distinct behaviors. The highest DO gradient was observed within the first 0.5 h following nanobubble generation. The steep slope of DO decay during this period reflected the outgassing effect, as DO began to decline from an initially supersaturated state. During this time, the average DO decrease in ONB-treated water was 23%, compared to 6% in air NB-treated water. Subsequently, within the first 3 h after NB generation, DO decreased by 44% in ONB water and 23% in air NB water. After 5 h, the reductions were 63% and 36%, respectively. Following this phase, the DO decay transitioned into a gentler slope, indicating a slower rate of oxygen loss. Ultimately, all water types reached equilibrium at approximately 6.4 mg O2/L, exhibiting a nonlinear pattern of oxygen decay or an increase. Between 5 and 60 h, the DO decay gradient in ONB water was, on average, 3.2 times greater than in air NB water. This demonstrated that ONB-treated water resulted in a steeper gradient, a shorter bubble stability period, faster collapse, and greater diffusion potential compared to the air NBs. The structural differences between ONBs and air NBs likely contributed to the longer lifetimes and greater stability observed in air NBs. However, it is important to note that these measurements reflect the situation in water, while in soil, the oxygen decay time is much shorter. This is because the soil is full of surfaces (minerals and organic matter) that destabilize nanobubbles. Nevertheless, the prolonged presence of dissolved oxygen in NB treatments, particularly in ONB water, suggests that more stable aerobic conditions can be maintained during subsequent water applications, potentially influencing soil microbial activity and aggregation processes. Statistical testing confirmed that the differences in observed variations in DO levels between the three water types were significant (p < 0.050).

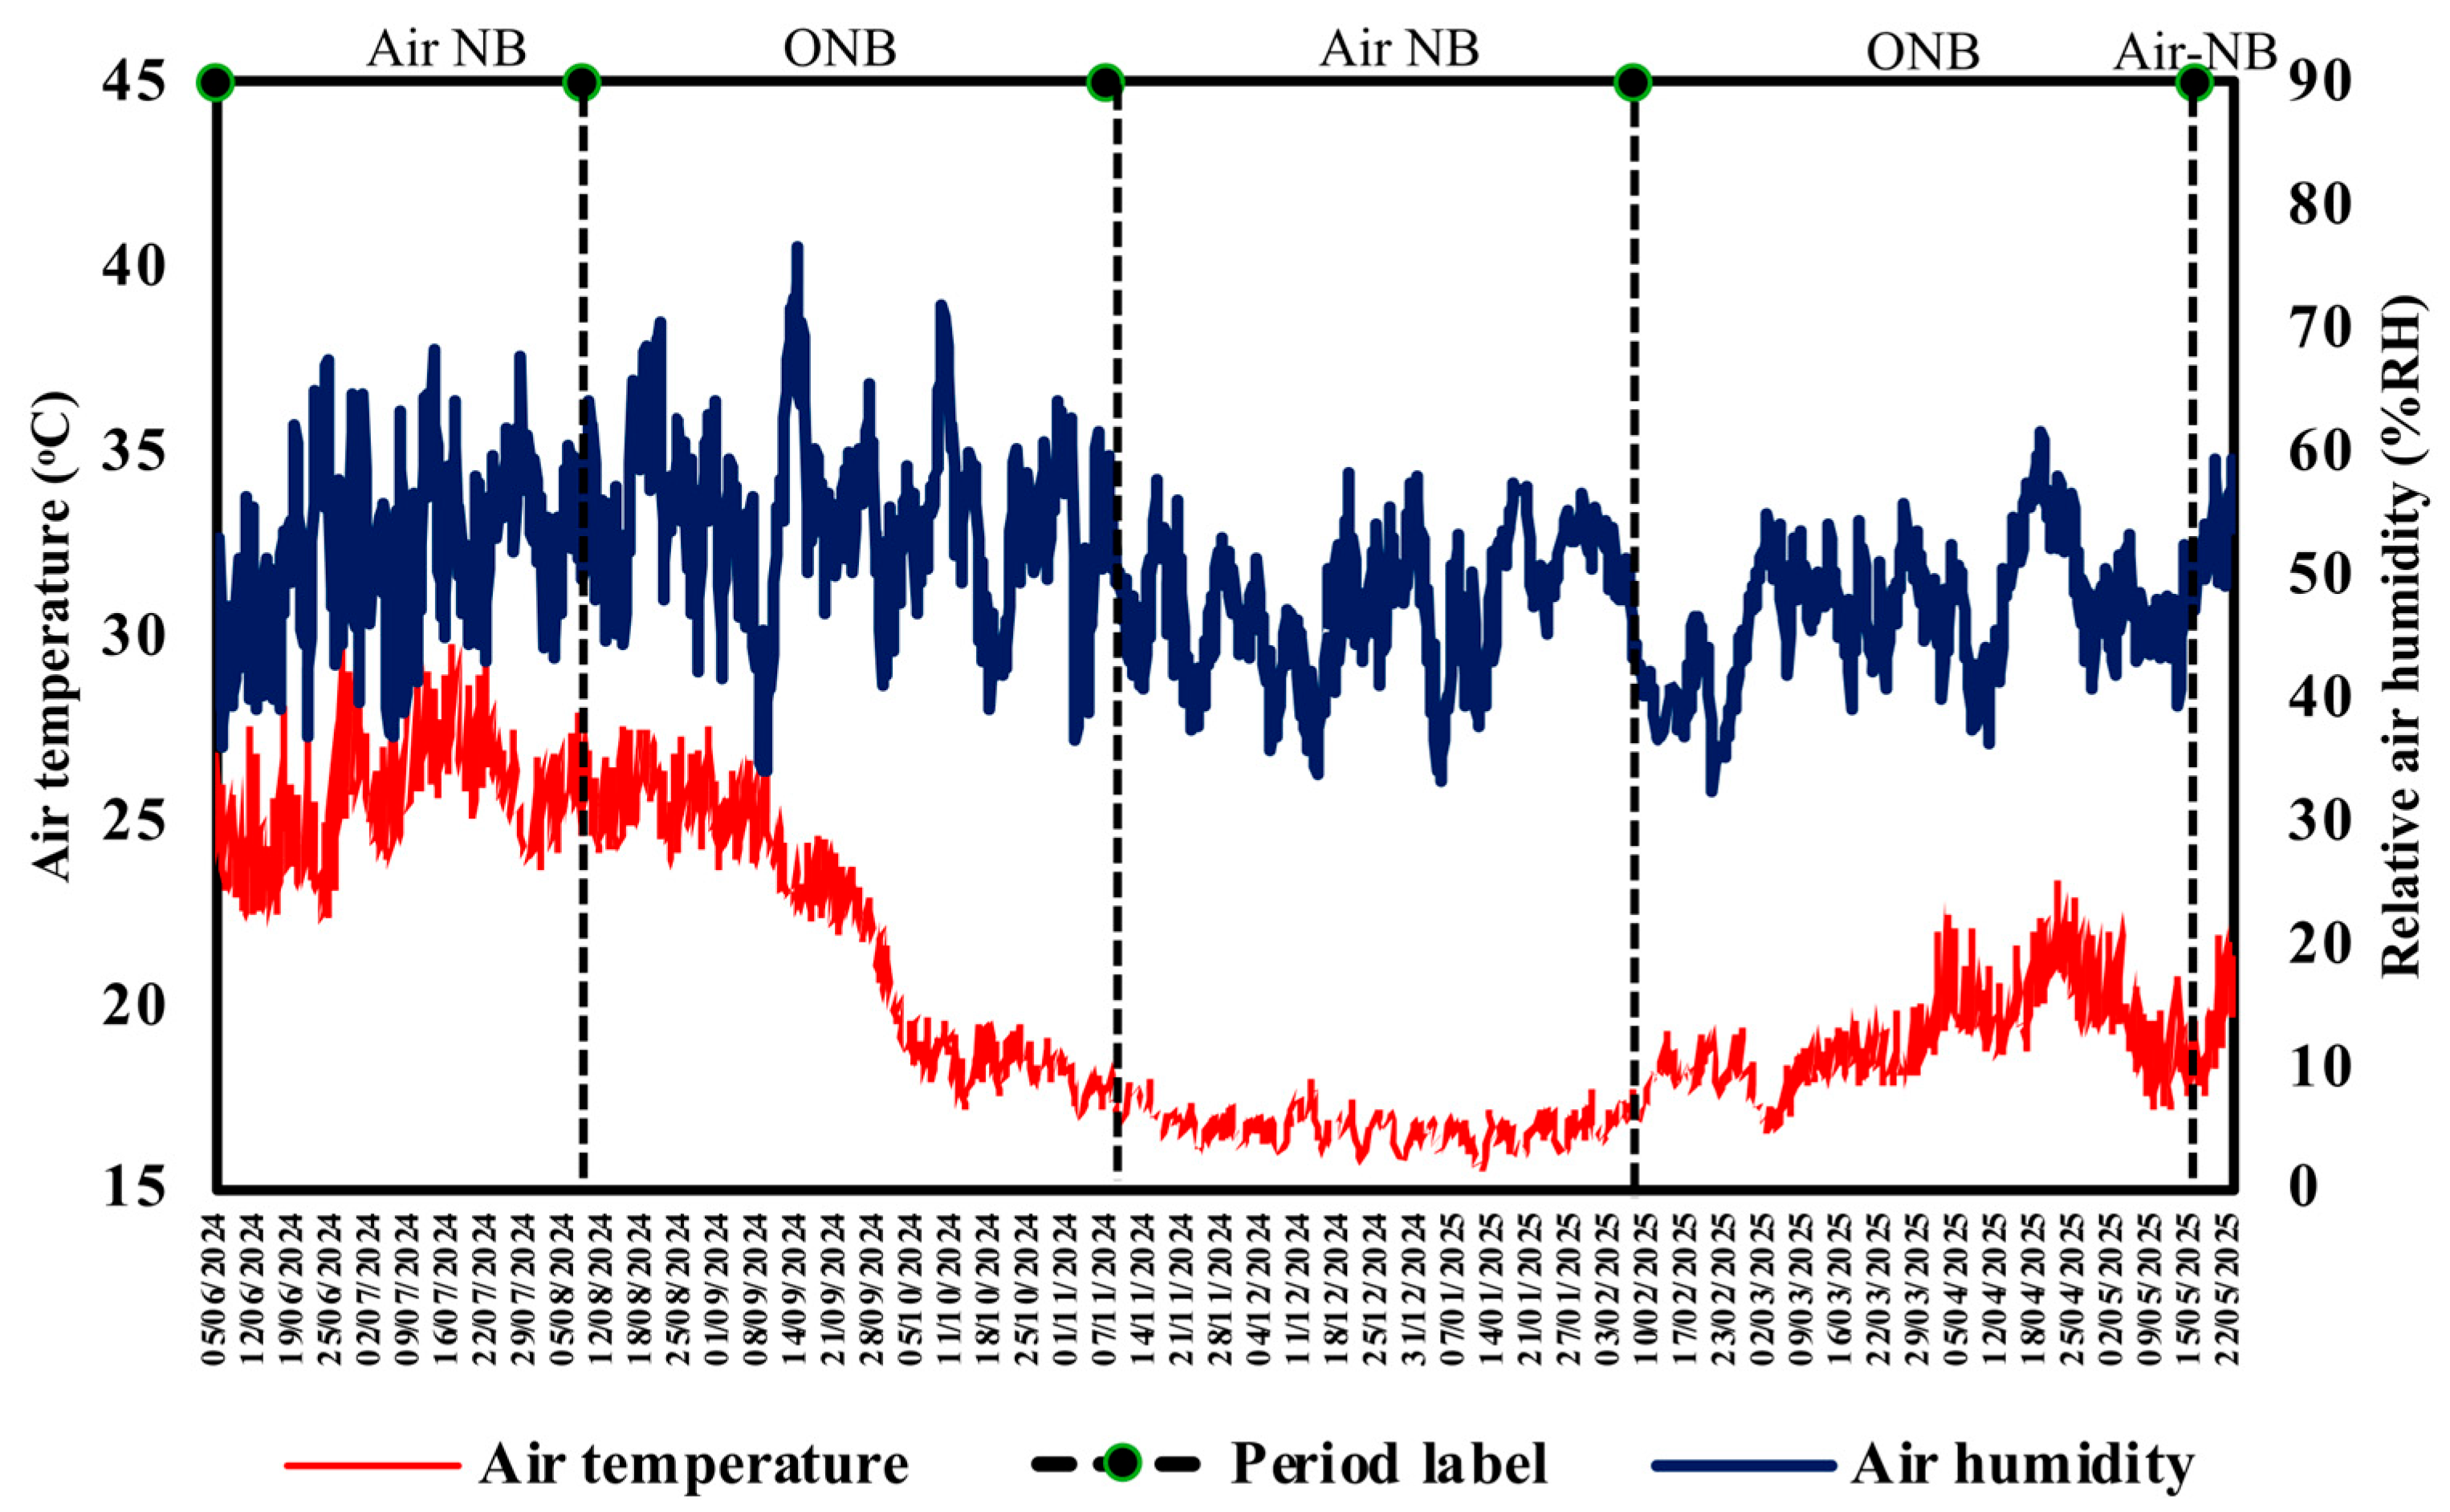
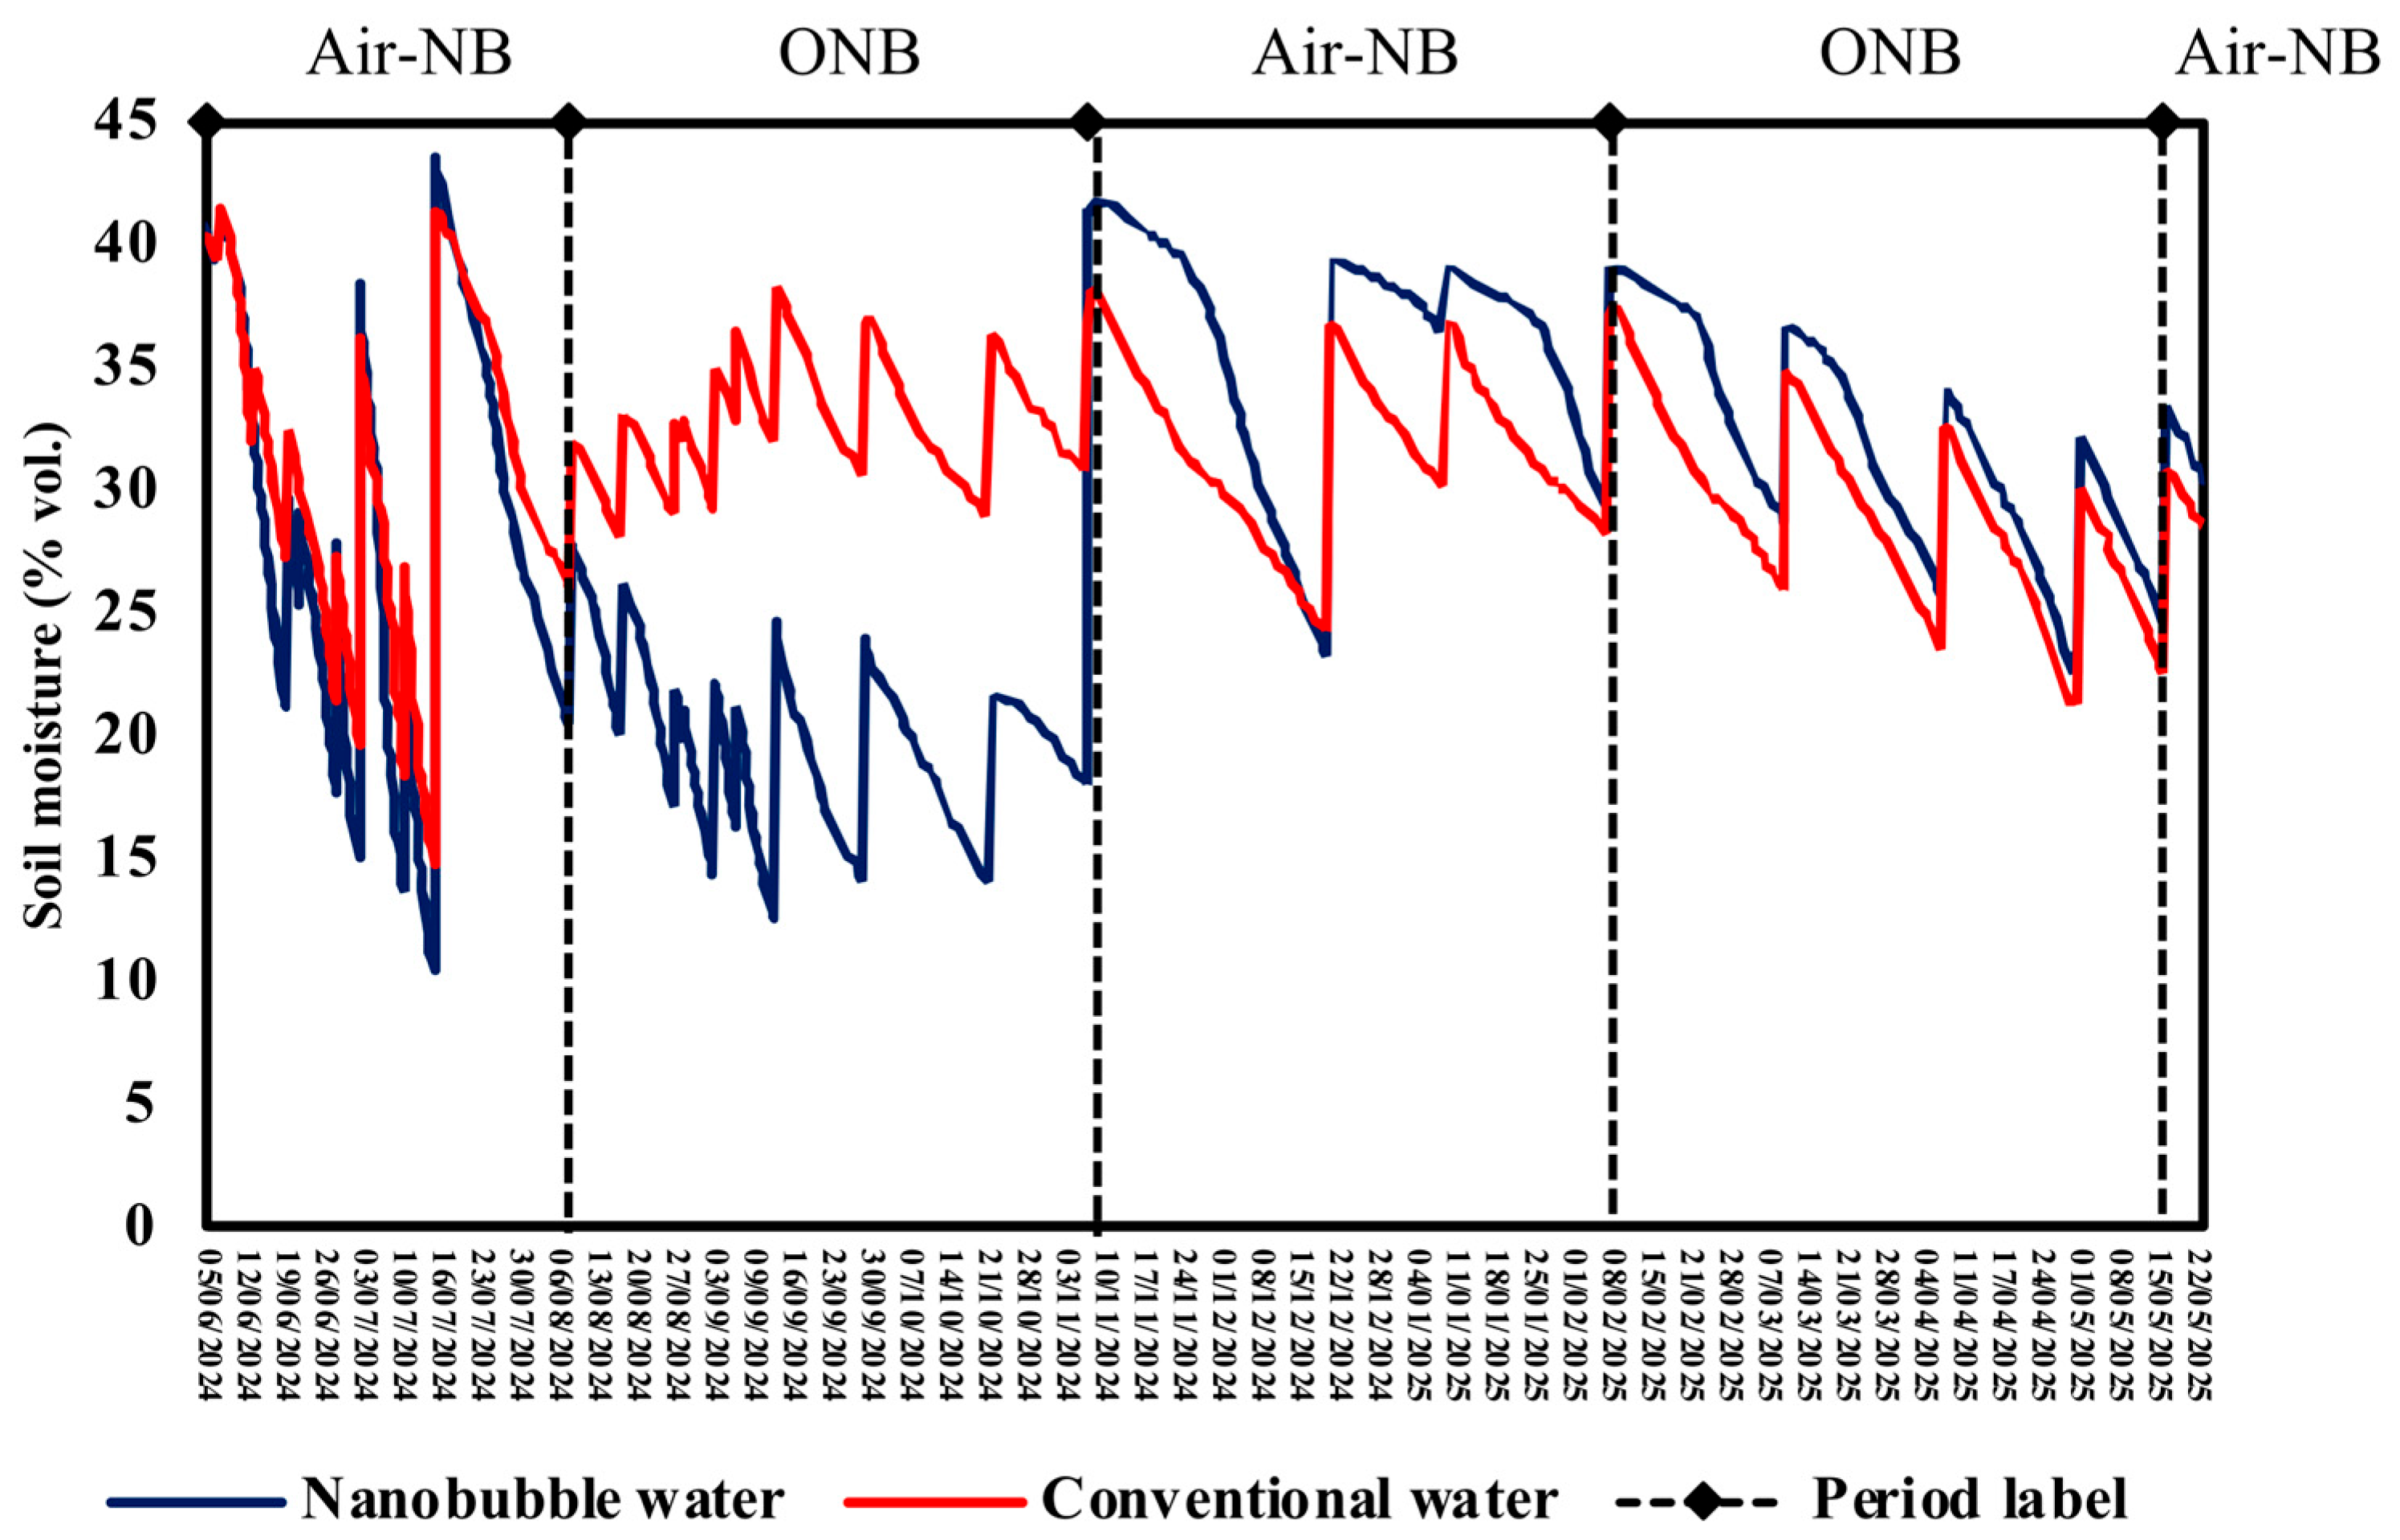
3.2. Air Temperature, RH, and Soil Moisture

During the experiment, air temperature (T °C), and relative humidity (RH) were monitored at the same 3 h intervals as soil moisture to assess the baseline environmental conditions influencing the behavior of NBs and their impact on soil moisture. The average T was 20.3 °C (ranging from 15.5 °C to 30.5 °C), with an average RH of 50% (ranging from 32.5% to 76.6%). Air temperature showed a declining trend over time, while RH demonstrated high variability during the summer months and became more stable with lower values during the autumn–winter months (Figure 3). To better reflect the evaporation potential under given conditions, a vapor pressure deficit (VPD) based on T and RH was calculated and its variation over time is shown in Figure 4. A VPD below 1.0 kPa indicates low evaporation, 1.0–1.5 kPa moderate evaporation, and above 1.5 kPa high evaporation potential [35]. As seen in Figure 5, the dynamics of soil moisture content based on composite curves derived from measurements across three buckets at deeper layers in scenario 1 fluctuated significantly depending on the NB gas type. During the first phase with air-NB, no significant impact was observed on moisture retention at higher VPD compared to conventional watering. In the second phase, ONB-treated soil showed 30.5% lower average moisture content compared to scenario 2. At the beginning of this phase, VPD was higher, and scenario 1 illustrated a sharper decline in moisture content, indicating that the NB-treated soil was more sensitive to higher VPD. This sensitivity continued for a longer period. Scenario 1 showed sharper and more extended declines in moisture levels than the conventional water-treated soil. As VPD slowly reduced, scenario 2 exhibited an increase in moisture content, while scenario 1 stayed lower. In the third phase, when air-NB was reapplied, the moisture content in scenario 1 increased close to scenario 2. However, the average moisture content in the NB-treated soil remained 11.4% lower than in scenario 2, which corresponded with to a lower VPD, and both treatments demonstrated more stable moisture dynamics. When switching to ONB, moisture dynamics across both scenarios were nearly identical. However, the average moisture content in the NB-treated soil was 9% lower than in scenario 2, suggesting no significant effect of the NB gas type when VPD was low. Similarly, in the final phase with air-NB watering, similar behavior was observed, showing the minimal effect of the NB gas type on water retention in SCL soil when evaporation was low.
The soil moisture dynamics varied significantly between scenario 3 and scenario 4 over the four NB watering phases (Figure 6). During the first phase, air NB showed an average moisture that was 8.2% lower than scenario 4 and exhibited faster and deeper drops, resulting in reduced short-term moisture retention. In the ONB phase, moisture levels in scenario 3 were consistently lower than in scenario 4 (66.1% lower average moisture). Although the peaks were reduced, the drying rate remained high. These indicate that, under higher VPD, both NB treatments, particularly ONB, reduced soil moisture retention in SL soil as compared to conventional watering. A significant shift occurred in the second air NB phase. The moisture level in scenario 3 illustrated a 13.3% higher moisture content with higher moisture peaks and slower declines compared to conventional water-treated soil. In several cycles, scenario 3 maintained higher moisture for longer, which indicates that air NB improved moisture retention under lower VPD conditions. In the following ONB phase, scenario 4 maintained an average soil moisture level that was 12.6% lower than scenario 3. The two treatments followed a similar pattern. This indicates that, under a lower VPD, the gas type in ONB watering had a minor effect on soil moisture behavior. Both treatments exhibited almost the same patterns in the final phase, when air NB was utilized once again, demonstrating that the gas type has no effect on water retention in SL soil when VPD is low.
The dynamics of soil moisture content in the 0–6 cm layer were also assessed (see the composite curves in Figure 7). During the first air NB phase, moisture levels in both the top and deeper layers remained similar in each treatment, which indicates limited structural effects at the early stages. In the second phase, the top layer in scenario 1 illustrated sharper declines and higher variability compared to the deeper layer. However, scenario 2 maintained a more uniform distribution. In phase 3, scenario 2 continuously showed faster drying out in the top layer, while scenario 1 demonstrated a closer alignment between the top and deeper layers and improved retention. In phase 4, both scenarios remained relatively stable compared to the previous phase, reflecting lower VPD and minimized water loss from the soil. No significant changes were observed during the final air-NB phase.
The analysis of soil moisture dynamics in the top layer was expanded to include scenarios 3 and 4 (Figure 7c,d). Layer-specific observations revealed that, under high VPD, both conventional and air NB-treated soils showed generally similar trends with sharp declines in the top layer. In the ONB phase, the top layer in scenario 3 maintained more water than the deeper layer for a sustained period, showing accumulation near the surface and less percolation. However, after a brief retention period, this layer dried out more quickly, indicating higher evaporation rates and reduced retention under ONB watering. When air NBs were reapplied, scenario 3 showed consistently higher moisture in the deeper layer compared to the upper layer. It showed that water infiltrated effectively when VPD was low. In contrast, scenario 4 exhibited a more identical distribution between top and deeper layers. During the second ONB phase, scenario 3 exhibited higher moisture in the deeper layer than in the upper layer, whereas scenario 4 kept moisture levels consistent in both layers. In the last phase, both scenarios showed a higher moisture level in the top layer than in the deeper layer. This resulted in a brief surface accumulation following a watering session, with minimal penetration and faster drying, most likely as a result of higher evaporative demand. Furthermore, only 0.2% of the leaching losses were observed in scenario 3, compared to 8.5% in scenario 4, indicating that nanobubbles, especially air NBs, significantly reduced water loss through leaching and enhanced retention in SL soils. The Kruskal–Wallis test confirmed significant differences in soil moisture among the watering treatments (p < 0.050). NB watering had a higher VPD-dependent influence on moisture retention compared to conventional water in SL soil.

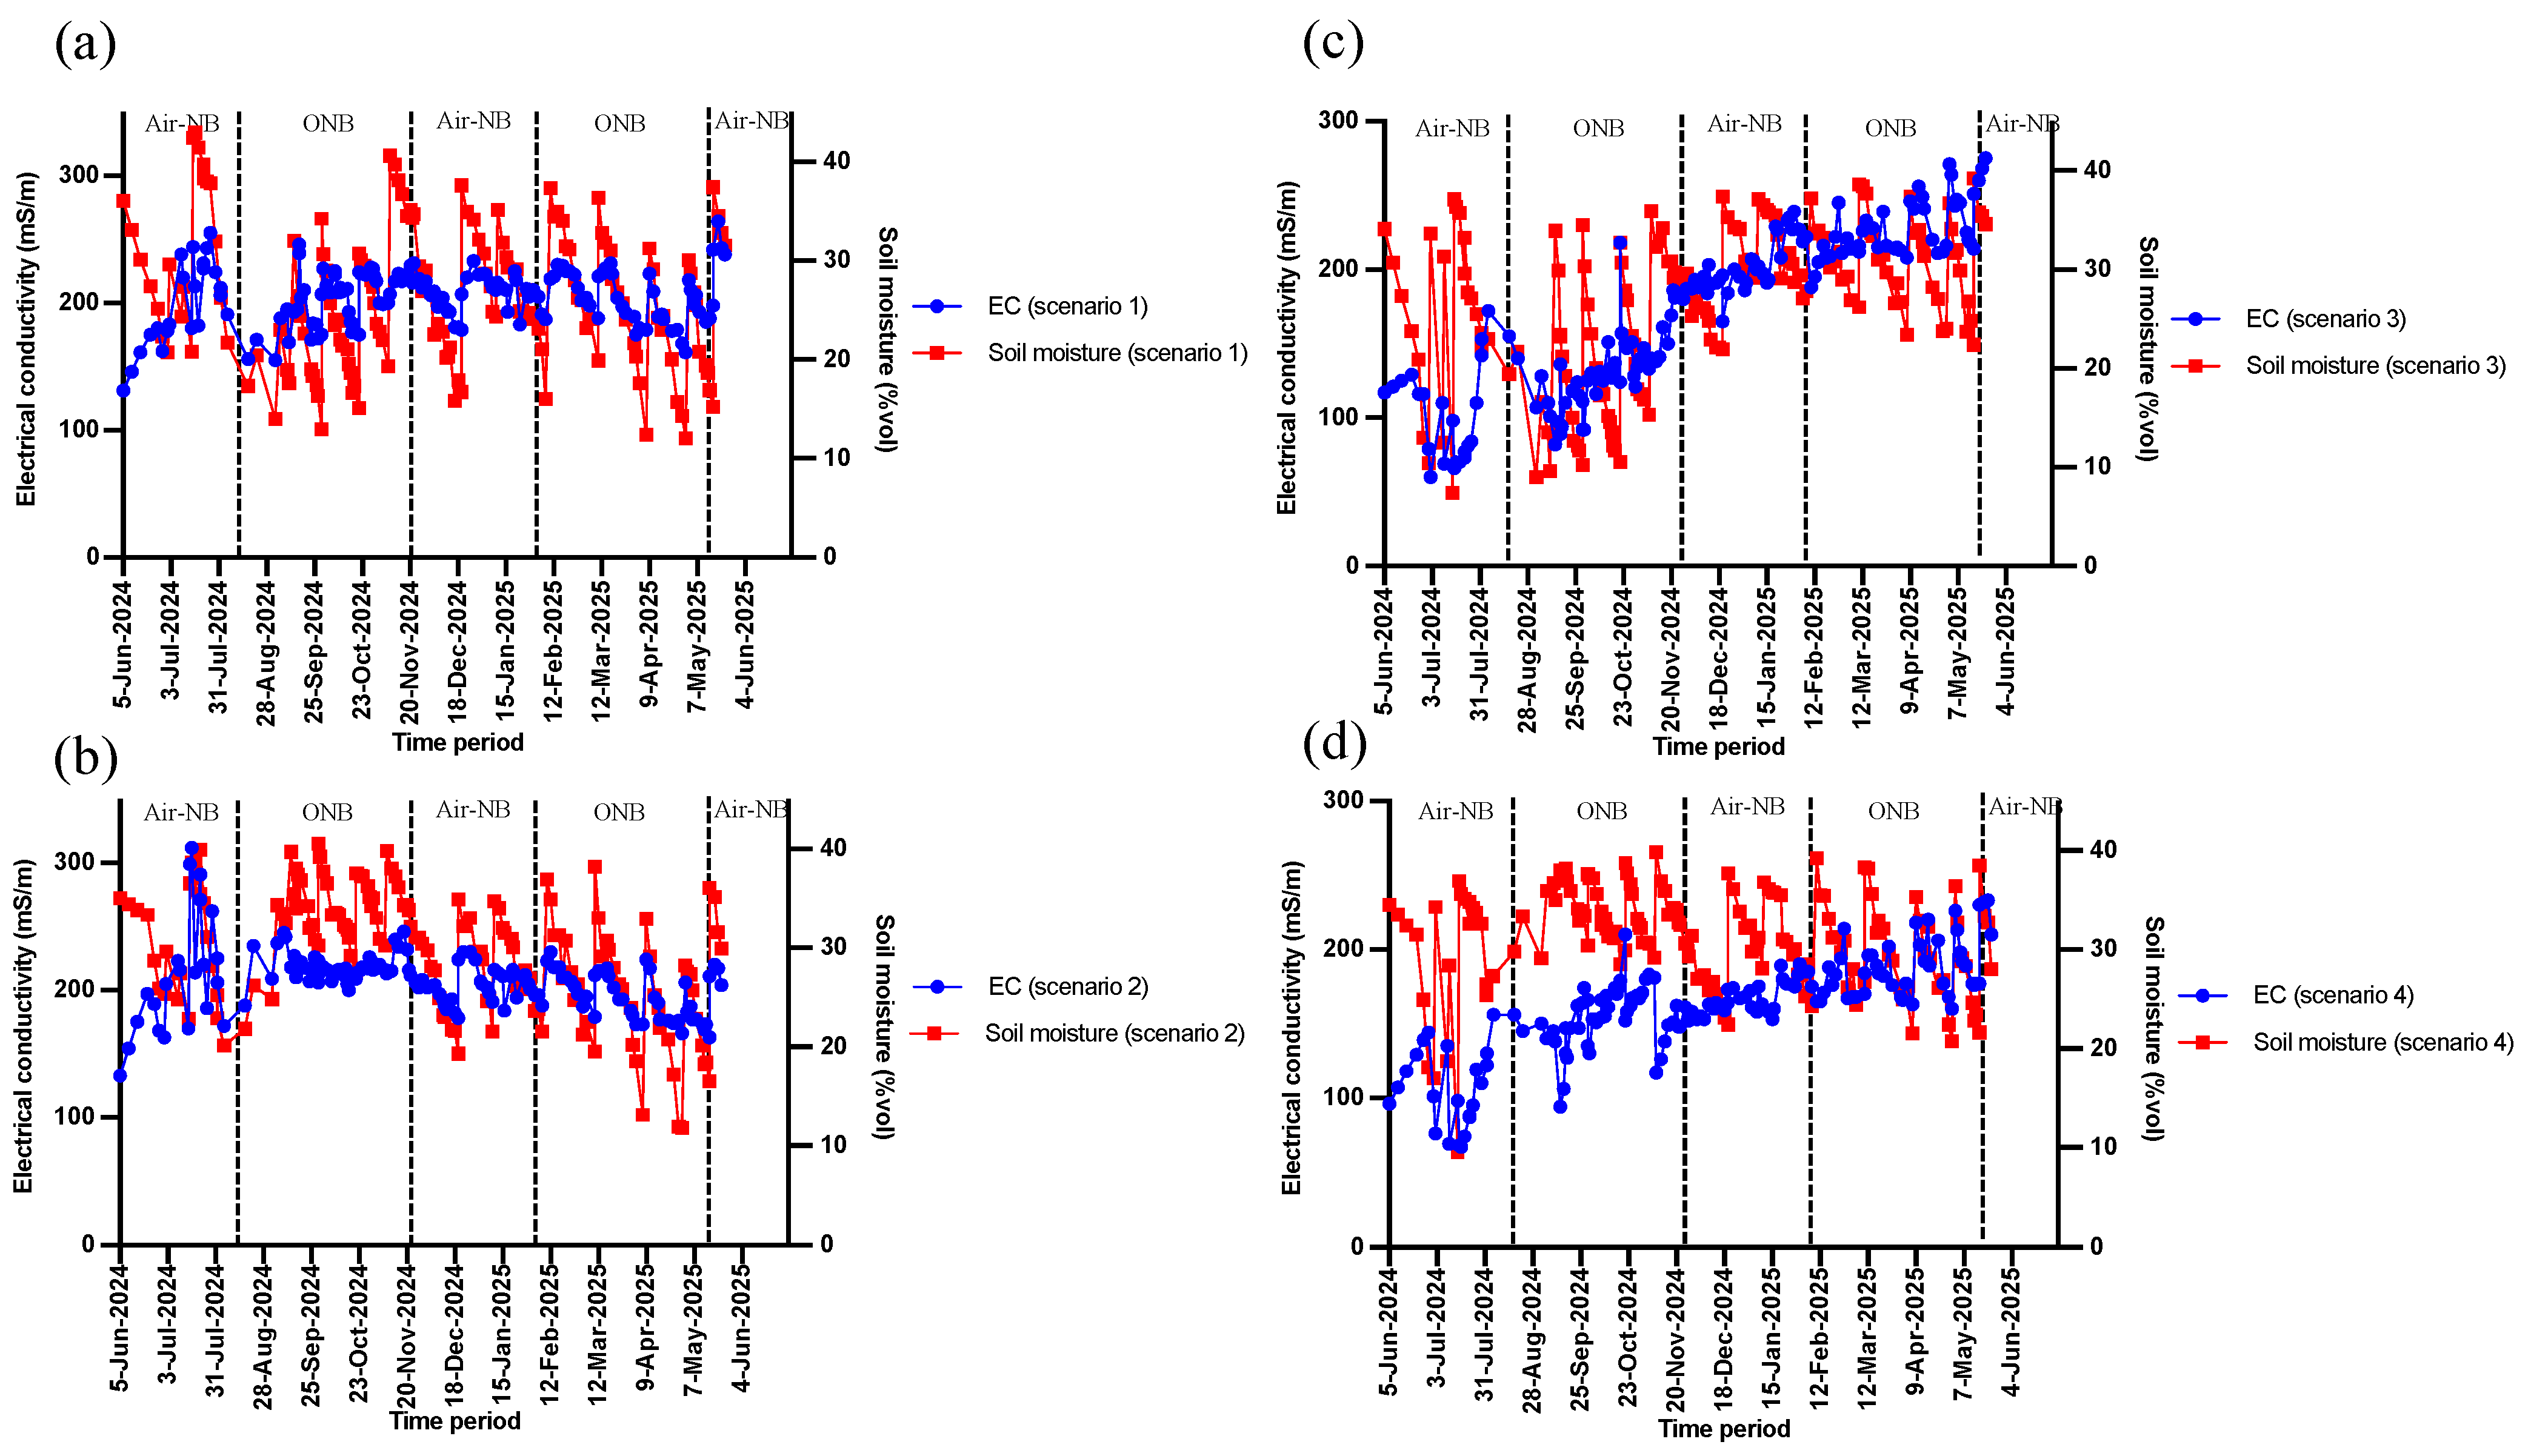
3.3. Electrical Conductivity

Soil T during the observation period in the upper 0–6 cm layer in both experiments did not differ and fluctuated between 16.1 and 29.4 °C. Soil electrical conductivity (EC) was measured to understand the behavior of dissolved ion concentration under different moisture dynamics. During the beginning of the air NB watering treatment, EC in scenario 1 (ranging from 131 to 255 mS/m) was 6% lower than in scenario 2 (ranging from 133 to 312 mS/m). Throughout the ONB phase, a similar trend was observed, and the EC was 7.8% lower in scenario 1. However, when switched to ONB watering, faster drops and reductions in moisture levels were observed. Under cooler temperatures, when air NBs were reapplied again, the EC in scenario 1 showed an increase of about 3.5% higher than scenario 2. This increase is consistent with the better infiltration and moisture retention shown in scenario 1. In the next ONB phase, EC remained higher despite relatively stable moisture ranges. On the other hand, scenario 2 consistently displayed a higher EC (p < 0.050), suggesting that conventional watering increased ion mobility and retention near the surface. Throughout the last air NB phase, while moisture remained stable, the EC increased in both scenarios.
In experiment E2, under the air NB watering (phase 1), the EC showed a 4% lower value in scenario 3 (ranging between 60 and 172 mS/m) compared to scenario 4 (ranging from 67 to 156 mS/m). Throughout the ONB phase, EC values increased in both scenarios, with scenario 3 which was shown to be 24% lower compared to scenario 4. As the soil moisture in scenario 3 dropped more quickly at the beginning of the phase, followed by short-term fluctuations, this contributed to lower EC levels, as the faster initial drying could have limited ion mobilization. During the second air NB period, while temperatures decreased, EC showed a steady increase in both scenarios with air NBs, resulting in a 16% increase in comparison with the scenario. Soil moisture retention increased in both scenarios throughout this time, showing more stable peaks than in prior warmer periods. In the next ONB phase, while scenario 3 had 14% higher EC compared to scenario 4, soil moisture trends remained stable in both scenarios, with small variations and no rapid changes were observed. A similar trend was recorded during the final air NB phase. The differences were statistically significant during the second and fourth phases (p < 0.050), particularly in scenario 3 with higher EC levels compared to scenario 4. This increase can be attributed to the higher decomposition of OM in SL soil, suggesting that NBs promoted a more oxidizing environment. In contrast, such a trend was not observed in SCL soil, and EC remained more consistent across scenarios. Figure 8 illustrates the composite EC and soil moisture variations observed over the scenarios.

3.4. Soil pH and Compaction

The pH of the soil remained consistent throughout all scenarios, showing values between 6.67 and 8.02. No statistically significant differences were observed among treatments. It indicates that neither NB nor conventional watering had important effects on soil pH. Soil compaction tests revealed distinct findings between soil texture and watering type. SL soil had a significantly lower compaction level than SCL. Overall, the scenarios with NB watering had higher moisture-weighted average compaction compared to conventional watering scenarios. In experiment E1, NB watering resulted in compaction values ranging from 2.3 to 29.4 kg/cm2, while conventional watering showed lower values between 2 and 26 kg/cm2. Similarly, in experiment E2, NB water exhibited the compaction values from 1 to 9.8 kg/cm2, while conventional water ranged between 0.8 and 6.9 kg/cm2. Compaction was clearly revealed in the analysis, as the moisture content in the topsoil layer remained consistently higher than in the deeper layer (Figure 7), highlighting that water remained in the top layer rather than infiltrating downward, which indicates that infiltration was limited due to compaction. As a result, the top layer was more exposed to evaporation. The trend was more obvious in SCL soil. These conditions most likely led to increased sensitivity to VPD and faster drying. Figure 9 represents the average soil moisture-weighted compaction across experiments E1 and E2.

3.5. Nutrients and Other Substances

In scenarios 1 to 4, the total leachate volumes collected were 3.2 L, 5.1 L, 0.1 L, and 4.9 L, respectively. Nutrient amounts (mg) were calculated based on their concentration and the volume of water collected. Both the input water (NB and conventional) and the leachate from all scenarios showed no statistically significant differences (p > 0.05) in nutrient and other substance concentrations (Figure 10 and Figure 11). Although, in comparison with conventional water, nutrient leaching was generally decreased when air NB water was applied. Across most time periods, NO3, PO43−, SO42−, TDS, Ca2+, Fe3+, and heavy metals (Cr3+, Cu2+) demonstrated consistently decreased leachate concentrations under air NB. TDS in the input water were 6–15% lower in the NB scenario compared to the conventional water scenario, even though the difference was not statistically significant. TDS in the NB input water ranged from 553 to 813 mg (average = 663 mg), whereas in the conventional water, it ranged from 591 to 907 mg (average = 713 mg). The leaching responses under ONB watering differed depending on the soil texture. In SCL soil, ONB had a varied impact. It increased losses of PO43−, Mn2+, Cu2+, and COD, but it also decreased the leaching of NO3, SO42−, Fe3+, Cr3+, and Ca2+ as compared to conventional water-treated soil. In comparison, the leachate amount from scenario 3 was low or absent. This may be caused by the restricted downward movement of water through the SL matrix, not a lack of nutrients. According to soil moisture profiles, water was largely retained in the topsoil layers. This indicates the restricted downward movement of water, which leads to reduced leaching rather than an actual absence of nutrients and other substances. Compaction in scenario 3 may have further caused water movement, contributing to the limited leachate collection.

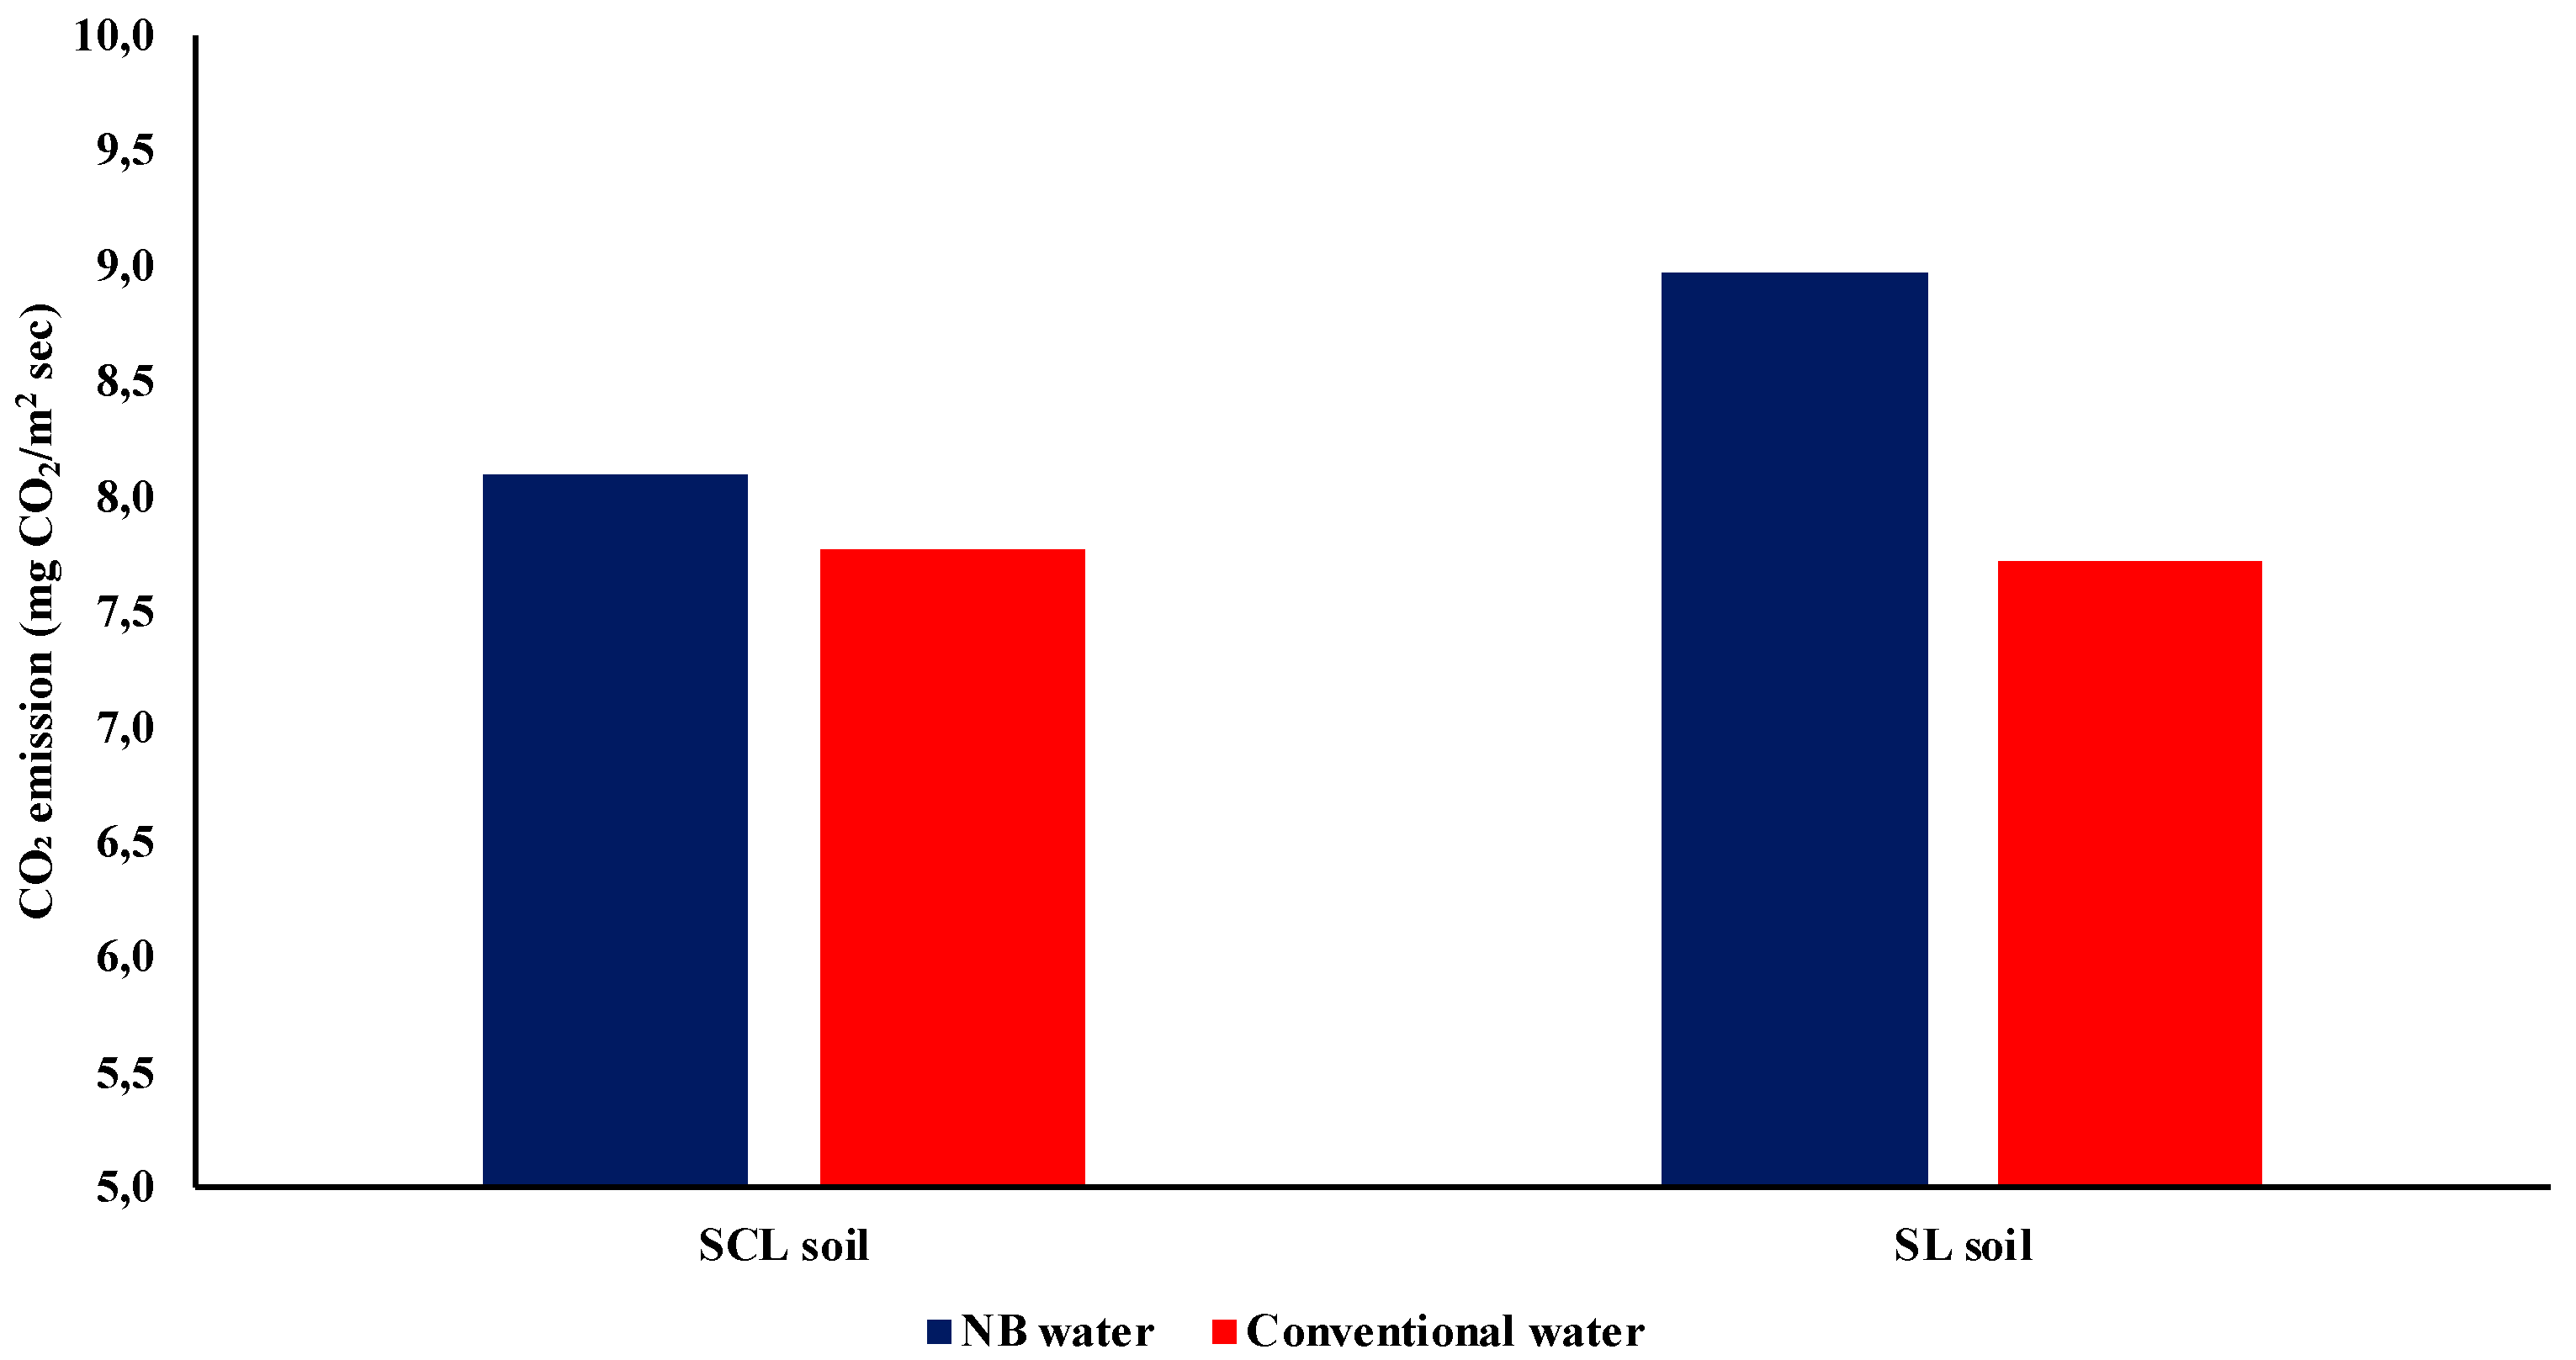
3.6. Soil CO2 Emission

Soil CO2 emissions mainly come from microbial respiration, which is highly impacted by oxygen availability, soil temperature and structure, and moisture conditions. NBSW increased CO2 emissions in SCL soil compared to conventional water, although the difference was not statistically significant. It highlights that NBSW had less of an apparent effect on microbial activity. In SL soil, the NBSW led to significantly higher CO2 emissions. It may be caused by coarser soil aggregates of SL soil, so oxygen from NBs can move deeper and more freely. Since the use of CS in all scenarios provided a uniform OM source, the increase in CO2 emissions under NBSW especially in SL soil, highlights that soil texture and enhanced oxygen delivery from NBs temporarily increase microbial activity after watering sessions. Figure 12 summarizes the moisture-weighted CO2 emissions for each treatment and soil type.

4. Discussion

4.1. Soil Moisture

The results underscore the importance of selecting the right NB type and adjusting watering techniques to specific soil textures and the environmental conditions. It is important to recognize that the impacts of nanobubbles, particularly ONBs, were short-lived and mostly observed within the first few hours after watering, as shown by the rapid oxygen decay. In contrast, air NBs demonstrated slower DO loss, greater bubble stability, and longer-lasting effects in the soil.
An analysis of the dynamics of soil moisture in experiments E1 and E2 revealed a complex interaction among soil texture, the composition of NB gas, and temporal environmental factors. During phase 1, watering the soils with air NBs showed minor and insignificant differences in soil moisture behavior compared to the conventional watering treatments. This indicates that, initially, the biological and physicochemical effects of NBs did not yet sufficiently influence the hydrological properties of the soils. The infiltration processes appeared to be mainly driven by the effects of gravitational forces and matrix suction, since the soil structure had been disrupted during prior preparation activities. When this structure is disrupted, water mobility in the soil may be impeded, often as a result of macropore collapse and a delayed re-establishment of capillary flow [36,37,38,39,40,41].
However, introducing ONB into the soils influenced soil moisture behavior compared to conventional watering. In the early phases of ONB watering, high VPD and sudden DO supplementation caused increased moisture loss through enhanced evaporation. Under such high evaporative demand, the ONB-treated soil dried faster than the conventionally watered soil, which indicates that elevated VPD intensifies the water loss through nanobubble watering. It is likely that increased oxygen availability accelerated aerobic microbial respiration, which resulted in the enhanced decomposition of organic matter, weakening soil aggregates and increased water loss. This aligns with the observed CO2 emission trends, showing that the enhanced microbial activity happened in both soil types, but was more visible in SL soils compared to SCL, probably due to improved oxygen diffusion and a greater presence of aerobic microbial communities in coarser-textured soils. Such conditions likely led to the clogging of pore spaces. At the same time, ONBs would have been able to modify the capillary and surface tension forces due to their higher surface area-to-volume ratio, which increased the soil compaction and particle redistribution. These effects caused lower water retention, especially in the top layer, where water evaporated faster compared to conventional watering conditions. In SCL soil, during the second air NB phase, the upper layer began to dry at a faster rate than the deeper layer, whereas in the SL, the moisture content showed an increase in the top layer, followed by rapid depletion, which again confirmed the significant evaporation through the topsoil. The observed patterns show that the influence of ONBs on moisture dynamics is most noticeable right after application, although VPD reduced towards the end of the phase. Particularly in soil treated with ONB, where compaction limited infiltration and increased evaporation, the differences between the upper and deeper layers were more apparent. As the VPD reduced, the soil moisture content continued to decrease. Rapid oxygen decay was seen in ONB-treated water, where DO levels dropped by more than 60% in the first hours, which is consistent with this short-term effect, suggesting that ONBs have the most effect shortly after application. This may explain the cause of the moisture variations that were most noticeable right after watering, before the oxygen levels stabilized. However, conventionally water-treated soil has shown an increase in soil moisture. This difference implies that biological processes, have higher influence on soil moisture dynamics under the ONB watering. These findings align with prior studies that NBs increase microbial activity through providing a consistent oxygen supply, therefore accelerating microbial metabolism. Xiao et al. [42] found that nanobubble aeration effectively provided extra oxygen for microbial aggregates. NBs were also shown to accelerate and increase the formation of biofilms [43], which may have contributed to pore space clogging and changed infiltration dynamics. According to Laplace’s law, NBs’ internal pressure increases gas solubility and influences interfacial forces, particularly in the top layers that moisture loss was the most apparent [44].
The results demonstrated that the reapplication of air NBs during lower VPD resulted in improved moisture retention, particularly in SL soil. Lower temperatures reduced evaporation and postponed microbial respiration, increasing the short-term benefits of water-NB-treated water. The presence of gases such N2 (78%) in air NBs may have helped soil particles to re-flocculate, which enhances both macropore structure and aggregate stability. N2 is inert, less reactive, and less soluble gas compared to O2. It may create micro currents and cavitation effects that loosen compacted soil. When air NBs collapse, they release more energy and disrupt compacted soil structures [45]. The contribution to the gradual re-establishing of the soil’s structure enabled better water infiltration. Deeper soil layers retained more water compared to the upper layers, which indicated better penetration and lesser evaporation. Conversely, the upper layer of SL soil treated with NB exhibited some drying but stayed more stable compared to earlier phases. These findings reveal that, under suitable conditions, air NBs can enhance wettability and temporarily reverse soil compaction, improving short-term water retention. This is further supported by theoretical models for nanobubble stability, which stress the importance of surface charge [46,47]. Zhang et al. (2023) found that air NBs had a negatively charged surface and strong zeta potential, allowing for long-term colloidal stability and interactions with surrounding water molecules [48]. Furthermore, air nanobubbles can change the surface tension of the solution, suppress capillary waves, and stabilize the gas–liquid interface, resulting in unique fluid dynamic behaviors [48]. These mechanisms are essential because the reduced surface tension and stable interface are directly related to lower cohesive forces among water molecules, which promotes water flow into the soil matrix. Additionally, (N2) gas in air nanobubbles (air NBs) may have a unique role in the observed water behavior during Phase 3. Although the direct experimental comparisons of nitrogen and ONBs are restricted, nanobubbles have generally been found to change the physical characteristics of water. Arablousabet and Povilaitis [12] found that watering with air NBSW increased soil moisture retention, attributing it to physiological responses rather than substantial chemical or biological changes in the soil. Other research [49] found that environmental parameters, including pH, electrolyte concentration, and temperature, change the size distribution and zeta potential of air NBs, influencing their long-term stability. Based on these observations, it is likely that N2, the main gas component in air nanobubbles, reduces intermolecular bonding in water, thereby lowering surface tension, resulting in the faster wetting of hydrophobic soil surfaces. In the second ONB phase, moisture levels stabilized across all treatments, showing diminished differences between NB-treated and conventional water-treated soil. The increased humidity and low temperatures reduced evaporation and inhibited microbial activity, which restricted ONB-related effects. Soil moisture levels in the upper and lower layers became more uniform and may have decreased the formation of aggregates because of unfavorable conditions for the production of microbial binding agents. The moisture retention in SCL soil had minimal variation, while the NB-treated soil in the deeper layer showed higher retention compared to the topsoil layer. The limited effect of ONB suggests that environmental conditions, especially VPT, significantly influence NB sub-performance. Once the soil structure and microbial activity stabilize, additional oxygen from ONBs appears to fail to substantially change water dynamics. The dynamics of soil moisture stabilized in the final air NB phase for both treatments. The top layer of SL soil had somewhat more moisture content than the deeper layer, possibly as a result of limited penetration and temporary topsoil layer retention. These impacts, however, were short-lived, and there was minor water loss. This supports the final phase observations by confirming that gas type has no impact on water retention when the VPD is low.
The results also show that NBSW treatments can sometimes lead to higher levels of soil moisture and, in other cases, to lower levels, depending on the scenario. Despite consistent environmental conditions, these variations are likely driven by complex interactions among soil texture, amendment properties, organic matter decomposition, and the effects of soil drying followed by subsequent rewetting (moisture absorption). Drying can shrink and crack soil aggregates, altering pore structure and water movement. Rewetting may also be hindered by temporary hydrophobicity, causing uneven moisture distribution. These mechanisms and their potential contributions warrant further detailed investigation.

4.2. Soil Electrical Conductivity, Compaction and CO2 Emission

During the NB watering, soil EC and topsoil moisture patterns (0–6 cm depth) showed a significant correlation between ion concentration dynamics. A constant increase in EC, particularly in the SL soil, along with a decrease in topsoil moisture under NBSW scenarios, particularly during ONB phases, supports a concentration effect in which the ionic strength of the soil solution increases due to reduced water retention. The observed patterns suggest that ONB watering might cause structural changes in the surface soil, affecting both moisture dynamics and solute redistribution. Compaction can be linked to the enhanced microbial activity and the release of sticky compounds during OM decomposition, both of which are known to be stimulated by the increased oxygen availability provided by ONBs. As a result, fine particles and block soil pores bind soil particles more closely together, and reduce the total pore space, increasing the bulk density and lowering soil permeability [50]. Previous research has shown that NBs promote aerobic microbial metabolism, resulting in rapid organic matter decomposition and the breakdown of soil macroaggregates [51]. Furthermore, ONBs are known to accelerate the decomposition of reactive organic matter and reduce aggregate stability, under increased oxygen flux conditions [52]. These microstructural changes reduce the infiltration and capillary rise, trapping water in the topsoil and increasing the evaporation under ONB treatment. The shift towards smaller pores also leads to the surface solute build-up and higher EC, indicating that soil–water interactions are changed as a result of structural degradation. When ONB is applied, oxidation and salt precipitation occur. In this study, precipitates were consistently observed at the bottom of the container where the NBs were generated, which shows ion removal before watering. Although NBSW had lower TDS than conventional water, EC in SCL soil remained stable. This stability might be attributed to the partial mineralization of OM in composted sludge. In contrast, the increase in EC in SL soil under both scenarios can be attributed to the sand’s larger pore size and higher microbial respiration, which promoted the greater decomposition of OM and the subsequent release of ions into the soil solution. The higher oxygen supply from NBs further enhanced this effect, resulting in even higher EC values in SL soil with NB compared to conventional water application. The EC trends in Figure 8 support this; however, in conventional or air NB treatments, more stable EC patterns indicated more effective leaching and less solute buildup, while ONB scenarios (especially in E2) showed a continuous EC increase despite stable moisture, indicating limited ion redistribution. Conversely, EC stayed more constant in both air NB and conventional treatments as a result of improved leaching and reduced solute buildup. According to previous studies, a change from macropore- to micropore-dominated soil composition, caused by compaction or structural changes, limits infiltration, retains water in the top layers, and promotes solute buildup near the surface [53].
CO2 emission patterns further support the different microbial responses (even though it affects compaction) across soil types. CO2 emissions in SCL soil were slightly higher under NB watering. Due to the fine-textured nature of SCL soils, their small pores may restrict gas exchange and limit CO2 diffusion even under active microbial activity. SCL soils may host more anaerobic microbes, which will not respond strongly to increased oxygen. Microbial communities in SL soils may be more responsive to oxygen fluctuations. This has been supported by previous studies, saying that an oxygen deficiency in the rhizosphere becomes a limitation in heavy clay soil, particularly at higher soil moisture. In extremely wet clay soils, the lack of air in pores could result in poor OM decomposition and low respiration rates [54]. However, the SL soil showed a higher effect in terms of boosting microbial activity. This is likely because the SL soil allows better gas diffusion. Oxygen delivery from NBs may stimulate aerobic microbes more effectively, increasing their activity and CO2 emissions.

4.3. Chemical Composition of Leachate

The results revealed that the amounts of nutrients in the conventional and NBSW treatments were not statistically different, suggesting that any changes in nutrient behavior observed in the soil or leachate may be attributed to the interaction between the soil and the treatment rather than the watering composition. Soil texture was a significant variable in influencing how nutrients were retained or leached across watering regimes. In the SCL soil (E1), consistent leachate collection enabled the tracking of nutrient movement. According to the previous studies, various characteristics, such as fine particle size, higher water holding capacity, and lower permeability on silty clay soil, slowed water movement, which made it easier to detect the solute transport [55]. This is supported by the findings that NBSW (particularly air NBs) had a limited impact on nutrient leaching in SCL soils, where the retention is higher due to finer texture and reduced porosity [22]. In contrast, the SL soil (E2) exhibited very low leachate under most treatments, particularly in Scenario 3 with nanobubble watering. The high penetration rate of SL normally increases leaching risk, but in this case, the absence of leachate indicated that nutrients stayed within the soil profile, most likely due to better water retention from CS and reduced leaching potential when treated with NBSW. This is aligned with another research study [10], which found that CSS increased nutrient retention by increasing OM content and producing humic substances that can chelate nutrients and lower their solubility, limiting their mobility in coarse-textured soils. The uniform addition of CS may have improved nutrient retention across both soil types. Compost likely contributed OM and increased cation exchange capacity (CEC), which helped retain nutrients like nitrate, potassium, and phosphate. The compost also likely increased aggregate formation and microbial activity, both of which help in nutrient absorption and reduce the movement of nutrients with percolating water. In SL soils, which are likely to lose nutrient loss, the compost appears to have compensated for the lack of clay minerals by forming a stable matrix for nutrient binding. This most likely led to the lack of leachate and nutrient loss in scenario 3. Researchers found that minerals such as calcium, potassium, magnesium, and sodium, even though soluble, were not considerably lost during compost maturation, which supports the hypothesis that these nutrients may be kept in soils when given in stable composted form [10]. In the SCL soil, ONB watering increased the leaching of some heavy metals like Cu2+ and Mn2+ compared to conventional watering, which illustrates the enhanced solubilization or desorption under higher oxygen availability. However, other elements, such as Cr3+ and Fe3+, exhibited less leaching under both NB treatments, potentially as a result of their higher binding with compost-derived organic matter. Although composted sludge was used, most heavy metal levels in the leachate were still low and were not significantly different, indicating limited environmental risk.
Due to its higher cost, NB water is considered to be more practical in controlled environments, as the technology appears to be better suited to stimulating rapid plant growth rather than enhancing prolonged soil water retention, which is critical for supporting more sustainable agricultural systems.

5. Summary and Conclusions

The findings show that NBSW impacts, particularly ONBs, are short-lived and highly affected by soil texture, organic matter, and environmental factors. Air NBs demonstrated higher stability and better soil moisture retention in SL soils. In contrast, ONBs may temporarily improve microbial activity and OM decomposition, particularly in SL soils with higher oxygen diffusion potential, which might impact surface soil structure, decrease infiltration, and increase evaporation. These effects led to reduced moisture retention and increased EC, particularly in SL soil. In contrast, EC remained stable in SCL soil, primarily due to the breakdown of OM from microbial activity, while the contribution of dissolved ions from input water was lower due to substance precipitation during NB formation. While CS improved nutrient retention in both soil types, nutrient leaching remained negligible in all treatments with no notable differences. Soils treated with NB showed higher sensitivity to VPD, as ONBs increased evaporation under drier conditions.
The results reveal that soil–water interactions following NB treatment are complex and can provide contradictory results, such as increased evaporation compared to conventional water. Overall, NBSW, particularly ONB, causes fast but temporary changes in soil microbial and physical dynamics. The use of NB water, particularly at higher rates, could contribute to increased soil compaction in OM-rich soils, specifically under ONB treatments, due to increased aerobic microbial activity. Air NBs, on the other hand, can temporarily reduce soil compaction and improve soil water interactions due to their more balanced gas composition.

Author Contributions

Conceptualization, A.P.; methodology, A.P.; investigation, Y.A. and A.P.; resources, A.P.; formal analysis, Y.A. and A.P.; writing—original draft preparation, Y.A.; writing—review and editing, A.P.; visualization, Y.A. and A.P.; supervision, A.P. All authors have read and agreed to the published version of the manuscript.

Funding

This research received no external funding.

Data Availability Statement

The original contributions presented in the study are included in the article.

Acknowledgments

The research was supported by the Agriculture Academy of Vytautas Magnus University, Lithuania.

Conflicts of Interest

The authors declare no conflict of interest.

References

  1. Temesgen, T.; Bui, T.T.; Han, M.; Kim, T.-I.; Park, H. Micro and nanobubble technologies as a new horizon for water-treatment techniques: A review. Adv. Colloid Interface Sci. 2017, 246, 40–51. [Google Scholar] [CrossRef] [PubMed]
  2. Khaled Abdella Ahmed, A.; Sun, C.; Hua, L.; Zhang, Z.; Zhang, Y.; Marhaba, T.; Zhang, W. Colloidal properties of air, oxygen, and nitrogen nanobubbles in water: Effects of ionic strength, natural organic matters, and surfactants. Environ. Eng. Sci. 2018, 35, 720–727. [Google Scholar] [CrossRef]
  3. Yasui, K.; Tuziuti, T.; Kanematsu, W. High temperature and pressure inside a dissolving oxygen nanobubble. Ultrason. Sonochemistry 2019, 55, 308–312. [Google Scholar] [CrossRef]
  4. Nirmalkar, N.; Pacek, A.; Barigou, M. On the existence and stability of bulk nanobubbles. Langmuir 2018, 34, 10964–10973. [Google Scholar] [CrossRef] [PubMed]
  5. Liu, S.; Oshita, S.; Kawabata, S.; Makino, Y.; Yoshimoto, T. Identification of ROS produced by nanobubbles and their positive and negative effects on vegetable seed germination. Langmuir 2016, 32, 11295–11302. [Google Scholar] [CrossRef]
  6. Ushikubo, F.Y.; Furukawa, T.; Nakagawa, R.; Enari, M.; Makino, Y.; Kawagoe, Y.; Shiina, T.; Oshita, S. Evidence of the existence and the stability of nano-bubbles in water. Colloids Surf. A Physicochem. Eng. Asp. 2010, 361, 31–37. [Google Scholar] [CrossRef]
  7. Zhou, Y.; Han, Z.; He, C.; Feng, Q.; Wang, K.; Wang, Y.; Luo, N.; Dodbiba, G.; Wei, Y.; Otsuki, A.; et al. Long-Term Stability of Different Kinds of Gas Nanobubbles in Deionized and Salt Water. Materials 2021, 14, 1808. [Google Scholar] [CrossRef]
  8. Agarwal, A.; Ng, W.J.; Liu, Y. Principle and Applications of Microbubble and Nanobubble Technology for Water Treatment. Chemosphere 2011, 84, 1175–1180. [Google Scholar] [CrossRef]
  9. Khan, P.; Zhu, W.; Huang, F.; Gao, W.; Khan, N.A. Micro-Nanobubble Technology and Water-Related Application. Water Supply 2020, 20, 2021–2035. [Google Scholar] [CrossRef]
  10. Meegoda, J.N.; Hewage, S.A.; Batagoda, J.H. Application of the diffused double layer theory to nanobubbles. Langmuir 2019, 35, 12100–12112. [Google Scholar] [CrossRef]
  11. Ramiro, B.O.; Wasielesky, W., Jr.; Pimentel, O.A.L.F.; Poersch, L.H.S.; Advent, B.; Gonçalves Júnior, G.F.; Krummenauer, D. The effect of using nano and microbubbles as aeration strategies on the nitrification process, microbial community composition, and growth of Penaeus vannamei in a super-intensive biofloc system. Aquaculture 2024, 587, 740842. [Google Scholar] [CrossRef]
  12. Arablousabet, Y.; Povilaitis, A. Assessing the Role of Air Nanobubble-Saturated Water in Enhancing Soil Moisture, Nutrient Retention, and Plant Growth. Sustainability 2024, 16, 5727. [Google Scholar] [CrossRef]
  13. Sha, Z.; Chen, Z.; Feng, Y.; Xue, L.; Yang, L.; Cao, L.; Chu, Q. Minerals loaded with oxygen nanobubbles mitigate arsenic translocation from paddy soils to rice. J. Hazard. Mater. 2020, 398, 122818. [Google Scholar] [CrossRef]
  14. Bhattarai, S.P.; Su, N.; Midmore, D.J. Oxygation Unlocks Yield Potentials of Crops in Oxygen-Limited Soil Environments. Adv. Agron. 2005, 88, 313–377. [Google Scholar] [CrossRef]
  15. Zhou, Y.; Zhou, B.; Xu, F.; Muhammad, T.; Li, Y. Appropriate dissolved oxygen concentration and application stage of micro-nano bubble water oxygation in greenhouse crop plantation. Agric. Water Manag. 2019, 223, 105713. [Google Scholar] [CrossRef]
  16. Zhou, Y.; Bastida, F.; Zhou, B.; Sun, Y.; Gu, T.; Li, S.; Li, Y. Soil fertility and crop production are fostered by micro-nano bubble irrigation with associated changes in soil bacterial community. Soil Biol. Biochem. 2020, 141, 107663. [Google Scholar] [CrossRef]
  17. Abuarab, M.; Mostafa, E.; Ibrahim, M. Effect of air injection under subsurface drip irrigation on yield and water use efficiency of corn in a sandy clay loam soil. J. Adv. Res. 2013, 4, 493–499. [Google Scholar] [CrossRef]
  18. Pendergast, L.; Bhattarai, S.P.; Midmore, D.J. Benefits of oxygation of subsurface drip-irrigation water for cotton in a Vertosol. Crop Pasture Sci. 2013, 64, 1171–1181. [Google Scholar] [CrossRef]
  19. Liu, Y.; Zhou, Y.; Wang, T.; Pan, J.; Zhou, B.; Muhammad, T.; Zhou, C.; Li, Y. Micro-nano bubble water oxygation: Synergistically improving irrigation water use efficiency, crop yield and quality. J. Clean. Prod. 2019, 222, 835–843. [Google Scholar] [CrossRef]
  20. Ahmed, A.K.A.; Shi, X.; Hua, L.; Manzueta, L.; Qing, W.; Marhaba, T.; Zhang, W. Influences of air, oxygen, nitrogen, and carbon dioxide nanobubbles on seed germination and plant growth. J. Agric. Food Chem. 2018, 66, 5117–5124. [Google Scholar] [CrossRef]
  21. Zhou, Y.; Li, Y.; Liu, X.; Wang, K.; Muhammad, T. Synergistic improvement in spring maize yield and quality with micro/nanobubbles water oxygation. Sci. Rep. 2019, 9, 5226. [Google Scholar] [CrossRef]
  22. Kutty, S.R.M.; Winarto, F.E.W.; Gilani, S.I.U.; Anizam, A.A.; Karimah, W.W.Z.; Isa, M.H. Degradation of organic matter using a submerged microbubble diffuser in a biological wastewater treatment system. Waste Manag. Environ. 2010, 140, 415–423. [Google Scholar]
  23. Liu, S.; Oshita, S.; Makino, Y.; Wang, Q.; Kawagoe, Y.; Uchida, T. Oxidative capacity of nanobubbles and its effect on seed germination. ACS Sustain. Chem. Eng. 2016, 4, 1347–1353. [Google Scholar] [CrossRef]
  24. Ebina, K.; Shi, K.; Hirao, M.; Hashimoto, J.; Kawato, Y.; Kaneshiro, S.; Morimoto, T.; Koizumi, K.; Yoshikawa, H. Oxygen and air nanobubble water solution promote the growth of plants, fishes, and mice. PLoS ONE 2013, 8, e65339. [Google Scholar] [CrossRef]
  25. Pereira, I.S.; Bamberg, A.L.; Oliveira de Sousa, R.; Monteiro, A.B.; Martinazzo, R.; Posser Silveira, C.A.; de Oliveira Silveira, A. Agricultural use and pH correction of anaerobic sewage sludge with acid pH. J. Environ. Manag. 2020, 275, 111203. [Google Scholar] [CrossRef]
  26. Silva, M.B.; Camargos, L.S.; Teixeira Filho, M.C.M.; Souza, L.A.; Coscione, A.R.; Lavres, J.; Abreu-Junior, C.H.; He, Z.; Zhao, F.; Jani, A.D.; et al. Residual effects of composted sewage sludge on nitrogen cycling and plant metabolism in a no-till common bean-palisade grass-soybean rotation. Front. Plant Sci. 2023, 14, 1281670. [Google Scholar] [CrossRef] [PubMed]
  27. Lloret, E.; Pascual, J.A.; Brodie, E.L.; Bouskill, N.J.; Insam, H.; Juárez, M.F.-D.; Goberna, M. Sewage sludge addition modifies soil microbial communities and plant performance depending on the sludge stabilization process. Appl. Soil Ecol. 2016, 101, 37–46. [Google Scholar] [CrossRef]
  28. Singh, R.; Singh, P.; Ibrahim, M.; Hashim, R. Land Application of sewage sludge: Physicochemical and microbial response. Rev. Environ. Contam. Toxicol. 2011, 214, 41–61. [Google Scholar]
  29. Singh, R.P.; Agrawal, M. Effect of different sewage sludge applications on growth and yield of Vigna radiata L. field crop: Metal uptake by plant. Ecol. Eng. 2010, 36, 969–972. [Google Scholar] [CrossRef]
  30. Wang, X.; Chen, T.; Ge, Y.; Jia, Y. Studies on land application of sewage sludge and its limiting factors. J. Hazard. Mater. 2008, 160, 554–558. [Google Scholar] [CrossRef]
  31. Kominko, H.; Gorazda, K.; Wzorek, Z. The possibility of organo-mineral fertilizer production from sewage Sludge. Waste Biomass Valorization 2017, 8, 1781–1791. [Google Scholar] [CrossRef]
  32. Curci, M.; Lavecchia, A.; Cucci, G.; Lacolla, G.; De Corato, U.; Crecchio, C. Short-Term Effects of Sewage Sludge Compost Amendment on Semiarid Soil. Soil Syst. 2020, 4, 48. [Google Scholar] [CrossRef]
  33. Ikeura, H.; Kobayashi, F.; Tamaki, M. Removal of residual pesticide, fenitrothion, in vegetables by using ozone microbubbles generated by different methods. J. Food Eng. 2011, 103, 345–349. [Google Scholar] [CrossRef]
  34. Paganini, E.A.L.; Silva, R.B.; Ribeiro Roder, L.; Guerrini, I.A.; Capra, G.F.; Grilli, E.; Ganga, A. A Systematic Review and Meta-Analysis of the Sustainable Impact of Sewage Sludge Application on Soil Organic Matter and Nutrient Content. Sustainability 2024, 16, 9865. [Google Scholar] [CrossRef]
  35. Grossiord, C.; Buckley, T.N.; Cernusak, L.A.; Novick, K.A.; Poulter, B.; Siegwolf, R.T.; Sperry, J.S.; McDowell, N.G. Plant responses to rising vapor pressure deficit. New Phytol. 2020, 226, 1550–1566. [Google Scholar] [CrossRef]
  36. Plante, A.F.; McGill, W.B. Soil aggregate dynamics and the retention of organic matter in laboratory-incubated soil with differing simulated tillage frequencies. Soil Tillage Res. 2002, 66, 79–92. [Google Scholar] [CrossRef]
  37. Franzluebbers, A.J. Water infiltration and soil structure related to organic matter and its stratification with depth. Soil Tillage Res. 2002, 66, 197–205. [Google Scholar] [CrossRef]
  38. Logan, T.J.; Lal, R.; Dick, W.A. Tillage systems and soil properties in North-America. Soil Tillage Res. 1991, 20, 241–270. [Google Scholar] [CrossRef]
  39. Warkentin, B.P. The tillage effect in sustaining soil functions. J. Plant Nutr. Soil Sci. 2001, 164, 345–350. [Google Scholar] [CrossRef]
  40. Targulian, V.O.; Goryachkin, S.V. Soil memory: Types of record, carriers, hierarchy and diversity. Rev. Mex. De Cienc. Geol. 2004, 21, 1–8. [Google Scholar]
  41. Lin, H. Three Principles of Soil Change and Pedogenesis in Time and Space. Soil Sci. Soc. Am. J. 2011, 75, 2049–2070. [Google Scholar] [CrossRef]
  42. Xiao, W.; Xu, G.; Li, G. Effect of Nanobubble Application on Performance and Structural Characteristics of Microbial Aggregates. Sci. Total Environ. 2021, 765, 142725. [Google Scholar] [CrossRef]
  43. Xiao, W.; Xu, G. Mass Transfer of Nanobubble Aeration and Its Effect on Biofilm Growth: Microbial Activity and Structural Properties. Sci. Total Environ. 2020, 703, 134976. [Google Scholar] [CrossRef]
  44. Silva, J.; Arias-Torres, L.; Carlesi, C.; Aroca, G. Use of Nanobubbles to Improve Mass Transfer in Bioprocesses. Processes 2024, 12, 1227. [Google Scholar] [CrossRef]
  45. Donnelly, S.E.; Evans, J.H. (Eds.) Fundamental Aspects of Inert Gases in Solids; Springer Science & Business Media: New York, NY, USA, 1991; Volume 279. [Google Scholar]
  46. Bunkin, N.F.; Shkirin, A.V.; Suyazov, N.V.; Babenko, V.A.; Sychev, A.A.; Penkov, N.V.; Belosludtsev, K.N.; Gudkov, S.V. Formation and dynamics of ion stabilized gas nanobubble phase in the bulk of aqueous NaCl solutions. J. Phys. Chem. B 2016, 120, 1291–1303. [Google Scholar] [CrossRef]
  47. Tan, B.H.; An, H.; Ohl, C.D. How bulk nanobubbles might survive. Phys. Rev. Lett. 2020, 124, 134503. [Google Scholar] [CrossRef] [PubMed]
  48. Zhang, Y.; Duan, H.; Chen, E.; Li, M.; Liu, S. Physicochemical characteristics and the scale inhibition effect of air nanobubbles (A-NBs) in a circulating cooling water system. Langmuir 2023, 39, 1629–1639. [Google Scholar] [CrossRef]
  49. Montazeri, S.M.; Kalogerakis, N.; Kolliopoulos, G. Effect of chemical species and temperature on the stability of air nanobubbles. Sci. Rep. 2023, 13, 16716. [Google Scholar] [CrossRef]
  50. Brown, P.J.; McCarty, L.B.; Quisenberry, V.L.; Hubbard, L.R., Jr.; Addy, M.B. Influence of Increasing Fines on Soil Physical Properties of U.S. Golf Association Sand. HortScience 2019, 54, 2063–2066. [Google Scholar] [CrossRef]
  51. Chen, W.; Bastida, F.; Liu, Y.; Zhou, Y.; He, J.; Song, P.; Kuang, N.; Li, Y. Nanobubble Oxygenated Increases Crop Production via Soil Structure Improvement: The Perspective of Microbially Mediated Effects. Agric. Water Manag. 2023, 282, 108263. [Google Scholar] [CrossRef]
  52. Luo, A.; Wang, T.; Luo, P.; Zheng, Z.; Fiallos, M.; Bian, Y.; Khu, S.-T. Mechanism by which micro-nano bubbles impact biofilm growth in drinking water distribution systems. Environ. Sci. Water Res. Technol. 2025, 11, 754–767. [Google Scholar] [CrossRef]
  53. Feeney, D.S.; Crawford, J.W.; Daniell, T.; Hallett, P.D.; Nunan, N.; Ritz, K.; Rivers, M.; Young, I.M. Three-dimensional microorganization of the soil-root-microbe system. Microb. Ecol. 2006, 52, 151–158. [Google Scholar] [CrossRef] [PubMed]
  54. Chen, X.; Dhungel, J.; Bhattarai, S.P.; Torabi, M.; Pendergast, L.; Midmore, D.J. Impact of oxygation on soil respiration, yield and water use efficiency of three crop species. J. Plant Ecol. 2011, 4, 236–248. [Google Scholar] [CrossRef]
  55. Arablousabet, Y.; Povilaitis, A. The Impact of Nanobubble Gases in Enhancing Soil Moisture, Nutrient Uptake Efficiency and Plant Growth: A Review. Water 2024, 16, 3074. [Google Scholar] [CrossRef]
Figure 1. Scheme of the experimental setup with test soil samples, water input, and leached-out water collection. [R—reference (conventional) water, NB—nanobubble-saturated water].
Water 17 01923 g001
Figure 2. Dissolved oxygen dynamics over a 200 h monitoring period in Air-NB, ONB, and conventional water under identical environmental conditions.
Water 17 01923 g002
Figure 3. Temporal variation of air temperature and relative air humidity.
Water 17 01923 g003
Figure 4. Temporal dynamics of water input and vapor pressure deficit (VPD).
Water 17 01923 g004
Figure 5. Soil moisture dynamics in Scenario 1 (air-NB and ONB) and Scenario 2 (conventional water) in Experiment E1.
Water 17 01923 g005
Figure 6. Soil moisture dynamics in Scenario 3 (air NB and ONB) and Scenario 4 (conventional water) in Experiment E2.
Water 17 01923 g006
Figure 7. Temporal variation of top and deeper layer soil moisture in E1: (a) Scenario 1; (b) Scenario 2; and in E2: (c) Scenario 3; (d) Scenario 4.
Water 17 01923 g007
Figure 8. Soil moisture and electrical conductivity (EC) dynamics at 0–6 cm depth in E1: (a) Scenario 1, (b) Scenario 2; and in E2: (c) Scenario 3, (d) Scenario 4.
Water 17 01923 g008
Figure 9. Average soil moisture-weighted compaction.
Water 17 01923 g009
Figure 10. Comparison of nutrients, heavy metals, and other water quality parameters in conventional water and NBSW used for watering. Parameters include NO3, NO2, NH4+, PO43−, K+, SO42−, Ca2+, Mg2+, TDS, COD, free chlorine, Fe3+, Mn2+, Cr3+, and Cu2+. Boxplots represent the interquartile range (Q1–Q3), with whiskers indicating minimum and maximum values; horizontal lines within the boxes denote the median and crosses denote the average.
Water 17 01923 g010
Figure 11. Comparison of soil substance losses through leachate water.
Water 17 01923 g011
Figure 12. Average soil moisture-weighted CO2 emission.
Water 17 01923 g012
Table 1. Experimental setup with soil types, soil composition, and watering treatments.
GroupScenario No.Soil TypeWatering TypeSoil
Composition
Soil OM
% N
Composted Sludge
Composition
Soil Total Nitrogen (N) (%)Soil Total Phosphorus (P) (mg/kg)Soil Total
Potassium (K) (mg/kg)
Heavy Metal
Concentration in Soil
E1-A1Silty clay loamAir/oxygen nanobubble
water
Clay: 13.95%,
Silt: 64.25%,
Sand: 21.8%
6.35 ± 0.29Dry matter content: 64.05%
Organic matter content: 30.27%
Total nitrogen (N): 1.18%
Total phosphorus (P): 0.44%
Total potassium (K): 0.47%
Cadmium (Cd): 0.85 mg/kg
Chromium (Cr): 9.37 mg/kg
Nickel (Ni): 6.10 mg/kg
Lead (Pb): 15.8 mg/kg
Copper (Cu): 57.7 mg/kg
Zinc (Zn): 293 mg/kg
Mercury (Hg): 0.028 mg/kg
0.202 ± 0.0024642893Cadmium (Cd): 0.09 ± 0.014 mg/kg
Nickel (Ni): 13.9 ± 1.47 mg/kg
Lead (Pb): 7.37 ± 0.81 mg/kg
Chromium (Cr): 20.4 ± 3.59 mg/kg
Copper (Cu): 11.0 ± 1.45 mg/kg
Zinc (Zn): 39.2 ± 4.62 mg/kg
Mercury (Hg): 0.041 ± 0.007 mg/kg
E1-B2Silty clay loamConventional water 6.35 ± 0.29* **
E2-A3Sandy loamAir/oxygen nanobubble
water
Clay: 0.60%,
Silt: 27.96%,
Sand: 71.45%
9.06 ± 0.42*0.349 ± 0.0175802955Cadmium (Cd): 0.13 ± 0.021 mg/kg
Nickel (Ni): 3.20 ± 0.34 mg/kg
Lead (Pb): 7.33 ± 0.81 mg/kg
Chromium (Cr): 8.88 ± 1.55 mg/kg
Copper (Cu): 2.56 ± 0.34 mg/kg
Zinc (Zn): 26.5 ± 3.13 mg/kg
Mercury (Hg): 0.058 ± 0.010 mg/kg
E2-B4Sandy loamConventional water 9.06 ± 0.42* ***
Notes: * The composted sludge composition is consistent with the values specified in Scenario 1. ** Heavy metal concentrations in scenario 2 is consistent with the values outlined in scenario 1. *** Heavy metal concentrations in scenario 4 is consistent with the values outlined in scenario 3.
Disclaimer/Publisher’s Note: The statements, opinions and data contained in all publications are solely those of the individual author(s) and contributor(s) and not of MDPI and/or the editor(s). MDPI and/or the editor(s) disclaim responsibility for any injury to people or property resulting from any ideas, methods, instructions or products referred to in the content.

