For the case study, a hypothetical scenario was proposed, the conventional drainage channel design was established for CN = 85, a roughness coefficient of 0.015 s/m
0.33, and designed depth of
, identified as 85
in
Table 8 with a probability of failure of 0.0339, greater than the theoretical exceedance probability of 0.02 (separated by dash lines in
Table 8). Possible channel deterioration and changes in the watershed’s CN were evaluated to estimate the actual probability of failure under these prospective conditions for a 50-year return period event (
Table 8), considering Scenario IV.
Table 8 shows the actual probability of failure estimated for the conventional design with a
considering several combinations of Manning’s coefficients and CN (
n/CN). The combination
n/CN 0.015/75, 0.015/80, and 0.017/75 has a probability of failure lower than 2% (for a 0-year return period). However, all the other combinations have a probability of failure greater than 2%, including the conventional design condition of
n/CN = 0.015/85 with a
. As the Manning coefficient and the CN increase, the probability of failure may increase up to 40% if the Manning coefficient increases to 0.021 s/m
0.33. The CN increases to 95, corresponding to a case where the channel deteriorates considerably, and the land use and stormwater management practices are not adequately implemented over time.
In other words,
is also equivalent to the
that fulfills the criterion of
. Then, the depth that satisfies this criterion is
.
Table 9 shows the updated probability of failure estimation but with a
instead of the conventional
, ensuring the criterion
However, if the channel or the watershed roughness conditions change by increasing either the Manning coefficient or the CN, the probability of failure would again exceed 2%; for example, if the mean value of n increases from 0.015 s/m0.33 to 0.021 s/m0.33, and the CN increases to 95, the probability of failure would be 29.8%.
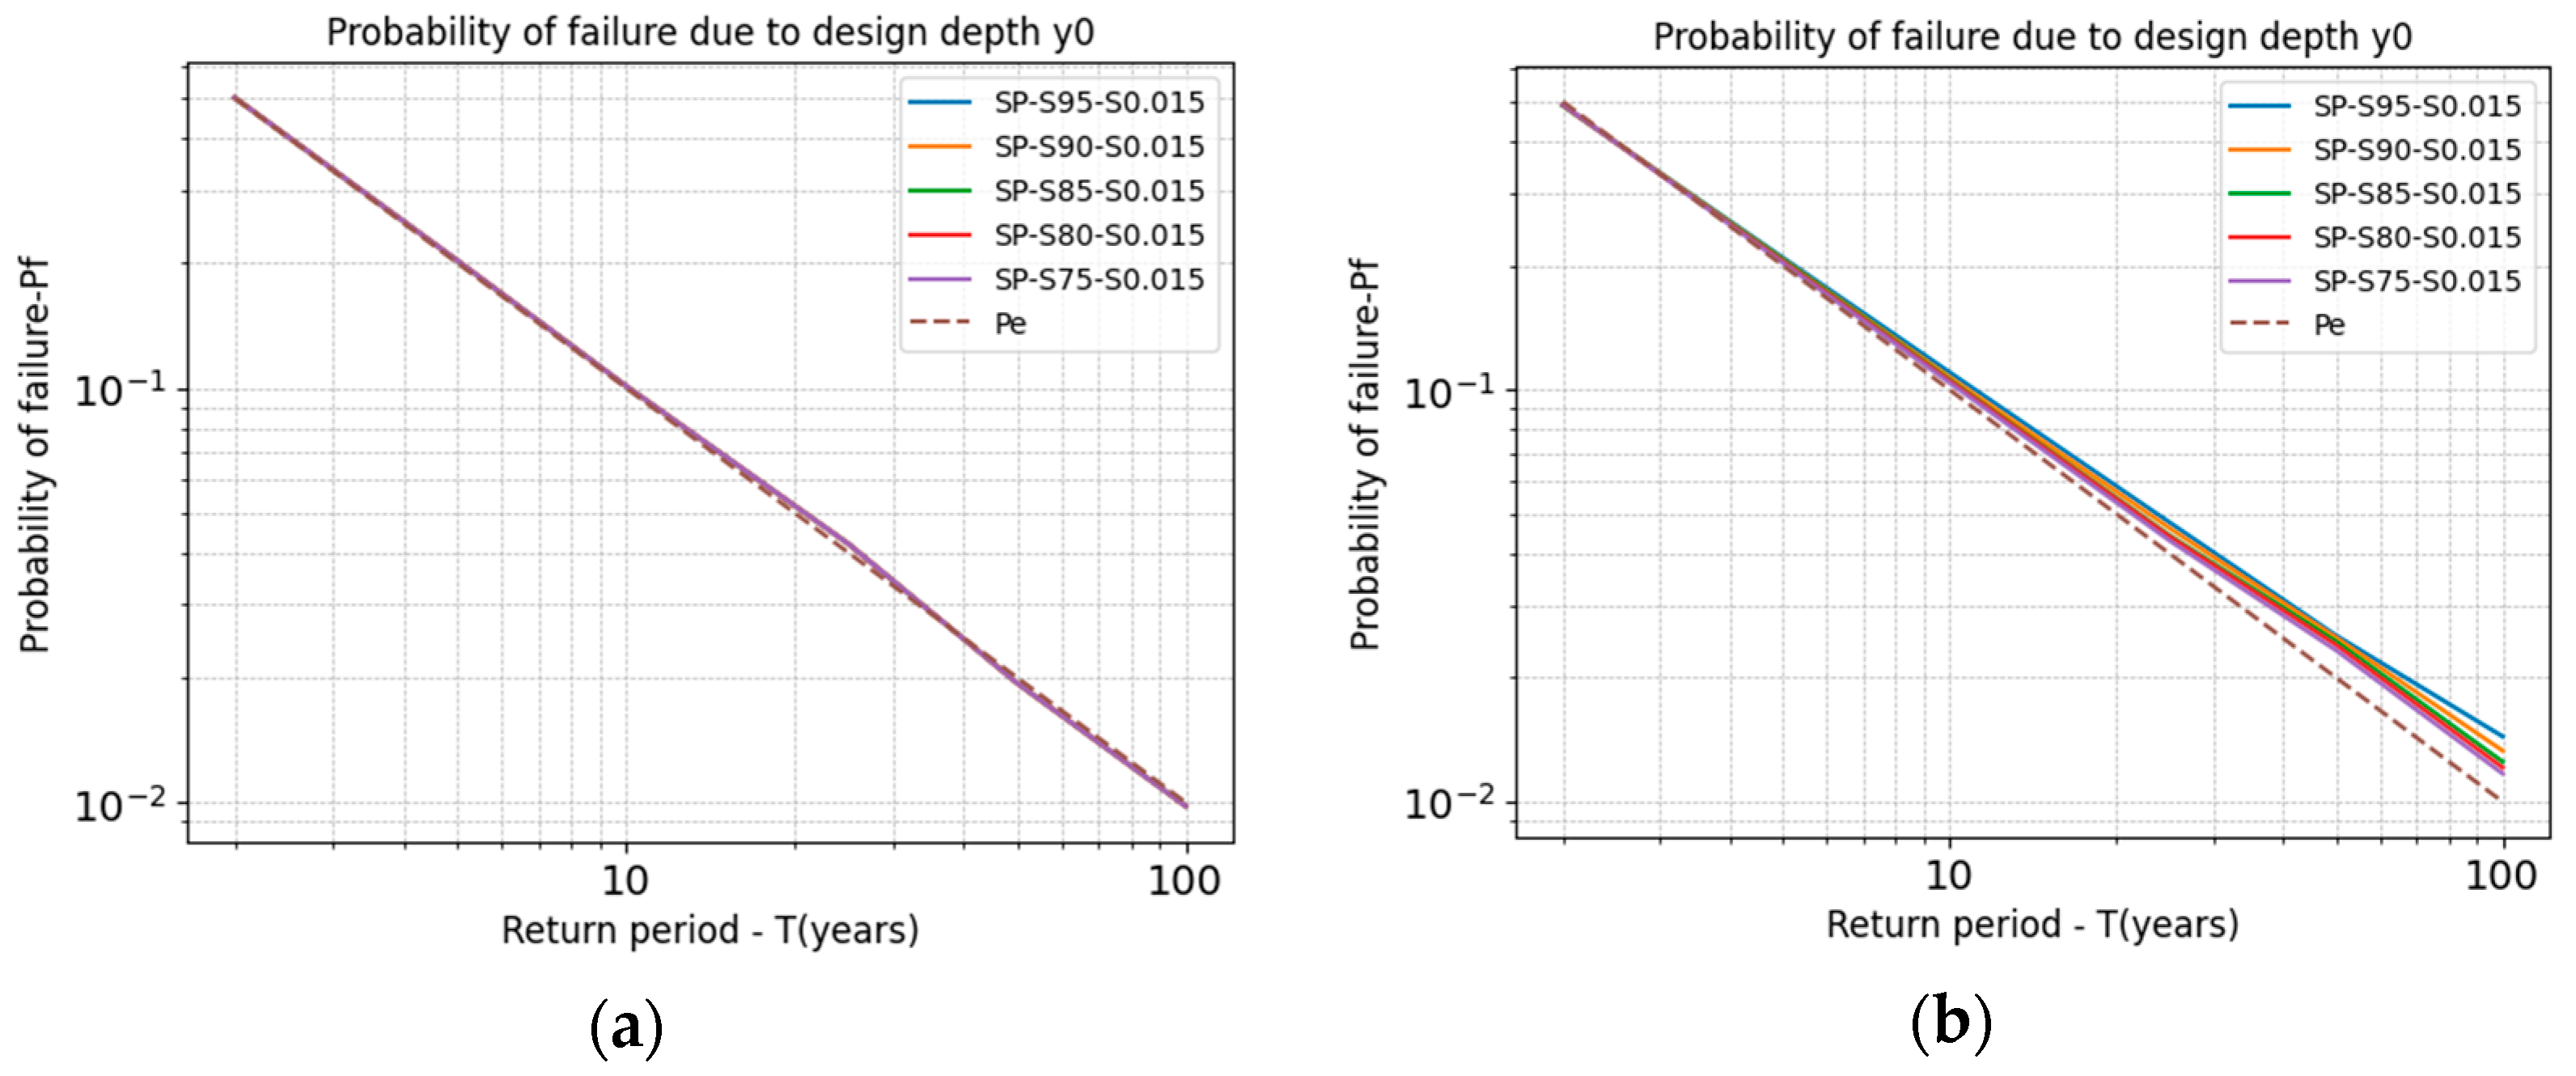
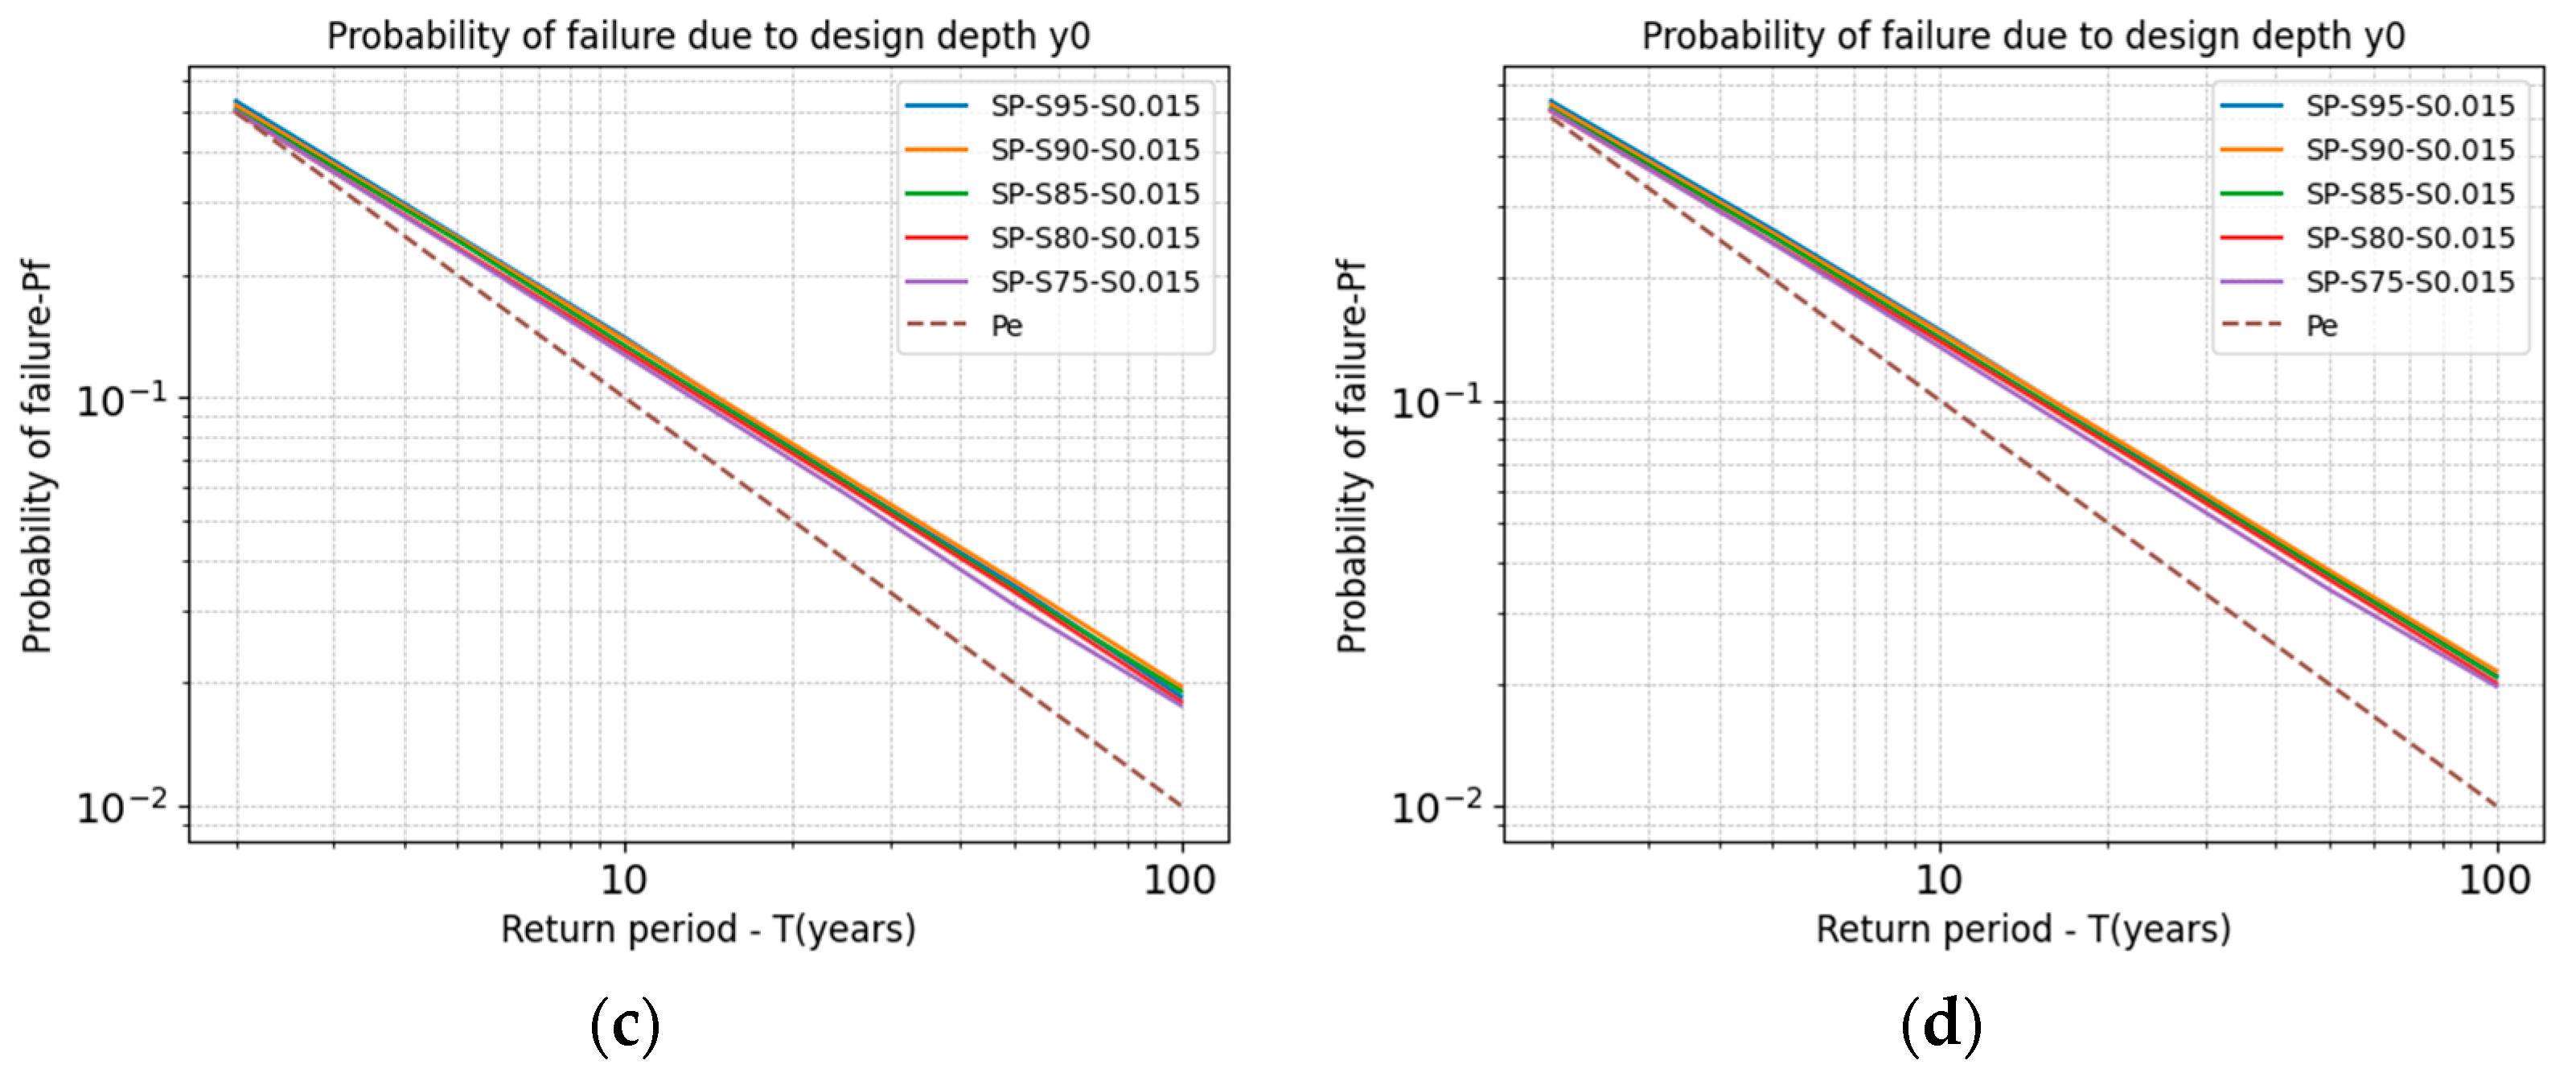
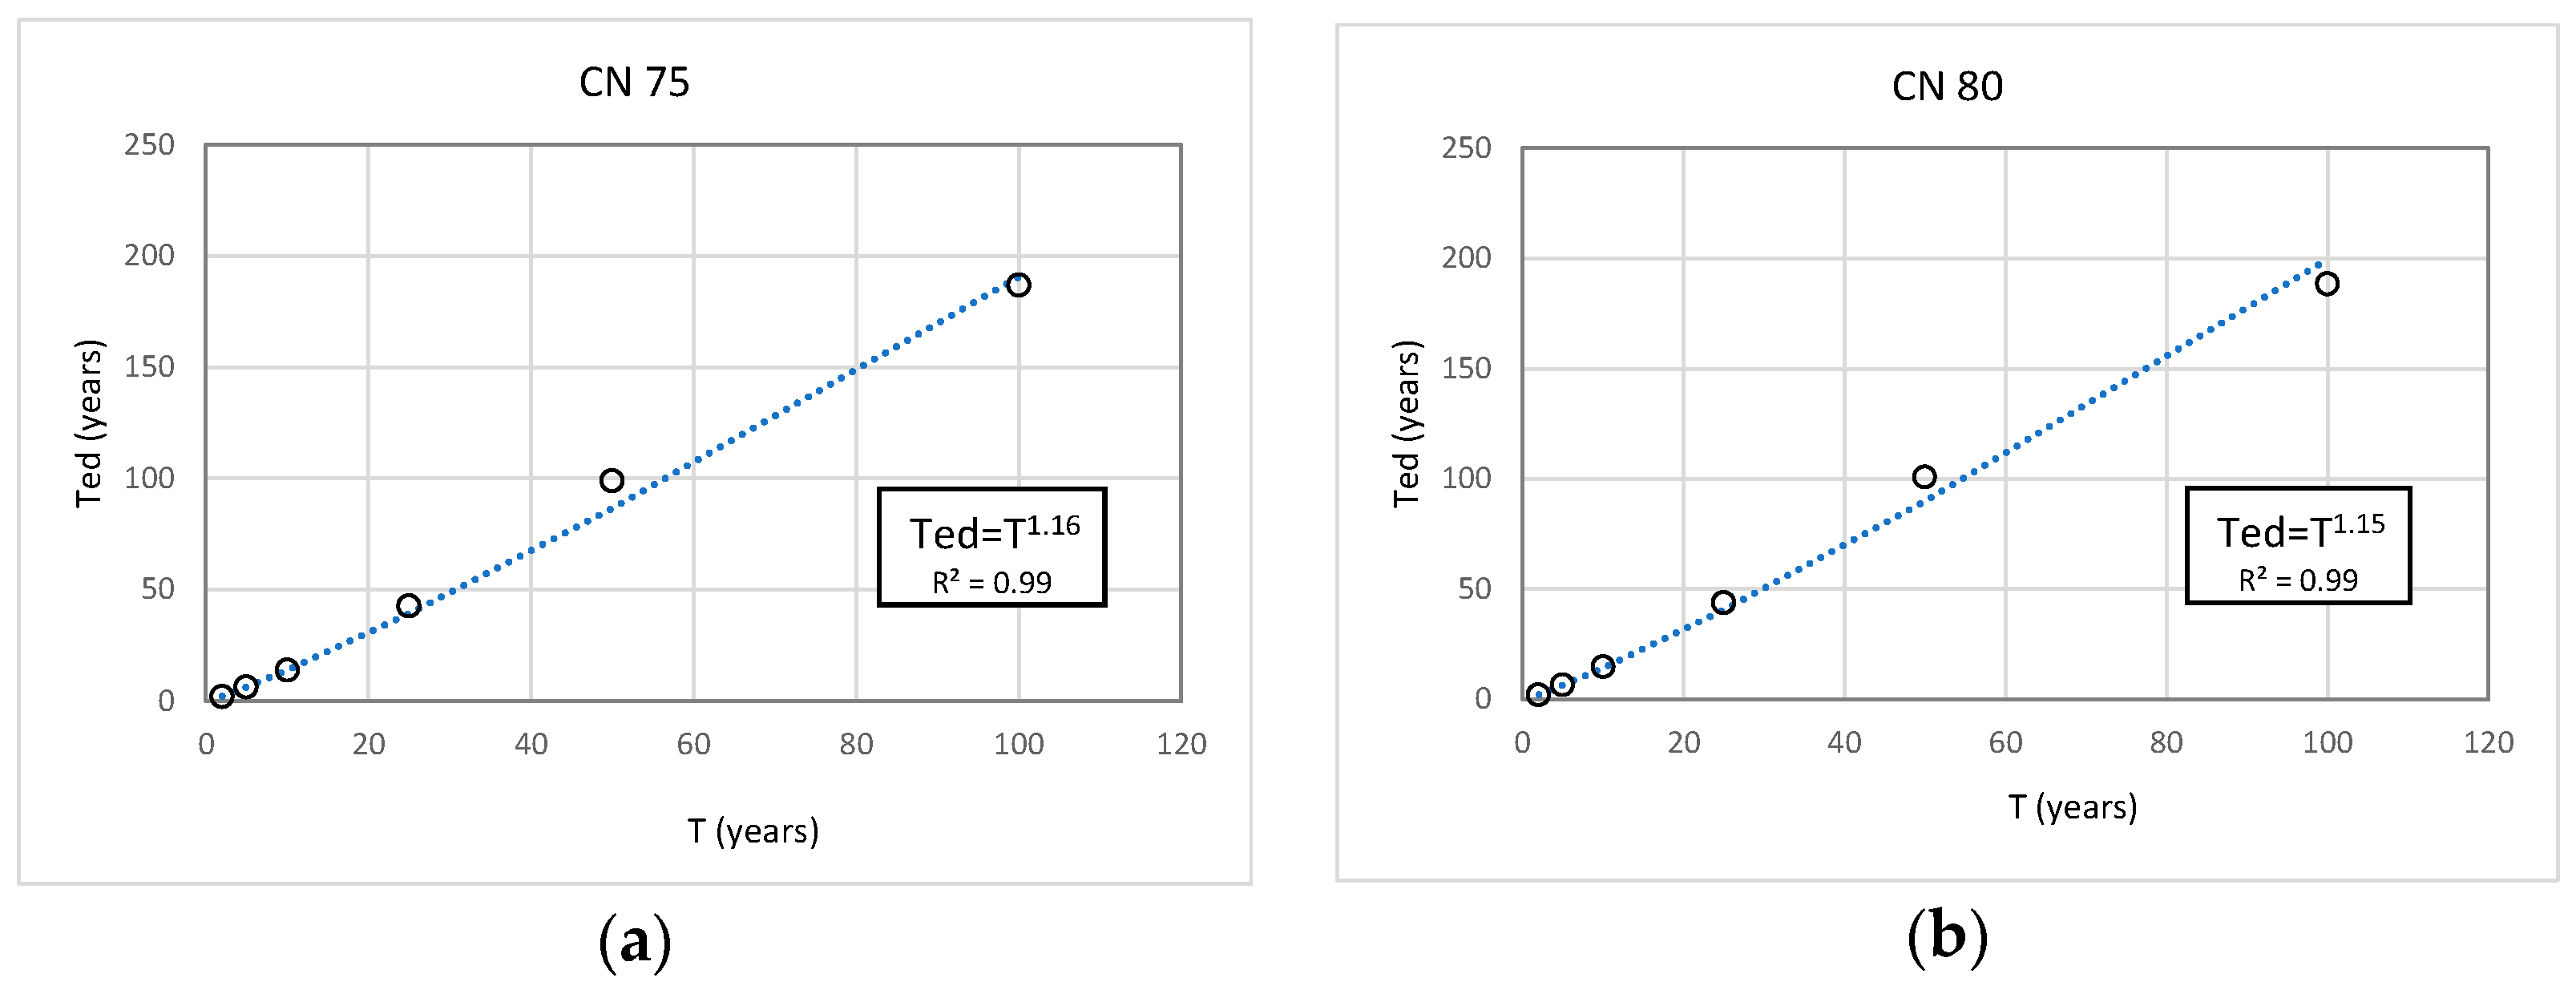
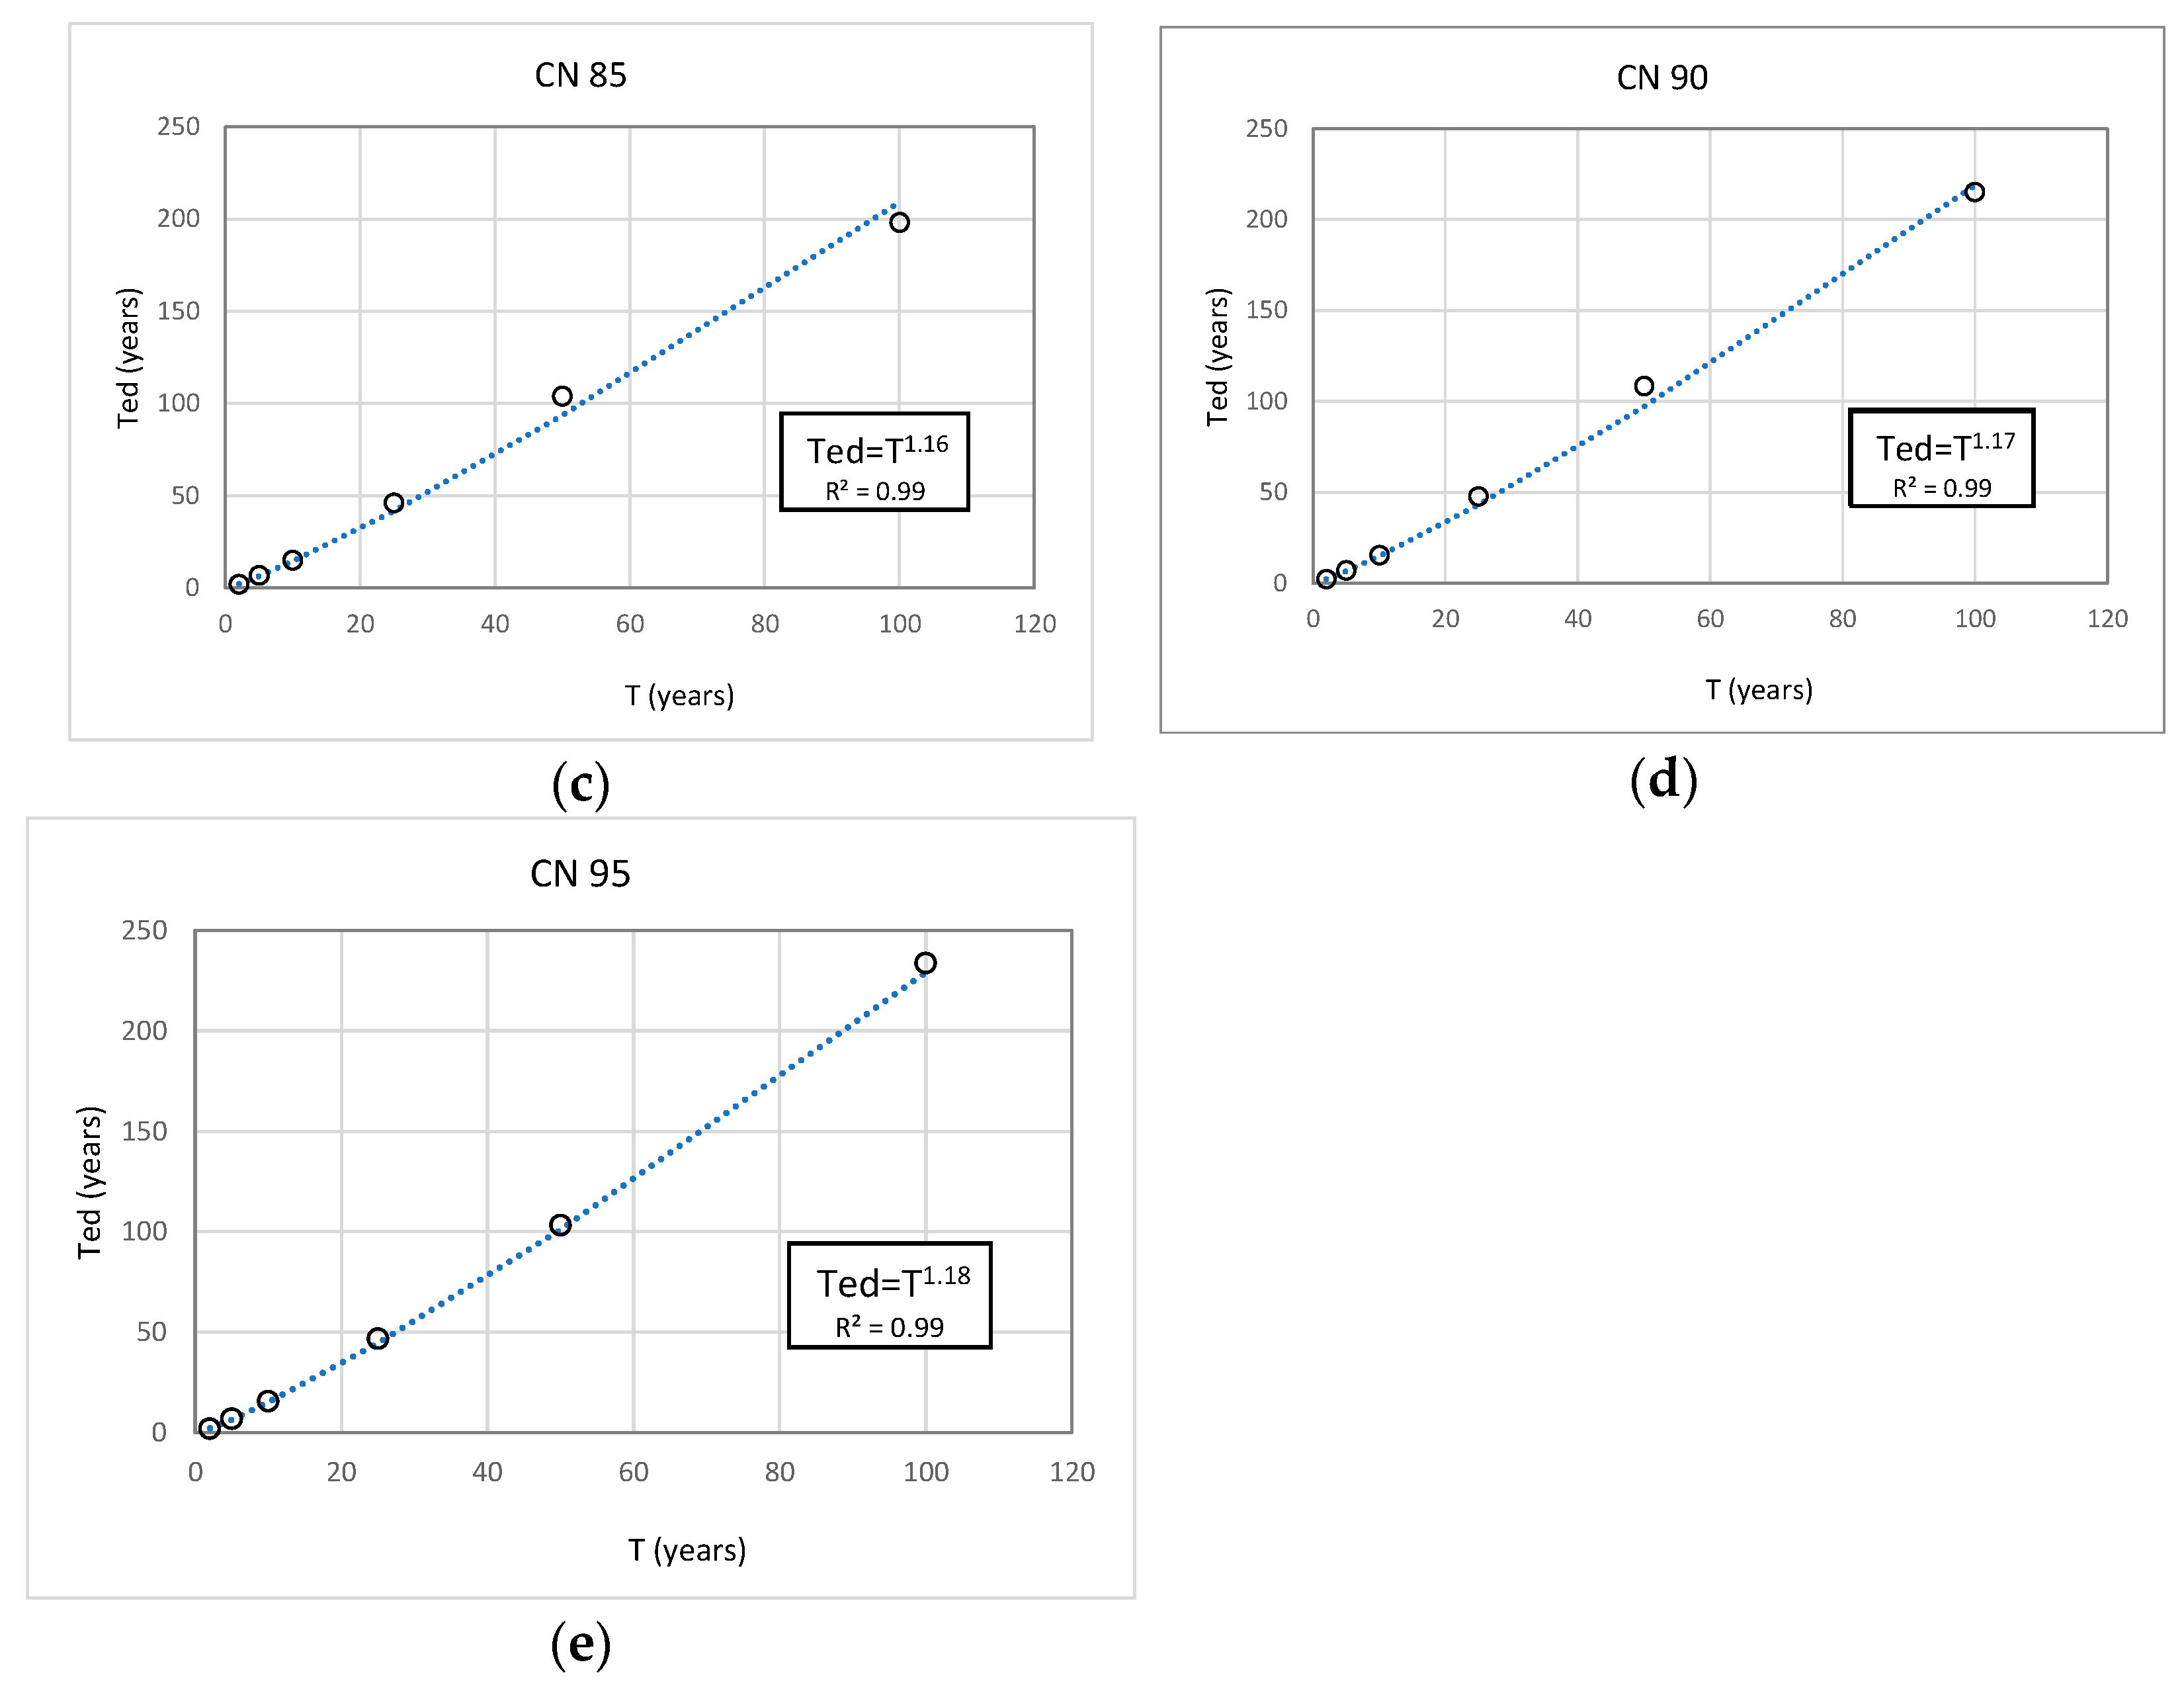
Increases in the return period do not necessarily represent a drastic increment in the design depth. For a 2-year return period, the equivalent return period is approximately 2.2 years; for a 25-year return period, the equivalent return period is approximately 42 years; and for a 100-year return period, it is approximately 210 years. In the case study, for a 50-year design period, the equivalent return period was approximately 94 years, or 88% greater; however, the depth increased only by 9%. This increment in depth guarantees a known probability of failure consistent with the expected annual design exceedance probability.
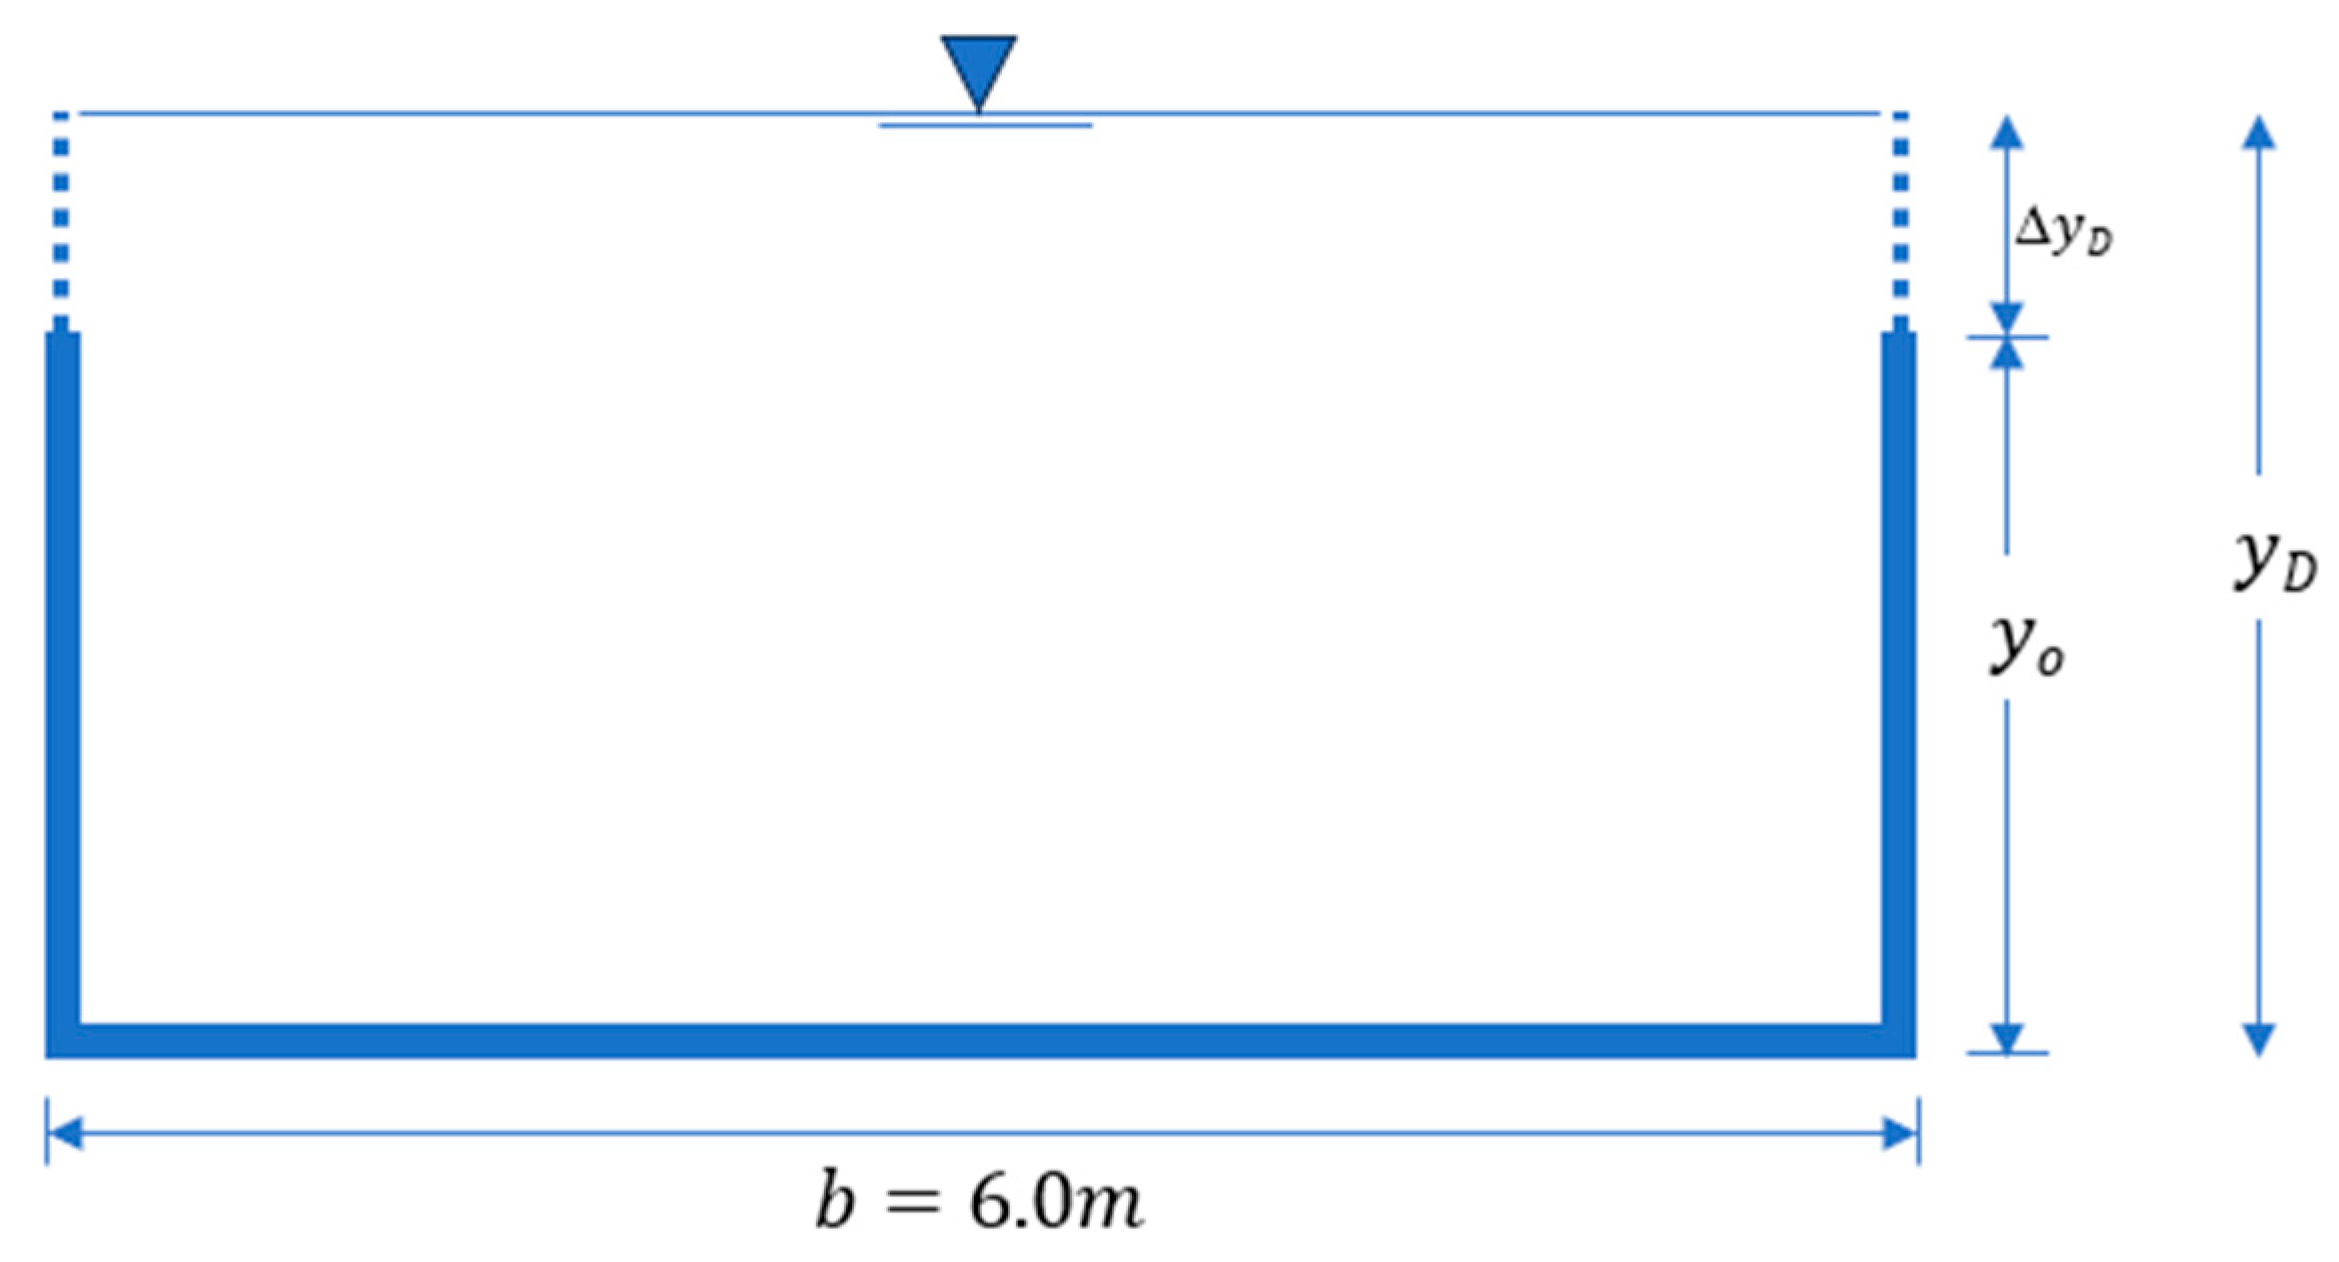
3.2.2. Prospective Water Depth and Estimation of an Initial Freeboard
The initial freeboard
is an additional height associated with uncertainty for prospective scenarios of channel deterioration and increases in CN that the designer may consider. It is expressed as follows:
where
corresponds to the prospective water depth estimated with the same probability-based methodology used for estimating
, but considering the uncertainty due to the prospective channel deterioration and increases in CN for the future defined by the designer.
Continuing with the case study, the probability-based design depth for CN = 85 and n = 0.015 s/m0.33 is .
Then, assuming hypothetical future scenarios of increments of CN to 90 and 95 and increments of Manning’s coefficient in the channel to 0.017, 0.019, and 0.021 s/m
0.33, the water depth may increase from
to
maintaining the criterion of
.
Table 10 shows the results of
required for those scenarios.
The magnitudes of do not correspond to the channel design depths, but rather to the total channel height that includes the design depth and an initial freeboard that accounts for uncertainty due to deterioration and increased CN. Based on these magnitudes, the designer must estimate a total freeboard to obtain the final channel height .
Table 11 shows the values of the initial freeboard
.
After estimating the initial freeboard , it is necessary to include additional heights based on the following criteria:
When the design depth
is less than 0.30 m, the freeboard would be as follows:
When the design depth
is greater than 0.30 m and the flow velocity is less than 1.72 m/s, in order to account for waves, wind, splashing, and turbulence, the freeboard would be as follows:
Finally, when the design depth
is greater than 0.30 m and the flow velocity exceeds 1.72 m/s, it is necessary to include a minimum of 0.15 m plus the initial freeboard and the velocity head associated with prospective water depth (
). For this condition, the freeboard is expressed as follows:
For this case study, the flow depth is greater than 0.30 m, and the flow velocity exceeds 1.72 m/s; therefore, the freeboard FB is determined using Equation (18). This criterion is more sensitive to increases in CN than to increases in channel roughness. Consequently, the worst prospective condition should be evaluated at the designer’s discretion to define an appropriate freeboard.
According to the results in
Table 12, if the watershed conditions are projected to increase CN to 95 while maintaining n = 0.015 s/m
0.33, the design freeboard should be 2.43 m. However, if the Manning coefficient increases to n = 0.021 s/m
0.33 for CN = 95, the estimated freeboard is 2.14 m. The selected scenarios should be evaluated at the designer’s discretion.
The probability-based design depth is 8.6% greater than the conventional design depth , and the estimated freeboard using different criteria represents a safety factor between 1.7 and 2.7, with an average of 2.1. This considers the flow supercritical, and the design discharge is relatively high.
The probability of failure-based design increases the total channel depth by 7.6% compared to the conventional design for CN = 85 and
n = 0.015 s/m
0.33, when prospective conditions of channel deterioration and increases in
CN over time are not considered. However, under a prospective condition of channel deterioration and an increase to CN = 95, the probability of failure-based design defines a channel with a total height 23.5% greater than the total depth of the conventional design, since the traditional freeboard does not account for prospective uncertainty scenarios (
Table 13).
A larger channel dimension entails higher construction costs, an essential factor to consider when developing a design. However, all necessary considerations must be made to ensure the construction of safe, adequate, and functional channels capable of withstanding the loads for which they were designed, taking into account the random behavior of the variables involved in the models, especially when the evidence has proved that the deterioration of the channel, land use changes, and potential non-stationary rainfall scenario are expected during the channel lifetime.


 ,
, 


