Article

Maifanstone Powder-Modified PE Filler for Enhanced MBBR 1 Start-Up in Treating Marine RAS Wastewater

by
Rubina Altaf
1,2,
Tianyu Xiao
1,3,
Kai Wang
3,
Jianlin Guo
4,
Qian Li
4,
Jing Zou
5,
Neemat Jaafarzadeh
6,
Daoji Wu
3 and
Dezhao Liu
1,2,*
1
Institute of Agri-Biological Environment Engineering, College of Biosystems Engineering and Food Science, Zhejiang University, Hangzhou 310058, China
2
Key Laboratory of Equipment and Informatization in Environment Controlled Agriculture, Ministry of Agriculture and Rural Affairs, Zhejiang Key Laboratory of Intelligent Sensing and Robotics for Agriculture, Hangzhou 310058, China
3
School of Municipal and Environmental Engineering, Shandong Jianzhu University, Jinan 250101, China
4
Zhejiang Institute of Freshwater Fisheries, Huzhou 313001, China
5
Xiamen Key Laboratory of Municipal and Industrial Solid Waste Utilization and Pollution Control, College of Civil Engineering, Huaqiao University, Xiamen 361021, China
6
Environmental Technologies Research Center, Medical Basic Sciences Research Institute, Ahvaz Jundishapur University of Medical Sciences, Ahvaz 61357-15794, Iran
*
Author to whom correspondence should be addressed.
Water 2025, 17(13), 1888; https://doi.org/10.3390/w17131888
Submission received: 5 May 2025 / Revised: 16 June 2025 / Accepted: 19 June 2025 / Published: 25 June 2025

Abstract

The recirculating aquaculture system (RAS) has been rapidly adopted worldwide in recent years due to its high productivity, good stability, and good environmental controllability (and therefore friendliness to environment and ecology). Nevertheless, the effluent from seawater RAS contains a high level of ammonia nitrogen which is toxic to fish, so it is necessary to overcome the salinity conditions to achieve rapid and efficient nitrification for recycling. The moving bed biofilm reactor (MBBR) has been widely applied often by using PE fillers for efficient wastewater treatment. However, the start-up of MBBR in seawater environments has remained a challenge due to salinity stress and harsh inoculation conditions. This study investigated a new PE-filler surface modification method towards the enhanced start-up of mariculture MBBR by combining liquid-phase oxidation and maifanstone powder. The aim was to obtain a higher porous surface and roughness and a strong adsorption and alkalinity adjustment for the MBBR PE filler. The hydrophilic properties, surface morphology, and chemical structure of a raw polyethylene filler (an unmodified PE filler), liquid-phase oxidation modified filler (LO-PE), and liquid-phase oxidation combined with a coating of a maifanstone-powder-surface-modified filler (LO-SCPE) were first investigated and compared. The results showed that the contact angle was reduced to 45.5° after the optimal liquid-phase oxidation modification for LO-PE, 49.8% lower than that before modification, while SEM showed increased roughness and surface area by modification. Moreover, EDS presented the relative content of carbon (22.75%) and oxygen (42.36%) on the LO-SCPE surface with an O/C ratio of 186.10%, which is 177.7% higher than that of the unmodified filler. The start-up experiment on MBBRs treating simulated marine RAS wastewater (HRT = 24 h) showed that the start-up period was shortened by 10 days for LO-SCPE compared to the PE reactor, with better ammonia nitrogen removal observed for LO-SCPE (95.8%) than the PE reactor (91.7%). Meanwhile, the bacterial community composition showed that the LO-SCPE reactor had a more diverse and abundant AOB and NOB. The Nitrospira has a more significant impact on nitrification because it would directly oxidize NH4⁺-N to NO3⁻-N (comammox pathway) as mediated by AOB and NOB. Further, the LO-SCPE reactor showed a higher NH4+-N removal rate (>99%), less NO2-N accumulation, and a shorter adaption period than the PE reactor. Eventually, the NH4+-N concentrations of the three reactors (R1, R2, and R3) reached <0.1 mg/L within 3 days, and their NH4+-N removal efficiencies achieved 99.53%, 99.61%, and 99.69%, respectively, under ammonia shock load. Hence, the LO-SCPE media have a higher marine wastewater treatment efficiency.

1. Introduction

The increasing scarcity of water resources, climate change, and environmental and ecology protection are requiring a sustainable and efficient marine aquaculture transformation, and global recirculating aquaculture systems (RASs) are developing rapidly with increased research focus [1]. By recycling more than 90% of the water in the system, RAS minimizes the discharge of wastewater from the system, significantly saves water resource, and reduces the pollution to the environment [2], therefore representing a direction of future development for the aquaculture industry [3]. Nevertheless, the decomposition of ammonia nitrogen and nitrite produced by the decomposition of the farmed fish in RAS is often a serious threat to the growth and health of the fish even at a very low level [4]. Specifically, ammonia disrupts the fish’s ability to regulate its internal environment, leading to impaired respiration, osmoregulation, and overall health. Prolonged exposure to elevated ammonia levels can result in severe physiological stress, decreased immunity, and even death. On the other hand, even a low concentration ammonium can interfere with fish metabolism, reduce oxygen uptake, and disrupt essential biological processes. Therefore, strict control and removal of ammonium nitrogen are critical to ensure the survival and optimal health of farmed fish in aquaculture systems [4,5]. The recommended limit for an ammonia nitrogen concentration should not exceed 1 mg/L. Further, nitrite is highly toxic to fish even at a very low concentration. For example, a study conducted by Dutra et al. [6] showed that nitrite was toxic even at lower concentrations (1 mg/L), resulting in a 27% mortality rate in fish within 96 h. The accumulated ammonia nitrogen and nitrites in the wastewater have significant impacts on aquatic organisms and the environment. To discharge or recycle this wastewater, effective treatment is necessary.
Saline wastewater generated from marine aquaculture can be treated using physical-chemical or biological treatment methods, with biological methods being preferred considering costs. However, due to the high salinity, traditional activated sludge treatment may not be applicable [7]. Compared to traditional activated sludge systems, biofilm technology offers advantages such as a high concentration of active biomass and high resistance to shock loads with no excess sludge discharge [8]. It is therefore becoming increasingly widely used in the field of wastewater treatment. Biofilm technology mainly includes biological filters, biological rotating discs, biological contact oxidation, fluidized bed reactors, and moving bed biofilm reactors (MBBR). The MBBR process is a completely mixed, continuously operating biofilm reactor developed based on fluidized bed reactors and biological contact oxidation. It is simple to operate, highly efficient, and not prone to clogging. Compared to other biofilm technologies, the MBBR process overcomes the issues of periodic backwashing, which are required in biological filters, and a large footprint of biological rotating discs [9,10].
The density, specific surface area, porosity, and surface roughness of MBBR media are the main factors influencing its treatment performance [11,12]. According to the material type, MBBR media can be classified into inorganic media, organic polymer media, and naturally degradable polymer media. The ideal MBBR (moving bed biofilm reactor) media should have the following advantages: a large specific surface area, good mass transfer properties, a density slightly lower than water, high mechanical strength, and low cost [13]. Inorganic media, although having advantages such as a lower cost and high mechanical strength, also have some drawbacks.
Currently, research on filler modification mainly focuses on improving the hydrophilicity and biological affinity of fillers, as well as altering surface charges and magnetic properties. The filler modification methods can be divided into raw material modification, surface modification, and composite modification technologies. These approaches aimed to impart the specific properties such as hydrophilicity and magnetism [14]; for example, Mao et al. [15] mixed PE with positively charged polymers (polyquaternium salt or PQAS-10) and cationic polyacrylamide (CPAM) to make the surface of the filler positively charged, aiming at the enhanced removal of TN. When the packing ratio was 50%, the NH4+-N removal rate reached over 90%. Liquid-phase chemical oxidation is a commonly applied modification method which involves a chemical oxidation reaction between liquid-phase chemical reagents and the material surface. This process introduces oxygen-containing functional groups (such as carbonyl groups, e.g., ketones or carboxylic acids) on the material surface, thereby improving the surface roughness and hydrophilicity of the material [16]. The liquid-phase oxidation modified fillers were involved to improve compatibility, media properties, and adhesion [16]. However, the investigation of biofilm reactors using such surface modification towards marine wastewater treatment is still rare.
This study innovatively combines the excellent properties of maifanstone powder with the liquid-phase oxidation surface modification method to create a novel composite filler (LO-SCPE) with excellent hydrophilicity and biocompatibility. Therefore, the objectives of this study were the following: (1) to investigate the novel surface modification strategies of fillers regarding a faster start-up of bioreactor, (2) to assess the surface properties of the modified fillers for MBBR treating marine wastewater, and (3) to evaluate the stability of the MBBR nitrification process. This study can provide insights into the development of commercially viable, hydrophilic organic fillers and rapid biofilm formation in maricultural MBBRs systems.

2. Materials and Methods

2.1. Experimental Reagents and Materials

The polyethylene filler (K5) bio-carrier (white) was made of high-density polyethylene (HDPE). It has a specific surface area of 800 m2/m3, a height of 3 mm, a diameter of 25 mm, a density of 0.96 g/cm3, and porosity greater than 75%. It was purchased from Sanxing Water Treatment Equipment Co., Ltd., (Zhengzhou, China). The particle size range of the maifanstone powder was 50–100 μm, and it was purchased from Xincheng Mining Products (Shijiazhuang, China). The main chemical reagents used in the experiment were concentrated sulfuric acid (98%); K2Cr2O7; acetic acid; and chitosan (degree of deacetylation ≥ 95%); including an ultrasonic cleaner (model: KQ5200E, Kunshan Ultrasonic Instruments Co., Ltd., Shanghai, China); a pH measuring instrument (PHS-3C) was purchased from Yidian Scientific Instruments Co., Ltd., (Shanghai, China); a dissolved oxygen meter model; Mylti 3620 IDS (WTW Instruments GmbH & Co. KG., Weilheim, Germany); an electromagnetic air compressor, ACO-318 (Haili Co., Ltd., Guangzhou, China); a peristaltic pump, DlPump550 (Kachuang Fluid Technology Co., Ltd., Shanghai, China); an UV-Vis spectrophotometer (model: UV-9000, Yuanxi Instruments Co., Ltd., Shanghai, China); an air flow meter (model: 0.1 m3/h–10 m3/h, Beixing Instrument Manufacturing Co., Ltd., Shenyang, China); a constant temperature water bath, DZKW-C (Shuli Instrument and Meter Co., Ltd. Shanghai, China); a contact angle goniometer, DSA25 (KRUSS Scientific Instruments Co., Ltd., Shanghai, China); and the Magnetic Stirring and Heating Machine-78-1 (Xinxin Laboratory Instrument Co., Ltd., Changzhou, China). The NH4Cl and MgSO4·7H2O (analytical grade) were purchased from China National Pharmaceutical Group Chemical Reagents Co., Ltd. (Beijing, China). The K2HPO4, CaCl2, NaHCO3, Na2HPO4·12H2O, NaCl, HgI2, KI, NaOH, KNaC4H6O6·4H2O, and NaNO2 were purchased from Sinopharm Group Chemical Reagents Co., Ltd., (Shanghai, China). The phosphate buffered solution (pH7.0), hydrochloric acid (37%), osmium tetroxide (1%), and ethanol (95%) were purchased from China National Pharmaceutical Group Chemical Reagent Co., Ltd., (Beijing, China). The isoamyl acetate, glutaraldehyde, and KNO3 were purchased from McLean (McLean, VA, USA).

2.2. Liquid-Phase Oxidation Modification Process

Firstly, the untreated polyethylene (PE) filler was cleaned using pure water in an ultrasonic cleaning machine for 10 min to remove surface particulate impurities. After cleaning, the filler naturally air-dried and was set aside for further use. The chromic acid solution was used as a liquid-phase oxidation treatment solution which was prepared by (1) dissolving potassium dichromate (K2Cr2O7) in a specified volume of pure water and (2) slowly adding sulfuric acid to the solution. During the addition of H2SO4, exothermic heat was released, and therefore, it was important to continuously stir the solution. After that, the PE filler was immersed in the chromic acid solution under the water bath for the designated treatment duration. After the treatment, the surface of the filler was rinsed with deionized water to remove any residual chemicals, and the filler was air-dried. The resulting product was the liquid-phase oxidized polyethylene filler (LO-PE). An orthogonal experiment was conducted to investigate the effect of the liquid-phase oxidation modification on the static contact angle of the filler under different conditions, considering three factors: treatment time, treatment temperature, and the mass ratio of K2Cr2O7 to H2SO4. An L9(3^3) orthogonal table was used for the experimental design to determine the optimal treatment time, treatment temperature, and the mass ratio of K2Cr2O7 to H2SO4. Three levels were selected for each factor.

2.3. Liquid-Phase Oxidation—Surface Coating Modification by MaifanStone Powder

The liquid-phase oxidation modification was performed as the procedure described above. For the preparation of maifanstone powder, the procedure was as followed: A specific amount of chitosan was dissolved in 100 mL of an acetic acid solution (pH 4 to 5) using a heated centrifugal stirrer. After complete dissolution, a measured amount of maifanstone powder was uniformly mixed with the binder solution. The liquid-phase oxidized filler was immersed in the resulting mixture for several seconds and then removed and placed in an oven for 2 h. The obtained product was the maifanstone powder surface coating—liquid-phase oxidized modified polyethylene filler (LO-SCPE).

2.4. MBBRs: Systems and Start-Up

Laboratory-scale MBBR systems were used for experiment, which mainly include a cylindrical MBBR reactor, an electromagnetic air compressor, carrier’s media (fillers), an air flowmeter, a feed pump, an inlet tank, and connecting pipelines. The system schematic is illustrated in Figure S1 which can found in Supporting Information. The MBBR reactor was made of acrylic with a height of 40 cm, a diameter of 20 cm, and an effective working volume of 8.8 L. An aeration head was installed at the bottom of the MBBR reactor to ensure sufficient oxygen supply and facilitate the circulation of the fillers. For the MBBR treatment of aquaculture wastewater, in this start-up experiment, three sets of MBBR systems of the same scale were used. In these systems, reactors (R1, R2, R3) were filled with filler materials such as PE, LO-PE, and LO-SCPE, respectively, with the preparation method as described in Section 2.2. According to the previous studies [17,18], the filler filling rate was set at 30% (V/V). Throughout the entire experimental period, the three MBBR systems were maintained at a constant temperature (25 ± 1 °C) using heating rods, with DO = 6.5 ± 1 mg/L and pH = 7.5 ± 0.5. The membrane formation process was initiated by natural biofilm attachment.
The system uses a continuous inflow method, with a hydraulic retention time (HRT) of 24 h for all three MBBR systems. The influent was simulated as seawater aquaculture wastewater, and the simulated formula was based on previous research [19]. The chemical composition of the wastewater simulation is shown in Supporting Information as Table S1. The MBBRs’ experimental stages and time periods are shown in Table 1.

2.5. MBBR Performance Tests on HRT, Shock Load, and Temperature

To investigate the stability of the three MBBR systems, the effect of different HRTs, low (6 h), medium (12 h), and high (24 h), were investigated on the effluent concentrations of NH4+-N and NO2-N.
The effects of different levels of NH4⁺-N shock loads on the effluent concentrations of NH4⁺-N and NO₂⁻-N in the reactor were examined at 13, 50, and 100 mg/L. Samples were taken once a day until there were no significant differences in the effluent NH4⁺-N and NO₂⁻-N concentrations for three consecutive days. For these tests, the three MBBR systems were maintained at a constant temperature (25 ± 1 °C), DO (6.5 ± 1 mg/L), and pH (7.5 ± 0.5) during the whole experiment.
The impact of different temperature levels on the effluent concentrations of NH4⁺-N and NO₂⁻-N by reducing the reactor temperature was also evaluated. The system temperatures were set at 25 ± 1 °C, 20 ± 1 °C, and 15 ± 1 °C. Samples were taken once a day until the effluent concentrations of NH4⁺-N and NO2⁻-N showed no significant variation between consecutive measurements. The DO was maintained at 6.5 ± 1 mg/L, and the pH was 7.5 ± 0.5 throughout the experiment.

2.6. Analysis and Testing Methods

2.6.1. Testing Method for Water Quality

The following parameters were regularly tested in the influent and effluent samples of the MBBR: ammonia nitrogen (NH4+-N), nitrite nitrogen (NO2-N), nitrate nitrogen (NO3-N), dissolved oxygen (DO), and pH. The concentration analysis of NH4+-N, NO2-N, and NO3-N were measured by phenol disulfonic acid spectrophotometry. Water samples were filtered through a 0.45 µm filter membrane, and the analytical methods are provided in Table S2. The dissolved oxygen and temperature in the reactor were measured using a DO meter, and the pH of the reactor was measured using a pH meter.

2.6.2. Bacterial Analysis

For bacterial analysis, when a relatively stable state was reached (on day 160 of the experiment), attached biofilms were detached from carrier filler surfaces using the following steps: (1) biofilm detachment from the surface of carrier fillers material and (2) an ultrasonic cleaner that was used to sonicate the biofilm at 53 kHz for 1 min. Then, for homogenization, the suspension was vortexed for 5 min, and centrifugation was performed at 4000 rpm and at 4 °C for 10 min to obtain the biomass particles. (3) After separating the biomass from the carrier surface and particles, the OMEGA bio-Tek soil DNA extraction kit (Omega, Bio-Tek, Norcross, GA, USA) was used to extract the total genomic DNA samples. The concentration of the extracted DNA was measured by using the NanoDrop NC2000 spectrophotometer (Shanghai Personal Biotechnology Co., Ltd., Shanghai, China) and agarose gel electrophoresis. For bacterial analysis, samples were analyzed for R1, R2, and R3.
For 16S rRNA gene amplicon sequencing, (1) primers 341F 5′-CCTAYGGGRBGCASCAG-3′ and 806R 5′-GGACTACNNGGGTATCTAAT-3′ were used to amplify the V3–V4 region of the 16S rRNA gene. The PCR reaction mixture (25 μL) consisted of 5 μL of buffer (5×), 0.25 μL of Fast pfu DNA polymerase (5 U/μL), 2 μL of dNTPs (2.5 mM), 1 μL of primers (5 μM), 1 μL of DNA template, and 14.75 μL of ddH₂O (double distilled water). (2) The thermal cycling conditions included an initial denaturation at 98 °C for 30 s, followed by denaturation at 98 °C for 15 s, annealing at 55 °C for 30 s, and extension at 72 °C for 30 s, and the final extension was performed at 72 °C for 5 min. This cycle was repeated 25–27 times. (3) The PCR product was purified using Vazyme VAHTS™ DNA Clean Beads (Vazyme, Nanjinng, China), and quantification was performed using the Quant-It PicoGreen dsDNA Assay Kit (Thermo Fisher Scientific, Waltham, MA, USA). After individual quantification, amplicons were incorporated in equal amounts. (4) PCR-amplified products were analyzed using the Quanti Fluor −ST system (Promega Inc., Madison, WI, USA). 16S sequencing libraries were then generated from the amplified products for subsequent sequencing using the Illumina PE platform at Shanghai Paiseano Biotechnology Co., Ltd. (Shanghai, China). Operational Taxonomic Units (OTUs) were determined using Usearch (version 10, https://drive5.com/uparse/ (accessed on 18 June 2025)). OTUs with 97% similarity were used to analyze the similarity and differences within the genera of the samples.
The alpha diversity index of the bacterial community in the samples was characterized by measuring the 16S rRNA, as shown in Table 2. Both the Chao1 index and the Observed_species index are indicators of the bacterial community richness (i.e., the number of bacterial species, such as OTUs, in the community).
The abundance of ammonia-oxidizing bacteria (AOB) and nitrite-oxidizing bacteria (NOB) in PE, LO-PE, and LO-SCPE were detected using quantitative PCR (qPCR) which can found in Supporting Information (Section S1).

2.7. Characterization of Filler Surface

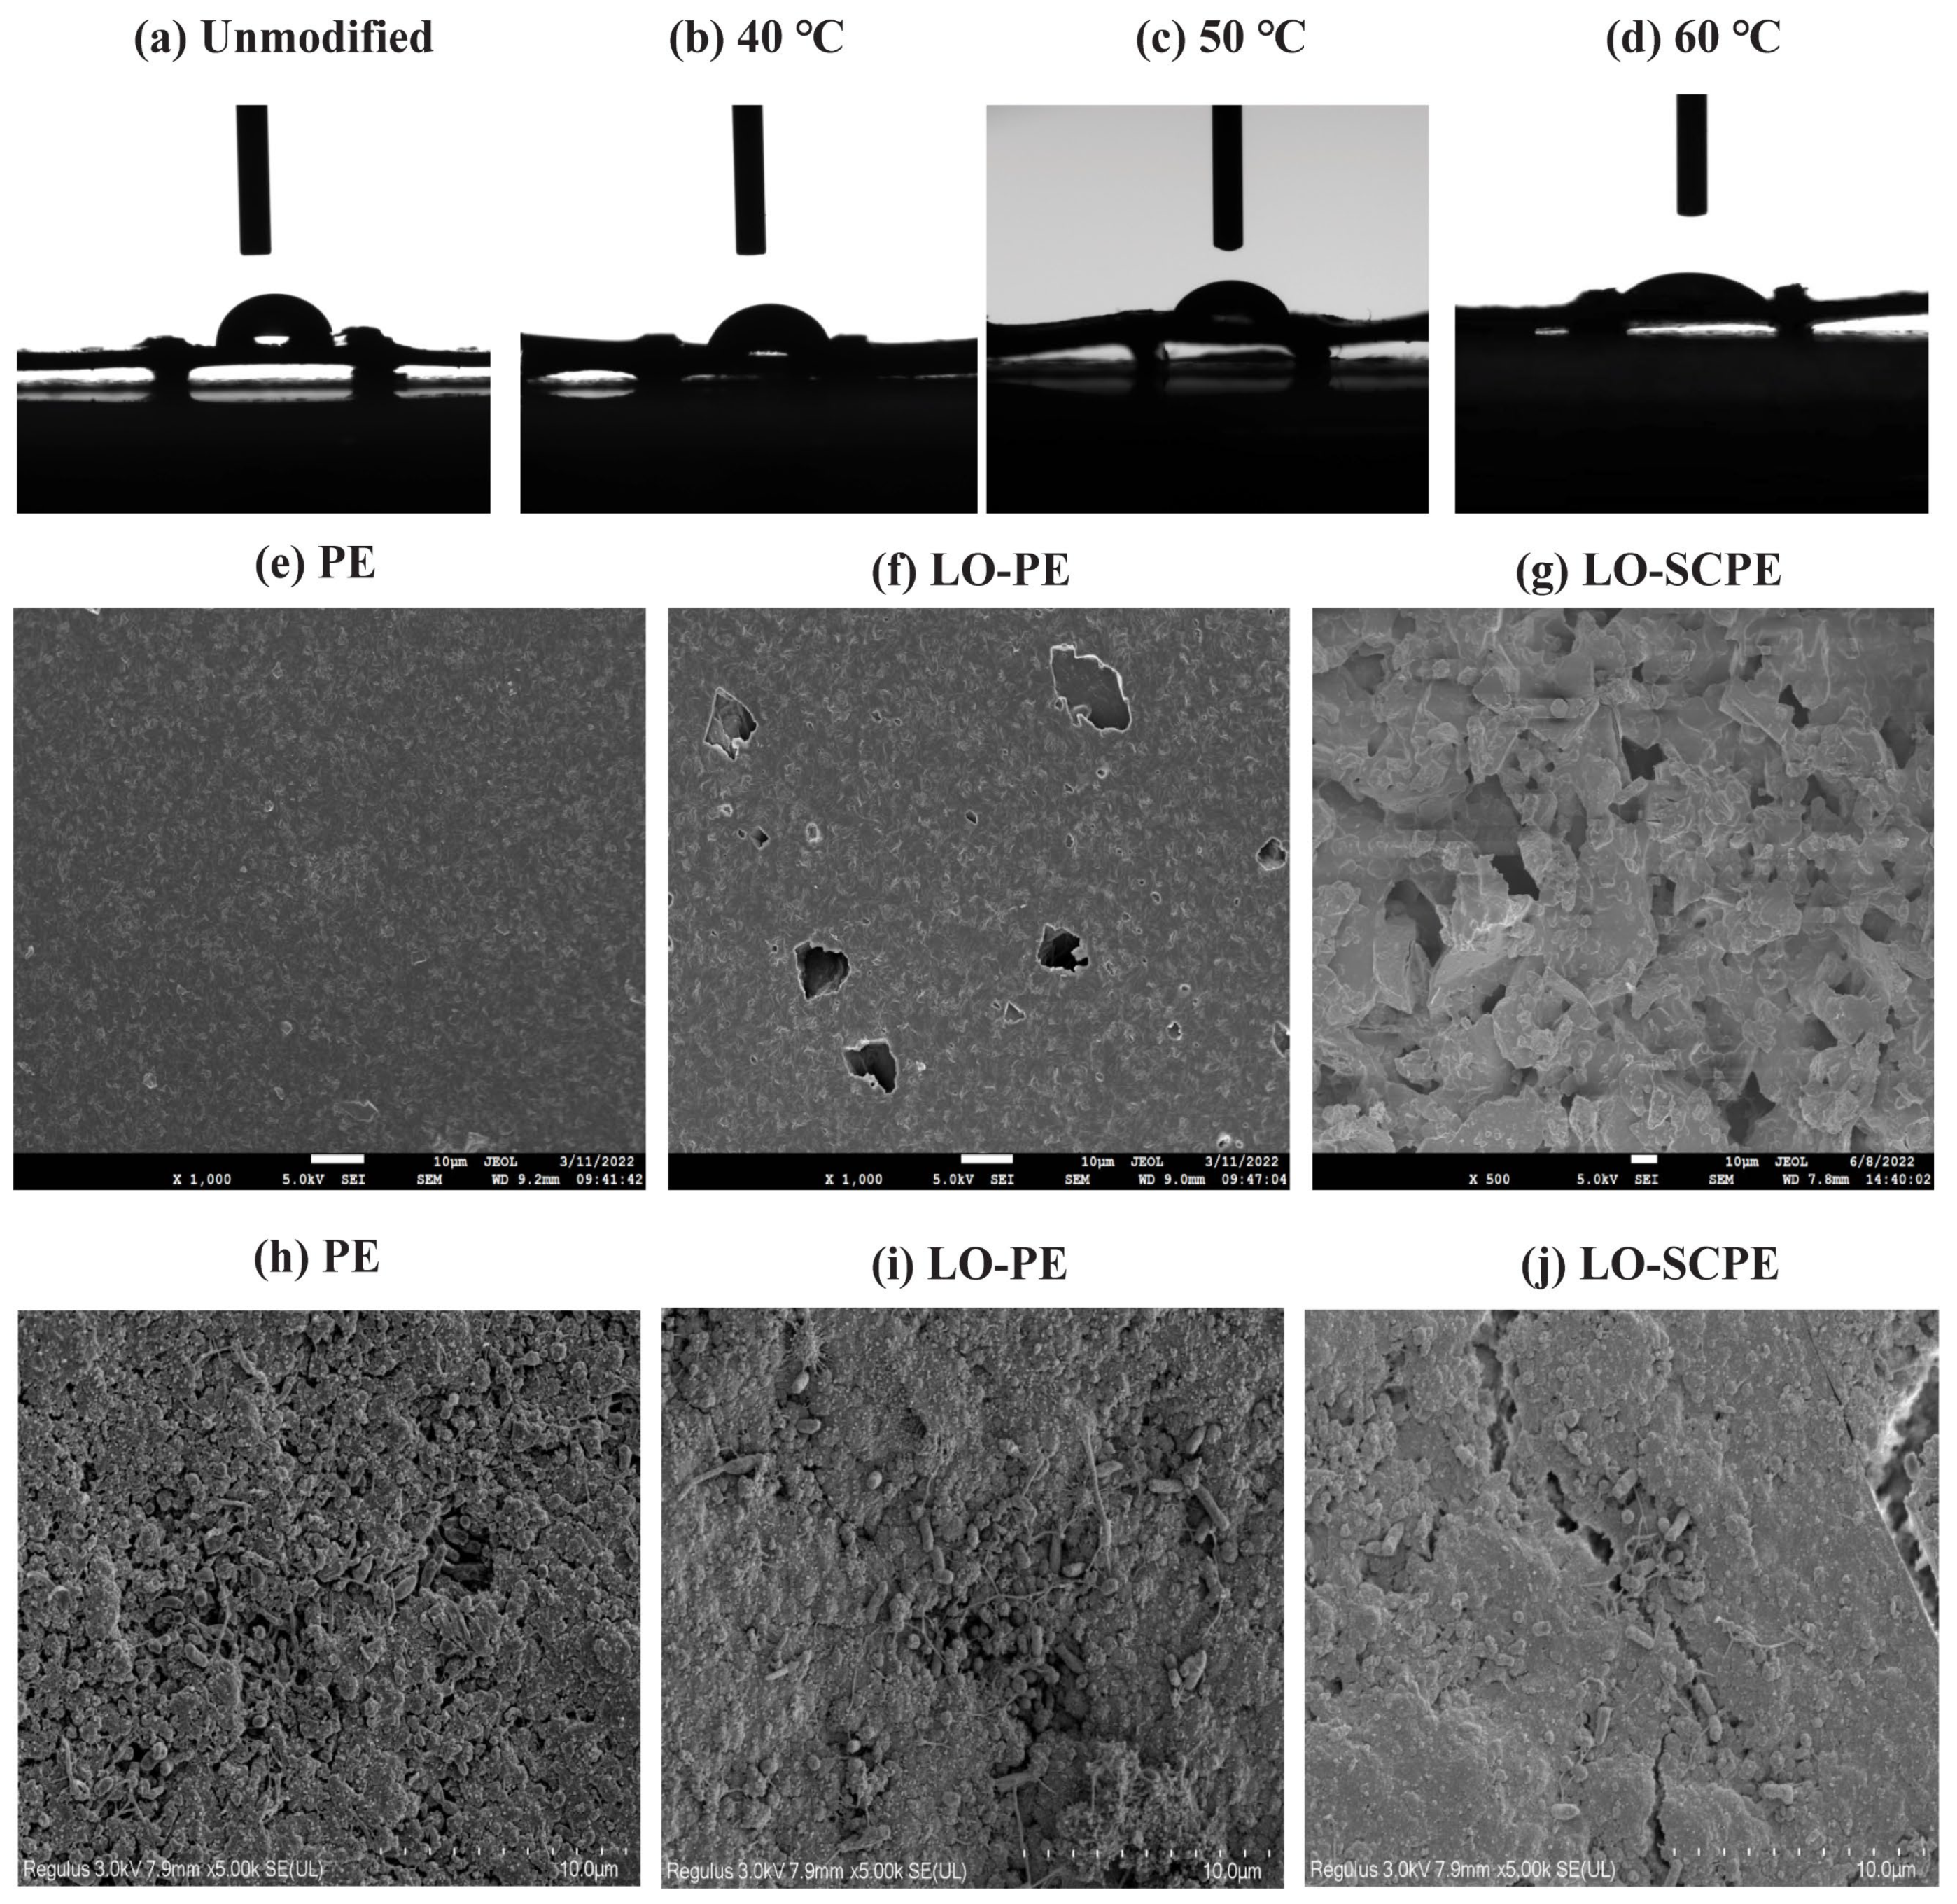
2.7.1. Testing Procedure for Contact Angle

The testing procedure for the contact angle is presented in the Supporting Information (Section S1).

2.7.2. Scanning Electron Microscopy (SEM) Test

For the SEM analysis of filler surfaces, regular specimens of PE, LO-PE, and LO-SCPE were selected and cut into pieces with dimensions of approximately 2 mm in length and 1 mm in thickness. The surfaces of the samples were cleaned with distilled water and ethanol and then dried in an oven at 60 °C for 2 h. Subsequently, after they dried the samples were cut into appropriate sizes and analyzed by using SEM-JSM-7610F Plus (Nihon Electric Co., Ltd., Osaka, Japan).
The biofilms on different filler surface samples were also analyzed by using SEM for surface morphology structure. The samples were prepared by using a 2.5% glutaraldehyde solution, 0.1 M phosphate buffer (pH 7.0) solution, and ethanol solutions of different concentrations (30%, 50%, 70%, 80%, 90%, and 95%). The samples were treated with a mixture of ethanol and isoamyl acetate (V/V = 1/1) for 30 min, followed by treatment with pure isoamyl acetate for 1 h or overnight. The processed samples were observed under a scanning electron microscope (SEM).

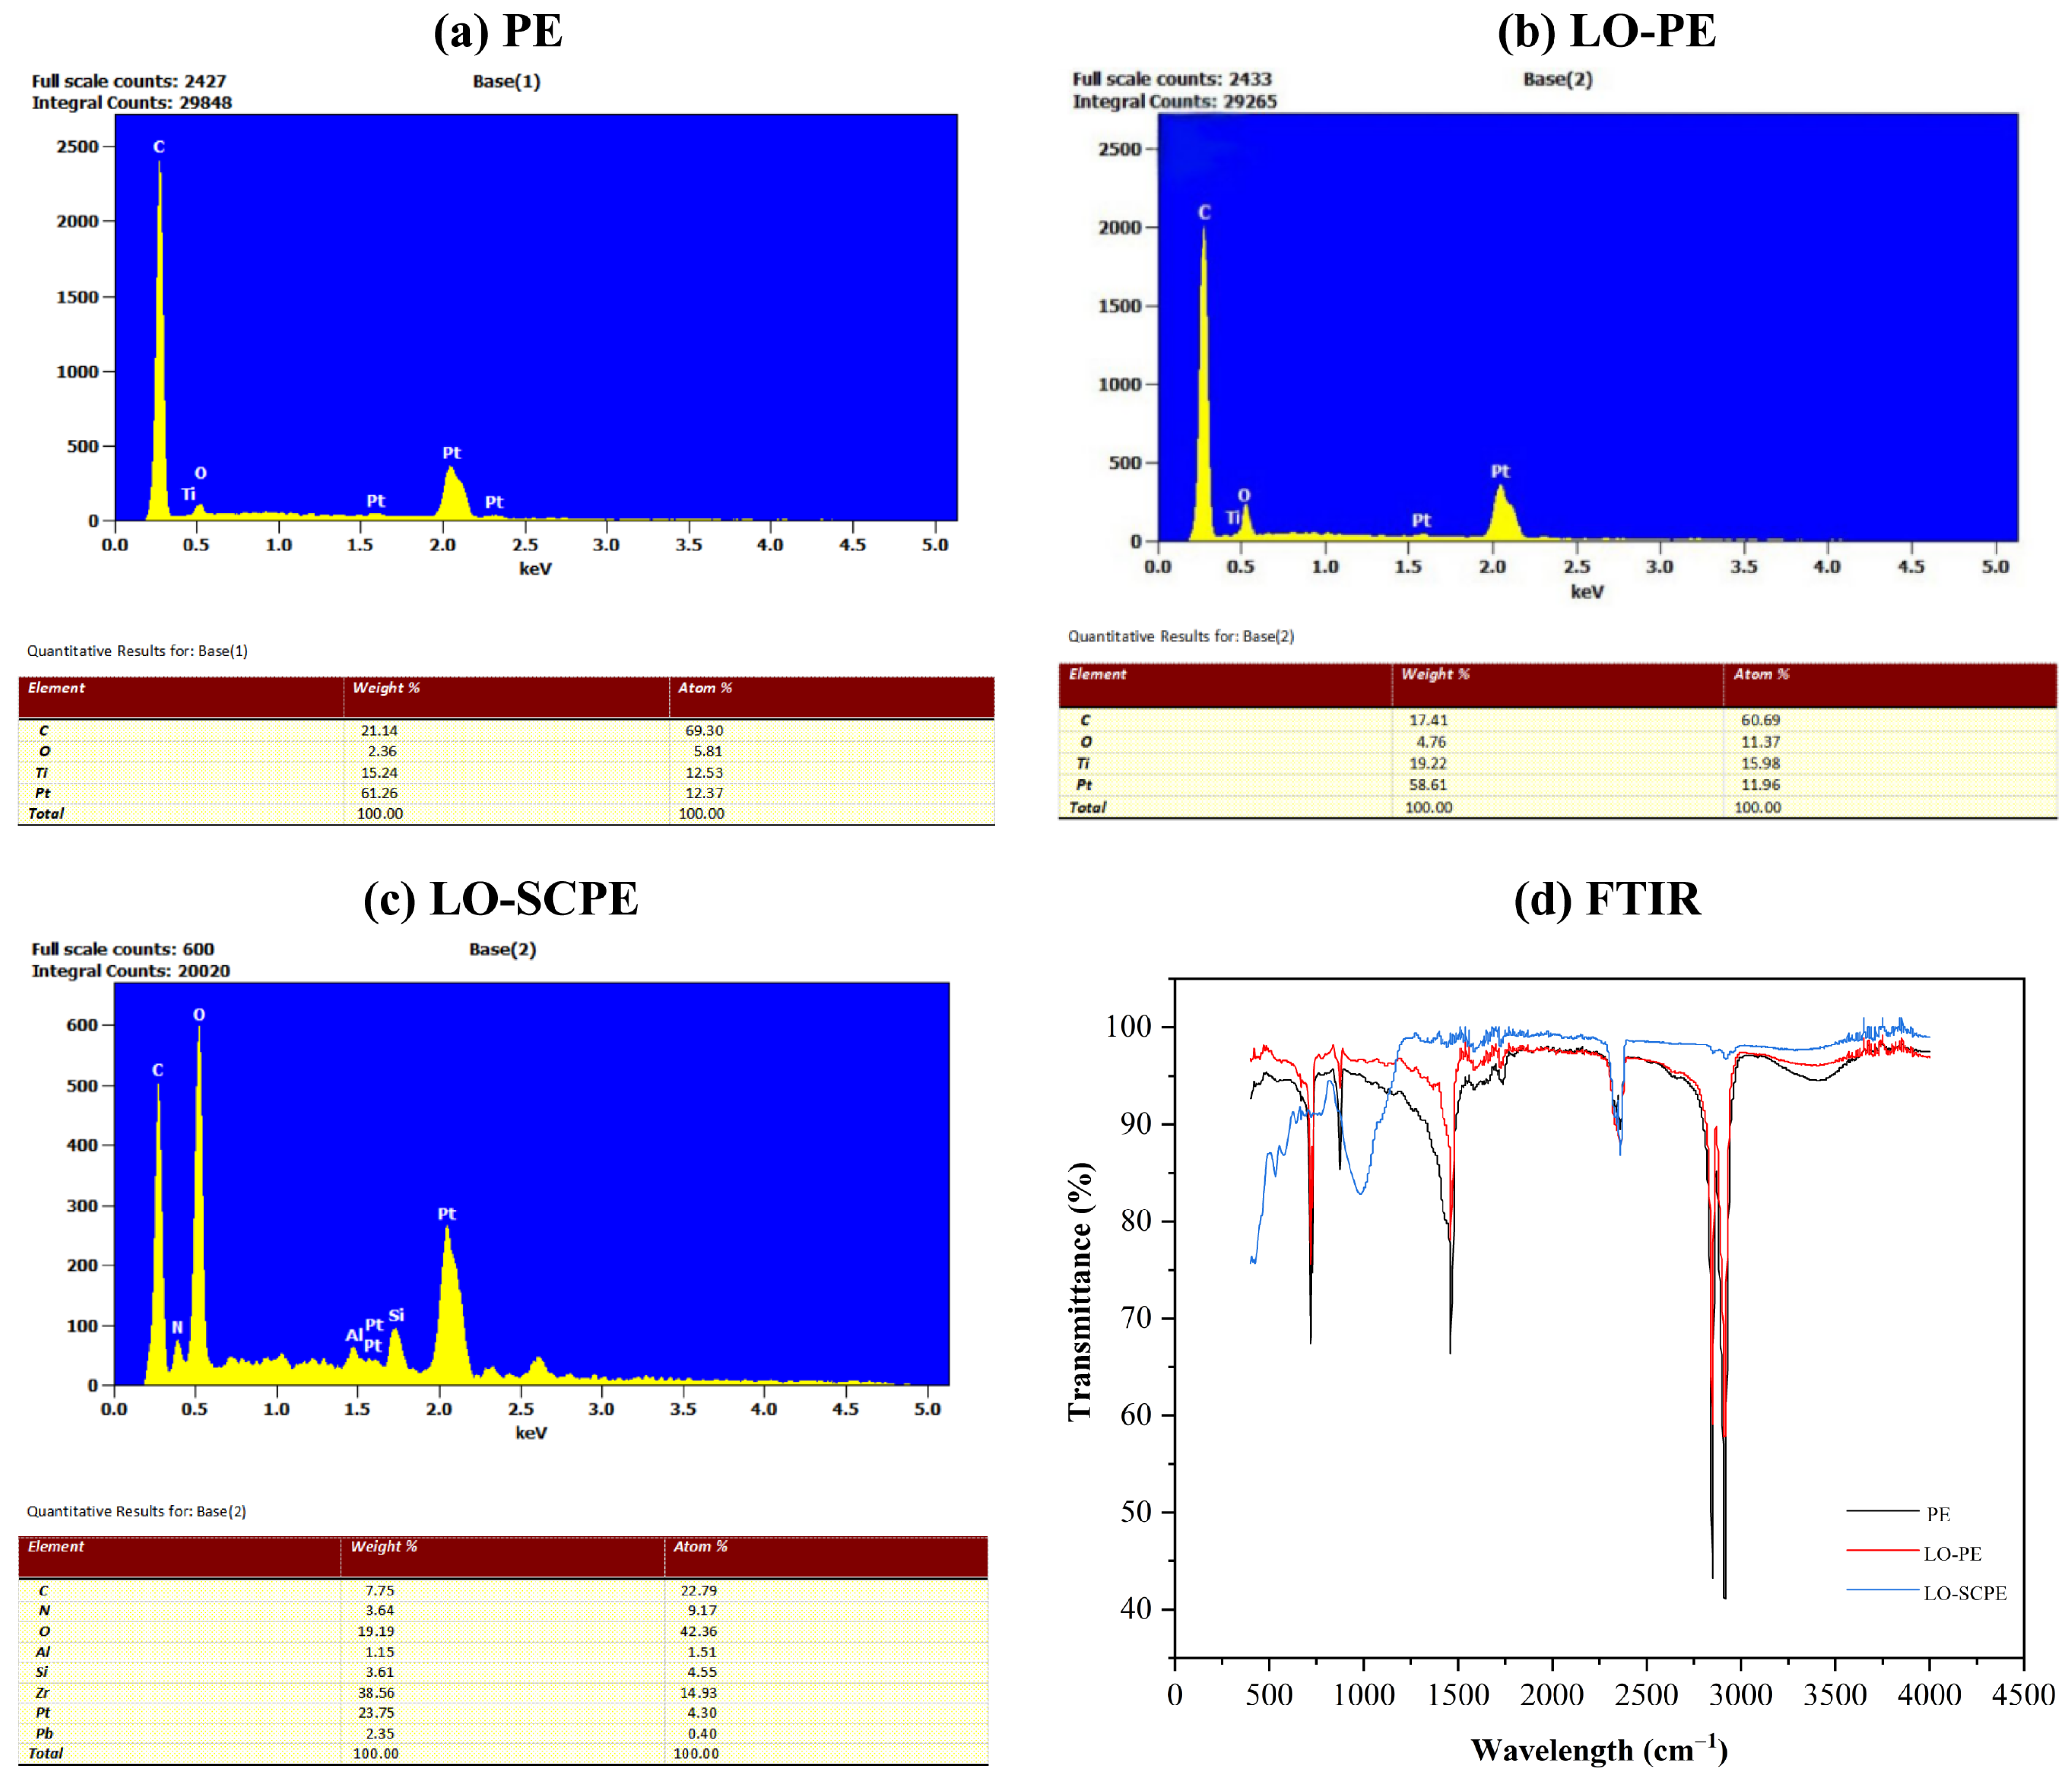
2.7.3. X-Ray Energy Dispersive Spectroscopy (EDS) Test

Energy dispersive spectroscopy (EDS) analysis was performed on the elemental composition of PE, LO-PE, and LO-SCPE samples using SEM-JSM-7610F Plus (Nihon Electric Co., Ltd., Osaka, Japan). This test aimed to detect the potential changes in the elemental composition on the different filler surfaces after liquid-phase oxidation modification and maifanstone surface coating powder.

2.7.4. Fourier Transform Infrared Spectroscopy (FTIR) Test

For the FTIR analysis, smooth samples of PE, LO-PE, and LO-SCPE were cleaned thoroughly and dried for 2 h. After they dried, the samples were cut into appropriate sizes for testing. The conditions were included as the following: The infrared light frequency range was set from 4000 to 400 cm−1. The sample was scanned 32 times and analyzed by a Fourier transform infrared spectrometer.

3. Results and Discussion

3.1. Characterization of Modified MBBR Filler

3.1.1. Effect of Liquid-Phase Oxidation Modification on Static Contact Angle

For the optimization of liquid-phase oxidation modification, orthogonal experimental results can be found in Supporting Information (Table S3). The range of the three influencing factors was analyzed to determine their effect on the contact angle of the filler surface. Subsequently, the measurement results of the contact angle at various levels of the three parameters were used to determine the optimal experimental conditions. The specific results and description are shown in Supporting Information (Table S4).
The static contact angle was measured using the sessile drop method. The static contact angle measurements revealed that the static contact angle of the PE surface was 90.8° (Figure 1a). Under the modification conditions of 40 °C, K2Cr2O7: H2SO4: H2O = 1:15:15, and t = 1.5 h, the static contact angle of the LO-PE surface was 74.4° (Figure 1b), which was approximately 18.1% lower than static contact angle of PE. Under the modification conditions of 50 °C, K2Cr2O7: H2SO4: H2O = 1:15:15, and t = 1.5 h, the static contact angle of the LO-PE surface was 59.3° (Figure 1c). The static contact angle was reduced by approximately 34.8% compared to PE. Under the optimal conditions (60 °C, K2Cr2O7: H2SO4: H2O = 1:15:15, and t = 1.5 h), the static contact angle of the LO-PE surface after liquid-phase oxidation was 45.5° (Figure 1d), which was a reduction of 49.8% compared to the static contact angle of PE. This indicates that the hydrophilicity of the polyethylene filler surface was significantly improved after liquid-phase oxidation modification, compared to the unmodified polyethylene filler surface.
Chunmei et al. [20] used a mixture of concentrated sulfuric acid and concentrated nitric acid for the liquid-phase chemical oxidation of ordinary PE, resulting in a reduction in the static contact angle of the modified filler from 102.8° to 75.5°, which is a 26.6% decrease compared to PE. In this study, the contact angle of the LO-PE modified with potassium dichromate and concentrated sulfuric acid was decreased more significantly (from 90.8° to 45.5°) compared to the study above, suggesting a better modification performed in this study, because the new surface modification method is more efficacious/operative which promotes good hydrophilicity and functional groups and enhanced the rough surface area as compared to reference [20].

3.1.2. Effect of Modification on the Filler Surface Morphology

The SEM images of PE, LO-PE, and LO-SCPE surfaces are shown in Figure 1e–g. The PE surface exhibited a smooth and flat morphology, displaying only the intrinsic texture of the filler material. Comparatively, LO-PE samples presented additional oxidized pits alongside the original texture, indicating that the chromium acid solution treatment effectively enhanced surface roughness through liquid-phase oxidation treatment [21]. After liquid-phase oxidation of the unmodified PE and subsequent maifanstone powder coating modification, the surface of LO-SCPE revealed irregular material accumulating on it, which fully covered and agglomerated the maifanstone powder. The biodegradable binder chitosan could be the cause of these asymmetrical protrusions. The result demonstrated that surface modification of polyethylene fillers through liquid-phase oxidation treatment were a viable approach for both increasing specific surface area and enhancing the attachment of microorganisms to the filler surface.

3.1.3. Bacterial Morphology Analysis, Elemental Composition, and Chemical Structure of Filler Surfaces

After successful biofilm formation, SEM was used to observe the bacterial morphology differences on the surfaces of PE, LO-PE, and LO-SCPE. The SEM results at a magnification of 5000× for the three types of fillers are shown in Figure 1h–j. The results showed that the microorganisms on the surfaces of the three types of fillers exhibited a three-dimensional structure, predominantly consisting of cocci, bacilli, and filamentous bacteria. The biofilm structure on the surfaces of PE, LO-PE, and LO-SCPE became increasingly compact with the bacterial density. The LO-SCPE exhibited the most mature biofilm indicating that the surface modification of the filler with liquid-phase oxidation and maifanstone powder coating effectively accelerated bacterial attachment and growth, thereby improving the wastewater treatment efficiency and increasing surface hydrophilicity and functional groups.
The energy dispersive spectroscopy (EDS) analyses of the surfaces of PE, LO-PE, and LO-SCPE are shown in Figure 2a–c which reveals significant compositional changes. The relative contents of carbon (C) and oxygen (O) on the PE surface were 69.30% and 5.81%, respectively, with an O/C ratio of 8.38%. The relative contents of C and O on the LO-PE surface were 60.69% and 11.72%, respectively, with an O/C ratio of 19.31%, which is 10.93% higher than that of PE. Moreover, the relative contents of carbon and oxygen on the LO-SCPE surface were 22.75% and 42.36%, respectively, with an O/C ratio of 186.10%, which is 177.7% higher than that of the unmodified filler. Both modification methods increased the surface oxygen content and O/C ratios. The treatment efficiency of the combined liquid-phase oxidation/maifanstone coating powder (LO-SCPE) showed the most considerable changes (186% O/C increase). Moreover, the elevated O/C ratios confirmed an enhanced surface polarity which suggests the enhancement of the hydrophilicity of the filler surfaces.
The FTIR analyses of the surfaces of PE, LO-PE, and LO-SCPE are shown in Figure 2d. The PE and LO-PE exhibited two strong absorption peaks in the range of 2800–3000 cm−1, corresponding to the asymmetric and symmetric stretching vibrations (C-H) of the CH2 group and an absorption peak between 1400–1500 cm−1 which is characteristic of the CH2 bending vibration (C-H) [22]. The absorption peaks of LO-PE are weaker than those of PE, indicating that, after liquid-phase oxidation modification, the relative content of carbon in C-H bonds on the surface of the polyethylene filler gradually decreases. All three fillers share an absorption peak at 2350 cm−1, which is attributed to the asymmetric stretching vibration of C=O group. The peak intensities followed the order of LO-SCPE > LO-PE > PE. The decreased peak intensities indicated the reduction in C-H bonds suggesting that oxidative cleavage of polyethylene chains during the liquid-phase treatment increased surface oxidation. The LO-SCPE exhibited a broad absorption peak around 1000 cm−1 which enhanced the C=O bonds. Conclusively, both modification methods increased the O/C ratio on the surface of the polyethylene filler, with the LO-SCPE surface containing more functional groups and demonstrating stronger hydrophilicity.

3.2. MBBR Start-Up Comparison of Marine RAS Wastewater Treatment

During the biofilm start-up phase and stable operation period, as shown in Figure 3a–c, due to the low bacterial population in the naturally formed biofilm reactors and the stress induced by salinity, the effluent NH4+-N concentrations in all three reactor groups did not exhibit a significant decline within the first 80 days of MBBR start-up. Only a minor fraction of NH4+-N was removed via aeration stripping, indicating that the development of a functional nitrifying biofilm was prolonged under saline wastewater conditions. During the experiment of day 140, a successful biofilm formation was obtained across all reactor groups; however, a notable difference in the nitrogen transformation performance was observed during the start-up phase among the groups. On the other hand, Zhang et al. [23] achieved biofilm formation in real wastewater within 30 days in a mobile bed biofilm reactor; the removal efficiencies of NH4+-N and TN were 6.24% and 14.90%, respectively, in synthetic wastewater. As shown in Figure 3a, in reactor R1, a decrease in effluent NH4+-N concentration was observed on day 95, and it dropped to 1 mg/L by day 101. The concentration of NO2-N accumulated to over 10 mg/L by day 101 and then began to decrease starting on day 129, reaching around 1 mg/L by day 137. At the same time, the concentration of NO3-N rose above 10 mg/L and remaining relatively stable on day 137. As shown in Figure 3b, in R2, an initial decline of the effluent NH4+-N concentration was observed 4 days earlier than in R1, reaching 1 mg/L, a stable effluent concentration, on day 99. The NO2-N concentration accumulation pattern, until day 97, exceeded 10 mg/L, and was followed by a gradual reduction starting on day 123 and reached 1 mg/L on day 131. Meanwhile, the NO3-N concentration increased to above 10 mg/L on day 131 and remained relatively stable, 6 days earlier than in R1.
As shown in Figure 3c, in R3, the decrease in effluent NH4+-N concentration on day 87 occurred 8 days earlier than in R1 and 4 days earlier than in R2, reaching 1 mg/L on day 91. The NO2-N concentration exceeded 10 mg/L by day 91 and then began to decrease after day 117 with 1 mg/L on day 127. Meanwhile, the NO3-N concentration increased to more than 10 mg/L on day 127 and remained relatively stable, 10 days earlier than in R1 and 4 days earlier than in R2. The average removal rates of NH4+-N during the experimental stable period for PE, LO-PE, and LO-SCPE, by 0–20 (161–180) days, are shown in Figure 3d. The moving bed sequencing batch reactor (MBSBR-R1) and sequencing batch reactor (SBR-R2) exhibited a stable condition with a concentration of 3728 ± 130 mg/L and 3914 ± 100 mg/L, respectively, which are capable of denitrification and nitrification. Additionally, these reactors achieved the 100% removal efficiency of nitrogen species with foam cube carriers [24]. Additionally, the removal of NO3-N from MBBR was 75.2 ± 7.0% which is lower than current study [20].
During the entire start-up period of MBBR, the effluent NH4+-N concentration in the three reactors significantly decreased from 11 mg/L to below 1 mg/L. After the experiment entered the stabilization phase, the average NH4+-N removal efficiency for three different types of fillers, both unmodified and modified, all reached over 90%. This indicated that under suitable operating conditions, such as temperature, DO, pH, etc., the biofilm (including AOBs and NOBs) developed well on the surface of fillers [25,26]. Additionally, Yang et al. [27] recommended that biofilm formation was more likely to group, creating an anoxic and anaerobic stage that promotes higher nitrogen removal achievement with zeolite. And, this fact showed more stable, working operational conditions. The average NH4+-N removal efficiencies for R1, R2, and R3 were 91.7%, 92.8%, and 95.8%, respectively. The removal efficiencies for NH4+-N in R1 and R2 were similar, while R3 showed an approximately 4% improvement over R1. This improvement in R3 may be due to the surface coating of liquid-phase oxidized polyethylene fillers with maifanstone powder, which increased the specific surface area, enhanced hydrophilicity, and improved bioaffinity. As a result, the biofilm on R3 became fully developed, leading to a better NH4+-N removal rate. The R3 improvement claims were similar to Zhang et al. [28], who used modified basalt fiber (MBF) as biofilm carriers for wastewater treatment which was successfully coated with polyacrylamide/epoxy/nano-SiO2. It promoted hydrophilic layers, a rough surface, and bioaffinity intensification, which could expedite the formation of biofilm. Moreover, the MBF sample was strongly enclosed with microorganisms that would attach on the hydrophilic carrier and rough surface area.

3.3. Bacterial Community Analysis

The LO-SCPE sample exhibited the highest α-diversity index. Both the Chao1 and Observed_species index indicated that LO-SCPE had higher values than PE and LO-PE, suggesting that the bacterial richness of LO-SCPE was greater than that of PE and LO-PE. The Shannon index, which is derived from information entropy, indicates that a larger value corresponds to a greater uncertainty in species composition within the sample. The Shannon index shows that LO-SCPE was greater than PE and LO-PE, indicating that the bacterial community on the surface of LO-SCPE has greater uncertainty and higher bacterial diversity. The Simpson index, which represented the evenness of species distribution, shows that LO-SCPE was lower than PE and LO-PE, suggesting that there was more uniform species distribution in LO-SCPE. These findings collectively indicated that the bacterial community abundance in LO-SCPE was richer. This may be because the maifanstone powder coating on the surface of the filler promotes the growth of a variety of bacterial communities.

3.3.1. Phylum-Level Bacterial Community Composition Analysis

The species compositions of the biofilm on the surface of PE, LO-PE, and LO-SCPE at the phylum level are shown in the Figure 4a. The results presented those variations in the species richness of functional microorganisms among the three filler surfaces, while the dominant bacterial communities demonstrated the similarities in all samples. At the phylum level, the bacterial community’s composition of the three types of filler materials was characterized by Proteobacteria, Bacteroidetes, Nitrospirae, Actinobacteria, Planctomycetes, Deinococcus-Thermus, Chloroflexi, and Firmicutes, while phyla with lower abundance were classified and combined into Others. Among these, Proteobacteria revealed the highest abundance across all three filler types, and it is one of the most determined bacterial phyla in both freshwater and marine RAS wastewater [29]. Most AOB (ammonia-oxidizing bacteria) and some NOB (nitrite-oxidizing bacteria) belong to the phylum Proteobacteria. The phylum Bacteroidetes was a type of fermentative bacteria, which is also highly enriched under high aeration intensity compared to other bacterial phyla [30]. It has been reported that the outer surface of Proteobacteria and Bacteroidetes microorganisms are composed of bacterial lipopolysaccharides, which makes these bacteria easily adhere to the surface of biofillers [31]. This structural characteristic enables these bacterial species to exhibit a high stable ammonia nitrogen removal under aerobic conditions [32]. It is also beneficial for the biological degradation of organic matter and nutrients in wastewater treatment under aerobic conditions [33]. Actinobacteria (filamentous bacteria) contributed to the formation of dense fibrous structures and are commonly located in activated sludge and biofilm processes [34]. Actinobacteria has a certain effect on the removal of NH4+-N. Actinobacteria has the capacity to remove nitrogen species from wastewater through heterotrophic nitrification and aerobic denitrification (HN-AD) [35]. Planctomycetes (obligate aerobic bacteria) can be found in seawater, brackish water, and freshwater. The Firmicutes phylum play a role in the stability of the nitrification process, especially under high salinity conditions, as it can produce spores that are resistant to desiccation and other harsh environmental conditions [33]. Chloroflexi were first identified as nitrite-oxidizing bacteria (NOB) by Sorokin et al. [36], indicating their involvement in the second step of nitrification (i.e., NO2-N oxidation). In this study, LO-SCPE exhibited a higher abundance of Nitrospirae compared to PE and LO-PE, as Nitrospirae are included the majority of NOB and these microorganisms are responsible for oxidizing NO2-N to NO3-N. Their abundance was strongly correlated with the nitrification performance of MBBRs. The elevated Nitrospirae abundance in LO-SCPE suggested that the maifanstone-coated filler surface enhanced bioaffinity, facilitating the adhesion and proliferation of these nitrifying microorganisms, thereby improving the nitrification efficiency of R3.
Figure 4b presented the species composition of biofilm on the surfaces of PE, LO-PE, and LO-SCPE which is dominated by Alphaproteobacteria, Gammaproteobacteria, Nitrospira, Rhodothermia, Bacteroidia, Actinomycetes, Phycisphaerae, and Thermoleophilia. Among these, Gammaproteobacteria and Alphaproteobacteria both belong to the phylum Proteobacteria, and due to their high adhesion capabilities, they promoted a large proportion of mature biofilm. Rhodothermia and Bacteroidia are the main bacterial groups in the MBBR treatment of synthetic seawater aquaculture RAS wastewater [37]. Alphaproteobacteria and Nitrospira, as the main nitrifying bacteria, presented higher abundance in LO-SCPE. This finding further confirms that maifanstone-coated filler surfaces have a higher bioaffinity, which is beneficial for the aggregation and growth of nitrifying bacteria.

3.3.2. Genus-Level Bacterial Community Composition Analysis

Figure 4c illustrated the species composition of biofilm on the surfaces of PE, LO-PE, and LO-SCPE at the genus level. From Figure 4c, there are differences in the functional bacterial species richness on the surfaces of the three types of filler surface samples, but the dominant microorganisms in all three groups are similar. The most abundant genera in the genus-level composition of the three filler surface materials include Nitrobacter, Nitrosomonas, Hyphomicrobium, Hoeflea, Nitrospira, Rubrivirga, Aliihoeflea, and SWB02. The Nitrobacter and Nitrosomonas are the most abundant genera on all three filler types. This indicates that all three MBBR systems have a good nitrification performance. Among them, the abundance of Nitrospira in LO-SCPE was higher than in PE and LO-PE. The Nitrospira have a more significant impact on nitrification processes because they would directly oxidize NH4⁺-N to NO3⁻-N (comammox pathway) by passing the two-step nitrification process mediated by AOB and NOB. The relatively short start-up period of biofilm formation in R3 was partly due to the presence of Hyphomicrobium. Rud et al. [38] reported that Hyphomicrobium was abundant in aerobic MBBR biofilms treating commercial-scale RAS wastewater. This organism may play an important role in enhancing the nitrification process and promoting biofilm formation.

3.3.3. Quantitative Analysis of AOBs and NOBs

To quantify the content of nitrifying bacteria in biofilms under different start-up strategies at the molecular level, this study used qPCR to further quantify the functional genes amoA and nxrB of AOB and NOB. Figure 4d presented the copy numbers of amoA and nxrB genes in biofilms of the three different types of fillers after successful nitrification (day 160). The results indicate that the copy numbers of amoA and nxrB on LO-SCPE were higher than those on the other two fillers. In addition, the copy numbers of amoA in all filler samples were much higher than those of nxrB. This could be because NOBs grow much slower than AOBs, and under high salinity stress, NOBs are more affected by salinity, leading to more significant growth differences [39].

3.4. Performance Comparison During MBBR Operation

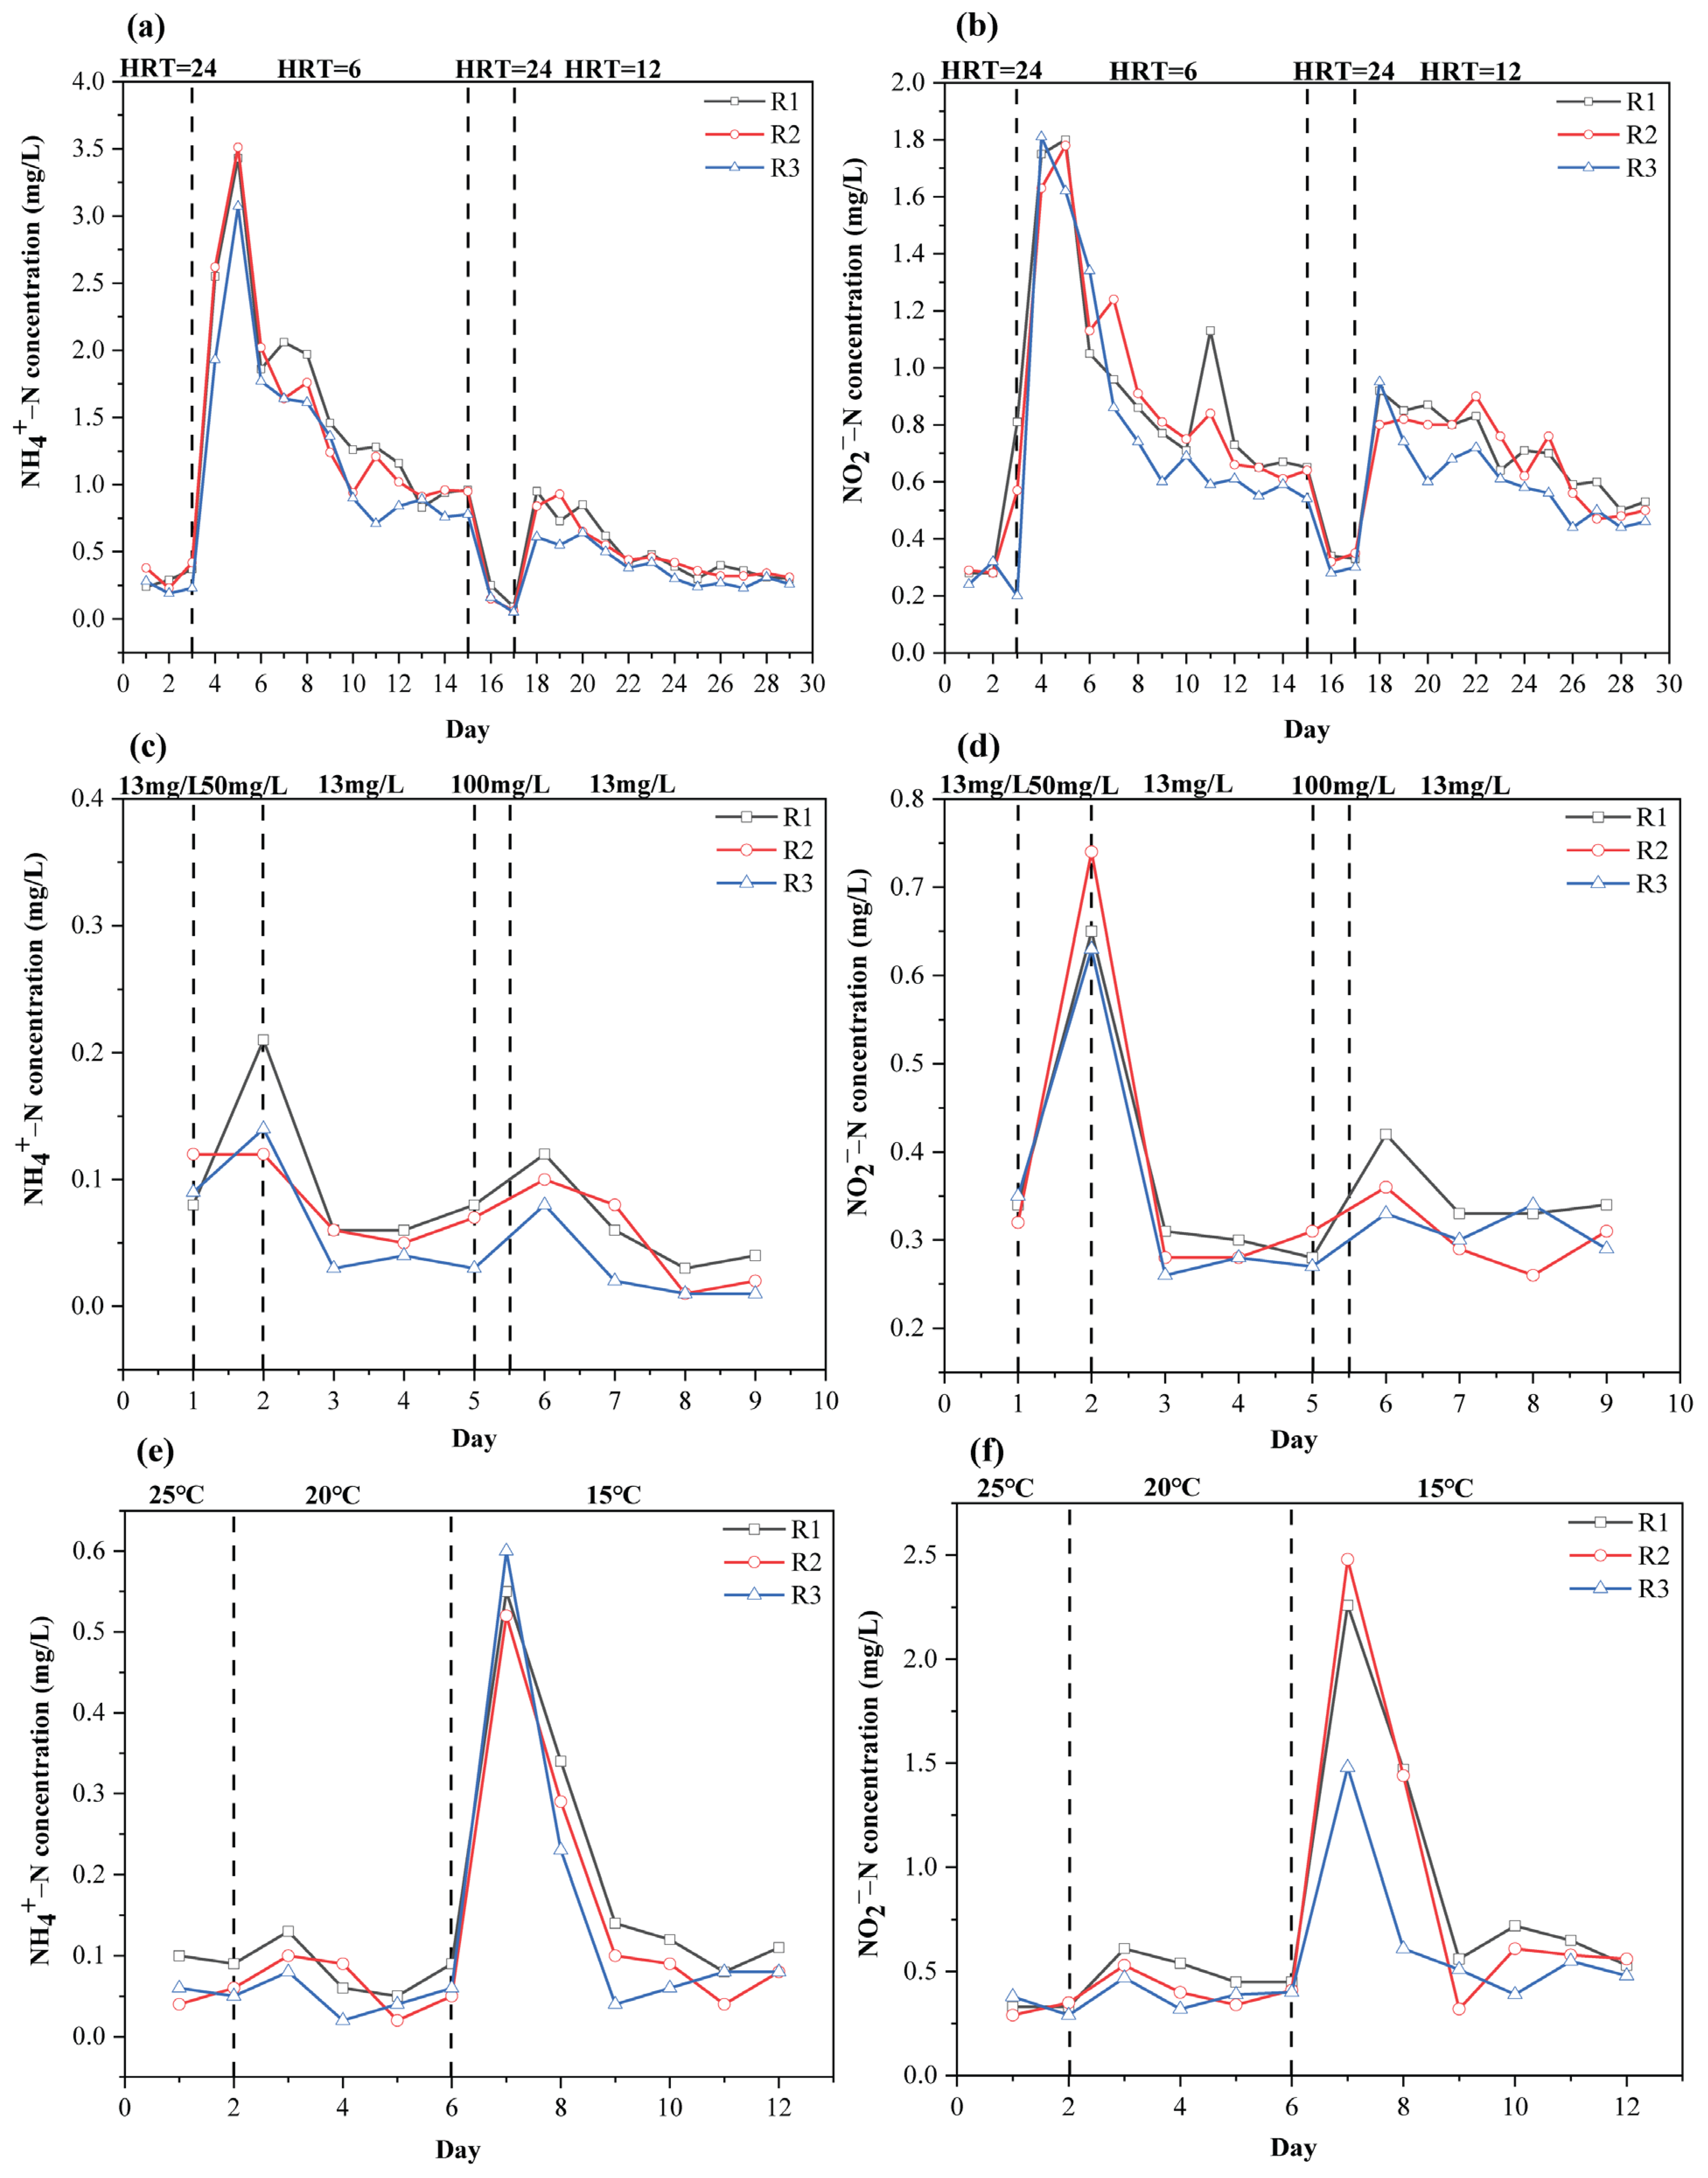
3.4.1. Influence of HRT on MBBR Performance

The three reactors operated continuously for 30 (181–210) days in three different stages. During each experimental phase, the effluent NH4+-N concentrations from all three reactor groups reached a relatively stable state. Throughout the entire test period, the three reactor groups were operated with a constant influent NH4+-N concentration. The NH4+-N removal efficiency of all three reactor groups reached over 97% on days 1–3 (181–183), when the HRT was 24 h. This was higher than the NH4+-N removal rates during the first phase of biofilm stability. This indicates that the biofilms on three types of fillers became increasingly evolved, and the MBBR system already reached a relatively stable operational state (Figure 5a).
The high performance of the MBBR system may be due to the sufficient availability of NH4+-N for ammonia-oxidizing bacteria (AOB). Additionally, prolonged operation and higher HRT can help microorganisms better adapt to nutrient substances and environmental conditions [36,40]. This allows microorganisms to produce more enzymes for the biological degradation of NH4+-N [41]. After the HRT was changed to 6 h, the NH4+-N levels in the effluent from R1 and R2 rapidly increased to 2.5 mg/L on the 4th (184) day, while the level of NH4+-N in the effluent from R3 increased by 2.0 mg/L. Subsequently, the effluent NH4+-N concentrations from all three reactors attained their peak levels. The NH4+-N concentration in the effluent of R1 and R2 continued to increased, reaching approximately 3.5 mg/L, while in R3 the effluent NH4+-N was lower than that of R1 and R2, rising to 3 mg/L. At this point, the NH4+-N removal efficiencies for the three reactors were 73.62%, 73%, and 76.38%. This may be attributed to a significant increase in hydraulic removal stress provided to the bio-carriers. Certain bacterial species are unable to withstand these conditions, leading to the detachment of more biofilm. Subsequently, the effluent NH4+-N concentrations from three reactors began to decreased. The NH4+-N concentrations in the effluent from all three reactors stabilized at 1 mg/L on the 12th (192) day. Over the next 3 days, the average NH4+-N removal efficiencies were 93%, 92.8%, and 93.8%. After the HRT was changed to 24 h on the 15th (195) day, the NH4+-N removal efficiency of the three reactors increased again to greater than 97%. After stabilizing for 3 days under the HRT of 24 h, the HRT was adjusted to 12 h on the 18th (198) day. On the next day, the concentration of NH4+-N in the effluent from R1 and R2 were found to be 1 mg/L, while the removal efficiency of NH4+-N remained at approximately 92%. The effluent NH4+-N from R3 slightly increased, while maintaining an NH4+-N removal efficiency of around 95%. After a 3-day adaptation period, the effluent NH4+-N concentrations from three reactors started to show a decreasing trend and stabilized at 0.3 mg/L. In the last 3 days of experiment, the average NH4+-N removal efficiencies for the three reactors were 97.51%, 97.63%, and 97.95%.
The three reactor groups showed good adaptability after adjusting the HRT. The LO-SCPE demonstrated better ammonia nitrogen removal efficiency and system stability under low HRT conditions, owing to its more biofilm-building capability. In addition, the structure and performance of the biological carrier provided appropriate protection for the attached bacterial community, helping to resist the impacts of collisions caused by the increased influent flow rate [42].
On days 1–3 (181–183), the effluent NO2-N from the three reactors remained at 0.3 mg/L when HRT was 24 h (Figure 5b). When HRT was adjusted to 6 h, a rapid increase in the effluent NO2-N from all three reactors was observed on day 4 (184). The NO2-N concentrations increased to 1.75 mg/L, 1.63 mg/L, and 1.81 mg/L. Among them, R1 and R2 reached their peak values on day 5 (185), at 1.8 mg/L and 1.78 mg/L, respectively, and started to show a tendency to decline from day 6 onwards. R3 showed a declining stage from day 5 (185). The effluent NO2-N concentrations from three reactors reached relative stability on day 13 (193), day 12 (192), and day 11 (191). In R1 and R2, the effluent NO2-N remained around 0.65 mg/L, while in R3, it remained around 0.58 mg/L. After the HRT was adjusted at 24 h, the effluent NO2-N from the three reactors subsequently decreased to around 0.3 mg/L. When the HRT was adjusted to 12 h, the effluent NO2-N from all three reactors began to rise again on day 17 (197). In this case, in R2, effluent NO2-N increased by 0.8 mg/L, whereas R1 and R3 increased to about 0.9 mg/L. However, R1 and R2 had a longer adaptation period at 6 h HRT, gradually showing a tendency to slowly decline only after 3–4 days. By day 27 (207), the effluent NO2-N from all three reactors stabilized at 0.5 mg/L. This indicated that HRT has a significant impact on the accumulation of nitrite nitrogen in the reactors. Lim et al. also conducted an experiment focusing on optimizing the conditions for efficient treatment [24]. In the study of MBBR (moving bed biofilm reactor) systems, the effect of different packing ratios and volumes of polyurethane (PU) foam media on nitrogen removal in low-C/N-ratio wastewater was investigated. The results indicated that, when the influent total nitrogen (TN) was approximately 70 mg/L, the PU media (2 cm × 2 cm × 2 cm) with a 40% packing ratio exhibited the best nitrogen removal performance, achieving a TN removal rate of up to 84% and 90% within 24 h. Conclusively, the reactors were stabilized, and a significant effect was observed on the accumulation of nitrite nitrogen under the HRT conditions.

3.4.2. Impact of Ammonium Shock Load on MBBRs’ Performance

During the initial phase, all three MBBR configurations demonstrated significantly enhanced nitrification performance, which can be attributed to two key factors: (1) the prolonged hydraulic retention time (HRT = 24 h) and (2) bacterial acclimation to the initial NH4+-N concentration (13 mg/L) employed during system stabilization [43]. All three MBBR groups achieved a satisfactory nitrification performance (NH4+-N removal efficiency > 98%). The impact of ammonia nitrogen shock load on the MBBR performance was studied. After being raised to 50 mg/L for 24 h on day 1 (211), the influent NH4+-N concentration was lowered to 13 mg/L. The results showed that the effluent NH4+-N concentration of all three reactors did not change significantly, with R1 and R3 exhibiting a minor increase. The NH4+-N removal efficiency, however, continued to be higher than 96%. Eventually after 3 days, the effluent NH4+-N concentration of three reactors reached the lowest level (<0.1 mg/L), and the NH4+-N removal efficiency achieved 99.53%, 99.61%, and 99.69%. On day 5 (215), the influent NH4+-N concentration was increased to 100 mg/L, which is considered the peak concentration within the ammonia nitrogen tolerance range for most fish species. After 12 h, it was changed again to 13 mg/L. Shore et al. [44] used high-density polyethylene (HDPE) as MBBR media to treat synthetic industrial wastewater with NH4+-N around 19 mg/L. The findings indicated that the effluent NH4+-N concentrations of the three MBBRs stabilized at around 0.1 mg/L and then declined to about 0.05 mg/L after three days. The NH4+-N removal efficiency obtained 99.69%, 99.84%, and 99.92% (Figure 5c).
Previous studies have indicated that, if a biological reactor has been exposed to lower doses of the same pollutant (such as NH4+-N), it can quickly stabilize when exposed to higher pollutant loads (such as NH4+-N) [45]. This study reached the same conclusion as the previous investigation: the three MBBR systems were stable under high-concentration and low-volume ammonium nitrogen shock loads, with NH4+-N removal efficiency exceeding 95%. Additionally, the effectiveness of ammonia nitrogen removal was further increased by the high-concentration, low-volume ammonia nitrogen shock loads, which also promoted the development and reproduction of ammonia-oxidizing bacteria. This also favored the operation of the nitrification process in the MBBR systems.
The influent NH4+-N was increased to 50 mg/L on day 1 (211) and then lowered to 13 mg/L after 24 h in order to examine the impact of ammonium nitrogen shock load on the nitrite oxidation process of three groups of MBBR (Figure 5d). The findings indicated that the NO2-N concentration promptly increased in all three reactors following the elevation of influent NH4+-N levels. The effluent NO2-N rose from 0.35 to 0.65 mg/L in R1 and R3 and from 0.32 to 0.74 mg/L in R2. Subsequently, by the third day, the concentration had been reduced to the initial level, and it was relatively stable for the subsequent two days. The influent NH4+-N was elevated to 100 mg/L for a period of 12 h on day 5 (215). The results demonstrated that the effluent NO2-N in R1 slightly increased but remained at a low level, whereas, in R2 and R3, it remained relatively stable with no significant changes. This indicates that all three reactors did not undergo a prolonged NO2-N accumulation under high-concentration, low-flow ammonium nitrogen shock loads, demonstrating good system stability. The obtained results were inconsistent with the findings of Zhang et al. [46]. The possible reason for this inconsistency could be that the ammonium nitrogen shock load was relatively short, which may have led to a weaker inhibitory effect on Nitrobacter and other nitrite-oxidizing bacteria.

3.4.3. Influence of Temperature on MBBRs’ Performance

High ammonia nitrogen removal (NH4+-N removal efficiency > 99%) was generally achieved during the influence of the temperature experiment. On day 2 (222), the operating temperature was adjusted from 25 ± 1 °C to 20 ± 1 °C. The effluent NH4+-N concentration from all three reactors exhibited a minimum variation, as indicated by the results (Figure 5e). Specifically, the NH4+-N concentrations in the effluent from reactors R1 and R2 were slightly elevated; however, the NH4+-N removal efficiency was 99%, and reactor R3’s effluent NH4+-N concentration was rather stable. Over the next 3 days of operation, all three reactors exhibited a stable and efficient performance. To further investigate the effect of temperature changes on the ammonia oxidation performance of reactors, the temperature was adjusted to 15 ± 1 °C on day 6 (226). Thereafter, by day 7 (227), the effluent NH4+-N concentration from all three reactors rose by 0.5 mg/L, and the NH4+-N removal efficiencies decreased to 95.77%, 96.48%, and 95.38%, for R1, R2, and R3, respectively. Over the next 5 days, the effluent NH4+-N concentration gradually decreased and stabilized at 0.1 mg/L, while the NH4+-N removal rate stabilized at 99%.
The changes in the effluent concentrations of NO2-N and NH4+-N in the three reactor groups showed similar trends. The effluent concentration of NO2-N in all three reactors remained at 0.3 mg/L on days 1–2 (221–222), with a system temperature of 20 ± 1 °C (Figure 5f). This concentration is suitable for the living environment of most fish. On day 2, the temperature was set to 20 ± 1 °C, and by day 3 (223), the NO2-N effluent concentration in R1 rose to 0.61 mg/L, but in R2 and R3 it was 0.5 mg/L. Subsequently for next 3 days, the concentration slightly decreased in all reactors and eventually stabilized at 0.4 mg/L. This indicated that the operating temperature (20 ± 1 °C) has little effect on the activity of nitrifying bacteria. To further investigate the effect of temperature changes on the nitrite oxidation process in the reactors, on day 6 the temperature was set to 15 ± 1 °C. The results showed that, on day 7, the effluent NO2-N concentrations in three reactors increased to 2.26 mg/L, 2.48 mg/L, and 1.48 mg/L, exceeding the tolerance limit of most fish. Over the next 5 days, the effluent NO2-N concentrations in all three reactors gradually decreased and eventually stabilized at 0.5 mg/L.
Therefore, it can be concluded that the nitrite oxidation process in three reactors demonstrated a strong adaptability to temperature reduction. Following a short acclimatization phase, the NO2-N concentrations successfully reverted to a reduced level. The NO2-N concentration in R3 was consistently lower than that in R1 and R2 during the adaptation and stable period. This further suggested that the LO-SCPE media, which were modified by a coating of maifanstone powder and liquid-phase oxidation, have a higher water treatment efficiency. Additionally, the significant temperature reduction inhibited the nitrite oxidation process in all three reactors, increasing the accumulation of NO2-N, which posed a potential threat to the living environment of fish.

4. Conclusions

This study aimed to shorten the start-up period of MBBRs for treating marine aquaculture wastewater to improve the treatment efficiency of MBBR ability to achieve a cost-effective removal of NH4+-N. The polyethylene filler in MBBR was hydrophilically modified to obtain (LO-PE) and (LO-SCPE). During the start-up period, LO-SCPE demonstrated a better ammonia nitrogen removal efficiency (95.8%) compared to PE (91.7%) and LO-PE (92.8%). The qPCR quantitative analysis confirmed that amoA and nxrB genes on the surface of LO-SCPE were higher than PE and LO-PE, indicating a stronger nitrification capacity. Under ammonia nitrogen shock load, all three MBBR systems achieved higher NH4+-N removal efficiencies (>99%) without causing long-term NO2-N accumulation after the adaptation period. EDS revealed the O/C ratio of LO-PE increased by 10.93%, while the O/C ratio of LO-SCPE increased by 177.7%. Further, a higher bacterial diversity was obtained for LO-SCPE through alpha diversity analysis, while more diverse and abundant AOB and NOB were also observed for LO-SCPE. The motivation and contribution for the current study is that innovatively combined maifanstone powder with liquid-phase oxidation surface modification method (LO-SCPE) is effective for marine RAS wastewater treatment efficiency at Lab scale, high removal efficiency of ammonia presented, stable period achieved during the MBBR operation, presented excellent hydrophilicity and good surface area. Therefore, this new carrier material should need to apply for real application as cost effectively.

Supplementary Materials

The following supporting information can be downloaded at https://www.mdpi.com/article/10.3390/w17131888/s1. Section S1: Methodology. Table S1. Chemical composition of simulated aquaculture wastewater. Table S2. Water quality analysis methods. Table S3. Liquid phase oxidation modification L9(33) orthogonal experimental factors and levels. Table S4. Orthogonal experiment results. Figure S1. MBBR experimental system design (Reference [47] is cited in the Supplementary Materials).

Author Contributions

Conceptualization, R.A., T.X. and D.L.; Methodology, R.A., T.X., K.W., Q.L., J.Z., N.J. and D.W.; Formal analysis, R.A. and T.X.; Investigation, R.A., T.X. and K.W.; Resources, D.L.; Writing—original draft, R.A. and T.X.; Writing—review & editing, R.A., K.W., Q.L., J.Z., N.J., D.W. and D.L.; Supervision, J.G. and D.L.; Project administration, J.G.; Funding acquisition, D.L. All authors have read and agreed to the published version of the manuscript.

Funding

The research was financially supported by the Sannong Jiufang Research Project at Zhejiang Province (No. 2025SNJF013) and the National Key R&D Program of China (No. 2024YFD2400100).

Data Availability Statement

The original contributions presented in this study are included in the article/Supplementary Material. Further inquiries can be directed to the corresponding author.

Conflicts of Interest

The authors declare no conflicts of interest.

References

  1. Jiang, Q.; Bhattarai, N.; Pahlow, M.; Xu, Z. Environmental sustainability and footprints of global aquaculture. J. Resour. Conserv. Recycl. 2022, 180, 106183. [Google Scholar] [CrossRef]
  2. Ahmed, N.; Turchini, G.M. Recirculating aquaculture systems (RAS): Environmental solution and climate change adaptation. J. Clean. Prod. 2021, 297, 126604. [Google Scholar] [CrossRef]
  3. Díaz, V.; Ibáñez, R.; Gómez, P.; Urtiaga, A.M.; Ortiz, I. Kinetics of nitrogen compounds in a commercial marine Recirculating Aquaculture System. Aquac. Eng. 2012, 50, 20–27. [Google Scholar] [CrossRef]
  4. Liu, M.J.; Guo, H.Y.; Zhu, K.C.; Liu, B.S.; Liu, B.; Guo, L.; Zhang, N.; Yang, J.W.; Jiang, S.G.; Zhang, D.C. Effects of acute ammonia exposure and recovery on the antioxidant response and expression of genes in the Nrf2-Keap1 signaling pathway in the juvenile golden pompano (Trachinotus ovatus). Aquat. Toxicol. 2021, 240, 105969. [Google Scholar] [CrossRef] [PubMed]
  5. Zhu, S.; Chen, S. An experimental study on nitrification biofilm performances using a series reactor system. Aquac. Eng. 1999, 20, 245–259. [Google Scholar] [CrossRef]
  6. Dutra, F.M.; Ronnau, M.; Sponchiado, D.; Forneck, S.C.; Freire, C.A.; Ballester, E.L.C. Histological alterations in gills of Macrobrachium amazonicum juveniles exposed to ammonia and nitrite. Aquat. Toxicol. 2017, 187, 115–123. [Google Scholar] [CrossRef]
  7. He, H.; Chen, Y.; Li, X.; Cheng, Y.; Yang, C.; Zeng, G. Influence of salinity on microorganisms in activated sludge processes: A review. Int. Biodeterior. Biodegrad. 2017, 119, 520–527. [Google Scholar] [CrossRef]
  8. Lusinier, N.; Seyssiecq, I.; Sambusiti, C.; Jacob, M.; Lesage, N.; Roche, N. A comparative study of conventional activated sludge and fixed bed hybrid biological reactor for oilfield produced water treatment: Influence of hydraulic retention time. Chem. Eng. J. 2021, 420, 127611. [Google Scholar] [CrossRef]
  9. Madan, S.; Madan, R.; Hussain, A. Advancement in biological wastewater treatment using hybrid moving bed biofilm reactor (MBBR): A review. Appl. Water Sci. 2022, 12, 141. [Google Scholar] [CrossRef]
  10. Almeida, J.C.R.; Bega, J.M.M.; Leite, L.D.S.; Oliveira, J.N.D.; Albertin, L.L.; Matsumoto, T. Membrane aerated biofilm reactor in recirculating aquaculture system for effluent treatment. Environ. Technol. 2023, 44, 4071–4083. [Google Scholar] [CrossRef]
  11. Arabgol, R.; Vanrolleghem, P.A.; Delatolla, R. Influence of MBBR carrier geometrical properties and biofilm thickness restraint on biofilm properties, effluent particle size distribution, settling velocity distribution, and settling behaviour. J. Environ. Sci. 2022, 122, 138–149. [Google Scholar] [CrossRef] [PubMed]
  12. Wang, T.; Wu, T.; Wang, H.; Dong, W.; Zhao, Y.; Chu, Z.; Yan, G.; Chang, Y. Comparative study of denitrifying-MBBRs with different polyethylene carriers for advanced nitrogen removal of real reverse osmosis concentrate. Int. J. Environ. Res. Public Health 2020, 17, 2667. [Google Scholar] [CrossRef]
  13. Sen, D.; Copithorn, R.R.; Randall, C.W. Successful evaluation of Ten IFAS and MMBR facilities by applying the unified model to quantify biofilm surface area requirements for nitrification, determine its accuracy in predicting effluent characteristics, and understand the contribution of media towards organics removal and nitrification. In Proceedings of the Water Environment Federation, Dallas, TX, USA, 30 September–4 October 2006; pp. 185–199. [Google Scholar]
  14. Fayzullin, I.; Gorbachev, A.; Volfson, S.; Serikbayev, Y.; Nakyp, A.; Akylbekov, N. Composite material based on polypropylene and modified natural fillers. J. Polym. 2024, 16, 1703. [Google Scholar] [CrossRef]
  15. Mao, Y.; Quan, X.; Zhao, H.; Zhang, Y.; Chen, S.; Liu, T.; Quan, W. Accelerated startup of moving bed biofilm process with novel electrophilic suspended biofilm carriers. Chem. Eng. J. 2017, 315, 364–372. [Google Scholar] [CrossRef]
  16. Hu, J.; Li, F.; Wang, B.; Zhang, H.; Ji, C.; Wang, S.; Zhou, Z. A two-step combination strategy for significantly enhancing the interfacial adhesion of CF/PPS composites: The liquid-phase oxidation followed by grafting of silane coupling agent. Compos. Part B Eng. 2020, 191, 107966. [Google Scholar] [CrossRef]
  17. Duan, L.; Jiang, W.; Song, Y.; Xia, S.; Hermanowicz, S.W. The characteristics of extracellular polymeric substances and soluble microbial products in moving bed biofilm reactor-membrane bioreactor. Bioresour. Technol. 2013, 148, 436–442. [Google Scholar] [CrossRef] [PubMed]
  18. Pervissian, A.; Parker, W.J.; Legge, R.L. Combined MBBR-MF for industrial wastewater treatment. Environ. Prog. Sustain. Energy 2012, 31, 288–295. [Google Scholar] [CrossRef]
  19. Tadda, M.A.; Altaf, R.; Gouda, M.; Rout, P.R.; Shitu, A.; Ye, Z.; Zhu, S.; Liu, D. Impact of Saddle-Chips biocarrier on treating mariculture wastewater by moving bed biofilm reactor (MBBR): Mechanism and kinetic study. J. Environ. Chem. Eng. 2021, 9, 106710. [Google Scholar] [CrossRef]
  20. Chunmei, L.; Haiyan, W.; Youle, W.; Yu, H.Q.; Zirui, C.; Kai, L. Influence of the liquid-phase chemical method modified MBBR carriers on advanced nitrogen removal of urban wastewater treatment plant effluent. J. Environ. Eng. Technol. 2016, 6, 336–342. [Google Scholar]
  21. Rejeb, M.; Koubaa, A.; Elleuch, F.; Godard, F.; Migneault, S.; Bouslimi, B.; Khlif, M.; Mrad, H. Effects of chromic treatment on the surface properties of polypropylene (PP) wood composites. Coatings 2021, 11, 851. [Google Scholar] [CrossRef]
  22. Kowalczuk, D.; Pitucha, M. Application of FTIR method for the assessment of immobilization of active substances in the matrix of biomedical materials. Materials 2019, 12, 2972. [Google Scholar] [CrossRef]
  23. Zhang, Q.; Liang, S.; Tan, S.; Chen, W.; Liu, H.; Yang, C.; Qin, S.; Long, K. MBBR start-up with HN-AD bacteria inoculation: Comparative analysis in simulated and real wastewater for performance, microbial characteristics, and nitrogen removal mechanism. J. Water Process Eng. 2024, 58, 104786. [Google Scholar] [CrossRef]
  24. Lim, J.W.; Seng, C.E.; Lim, P.E.; Ng, S.L.; Sujari, A.N.A. Nitrogen removal in moving bed sequencing batch reactor using polyurethane foam cubes of various sizes as carrier materials. Bioresour. Technol. 2011, 102, 9876–9883. [Google Scholar] [CrossRef]
  25. Bassin, J.P.; Kleerebezem, R.; Rosado, A.S.; Loosdrecht, M.C.M.V.; Dezotti, M. Effect of different operational conditions on biofilm development, nitrification, and nitrifying microbial population in moving-bed biofilm reactors. Environ. Sci. Technol. 2012, 46, 1546–1555. [Google Scholar] [CrossRef] [PubMed]
  26. Pishgar, R.; Dominic, J.A.; Tay, J.H.; Chu, A. Pilot-scale investigation on nutrient removal characteristics of mineral-rich aerobic granular sludge: Identification of uncommon mechanisms. Water Res. 2020, 168, 115151. [Google Scholar] [CrossRef] [PubMed]
  27. Yang, Y.; Zhu, Y.; Gan, D.; Cai, X.; Li, X.; Liu, X.; Xia, S. Enhancing biofilm formation with powder carriers for efficient nitrogen and phosphorus removal. Sci. Total Environ. 2024, 951, 175812. [Google Scholar] [CrossRef]
  28. Zhang, X.; Zhou, X.; Ni, H.; Rong, X.; Zhang, Q.; Xiao, X.; Huan, H.; Liu, J.F.; Wu, Z. Surface modification of basalt fiber with organic/Inorganic composites for biofilm carrier used in wastewater treatment. ACS Sustain. Chem. Eng. 2018, 6, 2596–2602. [Google Scholar] [CrossRef]
  29. Gao, Y.; Wang, X.; Li, J.; Lee, C.T.; Ong, P.Y.; Zhang, Z.; Li, C. Effect of aquaculture salinity on nitrification and microbial community in moving bed bioreactors with immobilized microbial granules. Bioresour. Technol. 2020, 297, 122427. [Google Scholar] [CrossRef]
  30. Ma, J.; Wang, Z.; Yang, Y.; Mei, X.; Wu, Z. Correlating microbial community structure and composition with aeration intensity in submerged membrane bioreactors by 454 high-throughput pyrosequencing. Water Res. 2013, 47, 859–869. [Google Scholar] [CrossRef]
  31. Atabek, A.; Camesano, T.A. Atomic force microscopy study of the effect of lipopolysaccharides and extracellular polymers on adhesion of pseudomonas aeruginosa. J. Bacteriol. 2007, 189, 8503–8509. [Google Scholar] [CrossRef]
  32. Zhao, Y.; Huang, J.; Zhao, H.; Yang, H. Microbial community and N removal of aerobic granular sludge at high COD and N loading rates. Bioresour. Technol. 2013, 143, 439–446. [Google Scholar] [CrossRef] [PubMed]
  33. Zhang, H.; Wang, H.; Jie, M.; Zhang, K.; Qian, Y.; Ma, J. Performance and microbial communities of different biofilm membrane bioreactors with pre-anoxic tanks treating mariculture wastewater. Bioresour. Technol. 2020, 295, 122302. [Google Scholar] [CrossRef] [PubMed]
  34. Kwon, S.D.; Kim, T.S.; Yu, G.H.; Jung, J.H.; Park, H.D. Bacterial community composition and diversity of a full-scale integrated fixed-film activated sludge system as investigated by pyrosequencing. J. Microbiol. Biotechnol. 2010, 20, 1717–1723. [Google Scholar] [PubMed]
  35. He, T.; Zhang, M.; Ding, C.; Wu, Q.; Chen, M.; Mou, S.; Cheng, D.; Duan, S.; Wang, Y. New insight into the nitrogen removal capacity and mechanism of Streptomyces mediolani EM-B2. Bioresour. Technol. 2022, 348, 126819. [Google Scholar] [CrossRef]
  36. Sorokin, D.Y.; Lücker, S.; Vejmelkova, D.; Kostrikina, N.A.; Kleerebezem, R.; Rijpstra, W.I.C.; Damste, J.S.S.; Paslier, D.L.; Muyzer, G.; Wagner, M.; et al. Nitrification expanded: Discovery, physiology and genomics of a nitrite-oxidizing bacterium from the phylum Chloroflexi. ISME J. 2012, 6, 2245–2256. [Google Scholar] [CrossRef]
  37. Li, C.; Liang, J.; Lin, X.; Xu, H.; Tadda, M.A.; Lan, L.; Liu, D. Fast start-up strategies of MBBR for mariculture wastewater treatment. J. Environ. Manag. 2019, 248, 109267. [Google Scholar] [CrossRef]
  38. Rud, I.; Kolarevic, J.; Holan, A.B.; Berget, I.; Calabrese, S.; Terjesen, B.F. Deep-sequencing of the bacterial microbiota in commercial-scale recirculating and semi-closed aquaculture systems for Atlantic salmon post-smolt production. Aquac. Eng. 2017, 78, 50–62. [Google Scholar] [CrossRef]
  39. Angeles, V.D.R.; Pichel, A.; Fernandez-Gonzalez, N.; Pedrouso, A.; Fra-Vazquez, A.; Morales, N.; Mendez, R.; Campos, J.L.; Mosquera-Corral, A. Performance and microbial features of the partial nitritation-anammox process treating fish canning wastewater with variable salt concentrations. J. Environ. Manag. 2018, 208, 112–121. [Google Scholar]
  40. Shitu, A.; Zhu, S.; Qi, W.; Tadda, M.A.; Liu, D.; Ye, Z. Performance of novel sponge biocarrier in MBBR treating recirculating aquaculture systems wastewater: Microbial community and kinetic study. J. Environ. Manag. 2020, 275, 111264. [Google Scholar] [CrossRef]
  41. Sonwani, R.K.; Swain, G.; Giri, B.S.; Singh, R.S.; Rai, B.N. A novel comparative study of modified carriers in moving bed biofilm reactor for the treatment of wastewater: Process optimization and kinetic study. Bioresour. Technol. 2019, 281, 335–342. [Google Scholar] [CrossRef]
  42. Zhang, X.; Song, Z.; Guo, W.; Lu, Y.; Qi, L.; Wen, H.; Ngo, H.H. Behavior of nitrogen removal in an aerobic sponge based moving bed biofilm reactor. Bioresour. Technol. 2017, 245, 1282–1285. [Google Scholar] [CrossRef] [PubMed]
  43. Navada, S.; Vadstein, O.; Gaumet, F.; Tveten, A.K.; Spanu, C.; Mikkelsen, O.; Kolarevic, J. Biofilms remember: Osmotic stress priming as a microbial management strategy for improving salinity acclimation in nitrifying biofilms. Water Res. 2020, 176, 115732. [Google Scholar] [CrossRef]
  44. Shore, J.L.; M’Coy, W.S.; Gunsch, C.K.; Deshusses, M.A. Application of a moving bed biofilm reactor for tertiary ammonia treatment in high temperature industrial wastewater. Bioresour. Technol. 2012, 112, 51–60. [Google Scholar] [CrossRef] [PubMed]
  45. Cabrol, L.; Poly, F.; Malhautier, L.; Pommier, T.; Lerondelle, C.; Verstraete, W.; Lepeuple, A.S.; Fanlo, J.L.; Roux, X.L. Management of microbial communities through transient disturbances enhances the functional resilience of nitrifying gas-biofilters to future disturbances. Environ. Sci. Technol. 2016, 50, 338–348. [Google Scholar] [CrossRef] [PubMed]
  46. Zhang, X.; Li, D.; Liang, Y.; Zeng, H.; He, Y.; Zhang, Y.; Zhang, J. Performance and microbial community of completely autotrophic nitrogen removal over nitrite (CANON) process in two membrane bioreactors (MBR) fed with different substrate levels. Bioresour. Technol. 2014, 152, 185–191. [Google Scholar] [CrossRef]
  47. Rotthauwe, J.H.; Witzel, K.P.; Liesack, W. The ammonia monooxygenase structural gene amoA as a functional marker: Molecular fine-scale analysis of natural ammonia-oxidizing populations. Appl. Environ. Microbiol. 1997, 63, 4704–4712. [Google Scholar] [CrossRef]
Figure 1. (ad) Contact angles of filler surfaces under different modification conditions. The scale bar was 10 µm. (eg) SEM images of different filler surfaces: the scale bar for SEM images was 10 µm. (hj) SEM images of biofilms on different filler surfaces: the scale bar for SEM biofilm images was 10.0 µm, and the magnification for all SEM images was 5000×.
Water 17 01888 g001
Figure 2. (ac) EDS images of different filler surfaces and (d) FTIR spectra of different filler surfaces. The scale bar was 10 µm and was applied to the EDS and FTIR analyses.
Water 17 01888 g002
Figure 3. (a) Changes in effluent water quality during the reactor start-up phase of reactor R1 (PE), (b) changes in effluent water quality during the start-up period of R2 (LO-PE) membrane biofilm formation, (c) changes in effluent water quality during the start-up period of membrane filtration in R3 (LO-SCPE), and (d) ammonium nitrogen (NH4+-N) effluent concentration and removal efficiency during the stable operation period of different MBBR systems from 161 to 180 days.
Water 17 01888 g003
Figure 4. (a) Phylum-level bacterial community composition analysis, (b) class-level bacterial community composition analysis, (c) genus-level bacterial community composition analysis, and (d) relative abundance of amoA and nxrB genes with different fillers.
Water 17 01888 g004
Figure 5. (a) Changes in NH4+-N in MBBR effluent under different HRTs by 181–210 days, (b) variation of effluent NO2-N under different HRT in MBBR under 181–210 days, (c) changes in NH4+-N in MBBR effluent under ammonium nitrogen shock through 211 to 220 days, (d) by day 211 to 220 changes in NO2-N in MBBR effluent under ammonia nitrogen shock load, (e) variation of effluent NH4+-N in MBBR under different temperatures at 221 to 232 days, and (f) variation of NO2-N in MBBR effluent at different temperatures during days 221–232.
Water 17 01888 g005
Table 1. MBBRs’ experimental stages and conditions.
Time Period (Days)StagesAction/FactorsDesigned ValuesOperational Conditions
0–160Reactor start-upR1 (PE), R2 (LO-PE), and R3 (LO-SCPE) HRT = 24 h
161–180Performance comparison during stable operationR1, R2, and R3
181–210MBBRs’ stability performance under HRTVariation of effluent NH4+-N and NO2-N during HRTHRT (h) = 6, 12, 24Temp (°C) = 25, DO (6.5 ± 1 mg/L) and pH (7.5 ± 0.5)
211–220MBBRs’ performance on ammonia nitrogen shock loadingVaried influent NH4+-N concentrations Concentration (mg/L) = 13, 50, 100
221–232MBBRs’ performance at temperature levelEffluent concentration of NH4+-N and NO2-N varied by temperature Temp (°C) = 15, 20, 25DO (6.5 ± 1 mg/L) and pH (7.5 ± 0.5)
Notes: The presented operational conditions were also the same for 0–160, 161–180, and 211–220 days during the experiment.
Table 2. Phylogenetic coverage and diversity index of bacterial communities.
SampleChao1Faith_pdObserved_SpeciesPielou_eShannonSimpson
PE350.2643.609338.70.614734.95620.92563
LO-PE406.3824.75404.70.556334.93830.90270
LO-SCPE498.2930.085480.60.570205.166110.89864
Disclaimer/Publisher’s Note: The statements, opinions and data contained in all publications are solely those of the individual author(s) and contributor(s) and not of MDPI and/or the editor(s). MDPI and/or the editor(s) disclaim responsibility for any injury to people or property resulting from any ideas, methods, instructions or products referred to in the content.

