Abstract
The spatiotemporal heterogeneity of moisture distribution causes the coal pillar dams in underground water reservoirs to undergo long-term dry–wet cycles (DWCs) under varying moisture content increments (MCIs). Accurately measuring the pore damage and fractal dimensions (Df) of coal rock by different MCIs under DWCs is a prerequisite for in-depth disclosure of the strength deterioration mechanism of underground reservoir coal pillar dams. This study employed low-field nuclear magnetic resonance (LF-NMR) to quantitatively characterize the pore structural evolution and fractal dimension with different MCI variations (Δw = 4%, 6%, 8%) after one to five DWCs. The results indicate that increasing MCIs at constant DWC numbers (NDWC) induces significant increases in pore spectrum area, adsorption pore area, and seepage pore area. MRI visualization demonstrates a progressive migration of NMR signals from sample peripheries to internal regions, reflecting enhanced moisture infiltration with higher MCIs. Total porosity increases monotonically with MCIs across all tested cycles. Permeability, T2 cutoff (T2C), and Df of free pores exhibit distinct response patterns. A porosity-based damage model further reveals that the promoting effect of cycle numbers on pore development and expansion outweighs that of MCIs at NDWC = 5. This pore-scale analysis provides essential insights into the strength degradation mechanisms of coal pillar dams under hydro-mechanical coupling conditions.
1. Introduction
Water shortage and high-intensity coal mining have always been the biggest constraints on the green and sustainable development of mining areas in western China [1]. Shendong Mining Area has implemented coal mine underground reservoir technology (CM-UWRT); that is, the goaf is closed by connecting coal pillars with concrete to form a water storage space [2,3]. Coal pillar dams are exposed to a complex water environment for long-term conditions [4]. As shown in Figure 1, the water level in the reservoir changes dynamically due to fissure water recharge and artificial drainage activities, and the moisture content of the coal pillar dam presents a complex non-uniform distribution state, resulting in significant mechanical differences in time-space dimensions of the water-soaked coal pillar [5,6]. However, the macroscopic mechanical damage of coal pillars is inevitably linked to the evolution of microscopic pore structure [7]. Therefore, it is significant to explore the pore damage effect of different moisture content increments (MCIs) under dry–wet cycles (DWCs) for revealing the strength weakening mechanism and seepage characteristics of coal rock with complex water distribution.
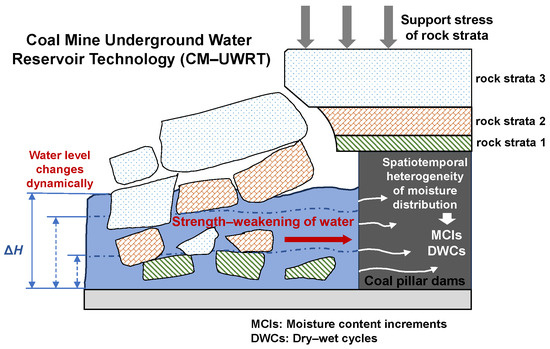
Figure 1.
Schematic diagram of dynamic water erosion of coal pillar dams in coal mine underground water reservoir.
The engineering characteristics of coal pillar dams distinguish them from other rock mass engineering subject to DWCs, such as slopes, tunnels, and reservoir dam foundations [8,9,10]. Firstly, coal mass is prone to rapid water infiltration with its intricate pore and fracture system, which is challenging to expel due to water retention through microporous adsorption. Numerous studies indicate that the saturated moisture content of coal typically exceeds that of coal measure sandstone by approximately 7% to 9% [11,12]. Secondly, being the main load-bearing structure, the coal pillar dam is subject to various mining-induced disturbances. The coupled hydro-mechanical impacts lead to increased complexity in the fractures, stress, and water distribution within the coal mass [13]. Thirdly, the strength weakening effect of coal under DWCs is more pronounced. Following five DWCs, the uniaxial compressive strength (UCS) of coal samples typically decreases by 30% to 50% more than that of sandstone [14,15]. By summarizing the mechanical behavior of various coal or rock types under DWCs, common characteristics in the mechanical damage mechanisms of different coal rock masses can be identified. Under increasing DWCs, the mechanical parameters of the specimens, such as crack stress threshold, elastic modulus, and cohesion, demonstrated an exponential decline. Concurrently, acoustic emission (AE) monitoring detected a rise in high-frequency, low-amplitude microcracks and high-energy events, accompanied by increased energy reflectivity and fractal dimension [16,17,18]. Considerable advancements have been achieved in investigating the degradation of mechanical properties in coal rock masses subjected to DWCs. Nevertheless, prevailing studies commonly define saturated and dry conditions as the extremes of DWCs. Coal pillar dams display intricate water distribution and moisture content characteristics, with their realistic conditions more closely mirroring DWCs shaped by variable MCIs. Existing research has not adequately addressed the distinct impacts of moisture content gradients on the strength-weakening of coal rock masses.
The intrinsic mechanisms of mechanical parameter degradation in engineering rock masses can be understood by examining the distinct mechanical behavior of coal rock specimens using microstructural characterization techniques. These methods commonly include low-field nuclear magnetic resonance (LF-NMR), high-pressure mercury intrusion, scanning electron microscopy (SEM), and X-ray diffraction (XRD) [19,20,21,22,23]. LF-NMR has emerged as a fundamental method for analyzing pore structures in porous materials like coal rock due to its rapid, lossless, and high-precision capabilities [24]. Recently, LF-NMR has seen significant advancements in geotechnical and mining engineering, particularly in quantitatively characterizing pore structures, fractal patterns, and predicting seepage behaviors [25,26,27,28]. The transverse relaxation time T2 serves as a crucial parameter for accurately assessing NMR pore structures. By transforming relationships, various structural characteristics such as pore size distribution, porosity, and pore connectivity can be determined [29]. Zheng et al. conducted the inaugural measurement of the surface relaxation rate of coal bodies, laying the groundwork for establishing coal sample pore size distributions and field logging applications [30]. Yu et al. elucidated the dynamic evolution mechanism of coal rock pore structure from the perspective of pore compression and effective stress [31]. Furthermore, multi-fractal characteristics are commonly observed in coal rock masses. Applying multi-fractal theory enables the derivation of correlations between pore structure parameters, mineral composition, and fractal dimensions. The findings demonstrate that pore structure complexity and heterogeneity increase with rising pore ratio and pore size [32,33]. Additionally, nuclear magnetic resonance (NMR) pore parameters can be utilized to accurately predict coal permeability, with the Schlumberger–Doll Research (SDR) model being the most widely recognized. However, as research subjects and conditions diversify, the predictive accuracy of existing models has progressively declined. To address this limitation, scholars have proposed alternative models, such as the Warren–Root and FCP models, which improve permeability predictions for ultrasonically fractured coal bodies and deep coal reservoirs [34,35]. Previous research has advanced the understanding of coal and gas prevention, freeze–thaw damage, coal pyrolysis, and fracturing. However, the evolution of pore structure in coal pillar dams within complex water-bearing environments remains unclear. Precise measurement of DWCs under varying MCIs is crucial for understanding pore damage and fractal characteristics of coal. This investigation is essential for elucidating the strength degradation mechanisms of coal pillar dams in complex aqueous environments.
In summary, the current DWC studies mainly focus on the number of DWCs and seldom consider the MCI effect. Accurate measurement of DWCs under different MCIs is essential for analyzing the pore damage and strength-weakening mechanism of coal pillar dams under complex water conditions. The study investigated the pore structure and fractal characteristics of three samples with varying MCIs following 1–5 DWCs using NMR and self-developed rock non-destructive water-soaking equipment. The research procedures and ideas are shown in Figure 2. The coal rock subjected to DWCs was meticulously assessed and quantitatively characterized through various approaches, including T2 spectrum analysis, magnetic resonance imaging (MRI), pore size distribution (PSD), porosity, permeability, and fractal dimension. The study delved into the variations in pore structure and fractal dimension resulting from changes in MCIs and NDWC. A pore damage model was devised based on porosity, and the study analyzed the progression of pore damage concerning MCI and DWC occurrences. Furthermore, the relationship between pore structure parameters and pore damage mechanisms in coal bodies under varying MCIs and DWCs was explored. This research offers insights into understanding the mechanisms behind the weakening of coal pillar dams at the microscale level.
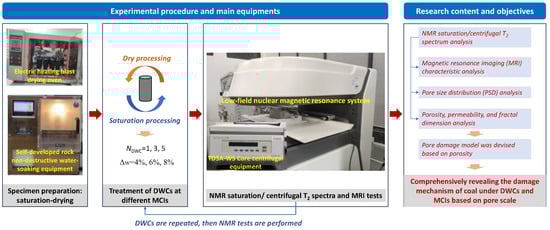
Figure 2.
Schematic diagram of the experimental process.
2. Materials and Methods
2.1. Specimen Selection
The sampling site, as depicted in Figure 3a,b, was situated at Lingxin Coal Mine in Ningxia, China (38.12° N, 106.58° E). The mine area covers approximately 28 km2, with a coal reserve of about 226.48 million metric tonnes. Based on the geological data provided by the mine, the coal seam at the study sampling site exhibits a simple structure. The thickness of the coal seam is about 3.18 m, with a hardness f = 2~2.5 and laminated structure. The coal seams occur in an environment characterized by significant regional variability, and the coal itself is highly heterogeneous. Consequently, the information presented above is specific to the study area and cannot be generalized. The mine was selected as study area because it serves as a typical demonstration site for CM-UWRT. Six storage areas have been developed there, and complex hydrological conditions pose challenges to reservoir safety. Samples were promptly wrapped in cling film on-site and transported to the laboratory for analysis. In accordance with the guidelines of the International Society for Rock Mechanics (ISRM), standard specimens measuring φ50 × 100 mm were extracted from the vertical stratification to ensure the end face’s parallelism within ±0.05 mm and axial deviation within ±0.25° (Figure 3c) [36]. To minimize errors caused by coal sample heterogeneity, wave velocity tests were conducted (Figure 3d). The average wave velocity of the specimens was 1245.44 m/s, with a standard deviation of 15.13, indicating high homogeneity.
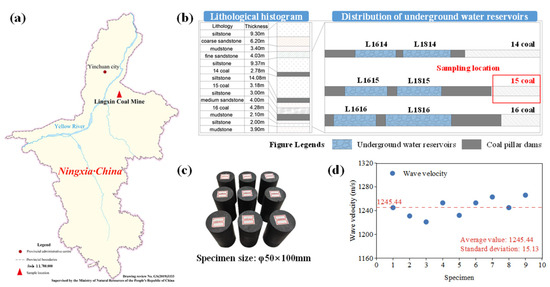
Figure 3.
(a) Samples site. (b) Lithological histogram and relative location of the underground water reservoirs of Lingxin Mine. (c) Specimen cutting and processing. (d) Wave velocity test results.
2.2. Test Equipment and Specimen Pretreatment
The experiment utilized a self-developed rock non-destructive water immersion device to saturate the samples with water, while maintaining a constant temperature of 26 °C in the humidification chamber. The device employs atomized water to achieve non-destructive saturation, effectively preserving the integrity of the samples. A forced-air drying oven was used for drying treatment, with the temperature set at 60 °C to prevent radiation damage to the coal matrix caused by high temperatures [37].
The specimen’s average moisture content was determined using Equation (1) and correlated with water absorption (drying) time, as illustrated in Figure 4. The average saturated moisture content of the specimen was 11.45%. The water absorption and drying curves exhibited contrasting trends; however, both the average moisture content and time conformed to an exponential function relationship [15]. The water absorption process can be segmented into three stages based on the rate of increase in average moisture content: rapid absorption (0–5.1 h), slow absorption (5.1–10.1 h), and saturation (10.1–43.1 h). Similarly, the drying process can be classified into rapid evaporation (0–5.2 h), slow evaporation (5.2–16.2 h), and near-dryness (16.2–26 h). The formula for calculating moisture content is as follows:
where wi, msi, and mdi represent the moisture content, the water absorption mass, and dry mass of the ith specimen, respectively.
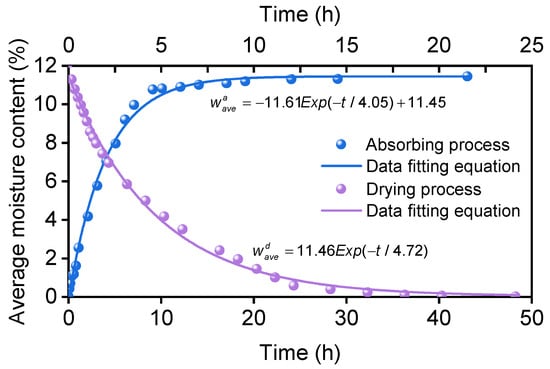
Figure 4.
Average moisture content change characteristics of the specimen during water absorbing and drying processes ( and are the average moisture content of the absorbing and drying processes, respectively).
The spatial and temporal heterogeneity of water distribution within coal pillars is attributed to the dynamic fluctuations in moisture content, which leads to variations in pore structures and deformation characteristics across different locations [6]. To examine the impact of MCIs (Δw) on the evolution of pore structure and the assessment of damage in coal under DWC conditions, the fitted equations for the water absorption and drying processes, as illustrated in Figure 4, demonstrate that the specimens exhibit specific moisture states at various time intervals throughout these processes. Experimental observations and theoretical analyses indicate that extreme drying and saturation treatments induce crack propagation on coal specimen end faces. This damage results from coupled mechanisms of clay mineral dehydration shrinkage and pore water pressure expansion, significantly increasing experimental uncertainty [38]. As evidenced in Figure 4, achieving absolute dryness or complete saturation requires prohibitively long durations (>40 h). Consequently, implementing moisture content boundaries of 2% (lower limit) and 10% (upper limit) during wet–dry cycling achieves dual objectives: mitigating structural anomaly risks and enhancing experimental efficiency. Consequently, three specimens with varying MCIs (Δw = 4%, 6%, and 8%) were prepared. The duration required for the specimens to achieve the designated moisture states is detailed in Table 1. To reduce measurement errors, mass was recorded at one-minute intervals as the specimens approached the target moisture content, ensuring that the moisture content deviation was maintained within 0.5% [39]. Owing to experimental uncertainties, the measured moisture content increments (Δw) deviate from integer values. For systematic data comparison and pattern analysis, these values will be mathematically rounded in subsequent processing.

Table 1.
The mass of the specimen at various time intervals required to achieve a specific level of moisture content.
Figure 5 presents a schematic representation of the variations in DWCs corresponding to different MCIs. Initially, the specimens were placed in a saturated state and subsequently underwent drying treatments for varying durations, as outlined in Table 1. Upon achieving the target moisture content, the specimens were subjected to saturation treatments for differing durations to attain the desired moisture levels, followed by appropriate drying treatments. The culmination of this entire sequence was defined as one complete wet–dry cycle. The repetition of these procedures resulted in specimens that experienced 3 and 5 DWCs, respectively.
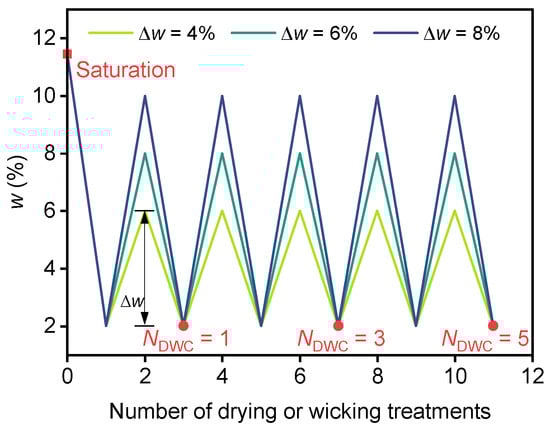
Figure 5.
Schematic representation of the DWC process of specimens subjected to varying MCIs.
The microstructural properties of the samples were examined utilizing a MacroMR12-150H-I low-temperature and high-pressure nuclear magnetic resonance (NMR) experimental system (Suzhou Niumag Analytical Instrument Corporation, Suzhou, China). This system operates within a magnetic field intensity range of 0.3 ± 0.05 T, with a waiting time of 3500 ms, an echo time of 0.16 ms, and a sampling frequency of 200 kHz, while maintaining an operating temperature of 32 °C. The samples were prepared through centrifugation using a TD5A-WS core centrifuge, from which the T2 spectrum data under centrifugal conditions were subsequently obtained. Given the low inherent strength of water-saturated coal rock, the centrifugal speed was calibrated to 500 r/min for a duration of 1 h to preserve the overall integrity of the samples [15].
2.3. NMR Principles and Procedure
Low-frequency nuclear magnetic resonance (LF-NMR) technology offers a swift and non-destructive approach for the quantitative characterization of the intricate pore structures present in various materials. When subjected to a low radiofrequency magnetic field, hydrogen nuclei resonate, allowing for the determination of the transverse relaxation time (T2) through a series of radiofrequency pulse excitations, specifically utilizing the Carr–Purcell–Meiboom–Gill (CPMG) sequence. The T2 relaxation time, along with signal intensity, constitutes essential parameters for the analysis and characterization of pore structures within materials. In coal rock, the pore fluids (H2O) exhibit three distinct relaxation mechanisms, free relaxation, surface relaxation, and diffusion relaxation, which satisfy the following relationship [40]:
where T2B is the free relaxation time, unit ms. T2S is the surface relaxation time, unit ms. T2D is the diffusion relaxation time, unit ms.
The free relaxation time of coal rock materials is smaller than that of surface relaxation time and can be ignored. Diffusion relaxation can be ignored when the magnetic field gradient is small and the echo interval is short. At this time, T2 can be expressed as [41]
where ρ represents the transverse surface relativity. (S/V) pore denotes the specific surface area of pores with different scales in the sample matrix. Rp stands for the pore radius of coal rock, with the unit of μm. Fp is the pore shape factor, where Fp equals 2 for cylindrical pores and 3 for spherical pores. It can be observed that Rp is directly proportional to T2, and a larger T2 value indicates a larger pore size. This forms the basis for characterizing the pore structure of coal rock using the NMR T2 spectrum.
The LF-NMR experiments include specimen pretreatment and LF-NMR testing procedures (Figure 6).
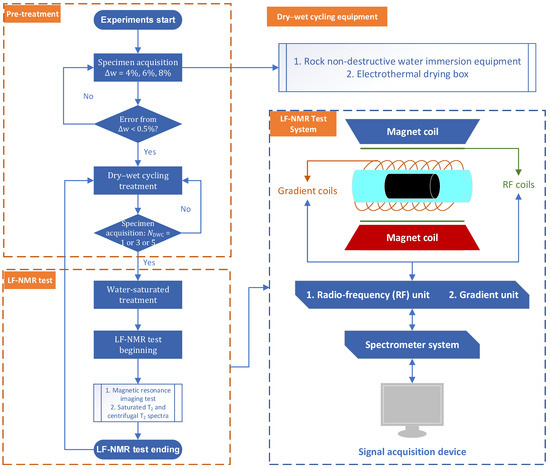
Figure 6.
LF-NMR experimental procedures.
(1) Specimens with different MCIs during DWCs were prepared using non-destructive water immersion equipment and electric heating drying ovens. The saturation and drying durations were determined according to Table 1, with the moisture content error consistently controlled within 0.5% throughout the process.
(2) The specimens were immersed in distilled water and subjected to vacuum saturation treatment, sealed, and maintained at 0.1 MPa for 12 h. This process aims to expel air from the pores and achieve specimen saturation.
(3) After wiping the surface moisture of the test sample, it was placed on the testing platform and MRI and saturated T2 spectrum measurements were perform sequentially. Then the sample was centrifuged to obtain the centrifugal T2 spectrum data. Subsequently, the DWC treatment on the sample was repeated for 3 and 5 cycles, respectively, followed by nuclear magnetic resonance tests.
To analyze the effect of DWCs on the cumulative damage of specimens, the same specimen was repeatedly subjected to DWCs for the same MCIs to ensure the accuracy of experimental results.
2.4. Fractal Dimension Theory
Coal rock is a medium with complex pore structures, and its pore system includes macroscopic fractures formed by coal seam faults and bedding planes, as well as pores formed during sedimentary and metamorphic processes [42]. The NMR pore fractal model is of great significance for accurately characterizing the complexity of internal pore structures in coal rocks. Compared to optical methods and mercury intrusion porosimetry, NMR technology can measure both connected and unconnected pores without damaging the material structure, demonstrating its significant technical advantages.
According to the Hausdorff theory, if an object is divided into several parts of similar size and shape, there exists a mathematical relationship between the scale r of each part and the probability P(r). The Hausdorff dimension D is defined as [43]
The pore system of coal rock is regarded as a collection of spherical pores and capillary pores, with the cumulative porosity percentage Sv defined as [44]
where rmax and rmin are the maximum and minimum of pore radii.
According to the theory of porous media, the capillary pressure is inversely proportional to the pore radius [45].
where Pc represents the capillary pressure in MPa, and σp and θ denote the surface tension and contact angle, respectively.
Combining Equation (5) and Equation (6) yields
The capillary pressure Pc and the relaxation time T2 satisfy the following mathematical relationship [46]:
where Y is a constant coefficient. By substituting Equation (8) into Equation (7), Sv can be expressed as
Taking the natural logarithm of both sides of the above equation yields
where T2max represents the maximum transverse relaxation time, which is 10,000 ms. The parameter of (3-D) is the slope of the straight-line fitting the curve of ln(Sv) versus ln(T2). A larger value of D indicates a more significant difference in the geometry of pore systems in coal [47].
3. Results and Analyses
3.1. T2 Spectral and Magnetic Resonance Imaging Evolution
The T2 relaxation time is commonly used as a criterion for classifying pore types in coal rocks: T2 < 10 ms corresponds to micropores, 10 ms < T2 < 100 ms corresponds to mesopores, and T2 > 100 ms corresponds to macropores. The T2 spectra of samples under saturated and centrifuged states, influenced by different MCIs under DWC conditions, are shown in Figure 7. The saturated and centrifuged T2 spectra of the samples, affected by MCIs and NDWC, primarily exhibit a single peak (micropores), indicating that the quantity and development of micropores in the coal are superior to those of mesopores and macropores. As for the MCIs from the initial 4% to 8%, the T2 spectra generally shift to the right, with negligible changes in the peak height and width of the first peak, showing only a slight increase. However, the peak characteristics of the T2 spectra provide limited insight into the influence of MCIs on pore structure. Therefore, a detailed quantitative analysis of T2 spectral parameters was conducted based on the T2 distribution.
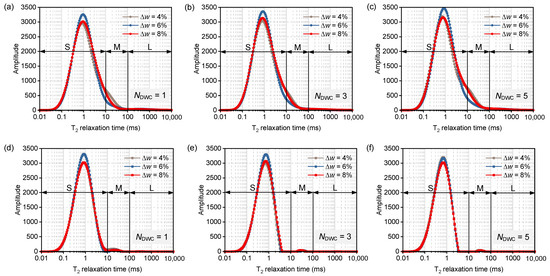
Figure 7.
Saturated and centrifugal T2 spectra of coal rock with different MCIs under DWCs (Symbols S, M, and L are for small, medium, and large holes, respectively). (a–c) represent the saturated state T2 spectra corresponding to the NDWC, and (d–f) represent the centrifugal state T2 spectra corresponding to the NDWC.
The T2 spectrum area is a crucial parameter for quantitatively characterizing the evolution of coal pore structure, obtained by summing the amplitudes within different T2 relaxation time ranges. In the T2 spectrum, the total pore spectrum area (St) is derived from the cumulative amplitudes corresponding to all T2 relaxation times; the adsorption pore area (Sa) is obtained by summing the amplitudes within the T2 < 10 ms range; and the seepage pore area (Ss) is calculated by accumulating the amplitudes in the T2 > 10 ms range, as shown in Table 2 [15]. Based on Table 2, the evolution characteristics of coal pore areas and MCIs under DWCs are illustrated in Figure 8. For comparative analysis, the initial values of various pore spectrum areas are defined as , and the variation rates of pore spectrum areas are denoted as δSk. The variation rates of pore spectrum areas under different MCIs during DWCs can be calculated using the following equation:
where k represents t, a, and s, respectively. denotes the pore spectrum area of the xth group, and represents the pore spectrum areas of the specimen in its initial state.
Table 2.
NMR T2 spectral area for specimens with different MCIs under DWCs.
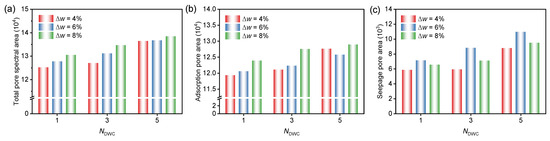
Figure 8.
Histograms of pore area of coal rocks with different MCIs under DWCs: (a) total pore area, (b) adsorption pore area, (c) seepage pore area.
Figure 8 illustrates the variation characteristics of the pore spectrum area under different MCIs during DWCs. The analysis revealed that with a constant number of DWCs, the pore spectrum area, adsorption pore area, and seepage pore area all exhibited varying degrees of increase as the moisture content increased. This phenomenon occurs because higher MCIs lead to greater dissolution of hydrophilic clay minerals in water during each DWC, which intensifies the damage propagation of pores with different diameters within the coal matrix. Consequently, this resulted in a general increase in the pore spectrum area.
Additionally, when NDWC = 5, as the MCIs increased from 4% to 6%, the δSt, δSa, and δSs values were 0.23%, −1.45%, and 24.62%, respectively. Similarly, when the MCIs increased from 4% to 8%, the δSt, δSa, and δSs values increased by 1.26%, 1.04%, and 8.01%, respectively. This indicates that under DWCs, as MCI per cycle increases, the total pore area change rate and seepage pore area change rate of coal rock gradually increase, whereas the adsorption pore area change rate initially decreases and then increases. This phenomenon occurs because a higher MCI represents more water infiltrating the coal matrix during each cycle, leading to an increased dissolution of clay mineral particles. This promotes the formation of micropores within the coal matrix, thereby enhancing the pore spectrum area growth rate. The influence of high MCI cycling on the seepage pore area is more pronounced than that on the adsorption pore area. This is attributed to pore structure transformation under high MCIs; specifically, DWC action with high MCIs facilitates the conversion of adsorption pores into seepage pores in coal. Consequently, the adsorption pore area decreased, whereas the seepage pore area increased.
Magnetic resonance imaging (MRI) reflects the distribution characteristics of internal fluids in coal and can be used to analyze pore distribution and the development of initial damage within the coal matrix. In MRI images, the color depth represents the magnitude of the nuclear magnetic signal or fluid content, with the color scale ranging from blue to red, indicating a gradual increase in fluid content and larger pore volumes. Because the DWC effect on coal pores is a result of cumulative damage, to highlight the final state of pore development, the MRI features after five DWCs under different MCIs are presented (Figure 9). Median filtering was applied to reduce the influence of noise in the MRI images.
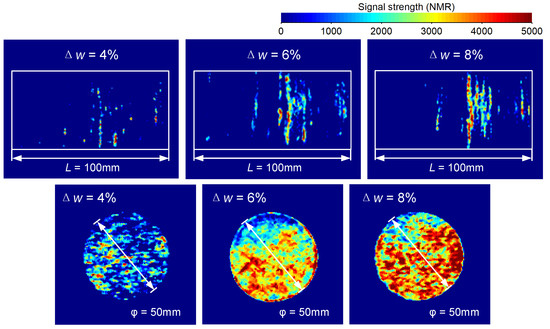
Figure 9.
Magnetic resonance imaging characteristics of coal rocks with different MCIs after five treatments of DWCs (the upper three figures show the results in the horizontal direction, and the lower three figures show the results in the lateral direction).
Horizontal magnetic resonance scanning results indicate that the nuclear magnetic signal intensity of the coal exhibits a banded distribution along the coal bedding plane. As the MCI continues to increase, the color intensity in the central region of the sample gradually deepens, accompanied by an increase in band thickness and enhanced connectivity between adjacent bands. This suggests that a higher MCI promotes the development and expansion of coal pores, while improving pore connectivity and enhancing coal permeability. This phenomenon occurs because the sample was processed from field coal blocks perpendicular to the bedding plane, where the inherent bedding provides natural pathways for water migration and pore development under DWCs. A higher MCI signifies greater water intrusion and loss, thereby increasing the probability of water erosion in deep coal matrices. The DWC process enlarges the pore size and connectivity, facilitating the formation of additional seepage channels.
The lateral magnetic resonance scanning results indicated that as the MCI increases, the distribution of nuclear magnetic signals gradually extended from the sample edges toward the interior. This suggests that during the DWC process, a low MCI primarily affects the surface pores of the coal, whereas with increasing moisture content, water gradually migrates deeper into the coal, thereby enhancing pore expansion in the interior. These findings provide valuable insights into the stability monitoring of coal pillar dams in the field. Given the differential effects of DWCs on various regions of coal, special attention should be paid to the surface of coal pillars under high moisture content conditions to prevent potential failure due to pore expansion or connectivity.
3.2. Pore Size Distribution Measured by NMR
According to the NMR principle, the T2 spectrum reflects the pore size distribution (PSD) of the coal rock. A smaller T2 value indicates a smaller pore size in the coal rock and vice versa [48,49]. Therefore, to accurately characterize the pore size distribution features of coal rock, the study converted the T2 distribution into PSD using Equation (3).
As shown in Equation (3), the key to solving aperture Rp lies in determining ρ and Fp. The ρ values for low-, medium-, and high-rank coals were 15.1, 11.8, and 5.1 nm/ms, respectively. Because the samples used in this study were low-rank coal, ρ was 15.1 nm/ms [50]. The internal pores of coal can be regarded as cylindrical; therefore, the Fp value is 2. Substituting ρ and Fp into Equation (3) yields the aperture T2 corresponding to Fp, thereby providing the abscissa values of the PSD. The ordinate of the PSD represents the porosity corresponding to each aperture, necessitating the conversion of the original T2 spectrum to obtain the PSD. LF-NMR characterizes porosity using either the spectral area method or the peak point method; this study employs the spectral area method for conversion [51]. Calibration experiments indicate that the porosity and the unit volume T2 spectral area exhibit a linear relationship, as follows:
where μ represents the unit volume T2 spectral area; φ denotes porosity. The fitting correlation coefficient R2 between the two parameters is 0.96, meeting the error requirements for LF-NMR calibration.
The T2 spectrum area of the specimen was directly obtained using the LF-NMR system software (V1.0). Because all test samples were standard cylinders (φ50 × 100 mm), the specimen volume was 196.25 cm3. The T2 spectrum area per unit volume for the initial state and specimens with different MCIs under DWCs is listed in Table 3. The relationship between the signal intensity (vertical coordinate) corresponding to each T2 value in the T2 spectrum and the proportion of each pore size (vertical coordinate) in the PSD satisfies Equation (13) as follows:
where φi represents the porosity ratio (%) corresponding to each pore size, φ denotes the total porosity (%) of the sample, γi indicates the signal intensity corresponding to each T2 value, and γ stands for the total signal intensity.
Table 3.
NMR T2 spectral area per unit volume for specimens with different MCIs under DWCs *.
Therefore, based on Equations (3), (12), and (13), the abscissa and ordinate of the T2 spectrum of the samples can be converted into the pore size and the corresponding proportion in the PSD, respectively.
The evolution patterns of the PSD in samples with different MCIs under DWCs are illustrated in Figure 10. As shown in Figure 10a–c, the PSD of the samples exhibits a unimodal characteristic, predominantly concentrated in pores with 10 < Rp < 100 nm, followed by Rp < 10 nm and 100 < Rp < 1000 nm. The proportion of pores with Rp > 1000 nm is negligible. Unlike previous studies in which the pore size distribution was characterized by multiple sets of peaks, the pore sizes of the specimens in this study were mainly concentrated at Rp < 100 nm [25,52]. This indicates that the wet–dry cycling effect of water most significantly promotes the expansion of pores with 10 < Rp < 100 nm in coal, while its influence on pores with Rp > 1000 nm is relatively weak. With increasing MCIs, the proportion of pores with 10 < Rp < 100 nm in the PSD generally increased, as reflected by the enhanced peak intensity and width. Therefore, during the operation of underground reservoirs, special attention should be paid to the expansion and interconnection of small pores within coal pillars owing to their well-developed pore structure, to prevent hydraulic seepage and damage-induced failure.
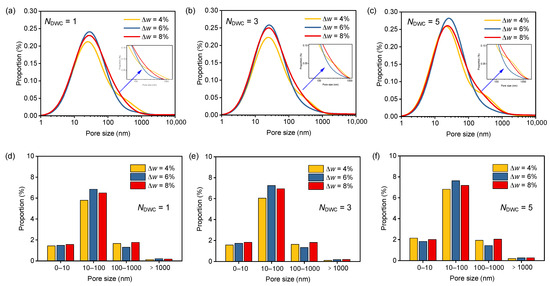
Figure 10.
Pore size distributions of coal rocks with different MCIs under DWCs: (a–c) are the pore size distributions for NDWC = 1, NDWC = 3, and NDWC = 5, respectively; (d–f) are the distributions for a certain range of pore sizes under NDWC = 1, NDWC = 3, and NDWC = 5, respectively.
Figure 10d–f present the specific distribution characteristics for pores of different size ranges. Considering that the DWC effect on coal rock pore structure is a cumulative process, and pores with 10 < Rp < 100 nm are significantly affected by DWCs, the analysis here focuses on NDWC = 5. For NDWC = 5, when the MCI increases from 4% to 8%, the proportion of pores with Rp < 10 nm decreases from 2.13% to 1.99%, while the proportion of pores with 10 < Rp < 100 nm increases from 6.81% to 7.18%. The proportion of pores with 100 < Rp < 1000 nm rises from 1.92% to 2.03%, and that of pores with Rp > 1000 nm increases from 0.18% to 0.25%. These results indicate that under DWC, a higher MCI promotes the expansion and interconnection of pores with Rp < 10 nm, leading to their predominant transformation into pores with 10 < Rp < 100 nm.
3.3. Quantitative Characterization of Pore Structure Parameters
The LF-NMR technique for measuring coal rock porosity offers the advantages of being non-destructive, convenient, and relatively accurate, leading to its extensive research and application in recent years. Based on the quantitative relationship between porosity and unit volume spectral area presented in Section 3.2, as well as the saturation–centrifugation combined measurement method, the evolution patterns of total porosity, effective porosity, and residual porosity can be determined. The porosity under saturated conditions is regarded as the total porosity φt, while the porosity under centrifuged conditions is considered the residual porosity φr. The difference between these two values represents the effective porosity φe. φe reflects the pore space and seepage capacity within the coal matrix, playing a crucial role in evaluating the development of fractures and the strength stability of coal rock masses. φr denotes the porosity associated with irreducible water in the coal body.
Figure 11a illustrates a positive correlation between the total porosity of the specimen and the increase in MCIs across varying NDWC. Specifically, For NDWC = 1, the total porosities corresponding to MCIs of 4%, 6%, and 8% are 8.99%, 9.46%, and 9.97%, respectively. Meanwhile, for NDWC = 5, the total porosities for Δw = 4%, 6%, and 8% are 11.04%, 11.13%, and 11.45%, respectively. Notably, with each 2% rise in Δw, the total porosity increases by 0.09% and 0.32%, respectively. This observation suggests that augmenting the MCIs during DWCs facilitates an overall increase in porosity. This phenomenon stems from the fact that a higher MCI enables enhanced dissolution of clay mineral particles during each DWC, resulting in varying degrees of pore expansion and consequently a rise in total porosity [53].
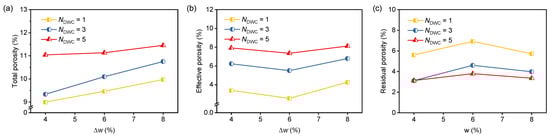
Figure 11.
Evolution of total porosity (a), effective porosity (b), and residual porosity (c) in coal rocks with different MCIs under DWCs.
Figure 11b depicts the correlation between effective porosity and MCIs. Initially, effective porosity decreases as MCI increases, followed by an increase, resulting in an overall upward trend. The inflection point is primarily attributed to water absorption, swelling, and the diffusive adhesion of clay mineral particles, leading to a reduction in pore diameters and subsequently limiting water flow space. Effective porosity is indicative of pore volume and water seepage capacity within the coal matrix. For NDWC values of 1, 3, and 5, effective porosity increases by 0.86%, 0.55%, and 0.19%, respectively, as MCI rises from 4% to 8%. Consequently, elevating MCIs can boost the dissolution efficiency of clay minerals and enhance the effective porosity of coal samples.
As depicted in Figure 11c, residual porosity initially rises and then declines as MCI increases. For NDWC = 5, residual porosity values of specimens are 3.12%, 3.78%, and 3.34% with different MCIs (Δw = 4%, 6%, and 8%), indicating a sequential 0.66% increase followed by a 0.44% decrease. This behavior stems from the dissolution of mineral particles in coal upon water absorption, coupled with intricate swelling and diffusion–adsorption processes akin to those observed in montmorillonite and illite. Subsequent to centrifugation, these particles adhere to partial pores, thereby diminishing residual porosity.
The correlation between porosity and MCIs suggests that elevated moisture content during DWCs contributes to increased porosity. The pores in coal serve as pathways for moisture movement, thereby indicating that alterations in porosity have a direct impact on seepage properties. Permeability, a key parameter delineating fluid flow within the coal structure, signifies the flow capacity and connectivity of water in the coal matrix. Hence, this research delves into the developmental patterns of coal permeability under heightened MCIs during DWCs using NMR T2 spectra.
Several models are commonly used to estimate coal sample permeability from NMR T2 spectra. These models include the Schlumberger–Doll Research (SDR) model, the modified SDR model, the Timur–Coates (T–C) model, the modified T–C model, and the Producible Porosity (PP) model. The Timur–Coates (T–C) model and the Producible Porosity (PP) model demonstrate reduced accuracy in predicting permeability for low-permeability coal samples, with their performance being contingent on the volume of data available [24,54]. Following a thorough evaluation of model performance, the study ultimately selects the modified SDR model for its superior matching capabilities, expressed as
where kSDR′ represents permeability, and and denote the geometric mean of T2 under saturated and centrifugal states, respectively, which is related to the average pore size of the material.
where T2max = 10,000 ms; T2s is the initial relaxation value of the T2 spectrum (ms); Ai is the amplitude corresponding to T2i; AT is the total amplitude of the NMR T2 spectrum; and T2i represents the independent T2 value (ms).
The permeability of coal rock under DWCs with different MCIs was calculated according to Equations (14) and (15), as shown in Table 4.
Table 4.
Permeability of coal rocks with different MCIs under DWCs.
Based on the data presented in Table 4, a relationship between MCIs and permeability during DWCs was established (Figure 12). For NDWC = 1, Δw increased from 4% to 8%, leading to a decrease in permeability from 0.0274 mD to 0.0248 mD, indicating an inverse correlation between permeability and MCIs. This phenomenon can be attributed to the relatively low number of DWCs at this stage, where the higher MCIs facilitated clay mineral swelling around the pores upon water absorption. This swelling resulted in clay minerals adhering to pore surfaces, thereby reducing space for water migration and impeding water seepage capacity. With an increase of the NDWC (NDWC = 3, NDWC = 5), permeability demonstrated a linear increase alongside the rise in MCIs; this shows some similarity to previous studies [15,25,55]. Specifically, as the MCIs escalated from 4% to 8%, the permeability for NDWC = 3 and NDWC = 5 rose by 0.002 mD and 0.0052 mD, respectively. Consequently, a higher MCI can enhance coal permeability under DWC conditions. This enhancement can be attributed to the repetitive DWCs weakening the adhesion of clay mineral particles surrounding coal matrix pores. Consequently, these particles continuously dissolve in water, enlarging pore size and connectivity, thereby improving coal sample permeability.
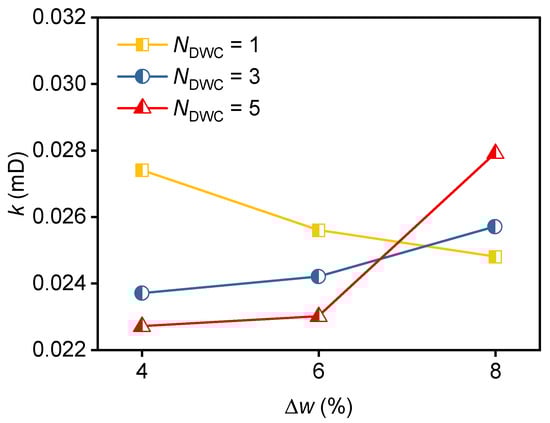
Figure 12.
Correspondence between MCIs and coal rock permeability under DWCs.
Furthermore, the anisotropy inherent in coal’s pore structure and mechanical response profoundly governs its seepage and damage behaviors. Existing studies establish that anisotropic seepage primarily arises from fracture network characteristics, wherein mineral-filling particles dictate fracture surface heterogeneity [56,57]. This microstructural feature drives stress-dependent anisotropic compression and damage evolution within fracture systems [58]. However, coal, as a complex porous media material, has an internally existing pore system that undergoes heterogeneous changes in response to external factors (e.g., stress, temperature, water), which in turn leads to alterations in the fracture system [59]. This interdependence demonstrates that coal’s stress state, pore architecture, fracture system, and seepage behavior exhibit coupled anisotropy through mutual feedback mechanisms. Regarding the permeability (k) statistically derived from NMR T₂ spectra in this study, while effectively characterizing macroscopic flow through connected pore channels, its capacity to resolve directional permeability anisotropy remains constrained. Future studies could investigate the influence of coal’s microporous structure on anisotropic seepage using fluid infiltration experiments, digital rock reconstruction, and pore-scale hydrodynamic simulations.
3.4. T2 Cutoff Value and Fractal Dimension Features
The T2 cutoff value (T2C) is a crucial parameter that differentiates between movable fluids and bound fluids, serving as an indirect indicator of pore connectivity within the material. A lower T2C signifies a greater movable space and enhanced pore connectivity in coal, whereas a higher T2C indicates reduced pore connectivity. By comparing the positions of T2C and T2, the segment where T2 < T2C is categorized as bound water, while the rest is identified as free water.
The determination methods of T2C include the centrifugal method, T2 spectrum form method, and T2GM method. The centrifugal method is currently recognized as the standard approach for determining T2C in reservoir rocks. The T2 spectrum form method exhibits high applicability only for sandstones with typical bimodal T2 distributions but has limited effectiveness for coal with complex pore structures. The T2GM method is unsuitable for measuring T2C in coal, as it tends to amplify T2GM, leading to inaccurate results [15,30]. Therefore, the study employed the centrifugal method to measure the T2C of coal rock after DWCs. The determination of T2C via the centrifugal method is illustrated in Figure 12. First, the T2 distributions under saturated and centrifuged states were converted into cumulative porosity curves. A horizontal tangent was drawn from the maximum point of the cumulative porosity curve under the centrifuged state toward the vertical axis. The intersection of this tangent with the saturated cumulative porosity curve was identified, and a perpendicular line was dropped from this intersection to the horizontal axis. The foot of this perpendicular represents the T2C.
Based on the T2C obtained from Figure 13, the evolution characteristics of T2C in coal rock under different MCIs during DWCs were plotted (Figure 14). It can be clearly observed that as the NDWC increases, the T2C under varying MCIs exhibits similar trends, showing a gradual decrease with increasing cycle numbers. This indicates that DWCs significantly promote the expansion of mobile spaces within the coal matrix, thereby enhancing the connectivity of internal pores. Furthermore, with NDWC = 1, an increase in MCIs from 4% to 8% resulted in a decrease in T2C from 1.438 to 1.237. This decrease is linked to a reduction in the frequency of DWCs, with the MCIs notably impacting the dissolution efficiency of clay minerals in the coal matrix. Consequently, there was a gradual rise in effective pore volume, facilitating the interconnection of pores of varying sizes.
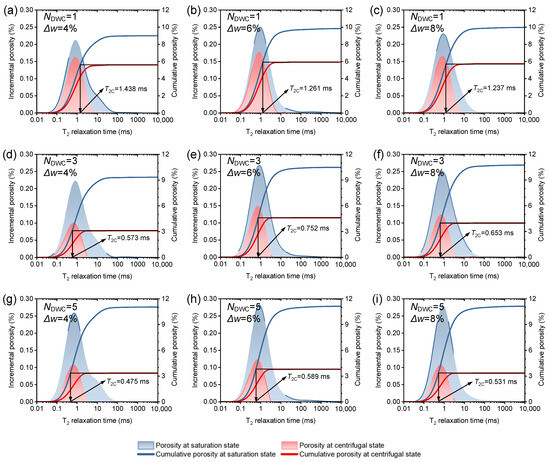
Figure 13.
Saturated/centrifugal state T2 spectra and T2C from the NMR relaxation of coal rocks with different MCIs under DWCs: (a) NDWC = 1, Δw = 4%; (b) NDWC = 1, Δw = 6%; (c) NDWC = 1, Δw = 8%; (d) NDWC = 3, Δw = 4%; (e) NDWC = 3, Δw = 6%; (f) NDWC = 3, Δw = 8%; (g) NDWC = 5, Δw = 4%; (h) NDWC = 5, Δw = 6%; (i) NDWC = 5, Δw = 8%.
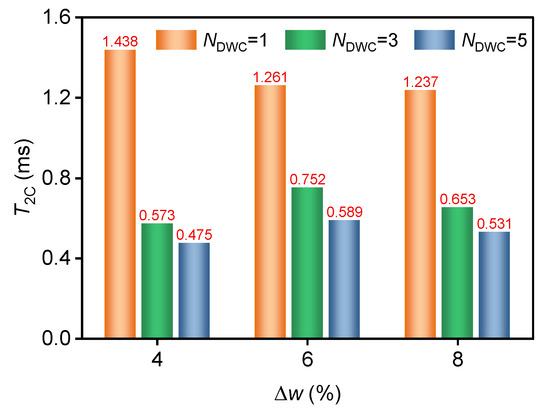
Figure 14.
T2C evolutionary characteristics of coal rocks with different MCIs under DWCs.
When NDWC =3 and NDWC =5, the MCI increases, while T2C initially rises and then declines, with minimal overall variation. Consequently, as the NDWC continues to increase, the effect of MCIs on the T2C of coal rock is relatively weak, and the NDWC exerts a more significant influence on the pore connectivity of coal than the MCIs. The internal pore connectivity of coal gradually stabilizes under multiple DWCs, leading to an overall insignificant change in T2C under the MCIs at this stage.
Based on T2C, the internal pore structure of coal rock subjected to DWCs can be classified into bound pores (T2 < T2C) and free pores (T2 > T2C). Under the DWCs, both the MCIs and the NDWC induce varying degrees of mineral particle expansion, adhesion, and dissolution reactions within the coal matrix, leading to differences in the fractal dimension of the pore structure. Equation (10) presents the NMR pore fractal theoretical model, and the bilogarithmic relationship between Sv and T2 is illustrated in Figure 15. Accordingly, the pore fractal dimensions of coal rock under the DWCs at different MCIs were fitted separately for bound pores and free pores.
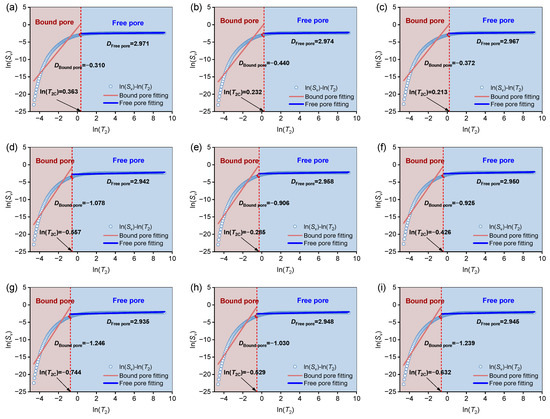
Figure 15.
Logarithmic fitting of Sv and T2 for coal rocks with different MCIs under the DWCs: (a) NDWC = 1, Δw = 4%; (b) NDWC = 1, Δw = 6%; (c) NDWC = 1, Δw = 8%; (d) NDWC = 3, Δw = 4%; (e) NDWC = 3, Δw = 6%; (f) NDWC = 3, Δw = 8%; (g) NDWC = 5, Δw = 4%; (h) NDWC = 5, Δw = 6%; (i) NDWC = 5, Δw = 8%.
Based on the multifractal characteristics of coal rock, the effective pore fractal dimension ranges from 2 to 3 [60]. Fitting data indicates that bound pores do not exhibit significant fractal characteristics, whereas the fractal dimension of free pores is predominantly distributed between 2.9 and 3, with high data fitting accuracy, consistent with numerous studies [61,62]. Therefore, this study focuses on investigating the evolution characteristics of free pore fractal dimension in coal rock under the influence of MCIs during DWCs.
Figure 16 illustrates the evolution of the fractal dimension of free pores in coal rock under the influence of DWCs and MCIs. For different MCIs, increasing the NDWC significantly reduces the fractal dimension of free pores. This occurs because repeated DWCs causes the T2C to continuously shift leftward and decrease, while the slope of the fitted line between ln(Sv) and ln(T2) progressively increases, thereby leading to a continuous reduction in the fractal dimension of free pores. When NDWC = 1, comparing MCIs from 4% to 8%, the fractal dimension of free pores decreases. This indicates that the mineral particles within the coal rock undergo expansion and dissolution upon water absorption, reducing the geometric heterogeneity of free pores and smoothing the pore surface. As the NDWC gradually increases to 3 and 5, the relationship between the fractal dimension of free pores and MCIs initially increases and then decreases, ultimately showing that higher MCIs correspond to higher fractal dimensions. This suggests that the geometric heterogeneity of free pores gradually increases under multiple DWCs, and higher MCIs moderately enhance the complexity of pore structures within the coal rock.
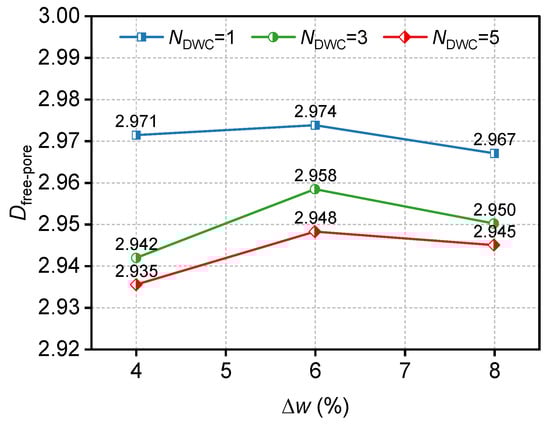
Figure 16.
Dfree-pore–Δw variation tendency of free pore.
3.5. Pore Damage of Dry–Wet Cycling
During the DWCs with varying MCIs, complex changes such as particle dissolution, pore expansion and interconnection, and water absorption-induced swelling of clay particles occur within coal due to coal–water interactions. Since coal pillar dams are exposed to complex aqueous environments, the damage and deterioration of coal pore structures constitute a critical factor that cannot be overlooked in underground reservoir engineering. To quantitatively analyze the extent of pore damage in coal, the damage to coal pore structure caused by DWCs is defined as the pore damage variable (Dp). Based on the porosity of specimens measured by NMR, this study investigates the evolution characteristics of pore damage in coal under the influence of MCIs and NDWC.
The total volume of the specimens can be considered as consisting of internal pores and solid particles, with the effective loading area borne by the solid particles. Therefore, the pore damage variable Dp is defined as
where Dp is the pore damage variable, V′ is the volume of solid particles in the specimen after different MCIs under DWCs, and V0 is the initial particle volume of the specimens. During the DWC process, the total volume of the specimens undergoes only minor changes; thus, it is assumed that the total volume V0 remains constant throughout the DWCs. The volume of solid particles in the specimens can be expressed as
where is the porosity of the specimens after DWC treatment, and is the porosity of the specimens in the initial state.
Combining Equation (16) and Equation (17), the expression for the pore damage variable of the specimens after DWCs treatment is obtained as
According to Equation (18), the evolution of pore damage variables in specimens under different MCIs during DWCs was calculated (Figure 17). The analysis indicates that both NDWC and MCIs can increase the degree of pore damage in coal rock. However, different NDWC exhibit distinct evolutionary patterns between pore damage degree and MCIs. When NDWC = 1 and NDWC = 3, the pore damage variable follows an exponential trend with increasing MCIs. A higher MCI leads to a greater rate of pore damage variation, with the development of pore damage primarily controlled by NDWC and MCIs. This suggests that when the NDWC is low, a high MCI can accelerate pore damage in coal. This occurs because a higher MCI increases the dissolution of soluble mineral particles upon water exposure, thereby promoting faster development in both the number and size of pores.
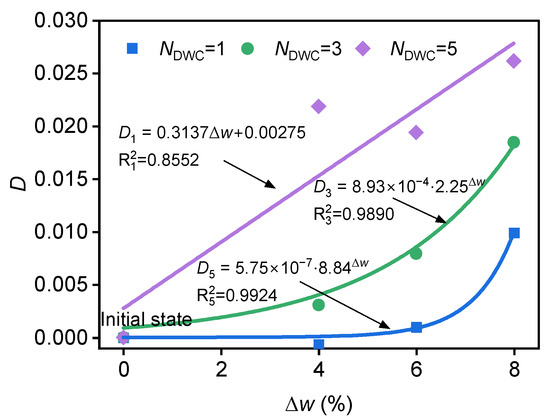
Figure 17.
Pore damage evolution law of coal rock with different MCIs under DWCs.
When NDWC = 5, the pore damage variable and MCIs approximately exhibit a linear relationship. As NDWC increases, the influence of MCIs on the rate of pore damage variation gradually diminishes. In other words, compared to the MCIs, the NDWC plays a more significant role in promoting pore development and expansion. This indicates that both the NDWC and MCIs can enhance the degree of pore damage in coal. This phenomenon results from complex processes such as dissolution, expansion, and migration of mineral particles within the coal during DWCs. Moreover, the NDWC gradually becomes the dominant factor in increasing the dissolution of soluble mineral particles in coal.
4. Discussion
4.1. Correlative Analysis of Porosity and Pore Structure
The interaction of MCIs and DWCs affects the NMR pore spectrum area, T2C, and fractal dimension of coal samples, collectively influencing porosity evolution. To further analyze the evolution characteristics of coal porosity under DWCs, this section aims to investigate the relationships among NMR pore spectrum area, T2C, fractal dimension, and porosity under the influence of MCIs and DWCs to analyze the evolution of coal porosity.
Figure 18a,b depict the interrelationships among NMR adsorption pore area, seepage pore area, and porosity across all specimens subjected to DWC conditions. The analysis demonstrates a direct linear correlation (, ) between specimen porosity and both adsorption and seepage pore areas, suggesting a proportional increase in porosity with the enlargement of these pore areas. This observation indicates that throughout DWC, there is a rise in the proportion of adsorption and seepage pores in coal, thereby facilitating the expansion and transformation of the overall pore structure.
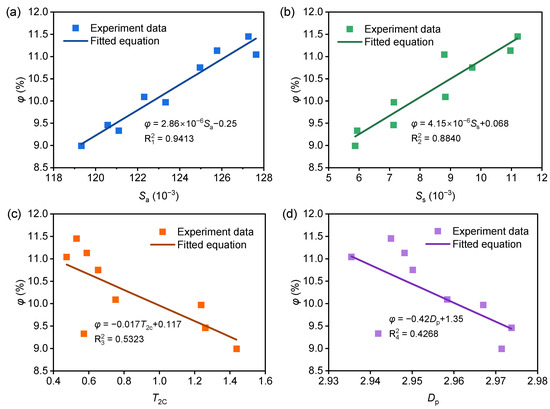
Figure 18.
Correlation between pore structure and coal rock porosity: (a) φ-Sa, (b) φ-Ss, (c) φ-T2C, (d) φ-Dp.
Figure 18c,d depict the relationship between T2C, Dp, and porosity in specimens. Although the correlation among these parameters is relatively weak, an overall negative trend is observed; as T2C and Dp increase, porosity gradually decreases. Section 3.4 and Section 3.5 analyze the impact of varying MCIs and NDWC on the T2C and Dp of coal rock. The evolution patterns of T2C and Dp, as observed through NMR, indicate the pore connectivity and complexity of coal rock. The increase in porosity corresponds to enhanced pore connectivity and complexity of coal, consistent with previous studies. The analysis attributes these findings to coal being a porous medium containing soluble minerals like illite and montmorillonite. During coal–water interactions, these minerals undergo water absorption, expansion, and dissolution, leading to increased porosity and improved pore connectivity [63,64]. The distribution characteristics of soluble mineral particles within the coal matrix influence their expansion and dissolution, resulting in non-uniform pore distribution and heightened geometric heterogeneity. This process is intricate, irregular, and random, contributing to the complexity of coal pore structure.
4.2. Damage Mechanisms of Dry–Wet Cycling on Coal Pores
The evolution of coal rock pore structure parameters under DWCs and MCIs reveals distinct influences of these two factors. As demonstrated in Section 3.3, at low DWC numbers (NDWC = 1), increasing MCIs restricts fluid seepage capacity within pores, thereby reducing permeability. However, as NDWC increases, permeability exhibits an approximately linear rise with MCIs. These findings indicate that coal rock pore structure is jointly governed by DWC frequency and MCIs, with coal–water interaction mechanisms varying across different parameter conditions.
Figure 19 presents the pore evolution mechanisms in coal subjected to DWCs. Extensive research has elucidated the intricate processes governing coal–water interactions. Coal, characterized by a variety of pore structures, undergoes complex physicochemical transformations upon water ingress, including swelling, migration, and dissolution, primarily driven by the presence of hydrophilic mineral particles [6,15,62]. This study systematically examines how NDWC and MCIs influence coal pore structure. Nuclear magnetic resonance (NMR) experimental results (Section 3) reveal that initial water exposure triggers non-uniform swelling of hydrophilic mineral particles, reducing overall porosity and permeability while decreasing pore geometric heterogeneity. Simultaneously, inter-pore cementation weakens. As MCIs and DWCs increase, weakened cementation facilitates partial mineral particle migration and dissolution, ultimately enhancing porosity and permeability. Concurrently, pore structure complexity intensifies progressively.
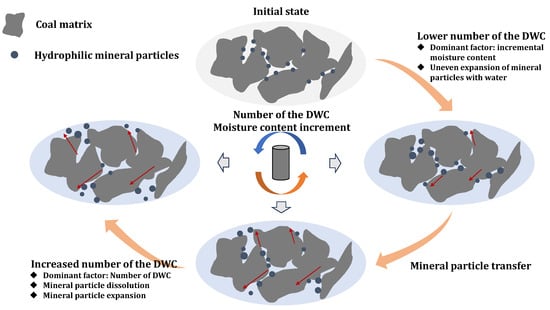
Figure 19.
Schematic illustration of the pore damage mechanism of coal rock under DWCs.
The pore fractal dimension serves as a representative example. When the NDWC is low, the dominant factor influencing pore structure is the MCI. As the MCI increases, the fractal dimension decreases, indicating that a higher MCI reduces the complexity of pore distribution and enhances overall pore uniformity. Consequently, this improved pore uniformity increases the lubrication effect between the pore matrix and water, thereby reducing cohesion. This mechanism provides a theoretical basis for understanding the evolution of coal’s mechanical parameters following water erosion [12,14]. As NDWC increases, the pore fractal dimension initially rises and then declines with further MCIs. However, the final value remains higher than the initial state, suggesting that repeated DWCs dissolve mineral particles attached to pore surfaces. This process increases pore complexity and enhances pore heterogeneity.
4.3. Research Limitations and Prospects
This study preliminarily investigated the effects of varying MCIs and DWC numbers on coal pore structure using NMR. However, experimental and analytical limitations necessitate further research in the following several areas:
(1) The limitations of samples and experimental conditions. Despite sampling from the same mining area and implementing screening procedures, inherent coal heterogeneity introduced unavoidable sample-related uncertainties. Additionally, the exclusive use of samples from underground reservoir coal seams limits the generalizability of findings due to their site-specific nature. Experimentally, while moisture content was controlled during dry–wet cycling, imprecise duration control introduced uncertainty. Future work should utilize more homogeneous rock materials and improve precision in moisture control during cyclic treatments. This would reduce experimental uncertainty and enhance the generalizability of results.
(2) Insufficiency of experimental analysis means. The alteration of coal’s internal pore structure under cyclic wet–dry conditions arises from mineral particle swelling, dissolution, and migration. While this study quantified the evolution of pore structure parameters, it did not address the underlying changes in mineral composition and quantity. Future work should, therefore, employ microscopic characterization techniques (e.g., SEM, MIP, XRD) to comprehensively investigate fluid–rock interactions. Concurrently, pore structure evolution governs macroscopic mechanical properties. Although DWC effects on coal mechanics are well-studied, this work lacks micro-to-macro mechanical linkage. Future research should implement coupled hydro-mechanical testing under engineering-relevant conditions to elucidate damage mechanisms in cyclically saturated coal.
This study establishes the evolution characteristics of coal’s microporous structure under DWC conditions with varying MCIs using NMR technology. These findings provide critical insights into coal strength degradation mechanisms. The engineering significance of the results manifests in two primary aspects:
(1) Direct application to coal pillar dam design
Evolution equations quantifying porosity and permeability as functions of DWCs and MCIs enable derivation of material deterioration depth models. These models inform minimum width specifications for coal pillar dams, ensuring sufficient structural compensation for cyclic water-induced damage, which is a fundamental requirement for long-term stability of underground reservoirs.
(2) Foundation for stability assessment frameworks
Microscopically quantified parameters (e.g., permeability k, pore damage factor D) provide essential inputs for numerical simulations. Embedding these relationships into coupled hydromechanical-fracture models enables predictive analysis of dam integrity under field conditions, establishing a physics-based stability evaluation system.
5. Conclusions
This study systematically examines the pore structure and fractal characteristics of coal rock subjected to 1–5 DWCs with three distinct MCIs. This investigation utilized low-field nuclear magnetic resonance (NMR) and a self-developed rock water immersion device. By conducting detailed measurements and quantitative assessments encompassing T2 spectra, magnetic resonance imaging (MRI), pore size distribution, porosity, permeability, fractal dimension, and pore damage, the study scrutinized the distinct variations in pore structure and fractal dimension in response to different MCIs and DWC frequencies. Key findings include the following:
(1) After cyclic treatment with varying moisture content increments, the T2 spectrum area and magnetic resonance imaging (MRI) results of the samples showed significant variations. Maintaining a consistent number of DWCs, the pore spectrum area, adsorption pore area, and percolation pore area showed incremental increases with higher MCIs. MRI analysis demonstrated that the overall NMR signal intensity displayed a banded distribution along the coal rock bedding. As the MCIs increased, the signal intensity in the central region intensified, adjacent bands became interconnected, and the NMR signal distribution expanded progressively from the sample edges toward deeper regions.
(2) The DWCs had a significant impact on the expansion of pores ranging from 10 to 100 nm in the specimens. The pore size distribution exhibited a unimodal pattern, with pores between 10 and 100 nm being the most prevalent, followed by pores smaller than 10 nm and between 100 and 100 nm, while pores larger than 100 nm were present in minimal amounts. When the MCIs increased from 4% to 8% for NDWC = 5, the proportion of pores smaller than 10 nm decreased from 2.13% to 1.99%, whereas the proportion of pores between 10 and 100 nm increased from 6.81% to 7.18%. Higher MCIs during DWCs facilitated the transformation and enlargement of pores smaller than 100 nm.
(3) The porosity and permeability of the specimens exhibit distinct variation characteristics influenced by the NDWC and MCIs. As MCI increases during DWCs, the total porosity of the specimens rises. Specifically, for every 2% increase in MCI, the total porosity increases by 0.09% and 0.32%, respectively. Meanwhile, effective porosity initially decreases before increasing, displaying an overall upward trend. Permeability evolution, modeled using the improved SDR method, correlates with the NDWC. For NDWC = 1, an increase in MCI from 4% to 8% results in a decrease in permeability by 0.0026 mD. Conversely, for NDWC = 3 and NDWC = 5, the permeability increases by 0.002 mD and 0.0052 mD, respectively, indicating a positive correlation between permeability and MCI.
(4) The evolution processes of T2C and the fractal dimension exhibited distinct patterns under the combined influence of DWCs and MCIs. For NDWC = 1, as the MCI increases from 4% to 8%, T2C decreases by 0.201, and the free pore fractal dimension diminishes. However, for NDWC = 3 and NDWC = 5, both T2C and free pore fractal dimension initially increased and then decreased with increasing MCIs, ultimately demonstrating higher fractal dimensions under larger MCIs.
(5) Both the NDWC and the MCIs can increase the degree of pore damage in coal rock, but the relationship between pore damage and MCIs follows different evolution patterns under varying NDWC. For NDWC = 1 and NDWC = 3, the pore damage variable exhibited an exponential trend with increasing MCIs; the higher the MCIs, the greater the rate of pore damage change. For NDWC = 5, the NDWC exerted a more pronounced promoting effect on pore development and expansion.
Author Contributions
Conceptualization, Z.C.; methodology, H.X. and Z.Z.; software, Y.X.; validation, H.X. and L.Y.; formal analysis, H.X. and Y.Z. (Yanpeng Zhao); investigation, H.X., Y.Z. (Yanpeng Zhao), D.Q. and Y.Z. (Yong Zhang); data curation, Y.Z. (Yanpeng Zhao), D.Q. and H.L.; writing—original draft preparation, H.X.; writing—review and editing, Z.Z.; funding acquisition, Z.Z. All authors have read and agreed to the published version of the manuscript.
Funding
This research was funded by the Deep Earth Probe and Mineral Resources Exploration-National Science and Technology Major Project, grant number 2024ZD1003901; Open Fund of the State Key Laboratory of Water Resource Protection and Utilization in Coal Mining, grant number WPUKFJJ2022-07; National Natural Science Foundation of China, grant number 52174084.
Data Availability Statement
The original contributions presented in this study are included in the article. Further inquiries can be directed to the corresponding author.
Acknowledgments
The authors gratefully thank the anonymous reviewers for their constructive comments for improving the presentation. All authors have agreed to the listing of authors.
Conflicts of Interest
Author Yanpeng Zhao, Daoxia Qin, Hui Liu and Yaxin Xing were employed by the company Shanxian Energy Co., Ltd., Feicheng Mining Group. The remaining authors declare that the research was conducted in the absence of any commercial or financial relationships that could be construed as a potential conflict of interest.
References
- Liu, X.; Zeng, Y.; Wu, Q.; Meng, S.; Liang, J.; Hou, Z. Ecological-Based Mining: A Coal-Water-Thermal Collaborative Paradigm in Ecologically Fragile Areas in Western China. Engineering 2024, 38, 209–222. [Google Scholar] [CrossRef]
- Zhang, C.; Wang, F.; Bai, Q. Underground space utilization of coalmines in China: A review of underground water reservoir construction. Tunn. Undergr. Space Technol. 2021, 107, 103657. [Google Scholar] [CrossRef]
- Yao, Q.; Chen, T.; Tang, C.; Sedighi, M.; Wang, S.; Huang, Q. Influence of moisture on crack propagation in coal and its failure modes. Eng. Geol. 2019, 258, 105156. [Google Scholar] [CrossRef]
- Qian, R.; Feng, G.; Liu, X.; Yu, B.; Ma, Q.; Zeng, S.; Hu, N.; Geng, H. Experimental investigation on mechanical and damage properties of single fractured coal subjected to water pressure and triaxial compression. Theor. Appl. Fract. Mech. 2024, 130, 104328. [Google Scholar] [CrossRef]
- Poulsen, B.A.; Shen, B.; Williams, D.J.; Huddlestone-Holmes, C.; Erarslan, N.; Qin, J. Strength reduction on saturation of coal and coal measures rocks with implications for coal pillar strength. Int. J. Rock Mech. Min. Sci. 2014, 71, 41–52. [Google Scholar] [CrossRef]
- Yu, L.; Yao, Q.; Liu, J.; Li, X.; Chong, Z.; Wang, F.; Xie, H.; Li, Y. Effect of spatial distribution of water on rock mechanical properties and characterization of water diffusion. Constr. Build. Mater. 2025, 470, 140551. [Google Scholar] [CrossRef]
- Wang, Y.; Liu, F.; Kou, M.; Li, M. A Review of Stability of Dam Structures in Coal Mine Underground Reservoirs. Water 2024, 16, 1856. [Google Scholar] [CrossRef]
- Ma, T.; Liu, H.; Zou, Q.; Kong, F.; Ran, Q.; Wang, P. Damage evolution characteristics and deterioration mechanism of mechanical properties of sandstone subjected to drying-wetting cycles. J. Mater. Res. Technol-JMRT 2023, 23, 4591–4605. [Google Scholar] [CrossRef]
- Liu, J.; Tan, Z.; Zhao, Q.; Liu, B.; Wang, X. Mechanical properties and durability analysis of CS-CG stabilized soil: Towards sustainable subgrade soil enhancement. Constr. Build. Mater. 2024, 442, 137634. [Google Scholar] [CrossRef]
- Xu, J.; Sun, H.; Cui, Y.; Fei, D.; Lan, H.; Yan, C.; Bao, H.; Wu, F. Study on Dynamic Characteristics of Diorite Under Dry-Wet Cycle. Rock Mech. Rock Eng. 2021, 54, 6339–6349. [Google Scholar] [CrossRef]
- Wang, K.; Dong, H.; Guo, Y.; Zhao, W.; Shao, B.; Yan, Z.; Wu, J.; Guan, L. Gas drainage performance evaluation in coal under non-uniform stress with different moisture content: Analysis simulation and field verification. Fuel 2021, 305, 121489. [Google Scholar] [CrossRef]
- Zheng, C.; Yao, Q.; Li, X.; Hudson-Edwards, K.A.; Shang, X.; Shan, C.; Hao, Y. Evolution law of ultrasonic characteristics and its relationship with coal-measure sandstone mechanical properties during saturation and desaturation. J. Build. Eng. 2023, 75, 106909. [Google Scholar] [CrossRef]
- Fan, J.; Li, Z.; Feng, G.; Zhang, H.; Qi, C.; Zhang, J. Failure analysis of coal pillars and overburden from underground water reservoir under the mining—water invasion coupling effect. Eng. Fail. Anal. 2023, 151, 107406. [Google Scholar] [CrossRef]
- Yu, L.; Yao, Q.; Chong, Z.; Li, Y.; Xu, Q.; Xie, H.; Ye, P. Mechanical and micro-structural damage mechanisms of coal samples treated with dry—Wet cycles. Eng. Geol. 2022, 304, 106637. [Google Scholar] [CrossRef]
- Xie, H.; Yao, Q.; Zhang, Z.; Shan, C.; Gao, H.; Yu, L.; Li, Y.; Li, X. Pore structure characterization measurement and damage assessment of coal rock under dry-wet cycling for underground water reservoirs. Measurement 2025, 246, 116739. [Google Scholar] [CrossRef]
- Chen, S.; Jiang, T.; Wang, H.; Feng, F.; Yin, D.; Li, X. Influence of cyclic wetting-drying on the mechanical strength characteristics of coal samples: A laboratory-scale study. Energy Sci. Eng. 2019, 7, 3020–3037. [Google Scholar] [CrossRef]
- Guo, Q.; Su, H.; Jing, H.; Zhu, W. Effect of Wetting-Drying Cycle on the Deformation and Seepage Behaviors of Rock Masses around a Tunnel. Geofluids 2020, 2020, 4237163. [Google Scholar] [CrossRef]
- Shan, C.; Yao, Q.; Cao, S.; Zheng, C.; Xu, Q.; Xia, Z.; Shang, X.; Huang, G. Analysis of cracks development and damage evolution in red sandstone under dry-wet cycles based on temporal and frequency characteristics of acoustic emission. J. Build. Eng. 2024, 94, 109849. [Google Scholar] [CrossRef]
- Firouzi, M.; Rupp, E.C.; Liu, C.W.; Wilcox, J. Molecular simulation and experimental characterization of the nanoporous structures of coal and gas shale. Int. J. Coal Geol. 2014, 121, 123–128. [Google Scholar] [CrossRef]
- Craddock, P.R.; Bake, K.D.; Pomerantz, A.E. Chemical Molecular and Microstructural Evolution of Kerogen during Thermal Maturation: Case Study from the Woodford Shale of Oklahoma. Energy Fuels 2018, 32, 4859–4872. [Google Scholar] [CrossRef]
- Toumelin, E.; Torres-Verdin, C.; Sun, B.; Dunn, K. Limits of 2D NMR interpretation techniques to quantify pore size wettability and fluid type: A numerical sensitivity study. Spe J. 2006, 11, 354–363. [Google Scholar] [CrossRef]
- Wood, J.M.; Curtis, M.E.; Ardakani, O.H.; Sanei, H. Movement of native fluids during scanning electron microscopy imaging of petroliferous siltstones: Evidence from the Montney Formation, western Canada. Fuel 2021, 290, 120020. [Google Scholar] [CrossRef]
- Freire-Gormaly, M.; Ellis, J.S.; Bazylak, A.; Maclean, H.L. Comparing thresholding techniques for quantifying the dual porosity of Indiana Limestone and Pink Dolomite. Microporous Mesoporous Mat. 2015, 207, 84–89. [Google Scholar] [CrossRef]
- Li, X.; Kang, Y.; Haghighi, M. Investigation of pore size distributions of coals with different structures by nuclear magnetic resonance (NMR) and mercury intrusion porosimetry (MIP). Measurement 2018, 116, 122–128. [Google Scholar] [CrossRef]
- Fu, C.; Kou, X.; Du, Y.; Jiang, L.; Sang, S.; Pan, Z. Experimental study of supercritical CO2-H2O-coal interactions and the effect on coal spontaneous imbibition characteristics. Fuel 2025, 383, 133888. [Google Scholar] [CrossRef]
- Wang, X.; Geng, J.; Zhang, D.; Xiao, W.; Chen, Y.; Zhang, H. Influence of sub-supercritical CO2 on pore structure and fractal characteristics of anthracite: An experimental study. Energy 2022, 261, 125115. [Google Scholar] [CrossRef]
- Ahamed, M.; Perera, M.; Matthai, S.K.; Ranjith, P.G.; Li, D.Y. Coal composition and structural variation with rank and its influence on the coal-moisture interactions under coal seam temperature conditions—A review article. J. Pet. Sci. Eng. 2019, 180, 901–917. [Google Scholar] [CrossRef]
- Xue, W.; Xu, L.; Wang, Z.; Min, T.; Xu, J. Experimental study on seepage evolution and microscopic characteristics of initially damaged concrete under variable confining pressure. Constr. Build. Mater. 2023, 393, 132157. [Google Scholar] [CrossRef]
- Li, S.; Tang, D.; Pan, Z.; Xu, H.; Huang, W. Characterization of the stress sensitivity of pores for different rank coals by nuclear magnetic resonance. Fuel 2013, 111, 746–754. [Google Scholar] [CrossRef]
- Zheng, S.; Yao, Y.; Liu, D.; Cai, Y.; Liu, Y. Nuclear magnetic resonance surface relaxivity of coals. Int. J. Coal Geol. 2019, 205, 1–13. [Google Scholar] [CrossRef]
- Yu, Y.; Rong, K.; Cui, W.; Cheng, W.; Chen, Y.; Wei, W. Pore structure dynamic evolution of coal during hydraulic intrusion based on NMR. Measurement 2024, 227, 114247. [Google Scholar] [CrossRef]
- Zhang, N.; Wang, S.; Wu, J.; Li, Z.; Wang, X. Full-Scale Pore Structure Characterization and Its Impact on Methane Adsorption Capacity and Seepage Capability: Differences between Shallow and Deep Coal from the Tiefa Basin in Northeastern China. Fractal Fract. 2024, 8, 48. [Google Scholar] [CrossRef]
- Song, Y.; Zou, Q.; Su, E.; Zhang, Y.; Sun, Y. Changes in the microstructure of low-rank coal after supercritical CO2 and water treatment. Fuel 2020, 279, 118493. [Google Scholar] [CrossRef]
- Song, L.; Gu, Y.; Zhang, L.; Wang, X. A Novel Permeability Prediction Model for Deep Coal via NMR and Fractal Theory. Mathematics 2023, 11, 118. [Google Scholar] [CrossRef]
- Wang, R.; Li, S.; Lin, H.; Yang, E.; Song, Z.; Zhu, B.; Qin, L.; Qiu, Y. Experimental study on the influence of ultrasonic excitation duration on the pore and fracture structure and permeability of coal body. Geoenergy Sci Eng 2023, 231, 212393. [Google Scholar] [CrossRef]
- Culshaw, M.G. Ulusay, R (ed.), 2015. The ISRM suggested methods for rock characterization, testing and monitoring: 2007–2014. Bull. Eng. Geol. Environ. 2015, 74, 1499–1500. [Google Scholar] [CrossRef]
- Zheng, C.; Yao, Q.; Shan, C.; Li, Y.; Shang, X.; Li, X.; Li, J. Measurement of uniaxial compression mechanical properties of thermally dried coal samples by energy and fragmentation characteristic analyses. Measurement 2023, 207, 112363. [Google Scholar] [CrossRef]
- Yao, Q.; Chen, T.; Ju, M.; Liang, S.; Liu, Y.; Li, X. Effects of Water Intrusion on Mechanical Properties of and Crack Propagation in Coal. Rock Mech. Rock Eng. 2016, 49, 4699–4709. [Google Scholar] [CrossRef]
- Xie, H.; Xie, H.; Zhang, Z.; Yao, Q.; Cao, Z.; Gao, H.; Shan, C.; Yan, Z.; Yin, R. Fatigue fracture behaviors and damage evolution of coal samples treated with drying-wetting cycles investigated by acoustic emission and nuclear magnetic resonance. Int. J. Rock Mech. Min. Sci. 2025, 185, 105976. [Google Scholar] [CrossRef]
- Amer, M.W.; Khdeir, E.M.; Barzagli, F. Effects of Hydrothermal Treatment on the Properties of Jordanian Oil Shale. Energy Fuels 2025, 39, 11147–11158. [Google Scholar] [CrossRef]
- Kleinberg, R.L. Utility of NMR T-2 distributions connection with capillary pressure clay effect and determination of the surface relaxivity parameter ρ2. Magn. Reson. Imaging 1996, 14, 761–767. [Google Scholar] [CrossRef] [PubMed]
- Xu, J.; Zhai, C.; Liu, S.; Qin, L.; Dong, R. Investigation of temperature effects from LCO2 with different cycle parameters on the coal pore variation based on infrared thermal imagery and low-field nuclear magnetic resonance. Fuel 2018, 215, 528–540. [Google Scholar] [CrossRef]
- Ghanbarian-Alavijeh, B.; Millan, H.; Huang, G. A review of fractal prefractal and pore-solid-fractal models for parameterizing the soil water retention curve. Can. J. Soil Sci. 2011, 91, 1–14. [Google Scholar] [CrossRef]
- Ouyang, Z.; Liu, D.; Cai, Y.; Yao, Y. Fractal Analysis on Heterogeneity of Pore-Fractures in Middle-High Rank Coals with NMR. Energy Fuels 2016, 30, 5449–5458. [Google Scholar] [CrossRef]
- Wang, Z.; Qin, Y.; Shen, J.; Li, T.; Zhang, X.; Cai, Y. A novel permeability prediction model for coal based on dynamic transformation of pores in multiple scales. Energy 2022, 257, 124710. [Google Scholar] [CrossRef]
- Helmig, R.; Weiss, A.; Wohlmuth, B.I. Dynamic capillary effects in heterogeneous porous media. Comput. Geosci. 2007, 11, 261–274. [Google Scholar] [CrossRef]
- Cui, Y.; Diao, Q.; He, S.; Xue, K.; Diao, Q. Microstructure and damage characteristics of cement mortar with different aggregate sizes after cooling based on nuclear magnetic resonance technology. J. Build. Eng. 2024, 94, 109791. [Google Scholar] [CrossRef]
- Zheng, S.; Yao, Y.; Liu, D.; Cai, Y.; Liu, Y. Characterizations of full-scale pore size distribution porosity and permeability of coals: A novel methodology by nuclear magnetic resonance and fractal analysis theory. Int. J. Coal Geol. 2018, 196, 148–158. [Google Scholar] [CrossRef]
- Liu, Z.; Zhou, H.; Chen, B.; Song, L.; Sun, X. Integrated NMR Analysis for Evaluating Pore-Fracture Structures and Permeability in Deep Coals: A One-Stop Approach. Energy Fuels 2024, 38, 6854–6867. [Google Scholar] [CrossRef]
- Zheng, S.; Yao, Y.; Liu, D.; Sang, S.; Liu, S.; Wang, M.; Zhou, X.; Wang, R.; Han, S.; Liu, T. Re-evaluating the accurate multiphase water distribution in coals: Unifying experiment and theory. Chem. Eng. J. 2023, 464, 142637. [Google Scholar] [CrossRef]
- Mao, Y.; Xia, W.; Peng, Y.; Xie, G. Wetting of coal pores characterized by LF-NMR and its relationship to flotation recovery. Fuel 2020, 272, 117737. [Google Scholar] [CrossRef]
- Zhou, H.; Cao, Y.; Xie, S.; Liu, Z.; Jia, W. Evolution of pore-fracture structure and mechanical properties of coal under dry-wet cycle. Int. J. Rock Mech. Min. Sci. 2025, 192, 106146. [Google Scholar] [CrossRef]
- Bhapkar, P.V.; Pradhan, S.P.; Siddiqui, M.S.; Vishal, V. Effects of CO2 Superscriptand H2O saturation on physico-mechanical attributes of bituminous coal. Gas Sci. Eng. 2025, 139, 205643. [Google Scholar] [CrossRef]
- Qin, L.; Zhai, C.; Liu, S.; Xu, J.; Yu, G.; Sun, Y. Changes in the petrophysical properties of coal subjected to liquid nitrogen freeze-thaw—A nuclear magnetic resonance investigation. Fuel 2017, 194, 102–114. [Google Scholar] [CrossRef]
- Jia, P.; Huang, X.; Jia, J.; Li, S. Study on porosity and permeability changes in coal freezing by liquid nitrogen based on the chemical structure. Sustain. Energy Fuels 2025. [Google Scholar] [CrossRef]
- Tan, Y.; Pan, Z.; Liu, J.; Zhou, F.; Connell, L.D.; Sun, W.; Haque, A. Experimental study of impact of anisotropy and heterogeneity on gas flow in coal. Part II: Permeability. Fuel 2018, 230, 397–409. [Google Scholar] [CrossRef]
- Guo, X.; Liu, Y.; Zhang, L.; Deng, C.; Song, L.; Zhang, Y. Regulatory mechanism of microscopic pore structure on anisotropy of gas multimodal seepage in original coals. Energy 2024, 300, 131611. [Google Scholar] [CrossRef]
- Duan, M.; Jiang, C.; Gan, Q.; Zhao, H.; Yang, Y.; Li, Z. Study on Permeability Anisotropy of Bedded Coal Under True Triaxial Stress and Its Application. Transp. Porous Media 2020, 131, 1007–1035. [Google Scholar] [CrossRef]
- Kumar, S.; Chandra, D.; Hazra, B.; Vishal, V.; Ranjith, P.G.; Das, A.; Ahuja, M.; Ghosh, S. Integration of fluid-invasive scattering and imaging methods in resolving pore structures in coal and shale. Fuel 2025, 395, 135185. [Google Scholar] [CrossRef]
- Li, Z.; Liu, D.; Cai, Y.; Wang, Y.; Si, G. Evaluation of coal petrophysics incorporating fractal characteristics by mercury intrusion porosimetry and low-field NMR. Fuel 2020, 263, 116802. [Google Scholar] [CrossRef]
- Yu, X.; Xu, H.; Zhai, C.; Regenauer-Lieb, K.; Sang, S.; Sun, Y.; Jing, Y. Characterization of water migration behavior during spontaneous imbibition in coal: From the perspective of fractal theory and NMR. Fuel 2024, 355, 129499. [Google Scholar] [CrossRef]
- Yang, Y.; Zheng, K.; Li, Z.; Li, Z.; Si, L.; Hou, S.; Duan, Y. Experimental study on pore-fracture evolution law in the thermal damage process of coal. Int. J. Rock Mech. Min. Sci. 2019, 116, 13–24. [Google Scholar] [CrossRef]
- Si, L.; Wei, J.; Xi, Y.; Wang, H.; Wen, Z.; Li, B.; Zhang, H. The influence of long-time water intrusion on the mineral and pore structure of coal. Fuel 2021, 290, 119848. [Google Scholar] [CrossRef]
- Song, B.; Zhai, X.; Ma, T.; Wang, B.; Le, H.; Zhou, Y. Effect of water immersion on pore structure of bituminous coal with different metamorphic degrees. Energy 2023, 274, 127449. [Google Scholar] [CrossRef]
Disclaimer/Publisher’s Note: The statements, opinions and data contained in all publications are solely those of the individual author(s) and contributor(s) and not of MDPI and/or the editor(s). MDPI and/or the editor(s) disclaim responsibility for any injury to people or property resulting from any ideas, methods, instructions or products referred to in the content. |
© 2025 by the authors. Licensee MDPI, Basel, Switzerland. This article is an open access article distributed under the terms and conditions of the Creative Commons Attribution (CC BY) license (https://creativecommons.org/licenses/by/4.0/).