

Design, Calibration, and Performance Evaluation of a High-Fidelity Spraying Rainfall Simulator for Soil Erosion Research

 , ,
, ,  ,
,  and
and
Abstract
1. Introduction
- -
- Achieving precise control over rainfall parameters—ensuring that rainfall intensity and drop-size distribution highly mimic natural precipitation.
- -
- Ensuring adaptability across different environments—designing a system that functions effectively in both laboratory and field conditions while maintaining consistent experimental outputs.
- -
- Balancing complexity and affordability—creating a technically sophisticated system that remains accessible for broader research applications without excessive costs.
2. Materials and Methods
2.1. Rainfall Simulator Design Criteria
- -
- General criteria (overall design and functionality):
- The rainfall application area must fully cover or exceed the soil plot area to ensure uniform exposure;
- Portability is not required for the intended purpose;
- The rainfall simulator must be usable in both laboratory and field conditions;
- The structure must comply with all applicable operational safety standards;
- The system should allow easy operation, fast calibration, and reliable repeatability of rainfall simulations;
- Maintenance tools and technical support must be readily available and accessible;
- The construction should be mechanically simple, with minimal components, built from durable and affordable materials to ensure longevity and low maintenance needs;
- A supply of clean water and a stable power source must be ensured at all times;
- The working zone must offer enough space for two operators to carry out calibration and handling without obstruction.
- -
- Specific criteria (technical and performance requirements):
- Simulated rainfall should replicate natural precipitation in terms of intensity, duration, drop size, kinetic energy, and momentum;
- Rainfall uniformity must be achieved in both spatial and temporal distributions across the plot;
- The reservoir must have sufficient capacity for a complete trial or allow continuous refilling during operation;
- The system must enable control of key rainfall parameters via adjustable pressure, nozzle type, and drop height;
- The simulator must include wind protection (e.g., barriers or shields) to prevent the disturbance of the water spray;
- The hydraulic system must be safeguarded against clogging by requiring the use of filtered or clean water.
- -
- Additional specific criteria:
- Rainfall duration ranging from 5 to 30 min;
- Rainfall intensity between 0.5 and 6.0 mm·min−1;
- Drop diameters from 0.5 to 2.5 mm;
- Significant variation in rainfall kinetic energy and momentum;
- Normal distribution of the simulated rainfall factor data.
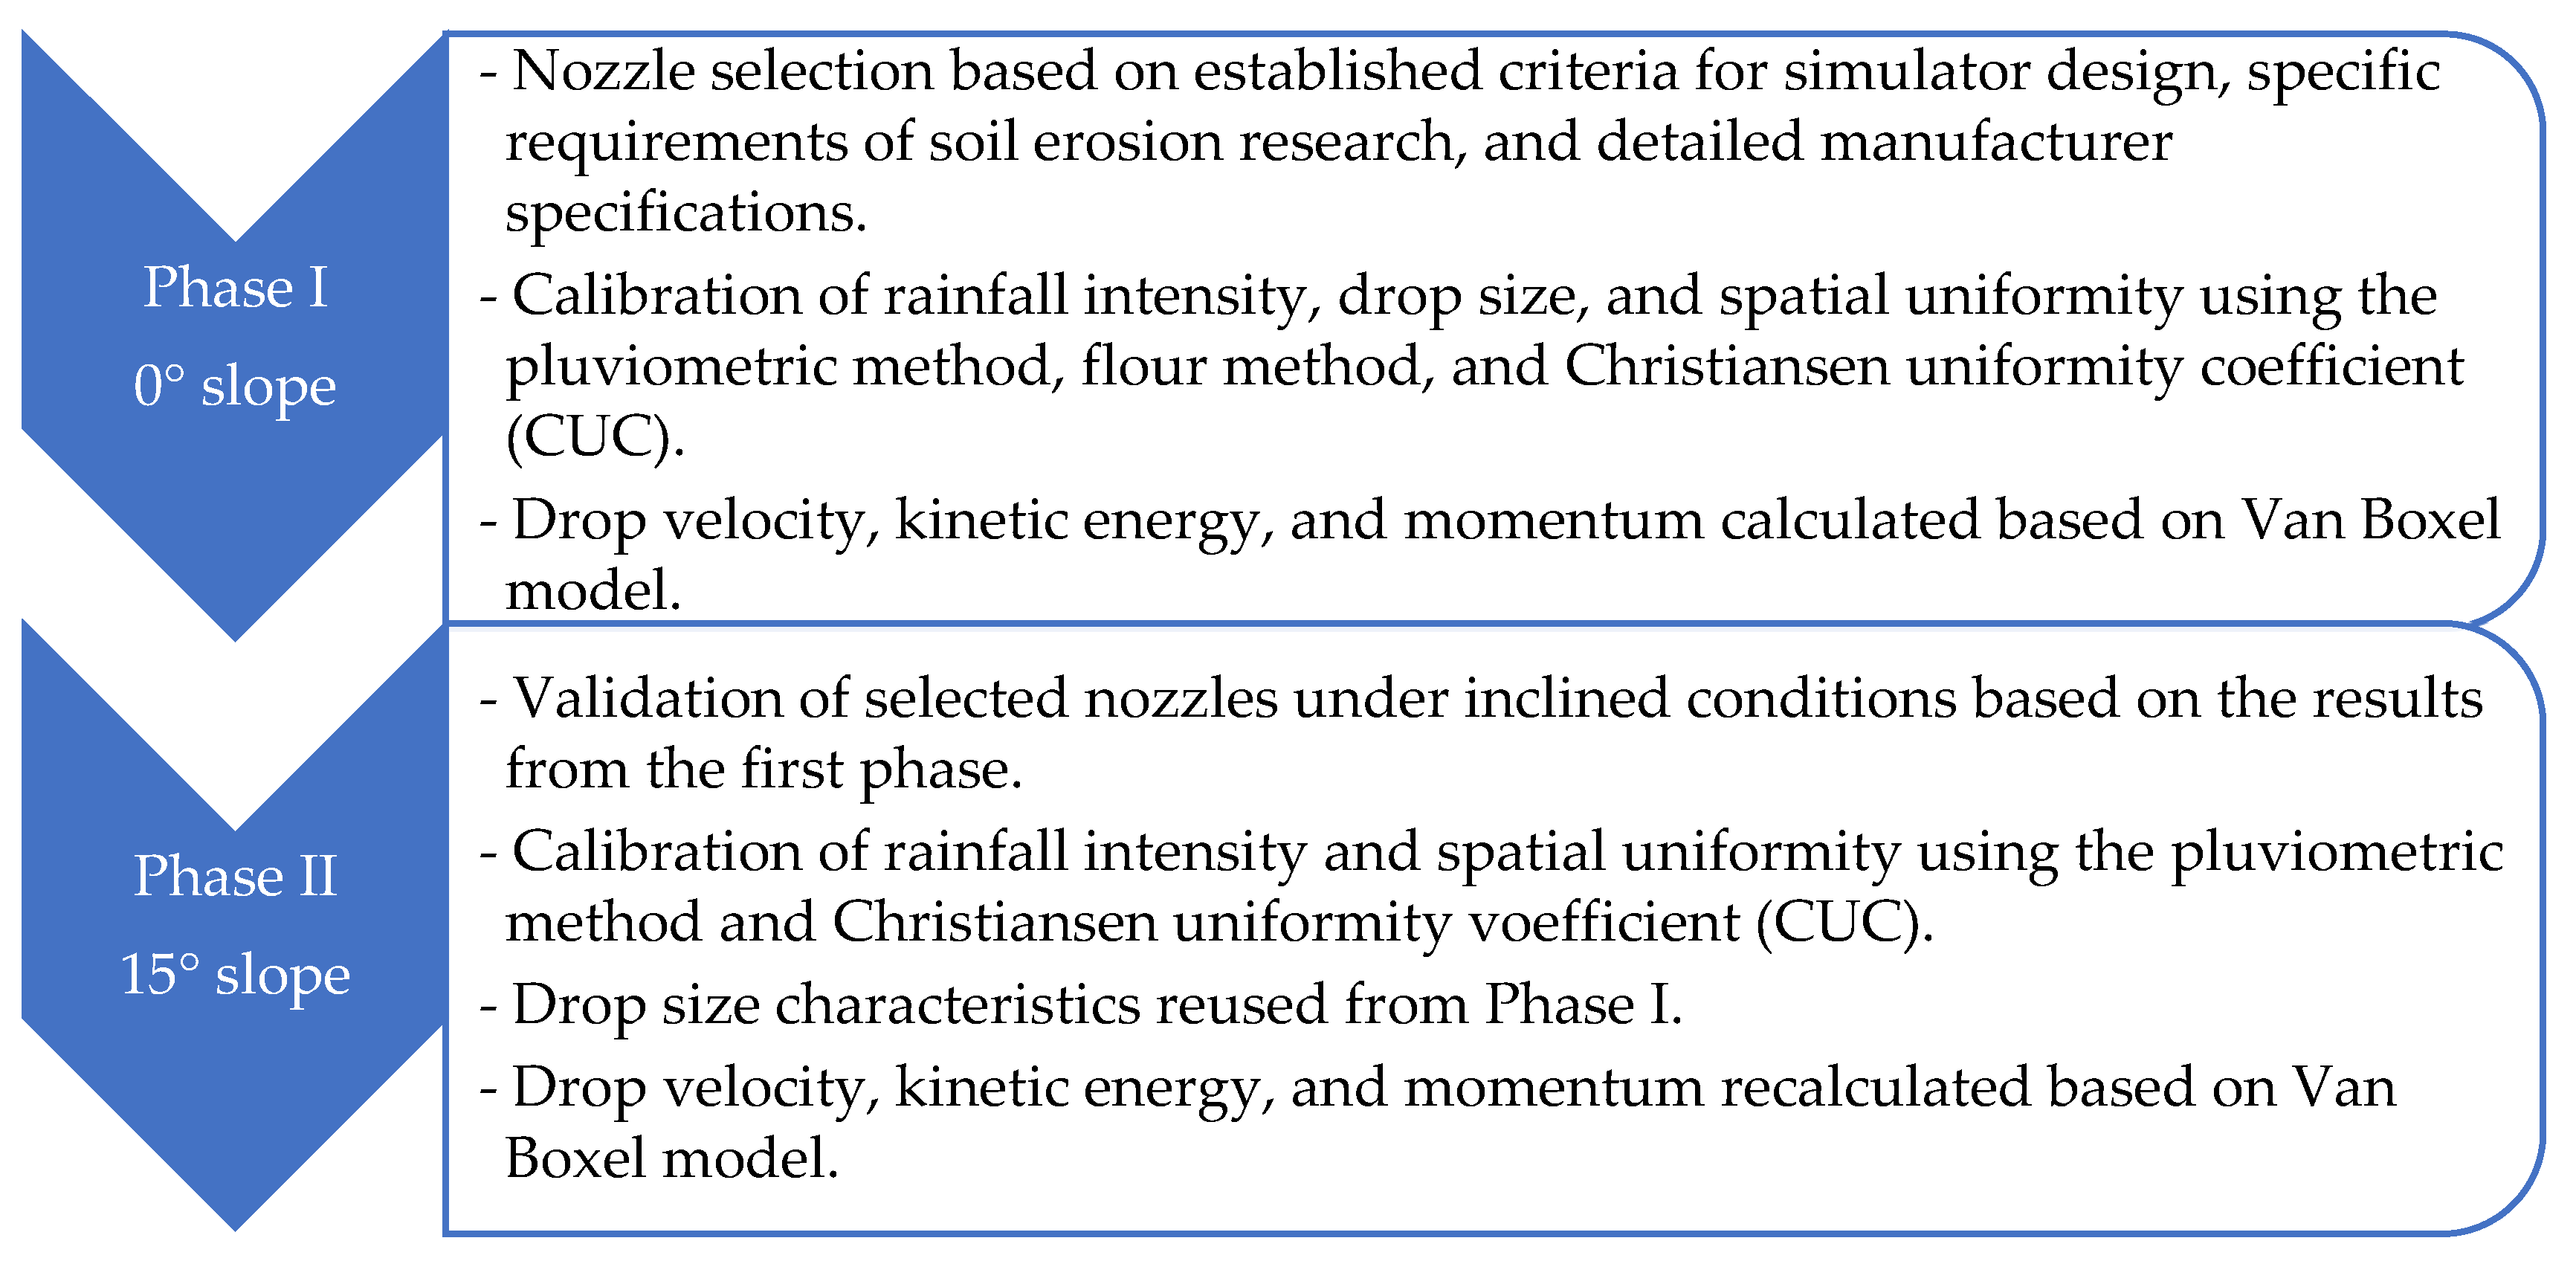
2.2. Calibration Procedures
2.3. Criteria Evaluation Method
3. Results
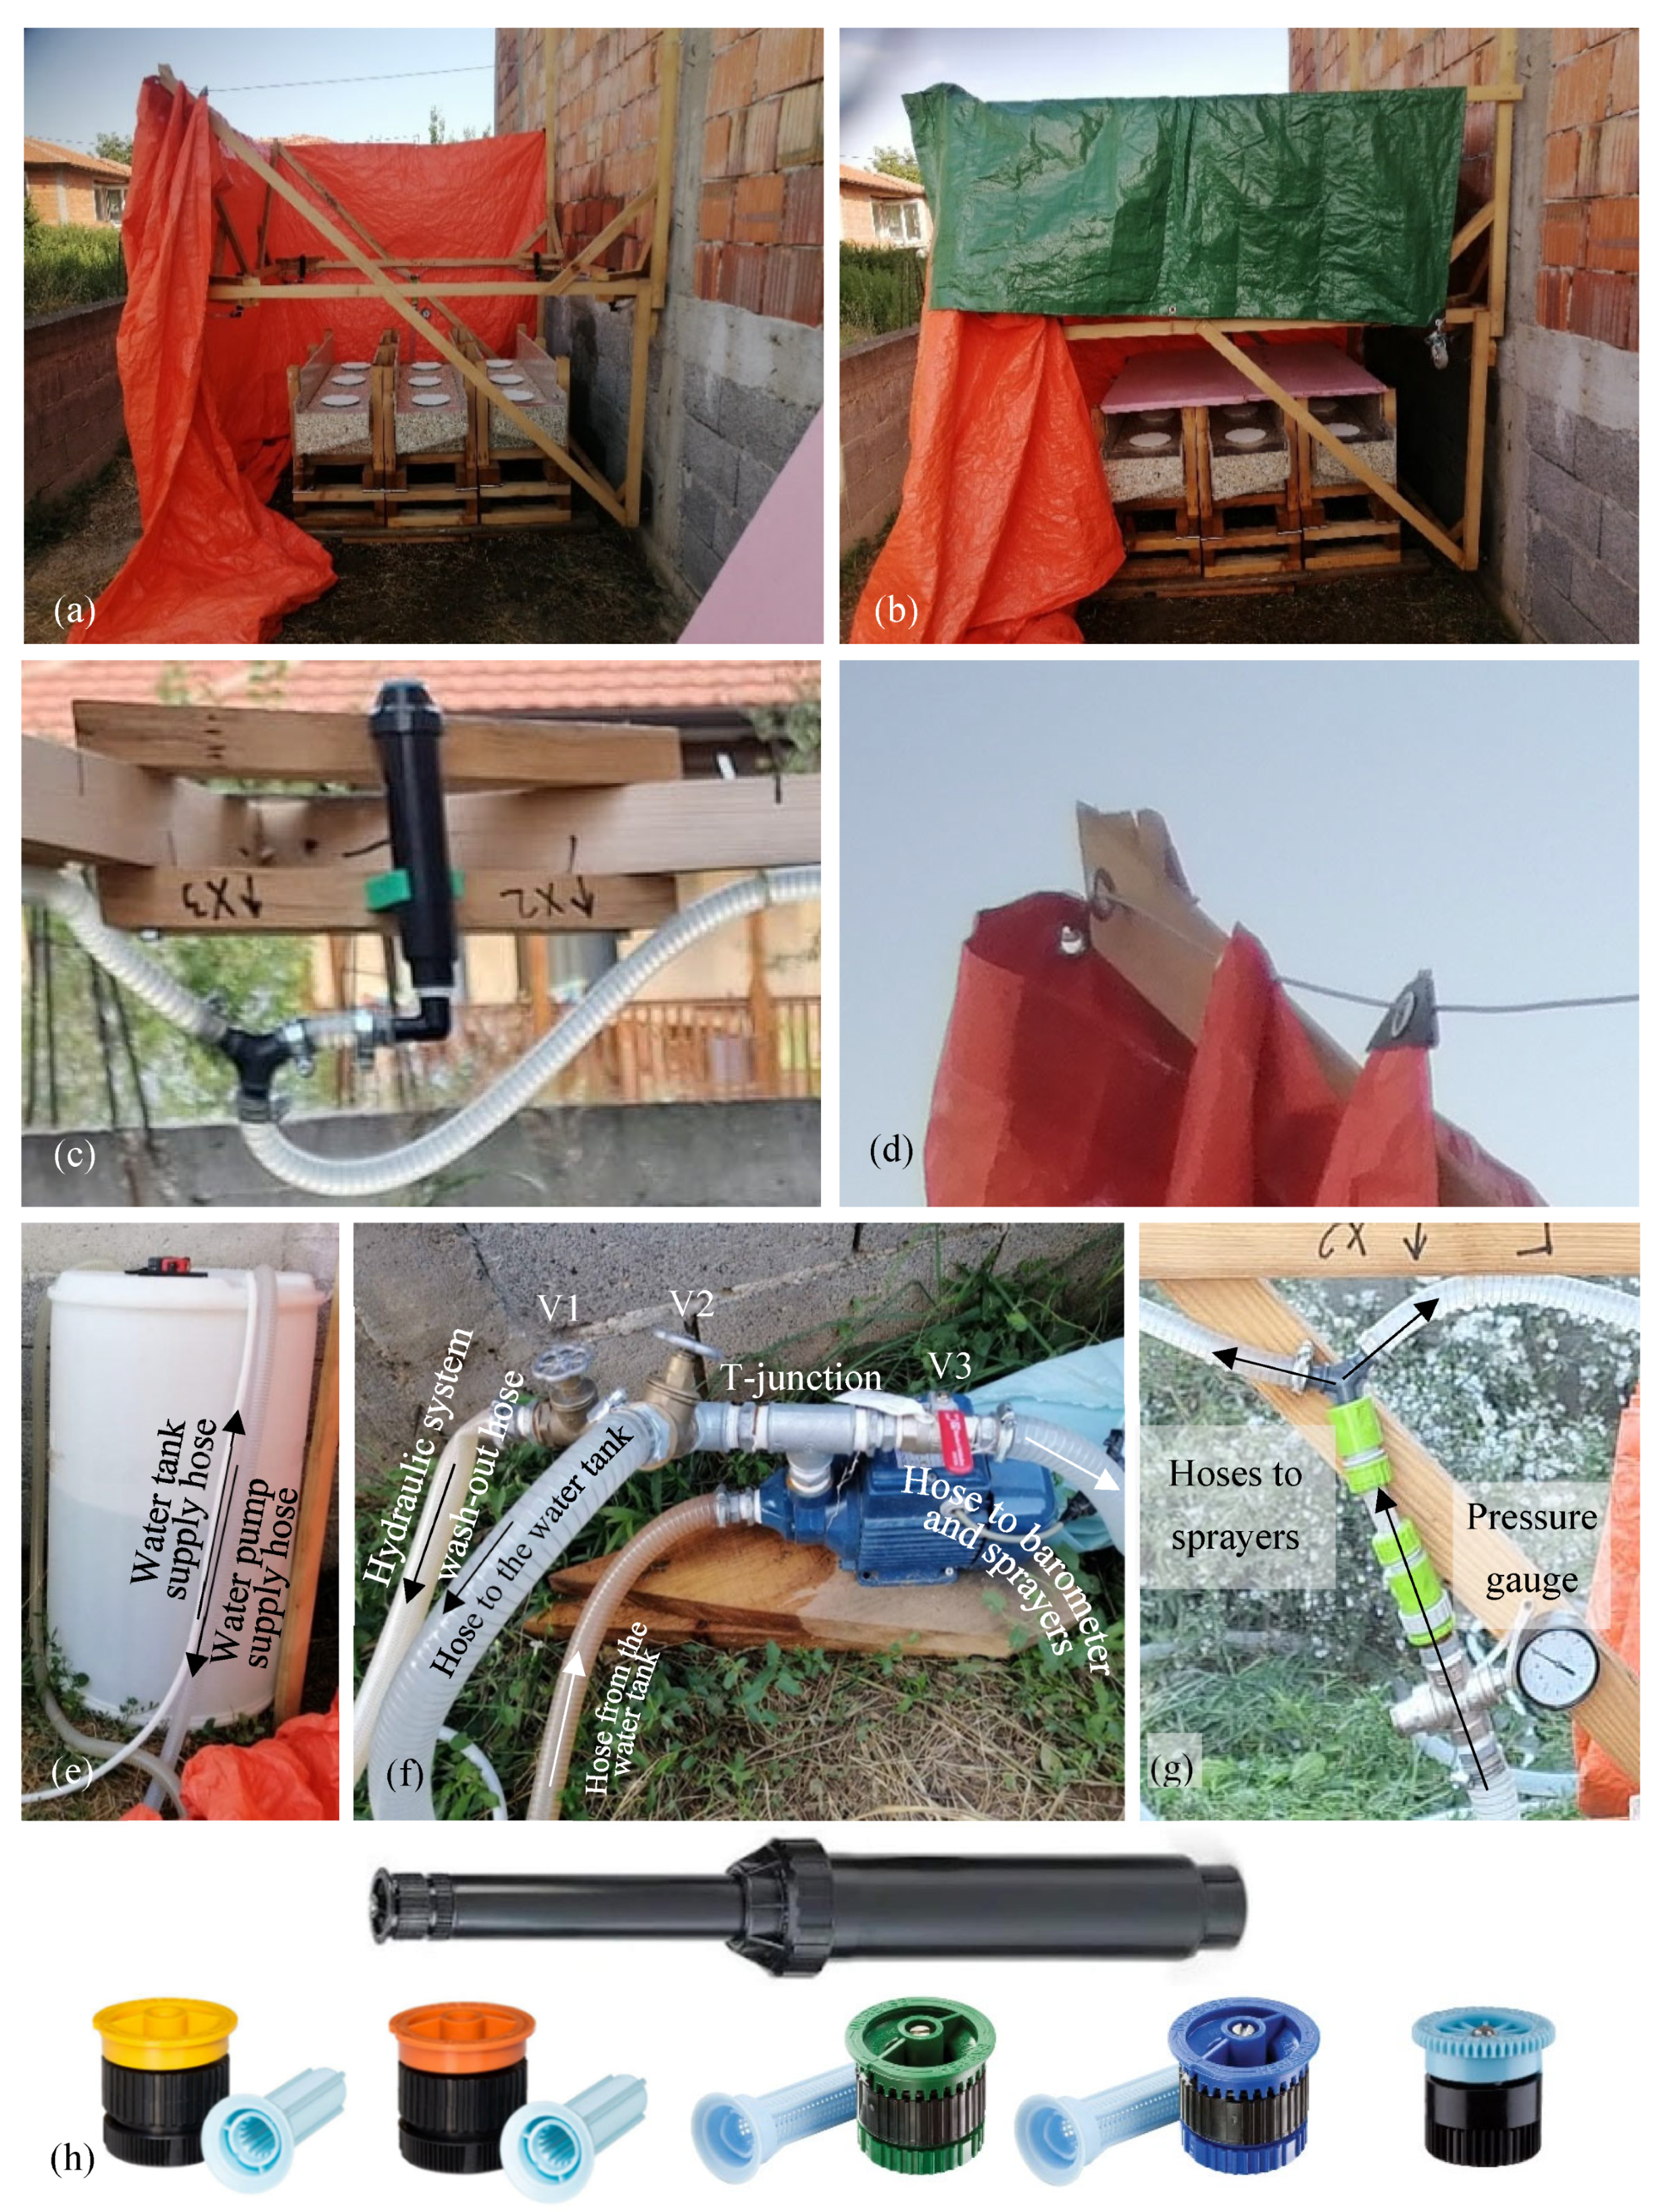
3.1. Design and Assembly
- -
- Structural support;
- -
- Water tank;
- -
- Water-moving mechanism;
- -
- Mechanism of water flow regulation, simulator operation, and sprayers.
3.2. Calibration and Performance
3.2.1. First Phase of Calibration
3.2.2. Second Phase of Calibration
3.3. Evaluation of Design and Performance Criteria
4. Discussion
4.1. Discussion of Structural Design Performance
4.2. Discussion of Simulated Rainfall Performance
4.3. Limitations and Future Development
5. Conclusions
Author Contributions
Funding
Institutional Review Board Statement
Data Availability Statement
Conflicts of Interest
References
- Hamed, Y.; Albergel, J.; Pépin, Y.; Asseline, J.; Nasri, S.; Zante, P.; Balah, M. Comparison between Rainfall Simulator Erosion and Observed Reservoir Sedimentation in an Erosion-Sensitive Semiarid Catchment. Catena 2002, 50, 1–16. [Google Scholar] [CrossRef]
- Meyer, L.D. Rainfall Simulators for Soil Erosion Research. In Soil Erosion Research Methods; Lal, R., Ed.; Routledge: Abingdon, UK, 2017; pp. 83–104. [Google Scholar] [CrossRef]
- Mhaske, S.N.; Pathak, K.; Basak, A. A Comprehensive Design of Rainfall Simulator for the Assessment of Soil Erosion in the Laboratory. Catena 2019, 172, 408–420. [Google Scholar] [CrossRef]
- Macedo, P.M.S.; Pinto, M.F.; Sobrinho, T.A.; Schultz, N.; Coutinho, T.A.R.; de Carvalho, D.F. A Modified Portable Rainfall Simulator for Soil Erosion Assessment under Different Rainfall Patterns. J. Hydrol. 2021, 596, 126052. [Google Scholar] [CrossRef]
- Živanović, N.; Rončević, V.; Ferreira, C.; Kašanin-Grubin, M.; Ćorluka, S.; Rupar, V.; Čebašek, V. The Influence of Rainfall Factors on Soil Resistance to Erosion. In Proceedings of the EGU General Assembly 2024, Vienna, Austria, 14–19 April 2024. EGU24-1137. [Google Scholar] [CrossRef]
- Martínez-Murillo, J.F.; Nadal-Romero, E.; Regüés, D.; Cerdà, A.; Poesen, J. Soil Erosion and Hydrology of the Western Mediterranean Badlands throughout Rainfall Simulation Experiments: A Review. Catena 2013, 106, 101–112. [Google Scholar] [CrossRef]
- Chouksey, A.; Lambey, V.; Nikam, B.R.; Aggarwal, S.P.; Dutta, S. Hydrological Modelling Using a Rainfall Simulator over an Experimental Hillslope Plot. Hydrology 2017, 4, 17. [Google Scholar] [CrossRef]
- Loch, R.J.; Robotham, B.G.; Zeller, L.; Masterman, N.; Orange, D.N.; Bridge, B.J.; Bourke, J.J. A Multi-Purpose Rainfall Simulator for Field Infiltration and Erosion Studies. Soil Res. 2001, 39, 599–610. [Google Scholar] [CrossRef]
- Stone, J.J.; Paige, G.B.; Hawkins, R.H. Rainfall Intensity-Dependent Infiltration Rates on Rangeland Rainfall Simulator Plots. Trans. ASABE 2008, 51, 45–53. [Google Scholar] [CrossRef]
- Mongil-Manso, J.; Patino-Alonso, C.; Nespereira-Jato, J.; Molina, J.-L.; Espejo, F.; Diez-Castro, T.; Zazo, S.; Silla, F. Assessment of Infiltration and Erosion Rates in Mediterranean Reservoirs’ Catchments through Rainfall Simulation. Int. J. Sediment Res. 2025, 40, 466–475. [Google Scholar] [CrossRef]
- Abudi, I.; Carmi, G.; Berliner, P. Rainfall Simulator for Field Runoff Studies. J. Hydrol. 2012, 454, 76–81. [Google Scholar] [CrossRef]
- Boulange, J.; Malhat, F.; Jaikaew, P.; Nanko, K.; Watanabe, H. Portable Rainfall Simulator for Plot-Scale Investigation of Rainfall-Runoff, and Transport of Sediment and Pollutants. Int. J. Sediment Res. 2019, 34, 38–47. [Google Scholar] [CrossRef]
- Simelane, M.P.Z.; Soundy, P.; Maboko, M.M. Effects of Rainfall Intensity and Slope on Infiltration Rate, Soil Losses, Runoff and Nitrogen Leaching from Different Nitrogen Sources with a Rainfall Simulator. Sustainability 2024, 16, 4477. [Google Scholar] [CrossRef]
- Egeli, I.; Pulat, H. F. Mechanism and Modelling of Shallow Soil Slope Stability during High Intensity and Short Duration Rainfall. Sci. Iran. 2011, 18, 1179–1187. [Google Scholar] [CrossRef]
- Lora, M.; Camporese, M.; Salandin, P. Design and Performance of a Nozzle-Type Rainfall Simulator for Landslide Triggering Experiments. Catena 2016, 140, 77–89. [Google Scholar] [CrossRef]
- Sharpley, A.; Kleinman, P. Effect of Rainfall Simulator and Plot Scale on Overland Flow and Phosphorus Transport. J. Environ. Qual. 2003, 32, 2172–2179. [Google Scholar] [CrossRef] [PubMed]
- Iserloh, T.; Ries, J.B.; Arnáez, J.; Boix-Fayos, C.; Butzen, V.; Cerdà, A.; Echeverría, M.T.; Fernández-Gálvez, J.; Fister, W.; Geißler, C.; et al. European Small Portable Rainfall Simulators: A Comparison of Rainfall Characteristics. Catena 2013, 110, 100–112. [Google Scholar] [CrossRef]
- Sadeghi, S.H.; Hazbavi, Z.; Harchegani, M.K. Controllability of Runoff and Soil Loss from Small Plots Treated by Vinasse-Produced Biochar. Sci. Total Environ. 2016, 541, 483–490. [Google Scholar] [CrossRef]
- Alavinia, M.; Saleh, F.N.; Asadi, H. Effects of Rainfall Patterns on Runoff and Rainfall-Induced Erosion. Int. J. Sediment Res. 2019, 34, 270–278. [Google Scholar] [CrossRef]
- Lazarus, R.R.; Wan Jaafar, W.Z.; Alengaram, U.J.; Hin, L.S. Overview of the Research Gaps in the Rainfall Simulator Study. Soil Sci. Soc. Am. J. 2023, 87, 1231–1248. [Google Scholar] [CrossRef]
- Serio, M.A.; Caruso, R.; Carollo, F.G.; Bagarello, V.; Ferro, V.; Nicosia, A. The Hydraulic Assessment of a New Portable Rainfall Simulator Using Different Nozzle Models. Water 2025, 17, 1765. [Google Scholar] [CrossRef]
- Gezici, K.; Şengül, S.; Kesgin, E. Advances in Sheet Erosion and Rainfall Simulator Performance: A Comprehensive Review. Catena 2025, 248, 108601. [Google Scholar] [CrossRef]
- Fernández-Raga, M.; Campo, J.; Rodrigo-Comino, J.; Keesstra, S.D. Comparative Analysis of Splash Erosion Devices for Rainfall Simulation Experiments: A Laboratory Study. Water 2019, 11, 1228. [Google Scholar] [CrossRef]
- Živanović, N.; Rončević, V.; Spasić, M.; Ćorluka, S.; Polovina, S. Construction and Calibration of a Portable Rain Simulator Designed for the In Situ Research of Soil Resistance to Erosion. Soil Water Res. 2022, 17, 158–169. [Google Scholar] [CrossRef]
- Meyer, L.D.; Harmon, W.C. Multiple-Intensity Rainfall Simulator for Erosion Research on Row Sideslopes. Trans. ASAE 1979, 22, 100–103. [Google Scholar] [CrossRef]
- Cerdà, A.; Ibáñez, S.; Calvo, A. Design and Operation of a Small and Portable Rainfall Simulator for Rugged Terrain. Soil Technol. 1997, 11, 163–170. [Google Scholar] [CrossRef]
- Vahabi, J.; Nikkami, D. Assessing Dominant Factors Affecting Soil Erosion Using a Portable Rainfall Simulator. Int. J. Sediment Res. 2008, 23, 376–386. [Google Scholar] [CrossRef]
- Kavian, A.; Mohammadi, M.; Cerdà, A.; Fallah, M.; Gholami, L. Calibration of the SARI Portable Rainfall Simulator for Field and Laboratory Experiments. Hydrol. Sci. J. 2019, 64, 350–360. [Google Scholar] [CrossRef]
- Tiller, M.; Reading, L.; Miska, M.; Egodawatta, P. Analysis of Square Pattern Spray Nozzles for Use in a Portable Field Rainfall Simulator. Catena 2025, 250, 108796. [Google Scholar] [CrossRef]
- Bryan, R.B. Water Erosion by Splash and Wash and the Erodibility of Albertan Soils. Geogr. Ann. Ser. A 1974, 56, 159–181. [Google Scholar] [CrossRef]
- Aksoy, H.; Unal, N.E.; Cokgor, S.; Gedikli, A.; Yoon, J.; Koca, K.; Eris, E. A Rainfall Simulator for Laboratory-Scale Assessment of Rainfall–Runoff–Sediment Transport Processes over a Two-Dimensional Flume. Catena 2012, 98, 63–72. [Google Scholar] [CrossRef]
- Kim, H.; Ko, T.; Jeong, H.; Ye, S. The Development of a Methodology for Calibrating a Large-Scale Laboratory Rainfall Simulator. Atmosphere 2018, 9, 427. [Google Scholar] [CrossRef]
- Qiu, Y.; Wang, X.; Xie, Z.; Wang, Y. Effects of Gravel-Sand Mulch on the Runoff, Erosion, and Nutrient Losses in the Loess Plateau of North-Western China under Simulated Rainfall. Soil Water Res. 2021, 16, 44–52. [Google Scholar] [CrossRef]
- Naves, J.; Anta, J.; Suárez, J.; Puertas, J. Development and Calibration of a New Dripper-Based Rainfall Simulator for Large-Scale Sediment Wash-Off Studies. Water 2020, 12, 152. [Google Scholar] [CrossRef]
- Rončević, V.; Živanović, N.; Ristić, R.; Van Boxel, J.H.; Kašanin-Grubin, M. Dripping Rainfall Simulators for Soil Research—Design Review. Water 2022, 14, 3309. [Google Scholar] [CrossRef]
- Rončević, V.; Živanović, N.; van Boxel, J.H.; Iserloh, T.; Štrbac, S. Dripping Rainfall Simulators for Soil Research—Performance Review. Water 2023, 15, 1314. [Google Scholar] [CrossRef]
- Rončević, V.; Živanović, N.; Van Boxel, J.H.; Iserloh, T.; Antić, N.; Ferreira, C.S.S.; Spasić, M. Measurement of Water Drop Sizes Generated by a Dripping Rainfall Simulator with Drippers in the Form of Hypodermic Needles. Appl. Sci. 2024, 14, 6969. [Google Scholar] [CrossRef]
- Beczek, M.; Mazur, R.; Beczek, T.; Ryżak, M.; Sochan, A.; Gibała, K.; Bieganowski, A. The Effect of Slope Incline on the Characteristics of Particles Ejected during the Soil Splash Phenomenon. Geoderma 2024, 441, 116757. [Google Scholar] [CrossRef]
- Yakubu, M.L.; Yusop, Z. Adaptability of Rainfall Simulators as a Research Tool on Urban Sealed Surfaces—A Review. Hydrol. Sci. J. 2017, 62, 996–1012. [Google Scholar] [CrossRef]
- Farres, P.J. The Dynamics of Rainsplash Erosion and the Role of Soil Aggregate Stability. Catena 1987, 14, 119–130. [Google Scholar] [CrossRef]
- Bowyer-Bower, T.A.S.; Burt, T.P. Rainfall Simulators for Investigating Soil Response to Rainfall. Soil Technol. 1989, 2, 1–16. [Google Scholar] [CrossRef]
- Wan, Y.; El-Swaify, S.A. Characterizing Interrill Sediment Size by Partitioning Splash and Wash Processes. Soil Sci. Soc. Am. J. 1998, 62, 430–437. [Google Scholar] [CrossRef]
- Böker, J.; Zanzinger, H.; Bastian, M.; Németh, E.; Eppel, J. Surface Erosion Control Investigations for a Test Field on a Steep Embankment of German Autobahn A3. In Proceedings of the EuroGeo5, Valencia, Spain, 16–19 September 2012; pp. 16–19. [Google Scholar]
- Newesely, C.; Leitinger, G.; Zimmerhofer, W.; Kohl, B.; Markart, G.; Tasser, E.; Tappeiner, U. Rain Simulation in Patchy Landscapes: Insights from a Case Study in the Central Alps. Catena 2015, 127, 1–8. [Google Scholar] [CrossRef]
- Koch, T.; Chifflard, P.; Aartsma, P.; Panten, K. A Review of the Characteristics of Rainfall Simulators in Soil Erosion Research Studies. MethodsX 2024, 12, 102506. [Google Scholar] [CrossRef] [PubMed]
- De Lima, J.L.M.P.; Singh, V.P. Laboratory Experiments on the Influence of Storm Movement on Overland Flow. Phys. Chem. Earth 2003, 28, 277–282. [Google Scholar] [CrossRef]
- Grismer, M.E. Standards Vary in Studies Using Rainfall Simulators to Evaluate Erosion. Calif. Agric. 2012, 66, 102–107. [Google Scholar] [CrossRef]
- Wilson, T.G.; Cortis, C.; Montaldo, N.; Albertson, J.D. Development and Testing of a Large, Transportable Rainfall Simulator for Plot-Scale Runoff and Parameter Estimation. Hydrol. Earth Syst. Sci. 2014, 18, 4169–4183. [Google Scholar] [CrossRef]
- McQueen, I.S. Development of a Hand Portable Rainfall-Simulator; U.S. Department of the Interior, Geological Survey: Washington, DC, USA, 1963. [Google Scholar]
- Moore, I.D.; Hirschi, M.C.; Barfield, B.J. Kentucky Rainfall Simulator. Trans. ASAE 1983, 26, 1085–1089. [Google Scholar] [CrossRef]
- Iserloh, T.; Fister, W.; Seeger, M.; Willger, H.; Ries, J.B. A Small Portable Rainfall Simulator for Reproducible Experiments on Soil Erosion. Soil Tillage Res. 2012, 124, 131–137. [Google Scholar] [CrossRef]
- Kiani-Harchegani, M.; Sadeghi, S.H.; Asadi, H. Comparing Grain Size Distribution of Sediment and Original Soil under Raindrop Detachment and Raindrop-Induced and Flow Transport Mechanism. Hydrol. Sci. J. 2018, 63, 312–323. [Google Scholar] [CrossRef]
- Kalehhouei, M.; Sadeghi, S.H.R.; Khaledi Darvishan, A. Changes in Raindrop Properties Due to Wind Blowing Using Image Processing. Catena 2023, 221, 106789. [Google Scholar] [CrossRef]
- Sadeghi, S.H.R.; Abdollahi, Z.; Khaledi Darvishan, A.V. Experimental Comparison of Some Techniques for Estimating Natural Rain Drop Size Distribution in South Coast of the Caspian Sea, Iran. Hydrol. Sci. J. 2013, 58, 1–9. [Google Scholar] [CrossRef]
- Abdollahi, Z.; Sadeghi, S.H.R.; Khaledi Darvishan, A. Detailed Procedure for Outdoor Measurement of Raindrop Size Distribution Using Photogrammetry. J. Hydrol. Hydromech. 2021, 69, 171–179. [Google Scholar] [CrossRef]
- Esteves, M.; Planchon, O.; Lapetite, J.M.; Silvera, N.; Cadet, P. The ‘EMIRE’ Large Rainfall Simulator: Design and Field Testing. Earth Surf. Process. Landf. 2000, 25, 681–690. [Google Scholar] [CrossRef]
- Humphry, J.B.; Daniel, T.C.; Edwards, D.R.; Sharpley, A.N. A Portable Rainfall Simulator for Plot–Scale Runoff Studies. Appl. Eng. Agric. 2002, 18, 199. [Google Scholar] [CrossRef]
- Ricks, M.D.; Horne, M.A.; Faulkner, B.; Zech, W.C.; Fang, X.; Donald, W.N.; Perez, M.A. Design of a Pressurized Rainfall Simulator for Evaluating Performance of Erosion Control Practices. Water 2019, 11, 2386. [Google Scholar] [CrossRef]
- Fernández-Raga, M.; Rodríguez, I.; Caldevilla, P.; Búrdalo, G.; Ortiz, A.; Martínez-García, R. Optimization of a Laboratory Rainfall Simulator to Be Representative of Natural Rainfall. Water 2022, 14, 3831. [Google Scholar] [CrossRef]
- Gavrilović, S. Inženjering o bujičnim tokovima i eroziji [Engineering of Torrential Flows and Erosion]. In Special Issue Časopis Izgradnja [Construction journal]; Časopis Izgradnja [Construction Journal]: Belgrade, Serbia, 1972. (In Serbian) [Google Scholar]
- Milosavljević, K. Jake kiše i pljuskovi u Beogradu [Heavy Rains and Downpours in Belgrade]. In Glasnik Srpskog Geografskog Društva; Sveska XXIX; Naučna knjiga: Belgrade, Serbia, 1949. (In Serbian) [Google Scholar]
- Jevtić, L. Inženjerski Priručnik za Rešavanje Problema iz Oblasti Bujičnih Tokova [Engineering Handbook for Solving Problems in the Field of Flash Floods]; Izdavačko Informativni Centar Studenata (ICS): Belgrade, Serbia, 1978. (In Serbian) [Google Scholar]
- Unkašević, M. Klima Beograda [Climate of Belgrade]; Naučna Knjiga: Belgrade, Serbia, 1994; ISBN 86-23-21126-X. (In Serbian) [Google Scholar]
- Republic Hydrometeorological Institute of Serbia. Available online: https://www.hidmet.gov (accessed on 23 January 2025).
- Assouline, S.; Ben-Hur, M. Effects of rainfall intensity and slope gradient on the dynamics of interrill erosion during soil surface sealing. Catena 2006, 66, 211–220. [Google Scholar] [CrossRef]
- Panagos, P.; Ballabio, C.; Borrelli, P.; Meusburger, K.; Klik, A.; Rousseva, S.; Perčec Tadić, M.; Michaelides, S.; Hrabalíková, M.; Olsen, P.; et al. Rainfall erosivity in Europe. Sci. Total Environ. 2015, 511, 801–814. [Google Scholar] [CrossRef]
- Navas, A.; Alberto, F.; Machín, J.; Galán, A. Design and operation of a rainfall simulator for field studies of runoff and soil erosion. Soil Technol. 1990, 3, 385–397. [Google Scholar] [CrossRef]
- Bentley, W.A. Studies of raindrops and raindrop phenomena. Mon. Weather Rev. 1904, 32, 450–456. [Google Scholar] [CrossRef]
- Kathiravelu, G.; Lucke, T.; Nichols, P. Rain Drop Measurement Techniques: A Review. Water 2016, 8, 29. [Google Scholar] [CrossRef]
- Asseline, J.; Valentin, C. Construction et mise au point d’un infiltromètre à aspersion [Design and Calibration of a Rainfall Infiltrometer]. Les Cahiers de l’ORSTOM. Série Hydrol. (Bond.) 1978, 15, 321–349. Available online: https://horizon.documentation.ird.fr/exl-doc/pleins_textes/pleins_textes_4/hydrologie/14949.pdf (accessed on 4 March 2025). (In French).
- Neff, E.L. Why Rainfall Simulation? In Proceedings of the Rainfall Simulator Workshop, Tucson, AZ, USA, 14–15 January 1985; Society for Range Management: Wichita, KS, USA, 1979. USDA-SEA. [Google Scholar]
- Herngren, L.F. Build-Up and Wash-Off Process Kinetics of PAHs and Heavy Metals on Paved Surfaces Using Simulated Rainfall. Ph.D. Thesis, Queensland University of Technology, Brisbane, Australia, 2005. [Google Scholar]
- Egodawatta, P. Translation of Small-Plot Scale Pollutant Build-Up and Wash-Off Measurements to Urban Catchment Scale. Ph.D. Thesis, Queensland University of Technology, Brisbane, Australia, 2007. [Google Scholar]
- Moazed, H.; Bavi, A.; Boroomand-Nasab, S.; Naseri, A.; Albaji, M. Effects of Climatic and Hydraulic Parameters on Water Uniformity Coefficient in Solid Set Systems. J. Appl. Sci. 2010, 10, 1792–1796. [Google Scholar] [CrossRef]
- Van Boxel, J.H. Numerical Model for the Fall Speed of Rain Drops in a Rainfall Simulator. In Proceedings of the Workshop on Wind and Water Erosion; Gabriels, D., Cornelis, W.M., Eds.; International Centre for Eremology, University of Ghent: Ghent, Belgium, 1997; pp. 77–85. Available online: https://pure.uva.nl/ws/files/2778495/171269_VanBoxel_1998_GENT_ModelFallSpeedRaindrops.pdf (accessed on 4 March 2025).
- Meshesha, D.T.; Tsunekawa, A.; Haregeweyn, N. Influence of Raindrop Size on Rainfall Intensity, Kinetic Energy, and Erosivity in a Sub-Humid Tropical Area: A Case Study in the Northern Highlands of Ethiopia. Theor. Appl. Climatol. 2019, 136, 1221–1231. [Google Scholar] [CrossRef]
- Wischmeier, W.H.; Smith, D.D. Rainfall Energy and Its Relationship to Soil Loss. Trans. Am. Geophys. Union 1958, 39, 285. [Google Scholar] [CrossRef]
- Hudson, N.W. Soil Conservation; Batsford: London, UK, 1971. [Google Scholar]
- Morgan, R.P.C. Soil Erosion and Conservation, 3rd ed.; Blackwell Publishing Ltd.: Carlton, Australia, 2005. [Google Scholar]
- Christiansen, J.E. Irrigation by Sprinkling; California Agricultural Experiment Station Bulletin 670; University of California: Berkeley, CA, USA, 1942; 124p, Available online: https://archive.org/details/irrigationbyspri670chri (accessed on 4 March 2025).
- Rain Bird Services. Home. Available online: https://rainbirdservices.com/ (accessed on 4 March 2025).
- Hunter Irrigation. Pro Adjustable Nozzles. Available online: https://www.hunterirrigation.com/en-metric/irrigation-product/nozzles/pro-adjustable-nozzles (accessed on 4 March 2025).


| Category | Water Consumption | Absolute Water Losses | Relative Water Losses | ||||||||||||||||||||||||||
|---|---|---|---|---|---|---|---|---|---|---|---|---|---|---|---|---|---|---|---|---|---|---|---|---|---|---|---|---|---|
| Designation | V30min | ΔVLA | ΔVLR | ||||||||||||||||||||||||||
| Unit | L | L | % | ||||||||||||||||||||||||||
| Pressure | P | bar | 1.0 | 1.5 | 2.0 | 1.0 | 1.5 | 2.0 | 1.0 | 1.5 | 2.0 | ||||||||||||||||||
| Plot Number | PN | / | 3 | 2 | 1 | 3 | 2 | 1 | 3 | 2 | 1 | 3 | 2 | 1 | 3 | 2 | 1 | 3 | 2 | 1 | 3 | 2 | 1 | 3 | 2 | 1 | 3 | 2 | 1 |
| Nozzle Type | HV10 | 168 | 213 | 264 | 121 | 162 | 198 | 72 | 76 | 75 | |||||||||||||||||||
| HV8 | 102 | 138 | 162 | 63 | 88 | 107 | 62 | 64 | 66 | ||||||||||||||||||||
| V6 | 243 | 306 | 372 | 168 | 223 | 272 | 69 | 73 | 73 | ||||||||||||||||||||
| V4 | 234 | 300 | 357 | 164 | 210 | 250 | 70 | 70 | 70 | ||||||||||||||||||||
| PRO 6A | 222 | 264 | 321 | 184 | 230 | 276 | 83 | 87 | 86 | ||||||||||||||||||||
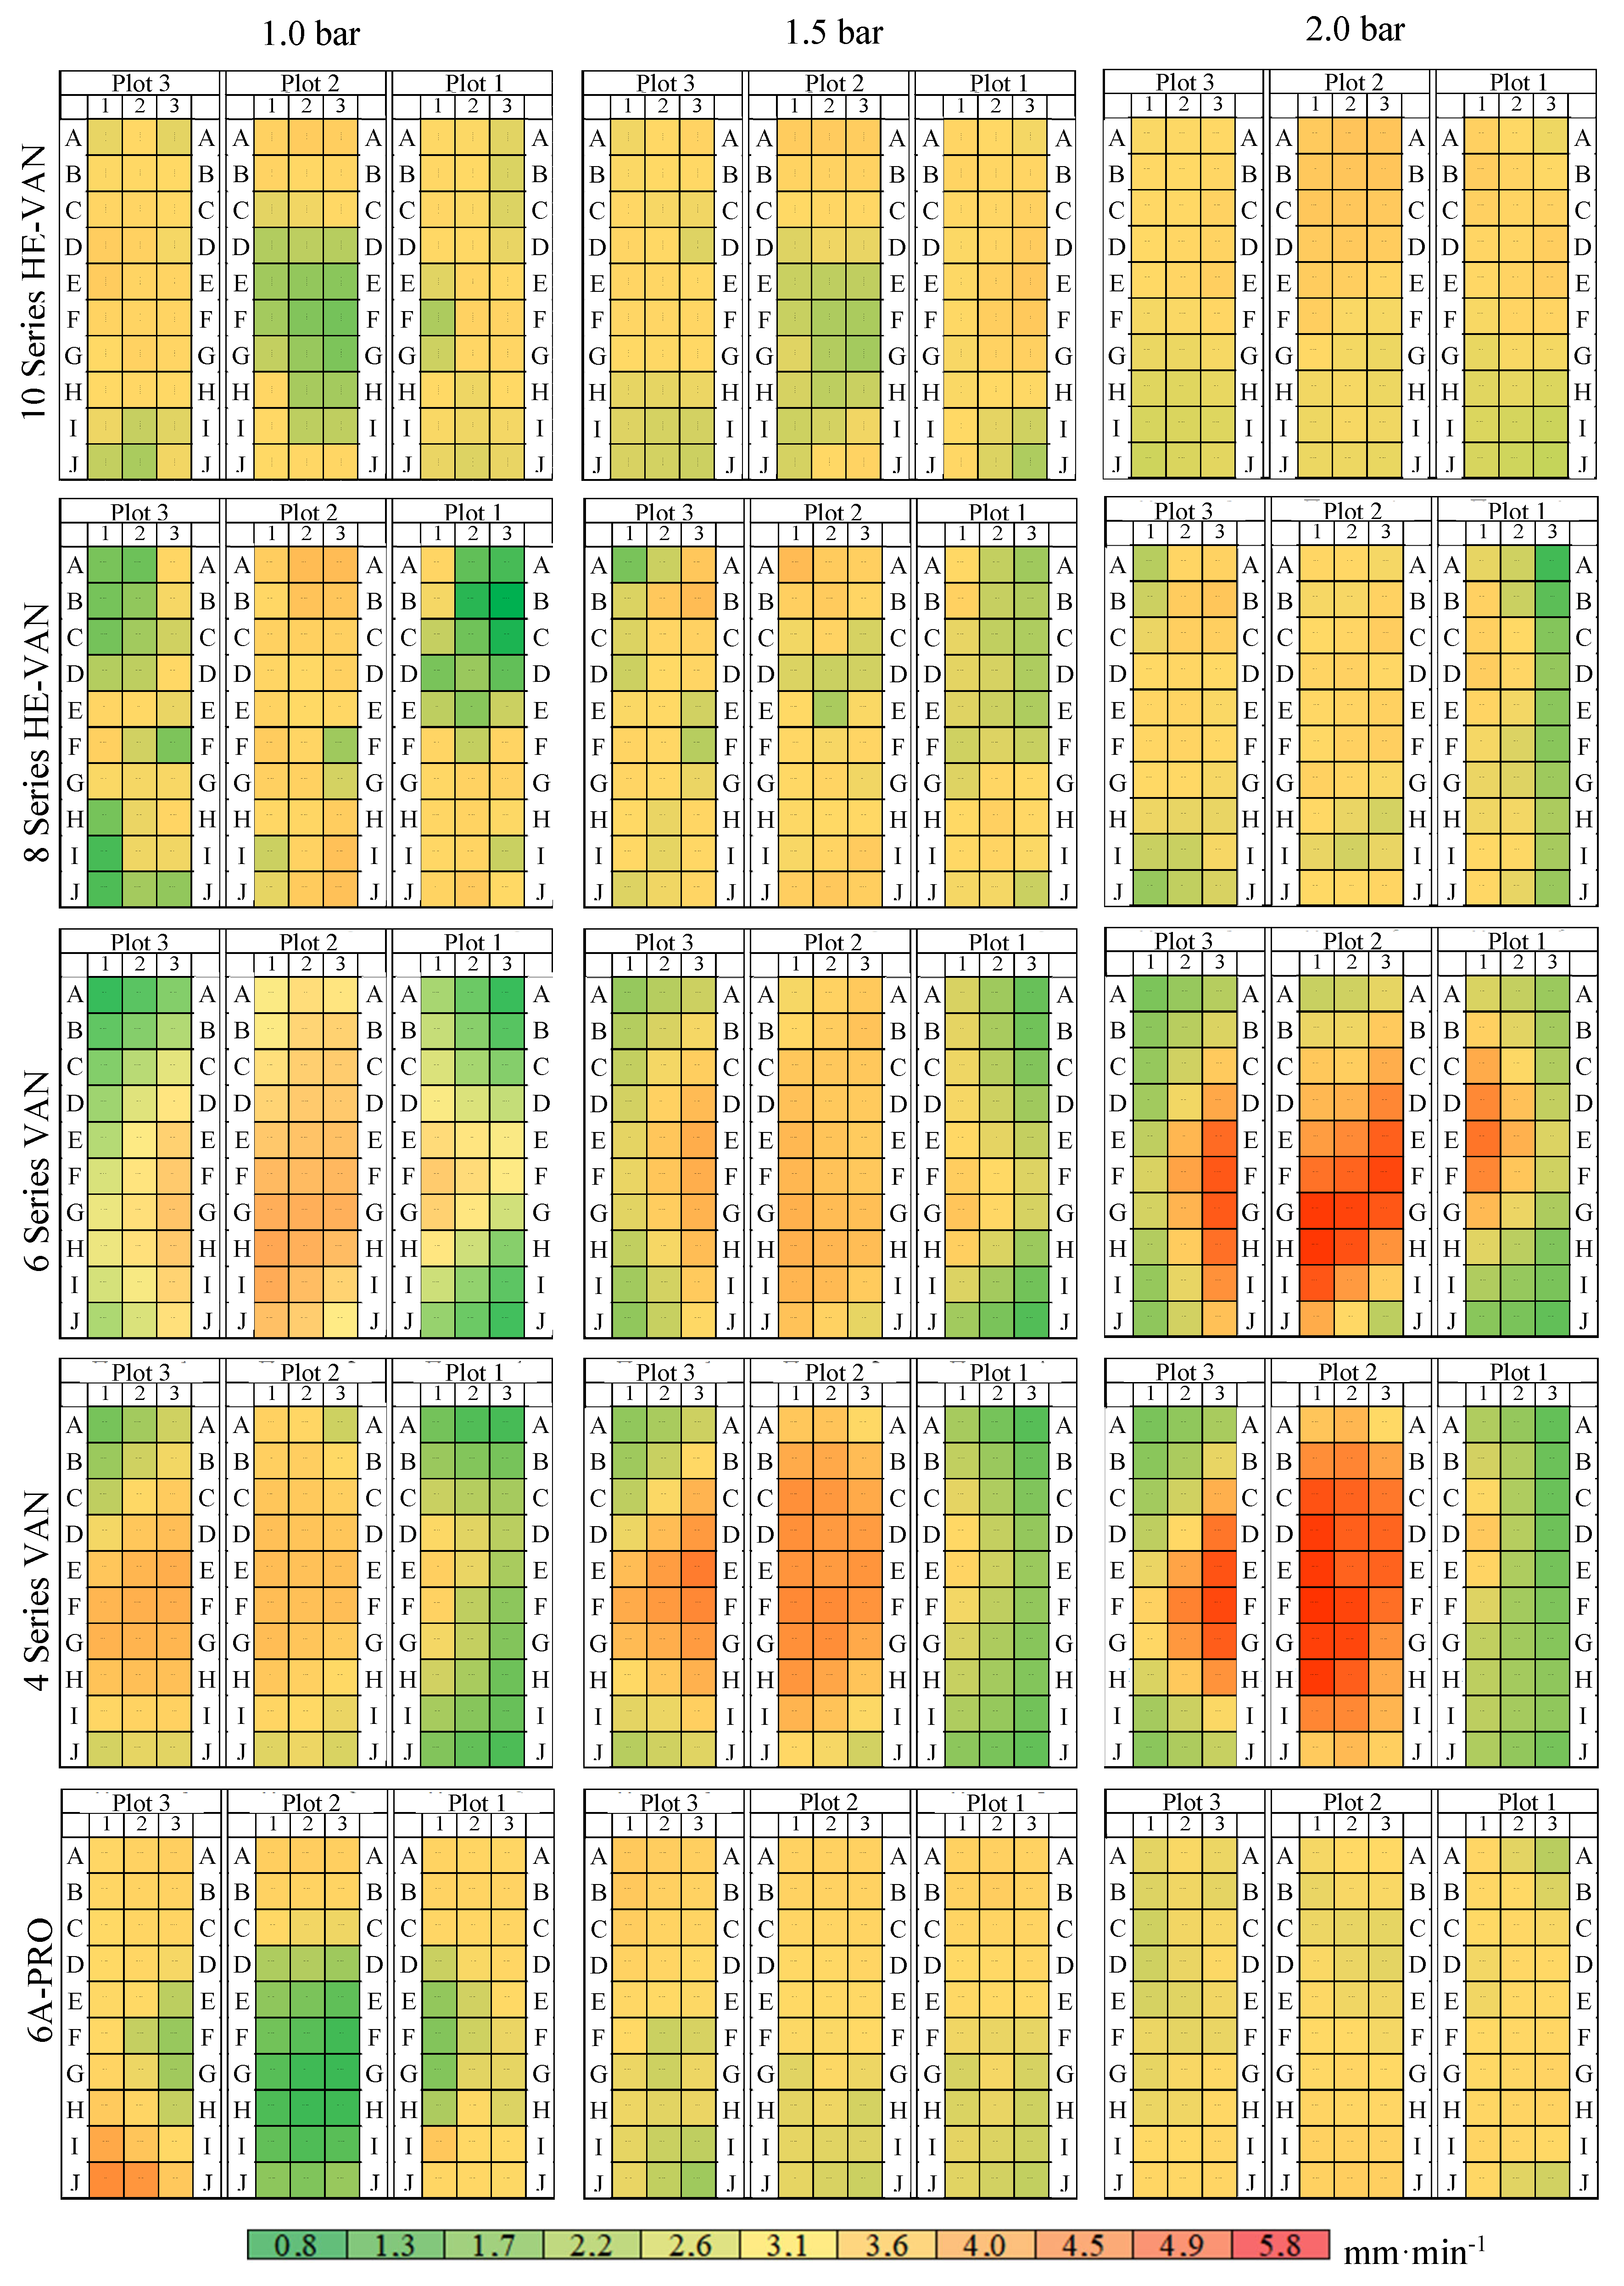
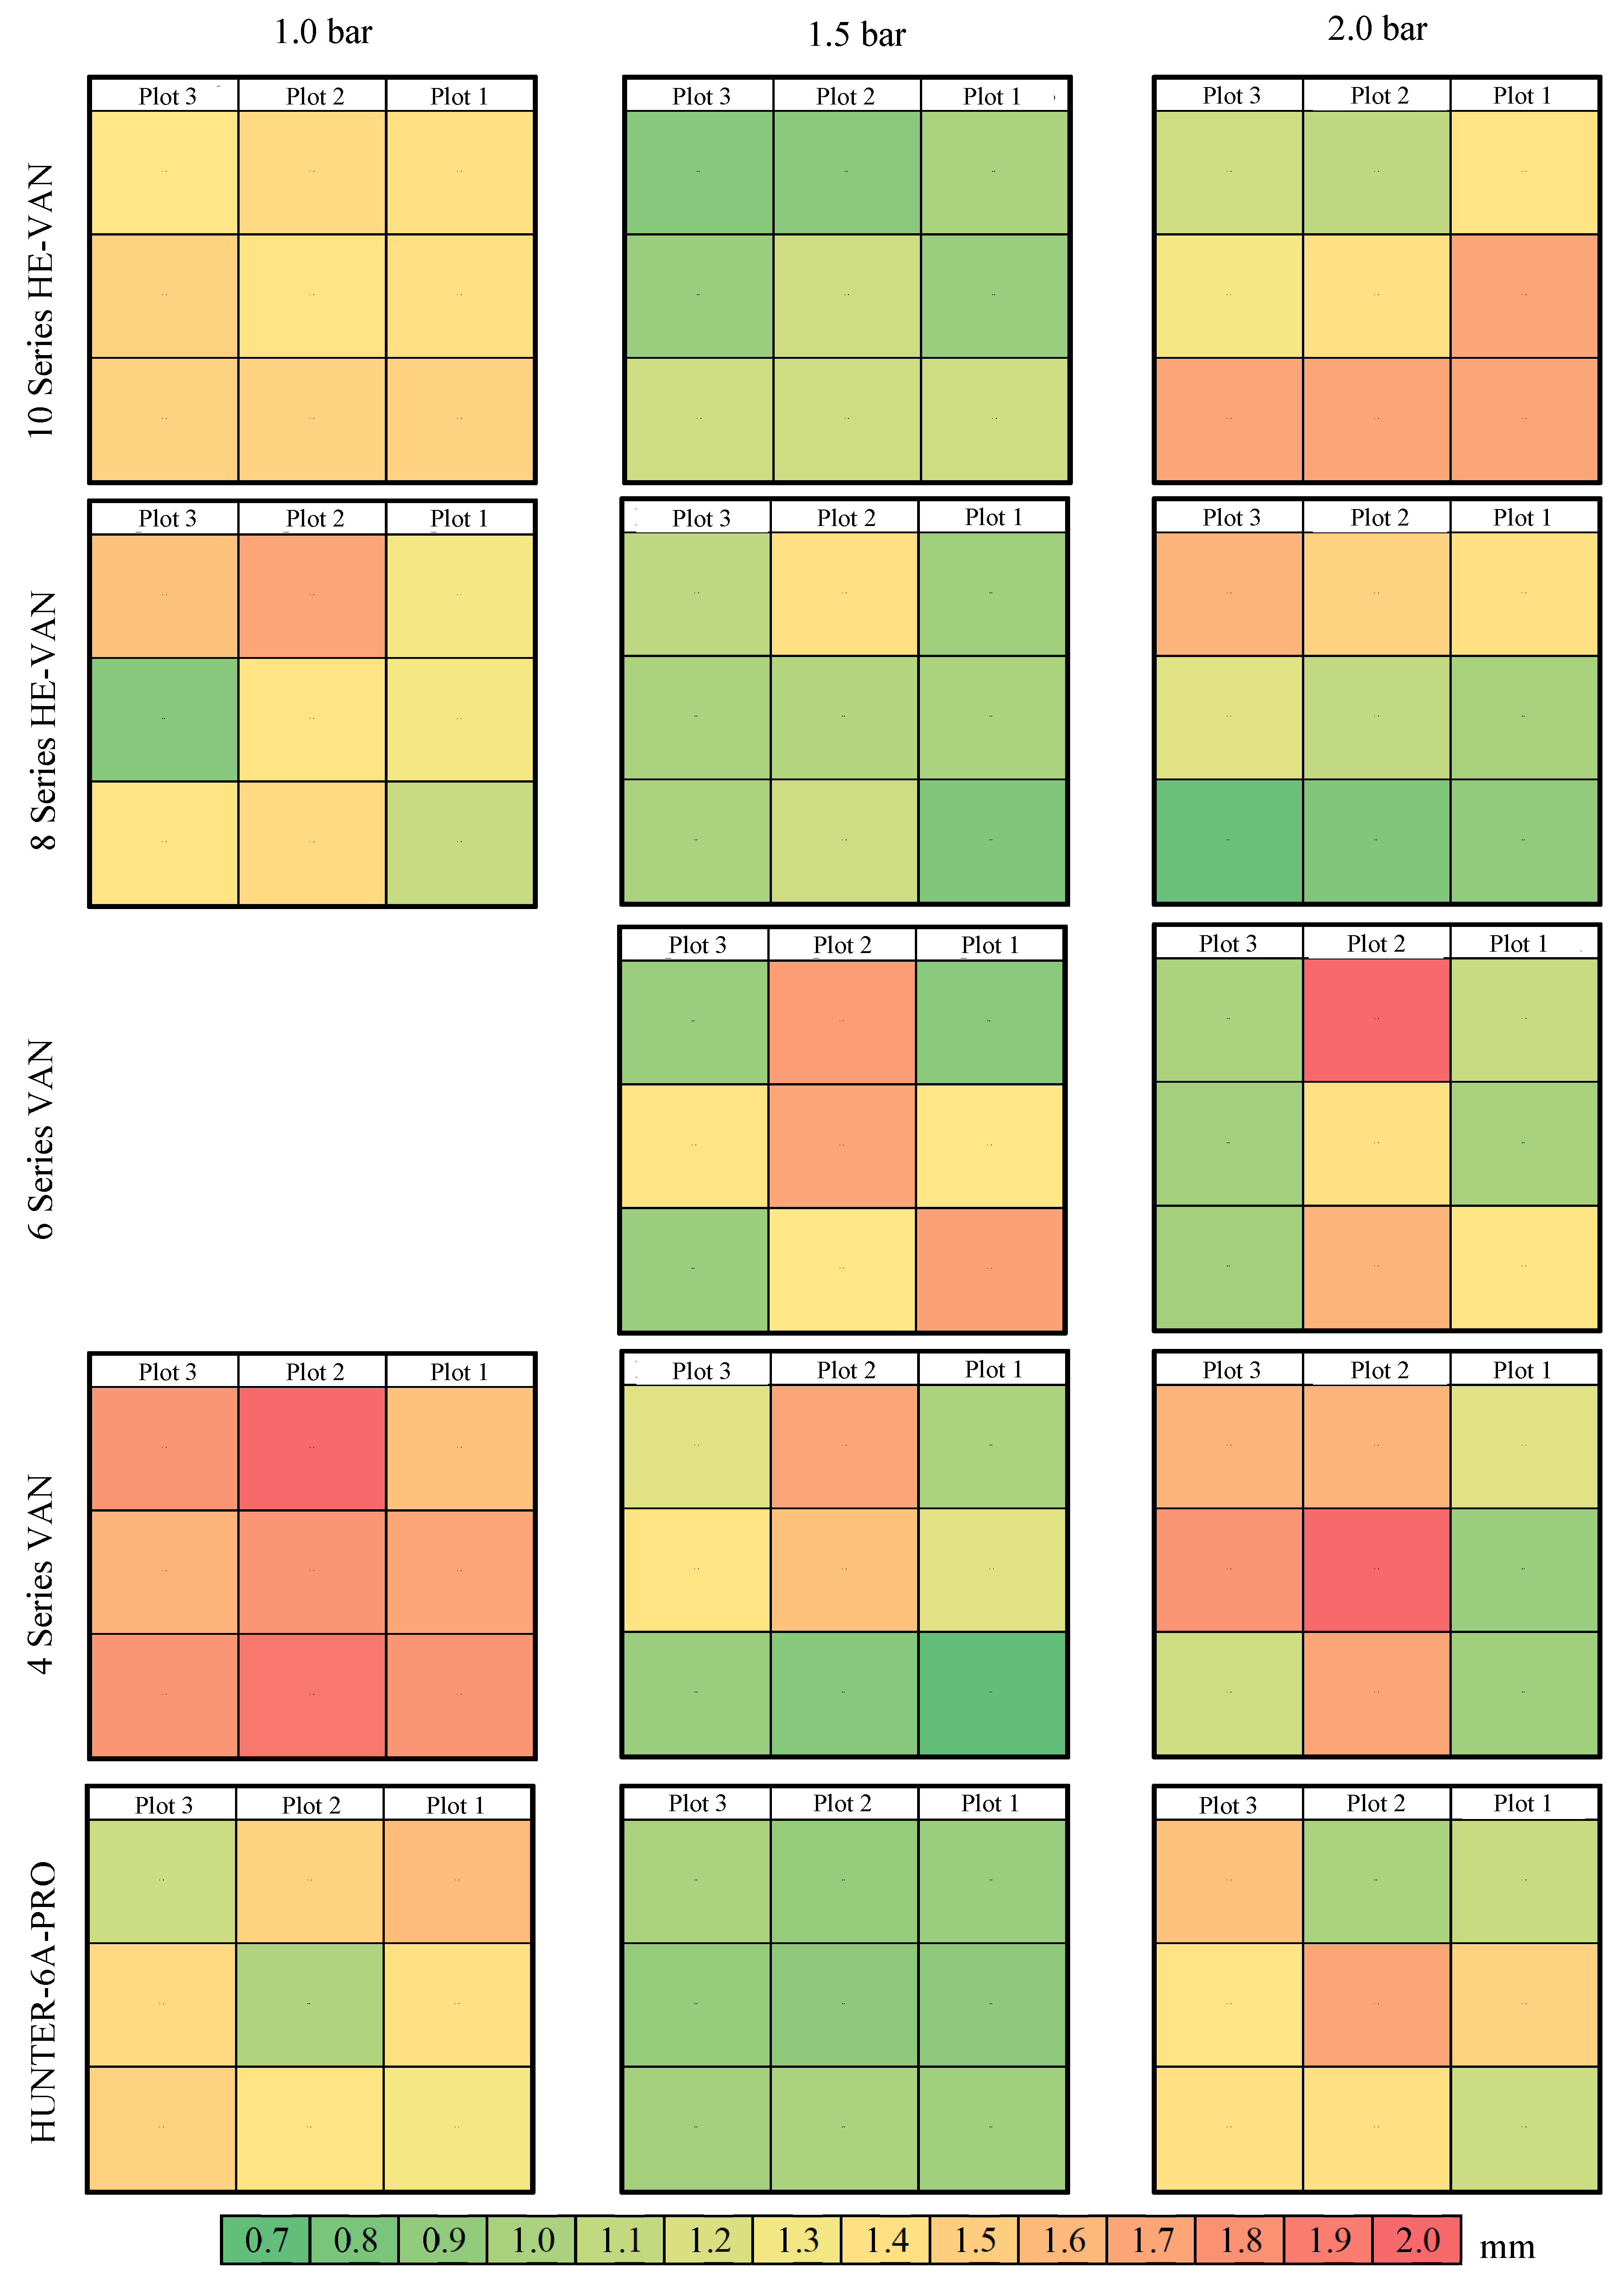
| Category | Rainfall Intensity | Drop Diameter | ||||||||||||||||||
|---|---|---|---|---|---|---|---|---|---|---|---|---|---|---|---|---|---|---|---|---|
| Designation | I | dm50 | ||||||||||||||||||
| Unit | mm·min−1 | mm | ||||||||||||||||||
| Pressure | P | bar | 1.0 | 1.5 | 2.0 | 1.0 | 1.5 | 2.0 | ||||||||||||
| Plot Number | PN | / | 3 | 2 | 1 | 3 | 2 | 1 | 3 | 2 | 1 | 3 | 2 | 1 | 3 | 2 | 1 | 3 | 2 | 1 |
| Nozzle Type | HV10 | 1.6 | 1.5 | 1.7 | 1.9 | 1.7 | 1.8 | 2.3 | 2.5 | 2.3 | 1.2 | 1.2 | 1.3 | 0.9 | 0.9 | 0.9 | 1.5 | 1.5 | 1.2 | |
| HV8 | 1.3 | 1.6 | 1.2 | 1.6 | 1.8 | 1.7 | 2.2 | 2.0 | 1.9 | 1.1 | 1.3 | 1.1 | 0.9 | 1.0 | 0.9 | 1.0 | 1.0 | 1.1 | ||
| V6 | 2.2 | 3.3 | 2.4 | 2.5 | 3.4 | 2.9 | 3.0 | 4.2 | 3.3 | 1.2 | 1.5 | 1.0 | 1.0 | 1.6 | 0.9 | |||||
| V4 | 2.0 | 2.8 | 2.8 | 2.3 | 3.9 | 3.3 | 2.7 | 4.9 | 3.6 | 1.6 | 1.9 | 1.6 | 0.9 | 1.3 | 1.0 | 0.9 | 1.7 | 1.4 | ||
| PRO 6A | 1.3 | 1.2 | 1.5 | 1.2 | 1.2 | 1.2 | 0.8 | 0.8 | 0.8 | 1.3 | 1.1 | 1.2 | 0.8 | 0.9 | 0.9 | 1.1 | 1.2 | 1.3 | ||
| Category | Coefficient of Spatial Uniformity of Rainfall Intensity | Coefficient of Spatial Uniformity of Drop Diameter | ||||||||||||||||||
|---|---|---|---|---|---|---|---|---|---|---|---|---|---|---|---|---|---|---|---|---|
| Designation | CU I | CU dm50 | ||||||||||||||||||
| Unit | % | % | ||||||||||||||||||
| Pressure | P | bar | 1.0 | 1.5 | 2.0 | 1.0 | 1.5 | 2.0 | ||||||||||||
| Plot Number | PN | / | 3 | 2 | 1 | 3 | 2 | 1 | 3 | 2 | 1 | 3 | 2 | 1 | 3 | 2 | 1 | 3 | 2 | 1 |
| Nozzle Type | HV10 | 95 | 88 | 93 | 93 | 90 | 95 | 88 | 90 | 90 | 95 | 97 | 96 | 91 | 91 | 94 | 80 | 81 | 87 | |
| HV8 | 84 | 84 | 90 | 92 | 90 | 91 | 91 | 94 | 90 | 81 | 87 | 95 | 98 | 90 | 95 | 75 | 81 | 84 | ||
| V6 | 80 | 91 | 82 | 83 | 91 | 85 | 79 | 80 | 75 | 85 | 86 | 76 | 99 | 82 | 90 | |||||
| V4 | 84 | 92 | 84 | 86 | 89 | 82 | 86 | 88 | 77 | 95 | 94 | 93 | 89 | 75 | 86 | 81 | 88 | 91 | ||
| PRO 6A | 92 | 85 | 76 | 91 | 93 | 88 | 96 | 94 | 97 | 89 | 87 | 89 | 97 | 96 | 98 | 93 | 80 | 87 | ||
| Category | Absolute Maximum Velocity of a Drop at a Mean Falling Height of 600 mm | Relative Maximum Velocity of a Drop at a Mean Falling Height of 600 mm | ||||||||||||||||||
|---|---|---|---|---|---|---|---|---|---|---|---|---|---|---|---|---|---|---|---|---|
| Designation | vA | vR | ||||||||||||||||||
| Unit | m·s−1 | % | ||||||||||||||||||
| Pressure | P | bar | 1.0 | 1.5 | 2.0 | 1.0 | 1.5 | 2.0 | ||||||||||||
| Plot Number | PN | / | 3 | 2 | 1 | 3 | 2 | 1 | 3 | 2 | 1 | 3 | 2 | 1 | 3 | 2 | 1 | 3 | 2 | 1 |
| Nozzle Type | HV10 | 2.9 | 2.9 | 2.9 | 2.7 | 2.7 | 2.7 | 3.0 | 3.0 | 2.9 | 58 | 62 | 63 | 75 | 73 | 75 | 57 | 57 | 62 | |
| HV8 | 2.8 | 3.0 | 2.9 | 2.6 | 2.8 | 2.7 | 2.8 | 2.8 | 2.9 | 68 | 59 | 66 | 77 | 69 | 74 | 72 | 70 | 68 | ||
| V6 | 2.9 | 3.1 | 2.7 | 2.8 | 3.1 | 2.7 | 64 | 58 | 72 | 70 | 54 | 75 | ||||||||
| V4 | 3.1 | 3.1 | 3.1 | 2.7 | 2.9 | 2.8 | 2.7 | 3.1 | 3.0 | 53 | 49 | 53 | 76 | 61 | 68 | 74 | 52 | 58 | ||
| PRO 6A | 2.9 | 2.9 | 3.0 | 2.6 | 2.6 | 2.6 | 2.8 | 2.9 | 2.9 | 62 | 66 | 66 | 77 | 77 | 76 | 67 | 62 | 62 | ||
| Category | Kinetic Energy of Rainfall | Rainfall Momentum | ||||||||||||||||||
|---|---|---|---|---|---|---|---|---|---|---|---|---|---|---|---|---|---|---|---|---|
| Designation | KE | M | ||||||||||||||||||
| Unit | J·min−1·m−2 | N·m−2 | ||||||||||||||||||
| Pressure | P | bar | 1.0 | 1.5 | 2.0 | 1.0 | 1.5 | 2.0 | ||||||||||||
| Plot Number | PN | / | 3 | 2 | 1 | 3 | 2 | 1 | 3 | 2 | 1 | 3 | 2 | 1 | 3 | 2 | 1 | 3 | 2 | 1 |
| Nozzle Type | HV10 | 0.9 | 0.8 | 0.9 | 0.9 | 0.8 | 0.8 | 1.3 | 1.4 | 1.2 | 0.010 | 0.009 | 0.010 | 0.011 | 0.010 | 0.010 | 0.014 | 0.016 | 0.014 | |
| HV8 | 0.6 | 0.9 | 0.6 | 0.7 | 0.9 | 0.8 | 1.0 | 1.0 | 1.0 | 0.007 | 0.010 | 0.007 | 0.009 | 0.011 | 0.010 | 0.013 | 0.012 | 0.011 | ||
| V6 | 1.3 | 2.1 | 1.4 | 1.5 | 2.5 | 1.5 | 0.015 | 0.022 | 0.017 | 0.017 | 0.027 | 0.018 | ||||||||
| V4 | 1.2 | 1.7 | 1.6 | 1.0 | 2.1 | 1.6 | 1.2 | 2.9 | 2.0 | 0.013 | 0.018 | 0.018 | 0.013 | 0.024 | 0.019 | 0.015 | 0.032 | 0.022 | ||
| PRO 6A | 0.7 | 0.6 | 0.9 | 0.5 | 0.5 | 0.5 | 0.4 | 0.4 | 0.4 | 0.008 | 0.007 | 0.010 | 0.007 | 0.007 | 0.007 | 0.005 | 0.005 | 0.005 | ||
| Category | Water Consumption | Absolute Water Losses | Relative Water Losses | ||||||||||||||||||||||||||
|---|---|---|---|---|---|---|---|---|---|---|---|---|---|---|---|---|---|---|---|---|---|---|---|---|---|---|---|---|---|
| Designation | V30min | ΔVLA | ΔVLR | ||||||||||||||||||||||||||
| Unit | l | l | % | ||||||||||||||||||||||||||
| Pressure | P | bar | 1.0 | 1.5 | 2.0 | 1.0 | 1.5 | 2.0 | 1.0 | 1.5 | 2.0 | ||||||||||||||||||
| Plot Number | PN | / | 3 | 2 | 1 | 3 | 2 | 1 | 3 | 2 | 1 | 3 | 2 | 1 | 3 | 2 | 1 | 3 | 2 | 1 | 3 | 2 | 1 | 3 | 2 | 1 | 3 | 2 | 1 |
| Nozzle Type | HV8 | 102 | 64 | 63 | |||||||||||||||||||||||||
| V6 | 309 | 241 | 78 | ||||||||||||||||||||||||||
| V4 | 231 | 354 | 171 | 262 | 73 | 74 | |||||||||||||||||||||||
| Category | Rainfall Intensity | Coefficient of Spatial Uniformity of Rainfall Intensity | ||||||||||||||||||
|---|---|---|---|---|---|---|---|---|---|---|---|---|---|---|---|---|---|---|---|---|
| Designation | I | CU I | ||||||||||||||||||
| Unit | mm·min−1 | % | ||||||||||||||||||
| Pressure | P | bar | 1.0 | 1.5 | 2.0 | 1.0 | 1.5 | 2.0 | ||||||||||||
| Plot Number | PN | / | 3 | 2 | 1 | 3 | 2 | 1 | 3 | 2 | 1 | 3 | 2 | 1 | 3 | 2 | 1 | 3 | 2 | 1 |
| Nozzle Type | HV8 | 1.4 | 1.5 | 1.5 | 82 | 84 | 79 | |||||||||||||
| V6 | 2.6 | 2.9 | 2.3 | 91 | 90 | 83 | ||||||||||||||
| V4 | 2.5 | 2.7 | 1.8 | 3.7 | 4.6 | 2.3 | 84 | 88 | 85 | 79 | 83 | 84 | ||||||||
| Category | Absolute Maximum Velocity of a Drop at a Mean Falling Height of 470 mm | Relative Maximum Velocity of a Drop at a Mean Falling Height of 470 mm | ||||||||||||||||||
|---|---|---|---|---|---|---|---|---|---|---|---|---|---|---|---|---|---|---|---|---|
| Designation | vA | vR | ||||||||||||||||||
| Unit | m·s−1 | % | ||||||||||||||||||
| Pressure | P | bar | 1.0 | 1.5 | 2.0 | 1.0 | 1.5 | 2.0 | ||||||||||||
| Plot Number | PN | / | 3 | 2 | 1 | 3 | 2 | 1 | 3 | 2 | 1 | 3 | 2 | 1 | 3 | 2 | 1 | 3 | 2 | 1 |
| Nozzle Type | HV8 | 2.6 | 2.7 | 2.6 | 62 | 54 | 60 | |||||||||||||
| V6 | 2.6 | 2.7 | 2.5 | 58 | 51 | 66 | ||||||||||||||
| V4 | 2.8 | 2.8 | 2.8 | 2.5 | 2.8 | 2.7 | 49 | 44 | 48 | 68 | 46 | 52 | ||||||||
| Category | Kinetic Energy of Rainfall | Rainfall Momentum | ||||||||||||||||||
|---|---|---|---|---|---|---|---|---|---|---|---|---|---|---|---|---|---|---|---|---|
| Designation | KE | M | ||||||||||||||||||
| Unit | J·min−1·m−2 | N·m−2 | ||||||||||||||||||
| Pressure | P | bar | 1.0 | 1.5 | 2.0 | 1.0 | 1.5 | 2.0 | ||||||||||||
| Plot Number | PN | / | 3 | 2 | 1 | 3 | 2 | 1 | 3 | 2 | 1 | 3 | 2 | 1 | 3 | 2 | 1 | 3 | 2 | 1 |
| Nozzle Type | HV8 | 0.6 | 0.7 | 0.6 | 0.008 | 0.008 | 0.008 | |||||||||||||
| V6 | 1.1 | 1.3 | 0.9 | 0.014 | 0.016 | 0.012 | ||||||||||||||
| V4 | 1.2 | 1.3 | 0.9 | 1.4 | 2.3 | 1.0 | 0.015 | 0.016 | 0.011 | 0.019 | 0.027 | 0.013 | ||||||||
Disclaimer/Publisher’s Note: The statements, opinions and data contained in all publications are solely those of the individual author(s) and contributor(s) and not of MDPI and/or the editor(s). MDPI and/or the editor(s) disclaim responsibility for any injury to people or property resulting from any ideas, methods, instructions or products referred to in the content. |
© 2025 by the authors. Licensee MDPI, Basel, Switzerland. This article is an open access article distributed under the terms and conditions of the Creative Commons Attribution (CC BY) license (https://creativecommons.org/licenses/by/4.0/).
Share and Cite
Rončević, V.; Živanović, N.; Radulović, L.; Ristić, R.; Sadeghi, S.H.; Fernández-Raga, M.; Prats, S.A. Design, Calibration, and Performance Evaluation of a High-Fidelity Spraying Rainfall Simulator for Soil Erosion Research. Water 2025, 17, 1863. https://doi.org/10.3390/w17131863
Rončević V, Živanović N, Radulović L, Ristić R, Sadeghi SH, Fernández-Raga M, Prats SA. Design, Calibration, and Performance Evaluation of a High-Fidelity Spraying Rainfall Simulator for Soil Erosion Research. Water. 2025; 17(13):1863. https://doi.org/10.3390/w17131863
Chicago/Turabian StyleRončević, Vukašin, Nikola Živanović, Lazar Radulović, Ratko Ristić, Seyed Hamidreza Sadeghi, María Fernández-Raga, and Sergio A. Prats. 2025. "Design, Calibration, and Performance Evaluation of a High-Fidelity Spraying Rainfall Simulator for Soil Erosion Research" Water 17, no. 13: 1863. https://doi.org/10.3390/w17131863
APA StyleRončević, V., Živanović, N., Radulović, L., Ristić, R., Sadeghi, S. H., Fernández-Raga, M., & Prats, S. A. (2025). Design, Calibration, and Performance Evaluation of a High-Fidelity Spraying Rainfall Simulator for Soil Erosion Research. Water, 17(13), 1863. https://doi.org/10.3390/w17131863